


Languages
Pages
Legal


1
Innovation and Scaling of ICT for the Bottom-of-the-Pyramid
Chris Foster and Richard Heeks*
*Corresponding author: Richard Heeks, Centre for Development Informatics, IDPM,
Arthur Lewis Building, University of Manchester, M13 9PL, UK
Phone: +44-161-275-2870; Fax: +44-161-275-2898
Email: [email protected]
Article type: Research article
This is the pre-peer reviewed version of the following article: Foster, C. & Heeks, R.,
Innovation and scaling of ICT for the bottom-of-the-pyramid, Journal of Information
Technology, 28(4), 296-315, 2013, which has been published in final form at:
http://www.palgrave-journals.com/jit/journal/v28/n4/full/jit201319a.html

2
Innovation and Scaling of ICT for the Bottom-of-the-Pyramid
Abstract
Scaling represents successful diffusion that ensures sizeable impact and earnings from
ICT innovations in emerging markets. Practice can still be shaped by dualistic views –
innovation vs. diffusion, pilot vs. scale-up, lead firm vs. other actors, technical vs. social.
Synthesising the literature that challenges these dualities, this paper creates a systemic
perspective that is particularly appropriate for scaling of ICT to bottom-of-the-pyramid
(BoP) markets. That perspective is then instantiated through the case study of a
successfully-scaled ICT innovation that has reached millions of poor consumers: the
Kenyan m-money system, M-Pesa. It finds that scaling of this ICT system can be
understood as a four-stage process of exploratory, incremental then aggressive growth,
followed by (attempted) standardisation.
Throughout these stages of scaling ongoing adaptive innovations have been
fundamental, and have been both necessitated and shaped by the BoP context. These
innovations have been more socio-technical than technical, and have emerged from a
growing variety of actors and locations closer to poor consumers than the lead firm. The
lead firm has buffered the unfamiliarity of BoP markets by approaching them through the
‘middle-of-the-pyramid’ and by intensive learning. At times, its planned ‘shifts’ in scaling
strategy have triggered adaptive innovations. At other times, emergent innovations and
learning lead to incremental ‘drifts’ in lead firm strategy. ICT firms wishing to scale
goods and services for BoP markets must therefore recognise the multi-locational,
continuous and emergent nature of innovation, and develop processes to monitor and
address those innovations.
Keywords: Innovation; scaling; bottom-of-the-pyramid; m-money; m-banking
3
1 INTRODUCTION
There is growing interest in developing products and services that address the
bottom/base-of-the-pyramid (BoP): those 2-3 billion who are the poorest of the world’s
population, and who have traditionally been underserved by the larger firms of the
private sector (Prahalad, 2009)1. The aim is the ‘win-win’ of finding new markets and
new sources of growth and profit for the firm, but also facilitating socio-economic
development among the poor. ICTs have very much been a part of this: a number of
Prahalad’s original examples were ICT-based and recent years have seen a growing
interest of ICT firms in addressing this market (Simon, 2011), and a growing number of
pilot projects which have experimented with ICT innovations within poor communities
(e.g. Kuriyan et al., 2008; Futterman and Shuman, 2010).
Alongside these accounts of pilot projects is other literature that examines the workings
of ICT projects at scale in emerging markets (e.g. Bhatnagar and Singh, 2010;
Leishman, 2010). But this has left a ‘missing middle’ knowledge gap around the process
of scaling: an understanding of how ICT projects in these markets move from pilot to
full-scale; something which many of them fail to do (Heeks, 2008). As Walsham and
Sahay (2006: 17) note: “a key problem remains the issue of scalability . . . the literature
contains very little discussion of how to tackle this important problem”.
Within traditional discussions of scaling, there is sometimes an implicit duality that
moves briskly from pilot (during which innovation is the key process, with the lead firm
responsible) to scaling (during which diffusion is the key process, with other
stakeholders responsible). Other literature from information systems, BoP studies, and
innovation studies – discussed further in Section 2 – starts to move us beyond these
dualities. It recognises different types and strategies of scaling. It identifies the
possibility of steps within the scaling process. And in particular, it recognises an integral
relationship between scaling and innovation; particularly that scaling is necessary for ICT
innovations (as objects) to have broad impact – for example to reach a BoP market, and
1 Prahalad (2009) offers no specific definition of the BoP. He alludes to those who live on less then US$2 per day as being a starting point but argues “there is no single universal definition of the Bottom of the Pyramid that can be useful” (ibid.: 7).

4
that ICT innovation (as an activity) is necessary for scaling to be successfully
undertaken.
But the ‘missing middle’ means there has so far been little detail on these processes,
especially the specifics of commercial scaling of ICT systems for the bottom-of-the-
pyramid. We know little about the dynamics of scaling, about the particular impact of the
BoP context, or about the changing relation between scaling strategy, the process of
scaling, and the nature of innovation within that context. This, therefore, is the purpose
of the current paper. Its aim is to provide detailed analysis of the scaling of one
particular ICT innovation that was successfully targeted at BoP consumers – the case of
M-Pesa in Kenya – and to understand the role played by incremental innovations during
the scaling process.
Of relevance to all those with an interest in ICT innovation in emerging economies, it will
be especially relevant to those concerned with ICT innovation for the BoP. It explains the
different stages that can occur during ICT scaling, and the varying lead firm strategies
associated with those stages. It demonstrates how locus and nature of innovation
change during scaling as a necessary part of addressing the BoP market, and identifies
the changing role and risks for the lead firm which arise in response to necessary growth
of the network of actors involved.
This begins, in Section 2, with an examination of – as noted – three main areas of
literature relevant to ICT innovation and scaling for the bottom-of-the-pyramid.
Synthesising these sources, it constructs a systemic perspective on these processes that
moves beyond dualistic simplicities in relation to the process and nature of innovation,
and to actors’ roles and strategies. But this systemic framework is just a construct from
the literature. Hence, we use an empirical case to instantiate this framework, in order to
provide specific details.
In Section 3, we introduce this as a case from the fast-growing field of ‘m-banking’: the
use of mobile phones to deliver financial services, often those at the BoP who are
‘unbanked’. We select M-Pesa as our case study because of its relative longevity and
success in scaling. It has grown from a pilot in 2006 to a system of 15 million users in

5
2012 – many drawn from poor communities – with more than US$8 billion moving
through the system each year.
Section 4 analyses the trajectory of this ICT innovation into five phases, describing the
shift in focus from middle- to bottom-of-the-pyramid, the growth of M-Pesa’s ‘innofusion
network’ which pushed the locus of innovation away from the lead firm, and subsequent
lead firm developments in seeking to regain control, and also to add further functionality
to the service. Section 5 analyses these phases into a four-stage model, and discusses
the nature of innovation, its impact on scaling strategies, and the role and risks for the
lead firm. The paper ends with conclusions that return back to the key issues about the
nature and strategies for ICT scaling for BoP markets, about the nature and strategies of
ICT innovation for BoP markets, and about the relationship between scaling and
innovation.
2 CONCEPTUALISING ICT SCALING AND INNOVATION
Scaling-of-innovation and innovation-for-scaling are issues of relevance to a number of
areas of research literature. Here we will particularly draw on three: information systems
and the sub-area specifically interested in IS in developing countries; international
development and the sub-area specifically interested in serving BoP markets2; and
innovation studies.3
Especially within the first two bodies of literature, one can find three common, general
messages about scaling – particularly scaling of ICT for emerging markets (Monteiro,
1998; IIRR, 2000; Franzel et al., 2001; Braa et al., 2004; Sahay and Walsham, 2006;
Heeks, 2008):
2 Noting a division between development studies and business-for-development, which sometimes take opposing views on the BoP concept (e.g. Arora and Romijn, 2012). 3 Three areas of literature on scaling were read but, by and large, have not been included here either because there were mainly descriptive, or because they dealt with issues unrelated to scaling ICT innovations for the BoP: - Literature on scaling of health and agro-forestry innovations in developing countries e.g. Uvin et al. (2000), Wambugu et al. (2011), which focusses largely on best practices for NGOs or state actors and/or on the factors which shape scaling but not the process of scaling itself or the role of innovation within scaling. - Literature on scaling of educational innovations (typically in US schools) e.g. Blumenfeld et al. (2000), Elias et al. (2003), which consists mainly of descriptions of specific initiatives with guidance for educational reformers. - Literature on scaling ICT infrastructure e.g. Tomasic et al. (1995), Bolcskei et al. (2006), which focuses from a computer science perspective on technical issues.

6
a) That scaling is important: it ensures greater developmental impact for innovations,
and brings larger revenue streams. ICT innovations typically have network effects: the
greater the scale, the greater the benefits to users; but also critical mass/”chicken-and-
egg” effects: they need to reach a large-enough scale to achieve scale economies, and
for other users and distributors to be aware of the innovation, and to be motivated to
adopt it (Mas and Radcliffe, 2010).
b) That scaling is challenging and problematic, with cases of ICT innovations that have
failed to scale in emerging markets.
c) That research specifically focused on the topic of scaling is rare, with a significant
identified knowledge gap on the issue: that being a key impetus behind this current
paper.
Reiterating this last issue, work specifically on scaling of ICTs for emerging markets is
lacking. More generally, research using the term ‘scaling’ is relatively rare but it is
arguable that ‘scaling’ and ‘diffusion’ are closely-related if not synonymous, and that we
should begin investigation of scaling by drawing on work on diffusion of innovations.
Before doing this, though, we clarify our own usage that (successful) scaling is a
particular type of diffusion; in which a new technology that has been piloted
subsequently reaches a large and differentiated user group over a multi-year period4.
Schumpeter (e.g. 1939) is often credited as the origin of the idea that innovation is a
core source of economic development for both firms and societies. But he also helped
found the notion of dualities within innovation studies: in his case between invention
(creation of a new idea) vs. innovation (its application to products and processes)
(Schumpeter, 1947). Some also see in his work a further – albeit implicit – distinction
between these processes and ‘diffusion’ (spread of those products/processes); a
distinction reinforced by Rogers’ (e.g. 1962) seminal work which largely separates out
innovation processes and responsibilities from diffusion processes and responsibilities.
The dualistic perspective remains a powerful one informing both research and practice.
For example, some literature on ICT scaling and on scaling for the BoP – including
advisory material guiding firms – adopts a simple and dualistic model (e.g. Magnette and
4 Note we are not including “roll-out” within this discussion of scaling: the implementation of a large-scale IS, such as an enterprise system, within a single organisation (e.g. Holland and Light, 1999).
7
Lock, 2005; Qiu, 2007; Davidson and Leishman, 2010; World Bank, 2011). It divides
scaling into two stages: pilot and scale-up. Piloting is associated with innovation, scale-
up with diffusion. Roles are clearly differentiated: the lead firm is responsible for
innovation, other stakeholders are not.
As we will argue below, other literature already exists to challenge each of these
dualisms but the investigative analysis of what, exactly, should be put in their place has
been very limited; particularly when considering the scaling of ICT innovations for
emerging markets such as the bottom-of-the-pyramid.
Our investigative contribution therefore has two parts. First, in the remainder of this
section, we use existing – albeit disparate – literature to build a more nuanced model of
scaling ICT innovation for emerging markets, discussed in terms of four components:
processes, roles and relations, the nature of innovation, and organisational strategy5.
Second, we apply and assess that model in light of a real-world case study.
2.1 Processes
At its bluntest, there is an assumption that scaling and innovation as processes are
separate (Smits et al., 2007). It is the pilot stage during which innovation occurs,
delivering an artefact which is subsequently scaled through a process of diffusion
(Hartmann and Linn, 2008). That this assumption is often false has been demonstrated
generally. For example, later editions of Rogers’ key work (e.g. 2003:115) note the
belated recognition that “re-invention” occurs during diffusion as technologies are
“modified to suit the individual’s particular situation”.6
This is especially likely to be needed when delivering ICT to bottom-of-the-pyramid
markets. One characteristic of this particular context is the significant “distance” in many
senses between the designers of new ICT systems and those in poor communities in
developing countries, leading to a poor fit between initial designs and contexts of use
5 These four components were selected because they were found as common elements relating to scaling ICT for the BoP that emerged from all three of the bodies of literature surveyed. We recognise that they represent a particular perspective on scaling and innovation, and that there are other aspects – the nature of communication and marketing, the role of trust and social capital, the ethics of serving BoP markets, the nature of different adopter cohorts, the role of power relations between innovation stakeholders, etc – which could form the basis for research on this topic. 6 He associates this activity mainly with users but, as will be argued below, innovation during diffusion may be undertaken by a wide variety of actors.

8
(Heeks, 2002). A second characteristic is the heterogeneity of consumer groups within
these markets, so that a design for one group may not fit the needs and context of other
groups (Nakata and Weidner, 2012; Prahalad, 2012)
Both characteristics create an imperative for innovations – what, drawing on information
systems studies we may call ‘adaptation’, ‘improvisation’, or ‘bricolage’ (e.g. Ciborra,
1999; Tjornehoj and Mathiassen, 2010) – which address specific local resource
availabilities, ICT capabilities, working practices, culture, etc (Jacucci et al., 2006).
In part from this also emerges the notion that scaling is not a monolithic activity. Rogers’
(2003) S-curve of diffusion gives a hint of this, and there are examples from work on
information systems in developing countries which demonstrate that scaling is not a
uniform, homogenised process and may consist of steps or phases (e.g. Braa et al.,
2004; Sahay and Walsham, 2006). However, there is little sense of what those steps or
phases might be.
2.2 Roles and relations
Because of the need to bridge the distance, noted above, between innovators and
consumers when serving BoP markets, there is work that challenges the dualistic view
that the lead firm will take sole responsibility for innovation. For example, during the
pilot phase or the early stages of scaling there may be “co-invention”, in which the lead
firm engages in partnership with local stakeholders in a process of learning and
modification (i.e. in a process of innovation) that creates a new product or service
(London and Hart, 2004).
This literature also highlights the importance of partnerships and networks during the
later stages of scaling. For example, most models of scaling innovations for the BoP
recognise the role of a network of agents, who take responsibility for close and often
interpersonal interactions with the end users of the innovation (Anderson and Kupp,
2008, Ramani et al., 2012). However, those agents are generally seen as passive
distributors of the product or service: a channel rather than an actor, and without
responsibilities for innovation.

9
The insufficiency of such a view is readily recognised, with evidence from the scaling of
ICT systems that agents are active innovators (Sahay and Walsham, 2006). This has,
indeed, been recognised in some of the more recent BoP literature though without, as
yet, a detailed analysis of the nature of innovations undertaken by these lower-level
actors (e.g. Simanis and Hart, 2009).
For the BoP, such analysis would need to move beyond the shared innovation models
found in some co-invention/co-creation literature and practice, which finds lead firms
working with just a few key partner innovators (Dahan et al., 2010; Kolk et al., 2010;
Sarker et al., 2012). Agents are so multitudinous – forming the “atomised distribution”
model essential to serving BoP markets (Nakata and Weidner, 2012) – that an
innovation network rather than innovation partnership will need to be envisaged.
This is a view consistent with ‘systems of innovation’ models and literature. These see
innovation as deriving from the interactive behaviour of multiple distributed actors – lead
firms, distributors, users, policy makers, and others – who are all connected (Freeman,
1995). Such system approaches have been applied in emerging markets (Lundvall et al.,
2009a; Lundvall and Intarakumnerd, 2006). In such settings, innovation systems tend to
be less well defined and formally outlined than might be the case in developed countries.
Innovation in lower-income contexts is conceptualised as emerging from the “doing,
using and interacting” of a loose constellation of actors, interacting in evolving –
sometimes informal and interpersonal – relationships (Lundvall et al., 2009b).
We should thus utilise the idea of a relatively fluid innovation system in understanding
ICT innovation for BoP markets. However, the term ‘innovation system’ can still create
the mistaken impression of a separation between this network of actors and the process
of scaling that leads to wide diffusion and adoption of the ICT system. We therefore draw
on Fleck’s (1993) resolution to this issue, which is the neologism “innofusion”; used to
recognise the continuity of innovation during the diffusion (e.g. scaling) of a technology.
We will also use the term ‘network’ rather than ‘system’ to avoid confusion with
discussion of the ICT system7.
7 One can see this as equivalent to Prahalad’s (2012) notion of an “ecosystem” of multiple actors that enables innovation and distribution for the BoP.

10
2.3 The nature of innovation
Traditional views have associated innovation with technical change that produces new or
modified artefacts (Antonelli, 2007). Separately, diffusion of new technologies was also
seen to require innovation (though not explicitly using this label) of business processes
and structures e.g. those associated with sales and marketing (Rogers, 2003). This type
of social innovation has been given particular weight in relation to serving BoP markets;
seen as requiring new business practices (Mair and Schoen, 2007; Pitta et al., 2008).
But this latter advice has often run ahead of reality. Thus, large ICT firms with interests
in the bottom-of-the-pyramid have been criticised for focusing only on technical
innovation and for ignoring what are argued to be the more important innovations
around distribution, service delivery, etc (Anderson and Kupp, 2008). This might derive
from their technical perspective on ICT, which would see the ICT as an artefact that was
separable from its designers, implementers, users and their activities and context.
This is the “tool view” of information systems, which has been challenged by the
“ensemble view” (Orlikowski and Iacono, 2001). The latter sees an ICT system as a
socio-technical network of technology, people, processes, organisational arrangements,
etc. From this, we can see that the innovations necessary to scale up an ICT system will
not just be technical change or even separately-considered technical and social changes.
Instead, a systemic view is needed that encompasses socio-technical changes that may
be required to any one of the ensemble of components that make up the full system
(Sahay and Walsham, 2006).8
2.4 Organisational strategy
Within the BoP literature, there is a strong emphasis on recommendations for business.
Some of these are quite specific management prescriptions; some are lists of enabling or
constraining factors to be taken into account, but there is also discussion of business
strategy: normally interpreted as the high-level, centralised decisions and direction that
the lead firm is advised to adopt.
8 Again, this is something which emerges in later BoP writing: “This shift in emphasis forces us to move from a product-centric approach to a focus on business model innovation, of which the product is but a subset. Systems thinking is a prerequisite for success in BOP markets.” (Prahalad, 2012:11).
11
One aspect of this is market focus, with emerging markets separated into middle-of-the-
pyramid (MoP) and bottom-of-the-pyramid.9 Firms which have been serving high-income
markets are seen to require radically different strategies and business models in order to
serve the BoP (Anderson and Kupp, 2008). By contrast, the MoP is seen to necessitate
only incremental adaptation of existing business models. So firms may choose an MoP
focus because they find the disruptive innovations and business models necessary to
serve the BoP are beyond their present capabilities of skill, knowledge, business
structure, etc (London and Hart, 2004). But they may also find the BoP to be ‘beyond’
their business interests – large ICT firms sometimes appear equivocal about opening up
the BoP market, seeing it more as a threat to existing custom than as an opportunity
(Anderson and Kupp, 2008; Prahalad, 2009).
Those firms which do choose to target the bottom-of-the-pyramid might adopt one of
two scaling strategies (London, 2009). In the learning-oriented model, firms work at
scale but are less driven by profitability. Instead, their aim is to work with local partners,
testing elements of their BoP business model and learning from the partners. In the
growth-oriented model, the firm’s prime goal is to generate profits from enacting a fully-
formed, new BoP business model; albeit on in which external partnerships are still vital.
But this view on organisational strategy is rather compartmentalised and static. In
practice we see there is the possibility for transition. This could be a transition from
serving the MoP to serving the BoP (Anderson, 2008). But it could also be the reverse,
with ICT firms abandoning scaled innovations for the BoP and ‘retreating’ to MoP
markets if net income falls (Qiu, 2007).
The view also sees strategy as something planned, top-down and within the control of
the lead firm. Yet that runs counter to the picture of ICT scaling for BoP markets outlined
above (IIRR, 2000; Sahay and Walsham, 2006). As an ICT system scales, the
innovations necessary for that scaling will create a continuously-changing context for the
lead firm. That ICT system will grow not just in size but also in complexity, creating
unanticipated effects. And the growing complexity of the innofusion network will create
increasing and more varied loci at which innovation may occur. This is especially likely
9 Prahalad (2009:7) defines the MoP as those earning “[US]$2-13 [per day] at 2005 Purchasing Power Parity prices”.

12
when scaling for the BoP, given the necessary devolution of responsibilities to ‘frontline’
actors (Prahalad, 2009).
This means any intentional ‘shifts’ in strategy from the lead firm may be rejected,
adapted or subverted by other actors within the innofusion network (Edquist, 1997). It
also means there will be pressure on strategy to react to the emergent innovations that
arise from outside the lead firm. These, too, may be rejected or adapted but – if
successful – they will lead to ‘drifts’ in strategy: emergent and reactive changes during
the process of scaling. One can speculate that such drifts may increase as scaling for the
BoP takes place, and as the number of non-lead-firm actors increases. Any initial notion
of a one-way ‘broadcast’ of strategy may therefore give way to a more complex two-way
or multi-way flow and formation of strategy.
2.5 Summary
Dualistic perspectives have been a traditional foundation in the conceptualisation of
innovation, of scaling, of ICT systems, and of serving BoP markets. Those
conceptualisations are our starting point because they still shape the actions of firms
delivering ICT to these markets.
Yet more recent literature has emerged – from information systems, from BoP studies,
from innovation studies – challenging the dualisms and producing a more complex,
systemic view. That latter view can be constructed into a whole from the strands of
literature reviewed above, as summarised in Table 1 and Figure 1. However, this is just
a construction; a generic and abstract perspective built from different fractions of
research literature but within which the specifics – the actual phases of scaling, the
nature of and responsibility for innovations during scaling, the exact relation between
scaling and innovation, etc – have yet to be properly instantiated and understood.
13
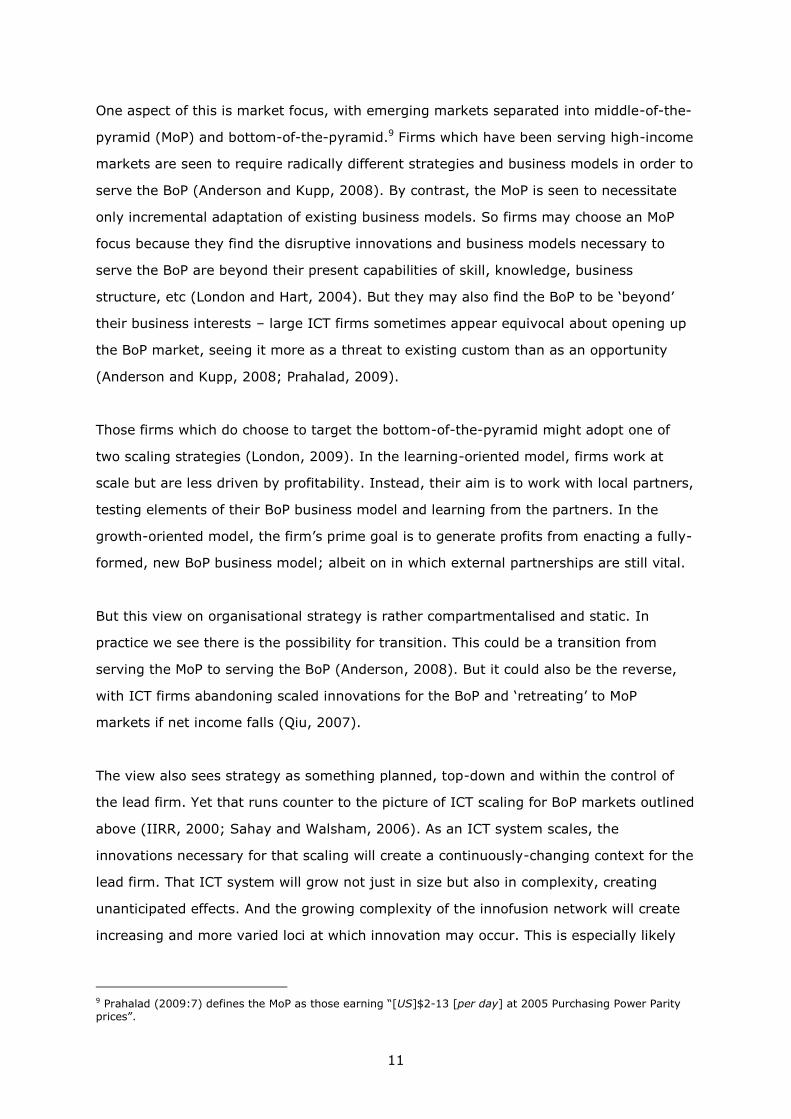
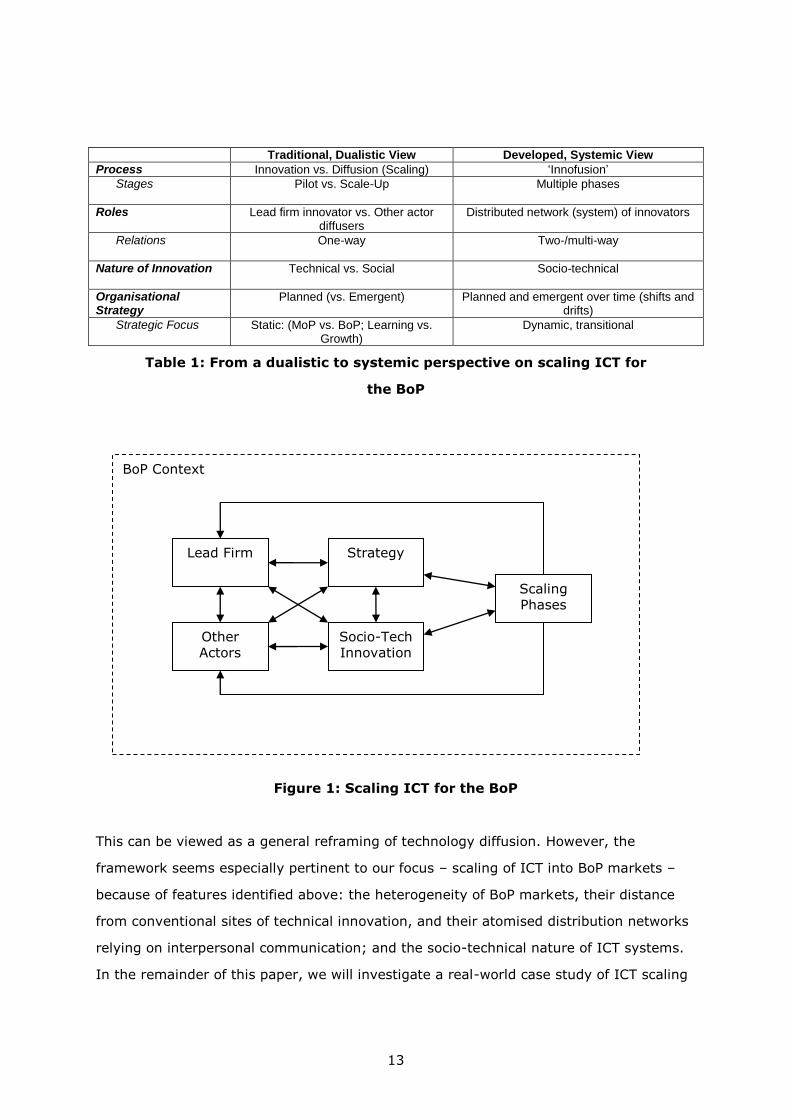
Traditional, Dualistic View Developed, Systemic View
Process Innovation vs. Diffusion (Scaling) ‘Innofusion’
Stages
Pilot vs. Scale-Up Multiple phases
Roles Lead firm innovator vs. Other actor diffusers
Distributed network (system) of innovators
Relations
One-way Two-/multi-way
Nature of Innovation
Technical vs. Social Socio-technical
Organisational Strategy
Planned (vs. Emergent) Planned and emergent over time (shifts and drifts)
Strategic Focus Static: (MoP vs. BoP; Learning vs. Growth)
Dynamic, transitional
Table 1: From a dualistic to systemic perspective on scaling ICT for
the BoP
Figure 1: Scaling ICT for the BoP
This can be viewed as a general reframing of technology diffusion. However, the
framework seems especially pertinent to our focus – scaling of ICT into BoP markets –
because of features identified above: the heterogeneity of BoP markets, their distance
from conventional sites of technical innovation, and their atomised distribution networks
relying on interpersonal communication; and the socio-technical nature of ICT systems.
In the remainder of this paper, we will investigate a real-world case study of ICT scaling
BoP Context
Scaling Phases
Lead Firm
Other Actors
Strategy
Socio-Tech Innovation

14
for BoP markets in order to assess the relevance of this framework, and to provide more
concrete details about elements which have to date mainly been hypothesised.
3 INVESTIGATING ICT SCALING AND INNOVATION
3.1 Case selection
We decided to select an ‘m-banking’ case study; that is, one seeking to make use of
mobile phones to enable financial transactions and services of the type typically provided
by a bank. Across the developing world, “An estimated 2.5 billion adults lack access to
basic formal financial services” (Mas and Radcliffe, 2010: 1). Given that many of these
“unbanked” people do have access to a mobile phone, m-banking is seen as a compelling
innovation for the BoP that can help the poor have greater, safer access to finance,
credit and savings (Duncombe and Boateng, 2009). More generally, m-banking is in
demand in emerging markets as consumers want quick, easy access to financial services
while on the move.
There is a pressing need to understand the scaling of m-banking because so many
initiatives have been – and are being – launched across the developing world.10 Yet the
main focus for m-banking research has been identification of financial needs and of
effective technical and organisational and regulatory designs, mapping user adoption
patterns, and assessing impact (ibid.). Little, if any, research has specifically analysed
the scaling process of this ICT innovation. Within the m-banking literature, there are
echoes of some of the points raised above – the need to scale, and the importance of
agents and lead firm strategy (e.g. Davidson and Leishman, 2010; Mas and Radcliffe,
2010). But in other echoes, there are dualistic assumptions about pilot and scale-up
which characterise lead firms as innovators and agents as diffusers (Leishman, 2010a;
Flaming et al., 2011).
Our selection of m-banking scaling therefore addresses an issue identified as important
but also as lacking research, which can illustrate innovation and scaling. In order to
10 Mas and Radcliffe (2010), writing in late 2010, identify 72 m-banking deployments across 42 developing countries recorded by the GSMA’s “Deployment Tracker”. 24 months later, in late 2012, the Tracker showed 140 deployments in 68 countries, particularly in the developing and emerging economies of Africa and the Asia-Pacific region, with a further 104 deployments planned (GSMA, 2012).

15
operationalise this, we selected the case of M-Pesa, an m-money service in Kenya.11 M-
Pesa provides a well-documented example of an already-scaled ICT innovation. From
initial rollout in 2007, it has rapidly grown to 15 million customers with full national
coverage in 2012 (Safaricom, 2012c)12. It has successfully scaled to less-affluent groups,
with considerable reach into the BoP (Jack and Suri, 2010). It is therefore an appropriate
choice to help instantiate the constructs developed in the previous section.
3.2 Case outline
M-Pesa is a fully-licensed mobile money service run by Kenya’s leading mobile operator,
Safaricom with two core functionalities: conversion and transfer. Customers register to
set up an M-Pesa account. They can then convert between e-cash and real cash:
depositing real cash to load their M-Pesa account, or withdrawing cash from their
account. Registration and conversion services are typically provided by mobile-money
“agents”: independently-owned but officially-sanctioned kiosks or stores. Agents charge
small commissions on all transactions undertaken with them, and their work is facilitated
by specialised SIM cards which are loaded into their phones. As of mid-2012, M-Pesa had
around 37,000 agents in Kenya (Safaricom, 2012c). M-Pesa customers can also transfer
e-cash from their account to another by sending an SMS containing the recipient’s
mobile number (which is also their M-Pesa account ID) and the amount; again, with a
small charge levied. They might use this to send money to family members or friends, or
to pay a provider – anyone from a taxi driver to a local school – for goods and services.
On the policy side, the service is overseen by the Central Bank of Kenya, as a ‘non-
banking financial service’. This means that while it is not subject to the tight regulatory
oversight of banks, the financial nature of the business leads to some central oversight
(AFI, 2010).
11 There are no universally-used definitions, but we can see applications of increasing scope: ‘m-transfers’ as use of mobiles to transfer money from one device to another; ‘m-money’ as use of mobiles for money payments and transfers including to and from bank accounts; and ‘m-banking’ as the use of mobiles to access a fuller range of banking services. 12 Statistics suggest that around 75% of Kenya’s adult population are registered with M-Pesa, with Ksh56bn (US$650m, £410m) moving in the system on a monthly basis by mid-2012 (equivalent to one quarter of total GDP); a figure growing by c.40% per annum (CCK, 2012).
16
3.3 Methods
In order to analyse this case we principally utilise a qualitative approach based on
primary and secondary data. We draw on interviews with actors within the innofusion
network; i.e. those involved in the scaling (diffusion and operation) of M-Pesa, who also
undertake innovations to assist the scaling process. We also take advantage of the
growing secondary evidence available to examine the history and performance of this
ICT innovation.
In terms of primary data, 45 interviews were undertaken from February to May 2011
with a number of actors directly related to M-Pesa: service operation managers (2),
operational employees (18), dealers (5), agents (14), and other system actors including
competitors (6). The focus for the interviews was to understand the diffusion and
operation of M-Pesa that underpinned scaling, and particularly to understand the actors’
role in ongoing processes of innovation. Given the interest in ICT innovation for poor
consumers, there was a focus on stakeholders operating in areas frequented by more
marginal groups. These included informal trading centres and markets close to slum
areas around the capital Nairobi. Semi-structured interviews were conducted in the place
of work, with questions revolving around innovation and the histories of these actors.
Typically interviews lasted for around one hour, and there was also time to observe actor
practices. In addition a further nine interviews were undertaken with policy makers and
contractors previously involved with the service in order to triangulate data sources and
cross-check findings.
Given the longitudinal perspective required when studying the scaling of a technology, at
least equal weight as a source of data was given to the extensive documentation that is
available on M-Pesa. In particular, we have drawn upon existing research and also
reports, proposals, a patent, and publicly-available statistics. Both primary and
secondary data are used together in the account of scaling and innovation that follows,
the one set triangulating with the other.
4 FINDINGS
Analysis of data suggests that the scaling of M-Pesa can be analysed into five phases.
The phases do not – as Figure 2 might suggest – have instantaneous start and end

17
points, but they can be differentiated on the basis of three main elements: the content
and focus of lead firm strategic actions; the structural relations of key stakeholders
involved in the initiative’s network; and statistical indicators of scale (Figure 2 shows
percentage of Safaricom revenue from M-Pesa and monthly growth in local agents).
Figure 2: Scaling phases of M-Pesa
Authors’ calculations adapted from Safaricom (2011), Safaricom (2012a)13
From initial concept in late 2003, M-Pesa began as a pilot mainly focussing on ICT
support for micro-finance initiatives. Following the pilot, the direction changed and early
incremental rollout can be seen associated with a middle-of-the-pyramid strategy, using
a network of existing partners and incremental change. From early 2008, M-Pesa moved
to more aggressive growth, as the innofusion network grew and increasing loci of
innovation emerged in the network, resulting in some strategic ‘drift’. Around the start of
2010, M-Pesa began to make up more than 10% of total revenue for Safaricom, and the
initiative was embraced as a driver of firm growth. Standardisation can be seen as an
13 Number of agents: later growth spikes occurred during scale-out as Safaricom came to agreement with various banks and service providers to use their networks (e.g. Jan 2010 spike arose from over 500 Equity Bank ATMs becoming ‘agents’). % revenue: graph draws on six-monthly Safaricom revenue results.

18
attempt to re-establish more control on the drifting innofusion network. In the fifth
phase of functional expansion, M-Pesa looked to grow by changing strategy: adding new
services and integrating M-Pesa into wider financial networks in Kenya. These phases will
now be investigated in further detail.
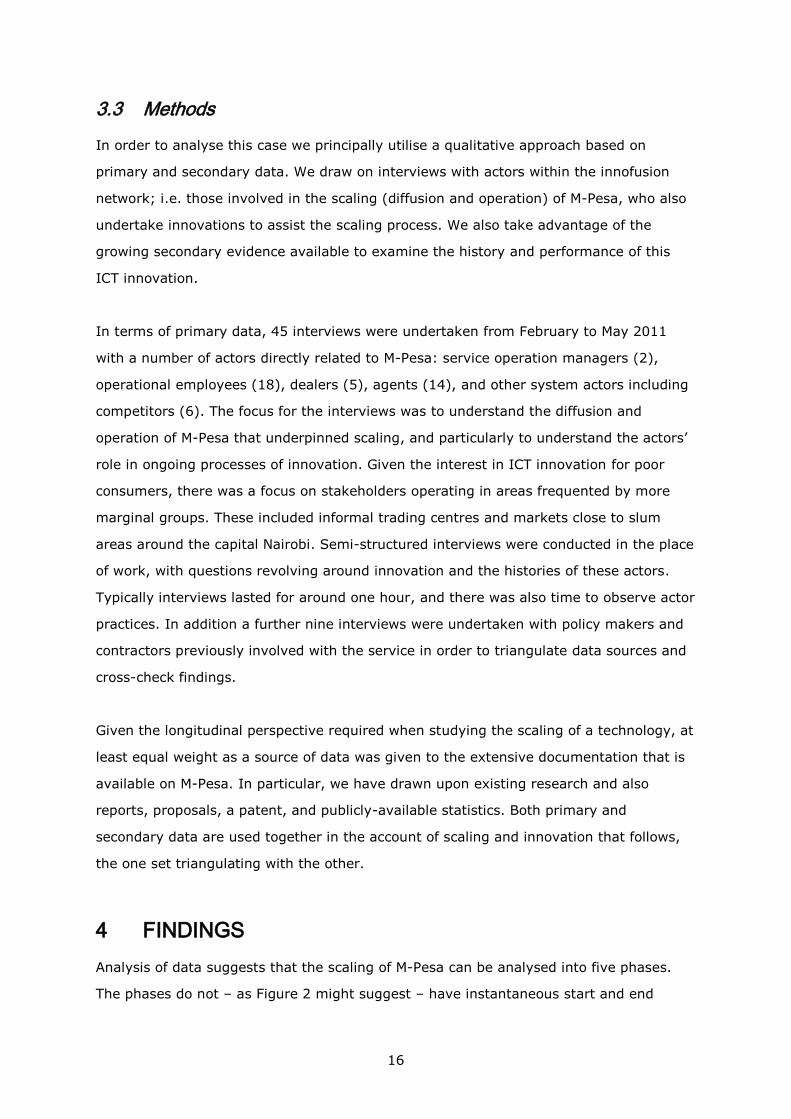
4.1 Pilot
The innovation which would later become M-Pesa emerged as part of a three-year
donor-funded research project entitled “mobile micro-finance”. The project was launched
as a joint venture between the Vodafone Group and the UK aid agency DFID’s Financial
Deepening Challenge Fund (FDCF). Its aim was to examine the identified growing
potential of ICT solutions to assist micro-finance – the provision of small loans to allow
poor groups to invest in their livelihoods – in developing countries.
Vodafone Group’s (2007) patent which emerged in the early (research) stages of this
pilot outlines an account management system for micro-finance institutions (MFIs),
where the later core person-to-person (P2P) mobile transfers and agents were just one
element of a wider system. However, by the time the pilot was completed the focus and
goals had changed quite dramatically. This can be connected to user trials of the micro-
finance system, led by Kenyan mobile operator Safaricom (a subsidiary of Vodafone
Group) together with a large MFI, Faulu Kenya (with key actors summarised in Figure 3).
Figure 3: Innofusion network during pilot phase
Key: actors in bold are key drivers of innovation; bold lines represent new relations
Vodafone DFID
Safaricom
MFI
Customers
19
In the first instance, the adoption of the pilot system within the MFI was unsuccessful.
System use had detrimental effects through reduced attendance at MFI meetings
(Hughes and Lonie, 2007), and integration of the account management system was
described as “not completed in the pilot and resulted in [the MFI] effectively running two
record keeping systems” (FDCF, 2006: 4).
Alongside this main ICT innovation which largely failed during the pilot, emergent
innovative activity took place among customers14. The pilot designers were instrumental
in supporting this emergent activity by ensuring that pilot activity was tracked (ibid.);
and by allowing emergence to occur both in the technology (for example by enabling
non-MFI P2P transfers) and in wider deployment (for example by not punishing
unexpected uses of the system) (Hughes and Lonie, 2007).
It was these two outcomes which resulted in the repositioning of the project towards the
form of M-Pesa as it is seen at present. On one hand MFI resistance suggested that “a
mass market launch with an MFI would be too complex” (ibid.: 77), while on the other
hand the innovation was increasingly being used in interesting, but unexpected ways for
so-called “non essential transactions”, suggesting potential new directions (FDCF, 2006).
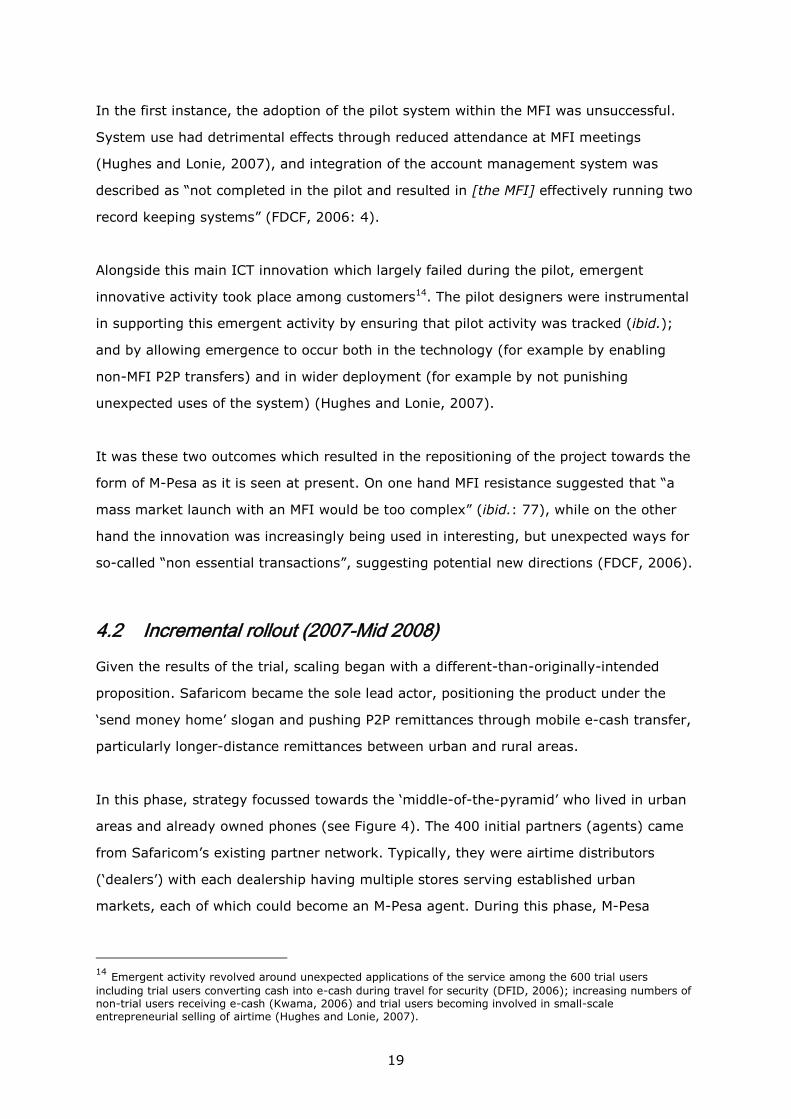
4.2 Incremental rollout (2007-Mid 2008)
Given the results of the trial, scaling began with a different-than-originally-intended
proposition. Safaricom became the sole lead actor, positioning the product under the
‘send money home’ slogan and pushing P2P remittances through mobile e-cash transfer,
particularly longer-distance remittances between urban and rural areas.
In this phase, strategy focussed towards the ‘middle-of-the-pyramid’ who lived in urban
areas and already owned phones (see Figure 4). The 400 initial partners (agents) came
from Safaricom’s existing partner network. Typically, they were airtime distributors
(‘dealers’) with each dealership having multiple stores serving established urban
markets, each of which could become an M-Pesa agent. During this phase, M-Pesa
14 Emergent activity revolved around unexpected applications of the service among the 600 trial users
including trial users converting cash into e-cash during travel for security (DFID, 2006); increasing numbers of non-trial users receiving e-cash (Kwama, 2006) and trial users becoming involved in small-scale entrepreneurial selling of airtime (Hughes and Lonie, 2007).

20
customers were not the poorest – they had higher-than-average incomes, and rated
higher-than-average on other indicators. For instance, results from a sample survey
during the first year of M-Pesa found that
“M-PESA users have typically completed a higher[than average] level of
education: for example, 46 percent of users have completed secondary
school, and 10 percent have a university degree” (Jack and Suri, 2009: 13)
Figure 4: Original ‘send money home’ marketing of M-Pesa
A middle-of-the-pyramid approach, with a well-to-do urbanite transferring e-cash to his rural
family
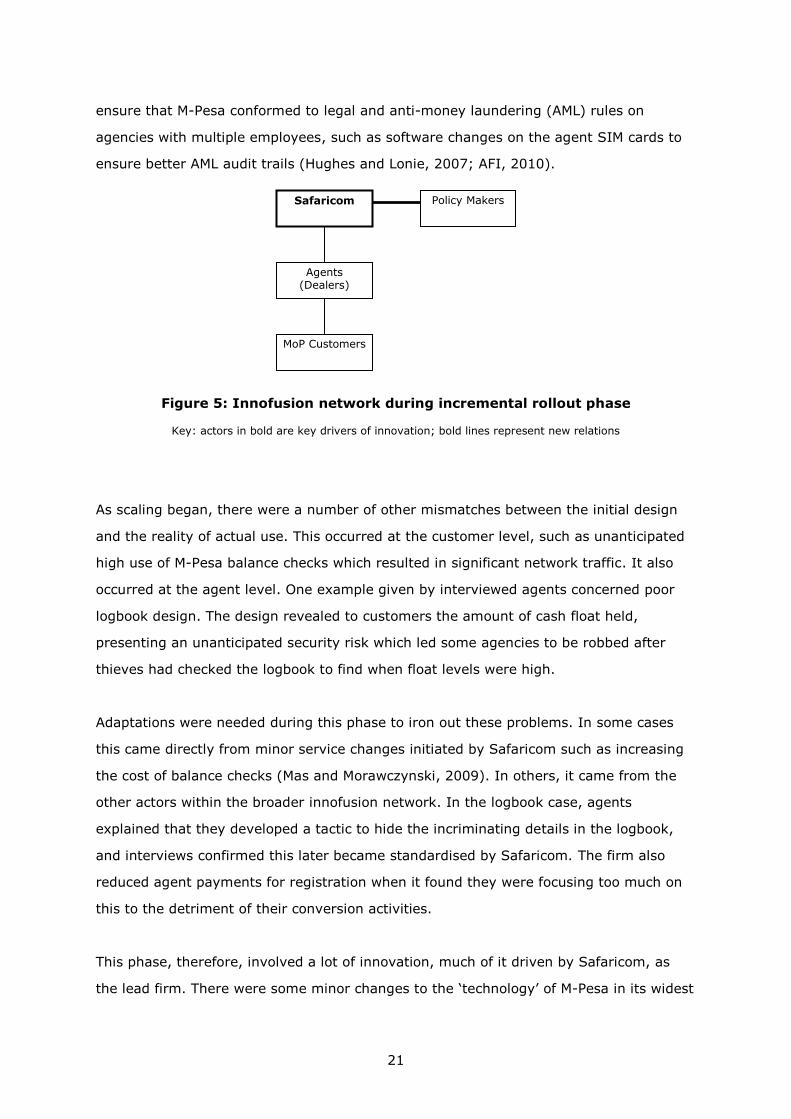
Given the changed strategy, both the M-Pesa system and actors (see Figure 5) were
reconfigured following the pilot. In the new approach, conversion activities – deposits
and withdrawals – became more central to the service than had initially been
anticipated. Agents therefore also took on a more central role, expected to deal with
higher volumes of cash and e-cash. But this led to increasing risks related to depleting
their cash or e-cash floats during service. The logical reconfiguration to mitigate this risk
was to allow so-called ‘float management’, where dealers were allowed to move cash
and e-cash between agents within their dealerships to avoid depletion of float (FDCF,
2006; Hughes and Lonie, 2007). Meanwhile, M-Pesa’s growth from pilot meant
regulatory requirements came into play. Meeting these included product changes to
21
ensure that M-Pesa conformed to legal and anti-money laundering (AML) rules on
agencies with multiple employees, such as software changes on the agent SIM cards to
ensure better AML audit trails (Hughes and Lonie, 2007; AFI, 2010).
Figure 5: Innofusion network during incremental rollout phase
Key: actors in bold are key drivers of innovation; bold lines represent new relations
As scaling began, there were a number of other mismatches between the initial design
and the reality of actual use. This occurred at the customer level, such as unanticipated
high use of M-Pesa balance checks which resulted in significant network traffic. It also
occurred at the agent level. One example given by interviewed agents concerned poor
logbook design. The design revealed to customers the amount of cash float held,
presenting an unanticipated security risk which led some agencies to be robbed after
thieves had checked the logbook to find when float levels were high.
Adaptations were needed during this phase to iron out these problems. In some cases
this came directly from minor service changes initiated by Safaricom such as increasing
the cost of balance checks (Mas and Morawczynski, 2009). In others, it came from the
other actors within the broader innofusion network. In the logbook case, agents
explained that they developed a tactic to hide the incriminating details in the logbook,
and interviews confirmed this later became standardised by Safaricom. The firm also
reduced agent payments for registration when it found they were focusing too much on
this to the detriment of their conversion activities.
This phase, therefore, involved a lot of innovation, much of it driven by Safaricom, as
the lead firm. There were some minor changes to the ‘technology’ of M-Pesa in its widest
Safaricom
Agents (Dealers)
MoP Customers
Policy Makers

22
sense – i.e. encompassing the organisational arrangements and procedures that are
necessary for the physical artefacts to diffuse and operate, and virtual transfers to occur
– but these did not influence the main scaling strategy to drift from its main focus.
4.3 Aggressive growth (2008 – Start 2010)
As reflected in monthly change in numbers of agents (Figure 2), M-Pesa was growing
from mid-2007, but then began to grow much more rapidly from early-to-mid-2008.
During this aggressive growth phase, as supported by Jack and Suri’s (2010:4) update
on their sample survey, M-Pesa moved towards a more intensive focus on BoP users.
“the earliest MPESA users were the wealthiest and most educated, but over
time, it is being adopted by people of more varied socioeconomic levels”
This change emerged from the push of lower-income user awareness due to service
growth and high-spend marketing campaigns (Mas and Radcliffe, 2010; see Figure 6),
and the pull of widespread insecurity that arose in Kenya following election-related
violence which began in Dec 2007.
Figure 6: BoP-focused marketing of M-Pesa
An informal car washer in urban Machakos describes (in Kiswahili) using M-Pesa to send money
locally and also the value of the service in keeping money safe when he travels
23
M-Pesa was not only able to continue to run during this period of tension, but evidence
suggests that for some users, M-Pesa transfers provided a vital financial lifeline
(Morawczynski and Pickens, 2009; Morawczynski, 2010). While it might be inappropriate
to attach a significant national relief role to the presence of the service, the crisis did
increase the salience of the marketing campaign. It built awareness of M-Pesa within
poorer groups, and built a reputation for the service, with stories of its value widely
circulating. During 2008, Safaricom managers therefore found the firm’s scale-up
strategy interacting with rapidly-growing demand. Even as the political crisis settled
down in late 2008, Safaricom continued its aggressive growth (Flaming et al., 2011) as
competition emerged from the second mobile operator introducing their own mobile
money service (Zap), which in its early months seemed like a genuine competitor to M-
Pesa (Mas and Morawczynski, 2009)15.
Safaricom’s strategy was growth (though it had not anticipated growing quite so fast).
Yet it was also having to learn and change as growth necessitated working with
unconventional partners more closely embedded in poor localities. Working with these
new partners was very much a process of learning and during this phase there was much
service delivery innovation (as opposed to innovation of the product itself) related to
best configuring the M-Pesa value network for efficient BoP delivery and growth.
The main driver was the addition of new actors into the innofusion network through the
so-called sub-agent model. This was initiated by dealers (and increasingly over time
many other successful agents) who began to sub-contract M-Pesa agent duties to new
entrepreneurs from outside Safaricom’s list of existing contacts. As described by one of
the early implementers of the project, this allowed increased reach16.
“the only suitable outlets to become M-PESA agents are often small family-
run stores…it is not commercially feasible for M-PESA to have a direct
business relationship with thousands of “Mom-and-Pop” shops across Kenya”
(Lonie, 2010: 2).
15 Zap initially took custom from M-Pesa but, thanks in part to Safaricom’s reaction and first-mover advantage, it did not attain critical mass. 16 This is supported by a comparative study of M-Pesa in Kenya and Tanzania. Camner and Sjöblom (2009) argue that the sub-agent model, not established in Tanzania, can be seen as one of the principal factors that has pushed the growth of the service, particularly into poorer areas in Kenya.
24
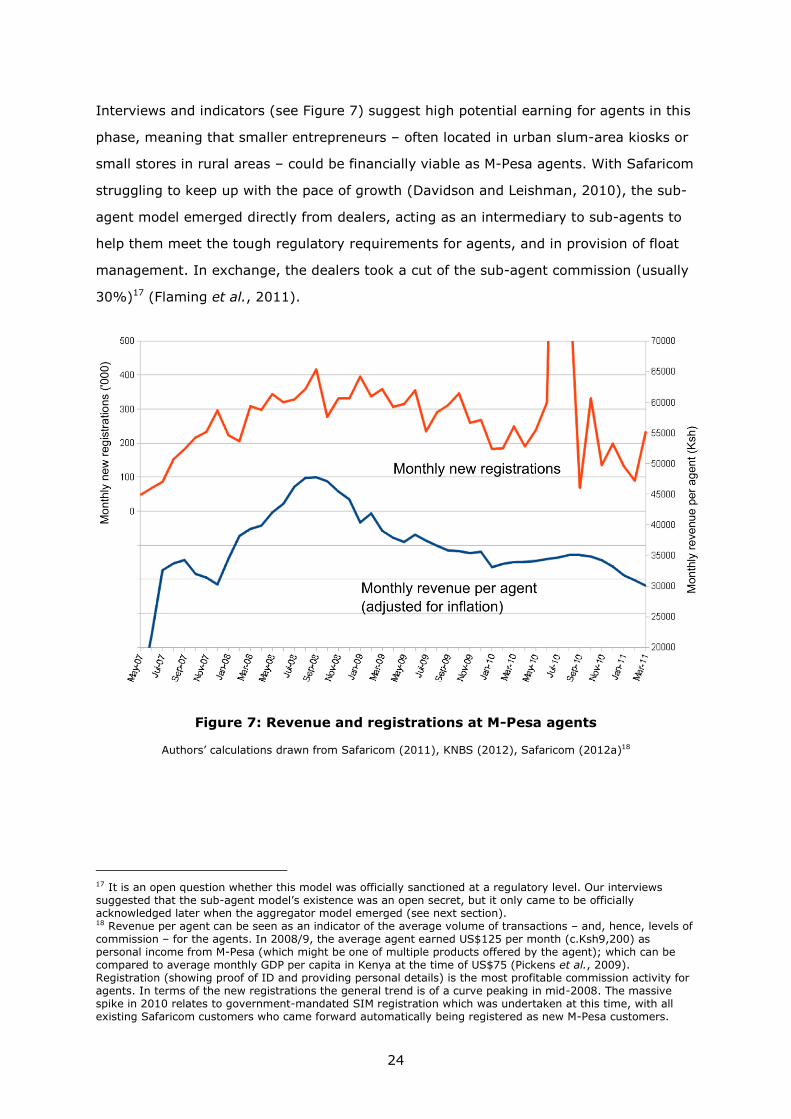
Interviews and indicators (see Figure 7) suggest high potential earning for agents in this
phase, meaning that smaller entrepreneurs – often located in urban slum-area kiosks or
small stores in rural areas – could be financially viable as M-Pesa agents. With Safaricom
struggling to keep up with the pace of growth (Davidson and Leishman, 2010), the sub-
agent model emerged directly from dealers, acting as an intermediary to sub-agents to
help them meet the tough regulatory requirements for agents, and in provision of float
management. In exchange, the dealers took a cut of the sub-agent commission (usually
30%)17 (Flaming et al., 2011).
Figure 7: Revenue and registrations at M-Pesa agents
Authors’ calculations drawn from Safaricom (2011), KNBS (2012), Safaricom (2012a)18
17 It is an open question whether this model was officially sanctioned at a regulatory level. Our interviews suggested that the sub-agent model’s existence was an open secret, but it only came to be officially acknowledged later when the aggregator model emerged (see next section). 18 Revenue per agent can be seen as an indicator of the average volume of transactions – and, hence, levels of commission – for the agents. In 2008/9, the average agent earned US$125 per month (c.Ksh9,200) as personal income from M-Pesa (which might be one of multiple products offered by the agent); which can be compared to average monthly GDP per capita in Kenya at the time of US$75 (Pickens et al., 2009). Registration (showing proof of ID and providing personal details) is the most profitable commission activity for agents. In terms of the new registrations the general trend is of a curve peaking in mid-2008. The massive spike in 2010 relates to government-mandated SIM registration which was undertaken at this time, with all existing Safaricom customers who came forward automatically being registered as new M-Pesa customers.
25
By 2009, more than 300 dealers and others had become ‘master agents’, supervising
anywhere from a couple up to a hundred or more sub-agents. An example of the
effectiveness of this approach in reaching poorer consumers is illustrated in an interview
with a master agent, Mary, who had 15 sub-agents. Mary initially ran a small store in the
main trading street of a large slum area but took the risk and became an M-Pesa agent.
As interest grew in using the service in the slum, she first added two additional stores
herself, but key expansion came during the aggressive growth phase when the sub-
agent model allowed her to invest without having to deal with operational issues of each
new store:
“You effectively sit back and still get the 30% per month without having to get
involved in the daily problems”.
The 15 other entrepreneurs – typically for sub-agents – were smaller stores mainly
located in more remote, less-affluent parts of the same slum area19 such that, through
this model, the M-Pesa service penetrated to within a short walking distance of even the
poorest of slum dwellers20.
Service delivery innovation during this phase was being driven by both the master agent
and sub-agents. Master agents created the sub-agent model and played a buffering role,
lowering risk for agents to operate profitably and independently in ever poorer and more
uncertain environments. The sub-agents’ innovations were less conspicuous, related to
reaching new markets, and pushing the ICT service towards poor consumers. During
interviews with such sub-agents, one could see how over time how they had been able
to innovatively adapt service delivery to these environments. For example, agent
Catherine was located in an informal manufacturing area of Nairobi. Over time, she built
reciprocal relations with local traders enabling her to use them as ‘float balancers’ by
exchanging cash when her float levels were too low or too high, and thus avoiding risky,
time-consuming trips to a master agent or bank.
This was typical of the subtle process innovations interviewees revealed; not just local
tactics to get around float problems (e.g. in building informal relations with other
sources of finance in more isolated areas in order to maintain a cash float and so ensure
19 Larger slums in Kenya are inhabited by a large demographic of the population from lower middle class, to working poor, to poor – often in different parts of the slum. 20 This interview data matches interview accounts from other dealers, who increasingly ‘micro-franchised’ sub-agents. (This is also documented in Eijkmen et al.’s (2009) account of a master agent with 106 sub-agents, and Haas et al.’s (2010) account of a dealer in another Nairobi slum with 20 sub-agents.)
26
conversion service availability) but also by connecting service uses to particular local
needs (safety or savings or transfers); through tactics to improve security in high risk
areas, thus allowing service to be maintained where otherwise it might be withdrawn;
and in small service adaptations for particular local needs (e.g. varying opening hours
according to needs, or varying ID requirements for registration).
Thus in this phase, the locus of innovation moved towards the lower levels of the
innofusion network in the form of master and sub-agents making BoP-relevant
adaptations; with sub-agents being embedded in BoP locations and relations. Yet
Safaricom still played an important role. First by allowing this multiplicity of service
innovations to occur, and second in providing the ‘scaffold’ that helped service
innovations become more viable. One example related to float management, mentioned
previously.
Float management was initially imagined to occur between geographically-close agents
within small dealerships. However, the emerging sub-agent model resulted in
increasingly large and scattered networks of agents with float management becoming a
challenge. Notwithstanding the local adaptations noted above, master agents reported
spending ever-more time transporting money for their sub-agencies. In time, Safaricom
responded to this in their strategy, through ‘scaffolding’ to support float management for
the sub-agent model. It created a new role: the ‘super agent’ (see network summary in
Figure 8). These were typically banks which allowed isolated agents to undertake float
management more easily via their local bank branches21.
21 Such a change was possible for smaller sub-agents located in poorer areas due to the dramatic expansion of banks focussed on poor communities in Kenya, particularly the Equity, Co-operative and Family Banks (FSD Kenya, 2009) who became super agents, and were increasingly locating in trading areas in poor communities resulting in complementarity between these two services.

27
Figure 8: Innofusion network during aggressive growth phase
Key: actors in bold are key drivers of innovation; bold lines represent new relations
In sum, this phase started with an intentional shift in strategy by the lead firm – to push
its new ICT system as far and quickly as possible to a BoP audience. But making that
happen required adaptive innovations to the organisational arrangements and
procedures that enabled M-Pesa to operate. The locus of those innovations was much
closer to the ‘front-line’ of the BoP: among those delivering the service to end users. In
turn, though, those emergent innovations drove growth and caused Safaricom’s own
strategy to drift a little as it responded to those innovations.
4.4 Standardisation (Start 2010 – 2011)
A new phase can be seen to begin in January 2010 when Safaricom announced its
‘aggregator model’. This can be taken as a turning point where Safaricom sought to
bring the main locus of innovation back under its own control. It was prompted by M-
Pesa’s continuing expansion and its increasing articulation in Safaricom as an innovation
at the heart of the firm’s future revenue growth, with value-added service delivery to the
BoP now a core, accepted of the firm’s overall portfolio (see Safaricom, 2012a).
Safaricom
Master Agents
Customers Sub Agents
BoP Customers
Super Agents
28
In M-Pesa manager interviews, this shift in strategy was also linked to concerns that the
sub-agent model was becoming problematic in terms of management and control, with
one stating:
“There are many problems, such as sharing of commissions. HQ [master agents]
determines the level of commission for its sub-agents but sub-agents have no
idea what they are owed….Some agents are also moving their tills around the
country without permission”.
Some master agents were seen as increasingly unreliable and unprofessional, and
growing complaints about poor quality of sub-agents were seen to stem from poor
training and selection by master agents (i.e. sub-agents not being able to manage float
properly; sub-agents not being able to effectively handle all aspects of the service; and
sub-agents being susceptible to security problems such as thefts and scams).
The changes took the learning of the previous phase – where the push for growth had
led to a rather chaotic proliferation of actors and innovations – and applied that learning
to allow more management control over the service. For Safaricom, the innofusion
network spawned by aggressive growth was now too complex. In the new aggregator
model M-Pesa would continue to work in a hierarchical structure but the master-and-
sub-agent model was ended. The number of top-level agents was reduced from
hundreds previously to just 8-10 (now renamed aggregators), each responsible for 2,000
to 4,000 agents (Mas and Ng’weno, 2010). The intention – as indicated by Safaricom
interviews – was that the new class of aggregators would take increasing and devolved
professional responsibility for selection, training and quality monitoring of the agents.
However, during research it was unclear how fully the aggregator system had been
implemented. According to M-Pesa managers, the change was supposed to take 6-8
months, but sub-agent field interviews - 18 months later – indicated the process was still
ongoing, with some interviewees unaware of the new model. While some agents had
migrated to a new model, many smaller agents still existed as sub-agents, suggesting
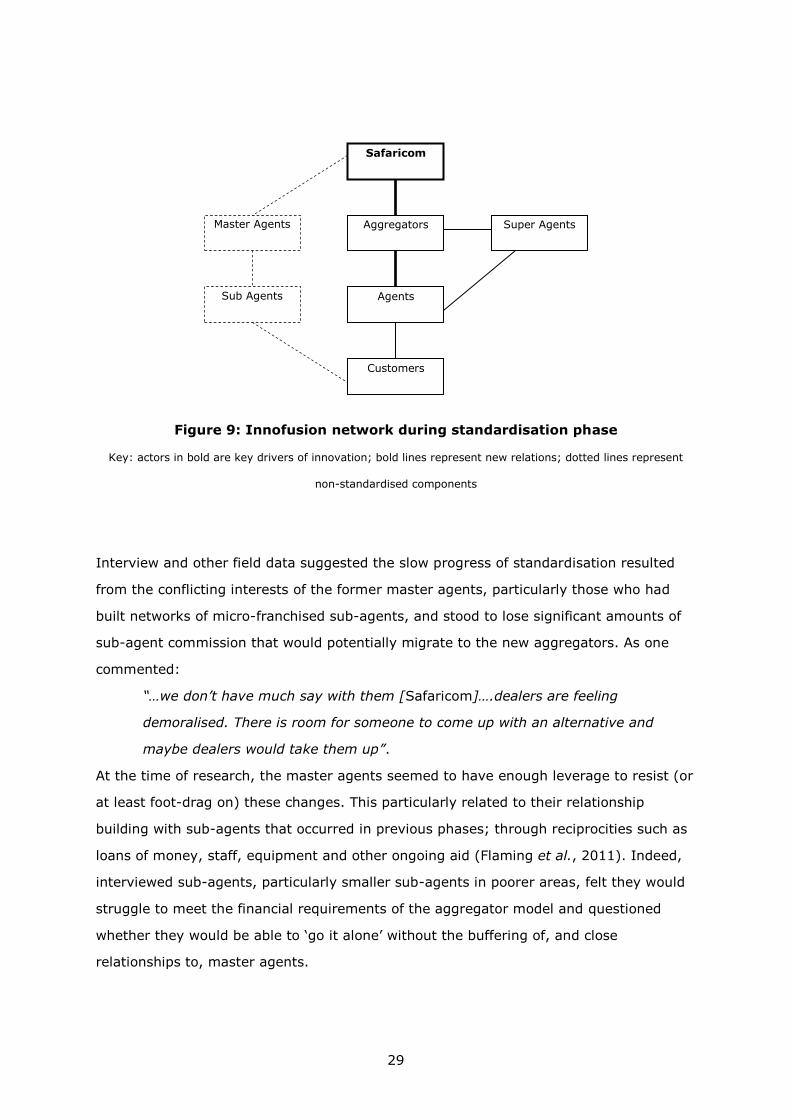
the two models were uneasily existing in parallel as shown in Figure 9.
29
Figure 9: Innofusion network during standardisation phase
Key: actors in bold are key drivers of innovation; bold lines represent new relations; dotted lines represent
non-standardised components
Interview and other field data suggested the slow progress of standardisation resulted
from the conflicting interests of the former master agents, particularly those who had
built networks of micro-franchised sub-agents, and stood to lose significant amounts of
sub-agent commission that would potentially migrate to the new aggregators. As one
commented:
“…we don’t have much say with them [Safaricom]….dealers are feeling
demoralised. There is room for someone to come up with an alternative and
maybe dealers would take them up”.
At the time of research, the master agents seemed to have enough leverage to resist (or
at least foot-drag on) these changes. This particularly related to their relationship
building with sub-agents that occurred in previous phases; through reciprocities such as
loans of money, staff, equipment and other ongoing aid (Flaming et al., 2011). Indeed,
interviewed sub-agents, particularly smaller sub-agents in poorer areas, felt they would
struggle to meet the financial requirements of the aggregator model and questioned
whether they would be able to ‘go it alone’ without the buffering of, and close
relationships to, master agents.
Safaricom
Aggregators
Agents
Customers
Super Agents Master Agents
Sub Agents

30
In sum, this strategic change – an attempt to drive a top-down innovation into a, by
now, very large and complex network that contained multiple interests and many actors
with experience of themselves innovating – seems to have been widely problematic.
While there is no doubt that Safaricom’s diagnosis of problems emerging from the
innofusion network had some validity, the new strategy sought to shift both managerial
control and the locus of innovation upwards. Not only did this meet the inertia of lower-
level interests, it also tried to break the crucial (albeit sometimes problematic) master-
agent-to-sub-agent relations which were demonstrably central in successfully pushing
the ICT service towards poorer groups. This was a strategic shift, then, which ran partly
counter to the nature and interests of the created innofusion network, and thus ran into
difficulties.
4.5 Functional expansion (Mid 2010 -)
In parallel with its efforts to impose standardised procedures and control over the rapid
scaling-out of the money transfer service to new areas and customers, Safaricom also
began a functional expansion. This sought to move away from just P2P financial
transfers into a focus on the wider domain of m-money - the use of M-Pesa in payments
and integration with banking services. This increase in the scope of offered services
arose as new registrations began to decline, as the market started to approach
saturation and as fewer new users became available, as shown in Figure 722. Thus,
increasing the average revenue per user was seen by managers as crucial to future
growth. Secondly, the new phase connects to a second wave of competition stemming
from the government’s publication of ‘agent banking guidelines’ (CBK, 2010). This policy
permitted several successful Kenyan banks to operate agency services (in a similar way
to M-Pesa) to reach wider populations.
There were ad-hoc m-money activities in previous phases of M-Pesa, which helped
Safaricom learn about this new type of service; in much the same way that the MFI-
related piloting had helped it learn about money transfer. But a significant increase of
focus can be detected from May 2010, when Safaricom launched M-Kesho, a service
which allows connection between M-Pesa and a bank account. From then on they
22 Only Safaricom subscribers can actively use M-Pesa. As of Feb 2011, 78% of all Safaricom users had M-Pesa, and 68% of all mobile users in Kenya used Safaricom (Safaricom, 2011). Thus, in a highly competitive market with many other providers, M-Pesa can be seen to be moving towards saturation of the number of users it could likely recruit.
31
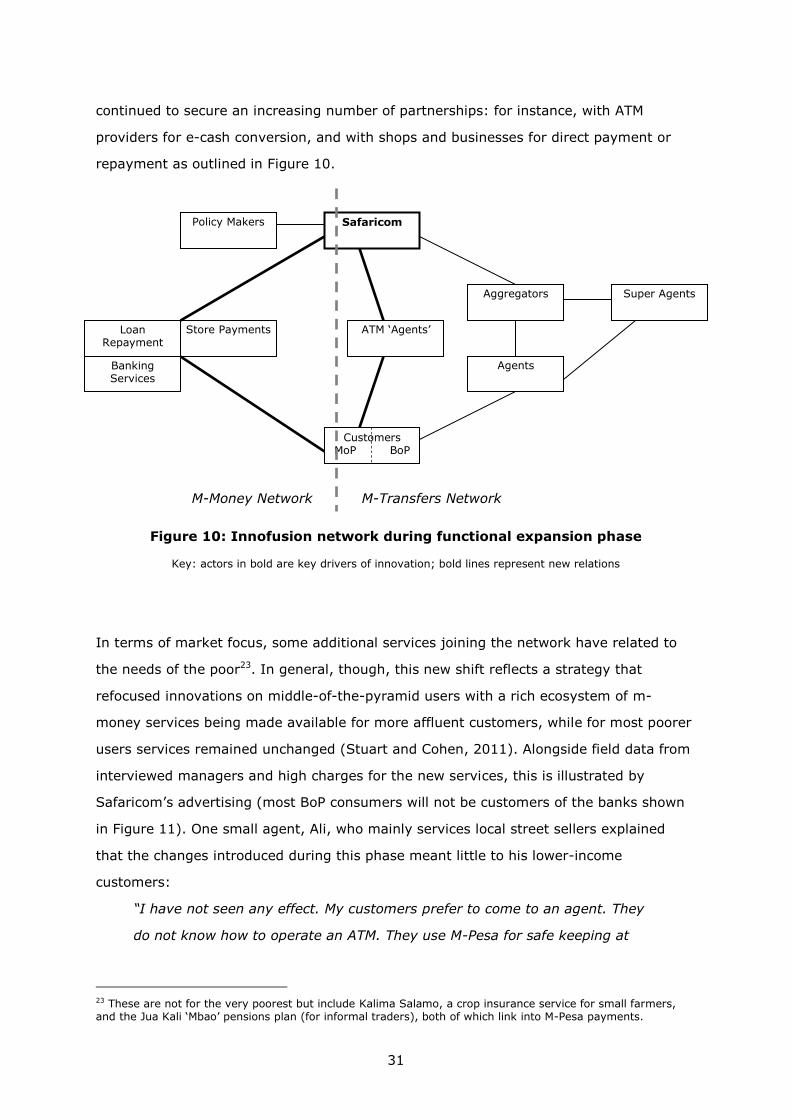
continued to secure an increasing number of partnerships: for instance, with ATM
providers for e-cash conversion, and with shops and businesses for direct payment or
repayment as outlined in Figure 10.
Figure 10: Innofusion network during functional expansion phase
Key: actors in bold are key drivers of innovation; bold lines represent new relations
In terms of market focus, some additional services joining the network have related to
the needs of the poor23. In general, though, this new shift reflects a strategy that
refocused innovations on middle-of-the-pyramid users with a rich ecosystem of m-
money services being made available for more affluent customers, while for most poorer
users services remained unchanged (Stuart and Cohen, 2011). Alongside field data from
interviewed managers and high charges for the new services, this is illustrated by
Safaricom’s advertising (most BoP consumers will not be customers of the banks shown
in Figure 11). One small agent, Ali, who mainly services local street sellers explained
that the changes introduced during this phase meant little to his lower-income
customers:
“I have not seen any effect. My customers prefer to come to an agent. They
do not know how to operate an ATM. They use M-Pesa for safe keeping at
23 These are not for the very poorest but include Kalima Salamo, a crop insurance service for small farmers, and the Jua Kali ‘Mbao’ pensions plan (for informal traders), both of which link into M-Pesa payments.
Safaricom
Aggregators
Agents
Customers MoP BoP
Super Agents
ATM ‘Agents’ Store Payments Loan Repayment
Banking Services
Policy Makers
M-Transfers Network M-Money Network
32
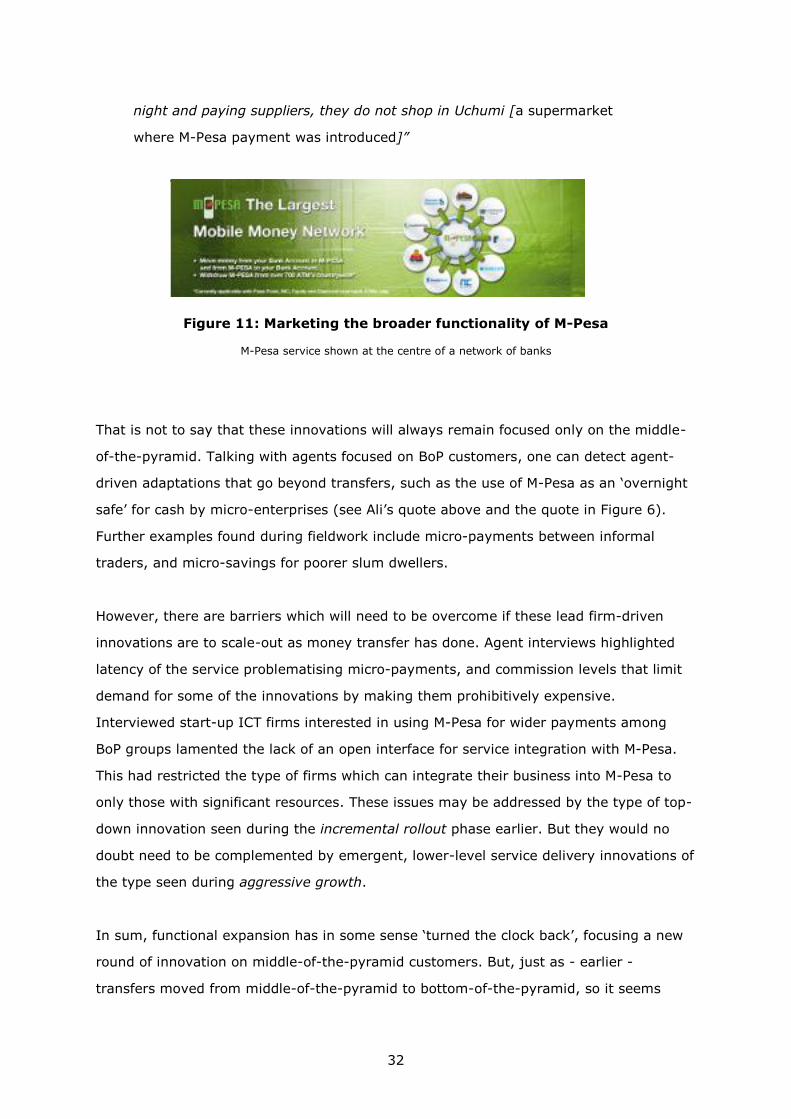
night and paying suppliers, they do not shop in Uchumi [a supermarket
where M-Pesa payment was introduced]”
Figure 11: Marketing the broader functionality of M-Pesa
M-Pesa service shown at the centre of a network of banks
That is not to say that these innovations will always remain focused only on the middle-
of-the-pyramid. Talking with agents focused on BoP customers, one can detect agent-
driven adaptations that go beyond transfers, such as the use of M-Pesa as an ‘overnight
safe’ for cash by micro-enterprises (see Ali’s quote above and the quote in Figure 6).
Further examples found during fieldwork include micro-payments between informal
traders, and micro-savings for poorer slum dwellers.
However, there are barriers which will need to be overcome if these lead firm-driven
innovations are to scale-out as money transfer has done. Agent interviews highlighted
latency of the service problematising micro-payments, and commission levels that limit
demand for some of the innovations by making them prohibitively expensive.
Interviewed start-up ICT firms interested in using M-Pesa for wider payments among
BoP groups lamented the lack of an open interface for service integration with M-Pesa.
This had restricted the type of firms which can integrate their business into M-Pesa to
only those with significant resources. These issues may be addressed by the type of top-
down innovation seen during the incremental rollout phase earlier. But they would no
doubt need to be complemented by emergent, lower-level service delivery innovations of
the type seen during aggressive growth.
In sum, functional expansion has in some sense ‘turned the clock back’, focusing a new
round of innovation on middle-of-the-pyramid customers. But, just as - earlier -
transfers moved from middle-of-the-pyramid to bottom-of-the-pyramid, so it seems

33
feasible the same will happen with m-money services24. (Quite likely the same cycle will
be repeated again with as yet unforeseen additional ICT innovations in the future.) A mix
of top-down innovation plus lower-level innovation (allowed and facilitated by the lead
firm) will be needed to help scale-out these new services.
5 DISCUSSION
Drawing on empirical study, scaling of ICT innovations – at least, of this particular ICT
innovation – can be understood as a four-stage iterative model, illustrated in Figure 12.
We argue that two loops of this process are detectable, one specifically related to
bringing mobile transfers to bottom-of-the-pyramid groups (as outlined in sections 4.1 to
4.4). The later functional expansion (section 4.5) can be read as part of a new scaling
iteration for the new (albeit closely related) innovation of m-money systems, which will
run in staggered parallel to the scaling of m-transfers. The content of these stages will
now be discussed and analysed in further detail.
Figure 12: Four-stage model of scaling
(Linking the five phases from the M-Pesa case study25)
24 Indeed, at the time of writing, Safaricom announced some new lower limits for financial transfer which will begin to enhance the potential for micro-payments within lower-income groups (Safaricom, 2012b) 25 The first phase of m-money can be seen to have occurred chronologically alongside phases [2] – [4] of the scale-out of m-transfers, rather than being a separate pilot: ‘exploratory scoping’ may therefore a better term for this stage. Since this model was emergent from fieldwork and has not been the subject of secondary literature to date, this m-money phase is shown as a dotted box. As outlined above, the second dotted box corresponds to suggestions that m-money services may expand into BoP provision as part of a future strategy.
34
5.1 Pilot / exploratory scoping
Exploratory scoping may take the form of a discrete pilot study but might alternatively
occur concurrently with diffusion and implementation of other products/services, as in
the M-Pesa case’s second iteration. It involves lead firms making a first implementation
of wider ICT innovation strategy. As noted above, in the BoP literature, such activity is
related to the idea of “co-invention” (London and Hart, 2004)26, where multiple actors in
the innovation system are seen to be shaping the ICT innovation and the broader socio-
technical system around it. Simanis and Hart (2009) conceive co-invention as a long-
running activity with deep partnership and participation – aligned with the iconic story of
Muhammad Yunus developing his Grameen projects while living with farmers. But the M-
Pesa pilot suggests something different. Co-invention occurred over a comparatively
short (2-3 month) trial period within the overall pilot, and involved the lead firm creating
the framework for activity and adaptation but then ‘standing back’ somewhat. It closely
observed the user community in action, provided a space for emergent adaptations
rather than quashing them, and built metrics and processes which allowed analysis of
adaptations and their capture and incorporation into future stages of scaling.
While the contrast between the co-invention seen here and that described by Simanis
and Hart may not be that great – there was still co-participative skill building and focus
group activity - we suggest that a relatively hands-off approach might be particularly
useful for co-production of ICT innovations during piloting. Generically, this approach
may be relatively quick; may lead to a more genuine simulation of what rollout will look
like compared to a situation where the lead firm is micro-managing the trial; and may
(only) somewhat address critiques of the deep participation approach related to power
and ‘steering’ of innovation (Arora and Romijn, 2012).
In addition, there may be a particular relevance of this approach to ICTs. Compared to
other potential BoP innovations (e.g. agricultural seeds or household products), ICTs are
more flexible – and thus allow for more emergent, unanticipated uses – and they can be
more readily and quickly adapted; sometimes by the end-users, sometimes by
intermediaries within the local innovation system. ICT metrics – i.e. details of how the
26 Itself deriving from the notion of ‘co-production’ in which firms and customers both contribute to innovation (Ramirez, 1999).

35
technology is being used – are also more quickly and easily accessible for analysis during
exploratory stages than might be the case for other technologies. Such arms’-length
approaches are especially useful in allowing exploratory scoping to move from being
simply a test of the ICT innovation by the lead firm, to building a more realistic
innofusion network of actors during the exploratory stage, and to better analysing the
wider socio-technical issues involved in scaling any ICT system.
A risk for lead firms in this stage might arise if they are too set in their idea of what is
being implemented and how it is being implemented, resulting in adaptation being
curtailed or ignored. Even when exploratory stages build room for adaptation, such
activities may not be followed up and integrated into the core innovation. The M-Pesa
pilot managed to avoid these risks, even though the original focus of innovation was
sufficiently well-established that it had been patented by the time the pilot was
occurring.
5.2 Incremental rollout
At the point of incremental rollout, the ICT system might look significantly different to
that of the previous stage. The incremental rollout stage can principally be seen as a
second learning stage; with the focus of learning being the multiplicity of changes
needed to initiate rollout whether related to customers, policy, delivery systems, etc. As
outlined in the notion of “innofusion”, it is crucial at this stage that the innovation is not
taken as solidified – as a set ICT system simply to be diffused. Instead, there must be
room for the ICT system and the configuration of the innofusion network to be adjusted
as problems relating to scaling emerge.
For firms looking to reach the BoP, simultaneously developing new innovations and
expanding into new markets is a very difficult task (London, 2009). M-Pesa reflects this.
The initial focus on existing Safaricom customers, markets and partners was a good
strategy as the firm sought to solidify its ICT innovation at scale, leaving the push
towards BoP markets until later. Whether or not that push actually occurs is an identified
risk for the transition from this to the next stage of scaling. The lead firm may choose to
stick with a comfortable but smaller profit from the middle-of-the-pyramid, without the
impetus to risk reaching down towards the BoP (Arora and Romijn, 2012).

36
In the case of M-Pesa’s first cycle of scaling, the structure of the ICT innovation even in
the incremental stage can be seen to maximise network effects and to facilitate further
penetration from the MoP into the BoP (Anderson, 2010). This relates to the original idea
of urban to rural remittances, which from the core middle-of-the-pyramid market pulls
rural users into the system through transfers. Further, the structure of the transfer
tariffs and sufficient coverage of agents encouraged and enabled registration among
rural users.
This pull of less-affluent users into the service (combined with the exceptional external
conditions that emerged at the end of this phase) can be seen to have built BoP demand,
and it was this that drove a transition towards a greater BoP focus. Many ICT innovations
have similar networked architectures, and we suggest that similar approaches to
exploiting network effects might be applicable with other ICT innovations, where services
are intentionally structured in ways to induce growing BoP demand.
At the time of writing, it was too early to predict whether something similar will occur
with m-money services and M-Pesa’s second cycle of scaling. Functional expansion is
typical of ICT scale-outs in emerging markets (e.g. Anderson, 2008) and, as noted in
Section 4, the likelihood is that these will diffuse to the BoP, but perhaps more slowly
given the bundle of new services does not yet contain a strong MoP-to-BoP pull
innovation. However, as noted in the literature review, there are also cases where
functional expansion represents a retreat from BoP focus back to MoP focus in order to
raise revenue (Qiu, 2007), and this does remain a risk, albeit very small in M-Pesa’s
case, that we revisit below.
5.3 Aggressive growth
In this stage, innovations begin to more aggressively move towards bottom-of-the-
pyramid customers. In the M-Pesa case, the core ICT innovation (i.e. hardware and
software) was already well aligned to BoP groups having been appropriately refined
during the earlier pilot stage (although in other ICT cases there might be a need for
further product innovations – for example, this might be necessary to enable m-money
services to fully penetrate BoP markets). But the overall business model was not so
37
aligned, thus requiring changes which mainly consisted of service delivery innovations
and the reconfiguration and adaptation of the innofusion network to reach a growing
market of diverse consumers.
This demonstrates the way in which serving the BoP requires different business models
to those suitable for other markets. The latter models may be based on the notion of
simple market transactions for the purchase and delivery of services (Ramani et al.,
2012). But the interaction between agents and customers is anything but a simple
market transaction, being rooted in a common context of resource constraints,
uncertainty and strong community relations. The result was a need for agents to
innovate, as seen, around float management, opening hours, ID requirements, meeting
specific financial needs, addressing security concerns, etc.
During this stage, the lead firm will likely include additional partners who are more
embedded into these BoP contexts. Key for such expansion is that the locus of
innovation moves away from the lead firm towards the wider innofusion network, so that
innovation now guides strategy and the lead firm is more reactive according to emergent
local innovations. As during the exploratory scoping stage, moving the locus of
innovation involves giving other actors more power to innovate, allowing adaptability in
ICT services, and not punishing adaptations.
However, in this stage there is an additionality. The ICT system and innofusion actors
are likely to be better established and for their local adaptive innovations to scale,
additional ‘scaffold’ from the lead firm is likely required. This means a structural and
functional capability within the lead firm not merely to monitor innovation at the
periphery but also to determine whether to quash, tolerate, or adapt and diffuse those
innovations. In the case of M-Pesa during aggressive growth of the m-transfer service,
localised service delivery innovations resulted in Safaricom responding and helping to
support those innovations. By contrast, it is not yet clear that such a supportive
framework is being made available by Safaricom for the adaptations that will be
necessary to diffuse m-money services into BoP markets.
Thus, the move in the main locus of innovation towards the BoP front-line does not
mean that the lead firm becomes passive. Instead, it lets the broad innofusion network
38
take the lead on at least part of strategy, and where wider limitations emerge due to
growing complexity, the lead firm should look to build ‘scaffold’ which supports and
magnifies emergent adaptations.
5.4 Standardisation
The actions of the lead firm during aggressive growth can be seen as scanning the
innovations that result from the diffusion of their ICT service to new and different
groups, and then identifying, supporting and scaling those which are relevant to general
market growth for their service. But allowing the locus of innovation to move down the
value chain, and scaling to ever-more different groups and locations, increases the
number and variety of local adaptations, and increases the complexity of the overall ICT
system.
Some of these adaptations – while perhaps necessary to reach particular segments of
the BoP market – may be seen by the lead firm to create an incoherence between the
innofusion network’s operation and its own goals (e.g. with emergent adaptations that
raise costs, create new service risks, or run counter to regulatory requirements). These
may also be seen to raise barriers to the overall goal of reaching the largest-possible
number of system users. From a situation where the diktats of scaling to the BoP mean it
must “let a hundred flowers bloom” and become somewhat reactive, the lead firm is
therefore likely to wish to impose some centralised control and put itself back into the
proactive driving seat of innovation.
Indeed, such a process – the standardisation of structures and processes, and their
institutionalisation – is seen as critical in order to embed and sustain not just the scaled
innovation, but also the ownership of the BoP value chain by the lead firm, and its
internal commitment to BoP markets (Braa et al., 2004; Smits et al., 2007). The risk is –
without this consolidation and embedding – ICT firms may drift away from the BoP (Qiu,
2007). Thus, firms may wish to standardise in order to reduce complexity and to more
easily manage innovation, but they may need to do so in order to maintain their BoP
focus.
39
In theory, this would be a matter of taking from all parts of the innovation network the
best emergent adaptations, and then seeking to consolidate and impose them from the
centre, as happened with some of the M-Pesa service delivery innovations. And,
conversely, seeking to stifle those innovations that were seen to run counter to its
business strategy.
In practice, though, this did not quite work out as intended for Safaricom. As an ICT
innovation scales and as its innofusion network becomes larger, more diverse and more
complex, so the need for some standardisation grows. Yet, simultaneously, as the
innofusion network grows, its accreting size and ‘weight’ makes it more conservative
(Monteiro, 1998). Lead firms are caught in a bind, with the need to make changes and
the difficulty of making changes growing simultaneously from the same root. It thus
becomes more difficult to impose some standards; at least those which certain actors
see as disadvantageous. Selection, presentation, and incentivisation of standardised
innovations become ever-more risky, difficult and skilled activities for the lead firm.
Addressing this risk requires lead firm knowledge – of the important relationships and
reciprocities which build up in the lower levels of the network as an essential part of
aggressively scaling an ICT innovation into a BoP market. Any subsequent
standardisation will need to preserve such relations or support them in alternative ways,
and the literature notes the importance of keeping agents onside during large ICT
system deployments (e.g. Mas and Radcliffe, 2010).
Second, while standardisation moves the locus for innovation control back to the lead
firm, that should not be at the cost of restraining innovation elsewhere in the value
network. This would be risky – BoP consumers and contexts are evolving as much as any
other, and localised adaptive innovations must continue if the existing ICT system is to
maintain operation and profitability; let alone if new ICT innovations are to be rolled out.
Lead firms therefore face a very tricky steering operation – manoeuvring between the
different requirements of the various poles of a growing set of actors.

40
6 CONCLUSIONS
Some literature of relevance to scaling and innovation of ICTs for the bottom-of-the-
pyramid still adheres to the notion of simple dualities which separate pilot from scale-up,
scaling from innovation, lead firm from agents, technology from system and context.
That literature, and those dualities, have also influenced business practice.
Other literature has already shown these dualities to be invalid and – when synthesised
– suggests they should be replaced by the more systemic perspective summarised in
Table 1 and Figure 1. However, there has been very little analysis of the actual process
of scaling ICTs for the BoP, or of the innovations that take place during that scaling. It is
here that this paper makes its main contribution, summarised in Table 2 from both the
findings and discussion above, and showing how the systemic framework derived earlier
can be both supported and instantiated in practice with greater detail of its components
revealed.
Scaling Stage Pilot / Exploratory Scoping
Incremental Rollout Aggressive Growth Standardisation
Innofusion network activity
Adaptive trial: - Experimenting with new technology - ‘Co-invention’ via emergent modification
Clarifying system: - Testing core innovation and responding to mismatches - Building acceptance
Emergent, supported innovation: - Adapting to specific BoP needs - Lead firm ‘scaffolding’
Controlling innovation: - Standardising and institutionalising absorbed best practice - Improving control of innovation
Innofusion network roles
Lead firm with sample of all potential actors esp. end users
Lead firm with established partners
Adding new BoP agents to reach BoP market
Attempted lead firm simplification of direct relations
Nature of typical innovation
ICT core ICT margins Service delivery core
Service delivery ‘frontline’
Management process and delivery structure
Organisational strategy
Planned then emergent
Largely planned Emergent and planned
Largely planned
Strategic focus BoP and MoP MoP – Learning BoP – Learning and Growth
BoP – Growth
Risks - Product too well set out prior to trial - Not allowing adaptations
- Diffusion mentality - ‘Getting stuck’ in MoP stage
- Capacity of partners - Lack of scaffold
- Top-down imposition - Breaking BoP-relevant relations - Resistance from other innofusion network members
Table 2: Summary of scaling and innovation of ICT
The importance of ICT scaling has been demonstrated. Scaling has provided significant
revenue and profit for the lead firm; significant revenue and livelihoods for the tens of
41
thousands of dealers and agents involved in service delivery; and a much-valued service
for millions of users at middle and bottom of the pyramid. Scaling overall has followed
Rogers’ S-curve of diffusion: incremental growth succeeded by steep growth which then
slows as the market saturates, but with new waves of functional innovations starting the
cycle once again.
Where Rogers segments the diffusion curve by type of adopter, here we have
substantiated the idea there might be steps or phases during scaling with a four-stage
model, and with the suggestion this could represent a repeating cycle for each new
functionality added to the ICT service. Despite the historical approach adopted, though,
this is still just a cross-section in a continuing story – we do not know what comes next
for m-transfers or for m-money, and while we can identify the likely relation between the
two, there is always the possibility that new MoP services will struggle to reach the BoP
or might even reflect some refocusing away from the BoP.
In all this, innovation has been continuous, widespread and vital to the process of ICT
scaling. M-Pesa has evidenced innofusion in action: innovation is both integral and
essential to ICT diffusion and adoption by BoP consumers, and is undertaken by all
actors in the network. Indeed, what is striking is how crucial emergent innovation has
been – especially in the pilot, but throughout all stages of scaling – and that innovation
elsewhere in the network may be a challenge to the lead firm, but its centrality to BoP
scaling means they should not see it as a problem.
Both the need for but also the nature of innovation has been shaped by the BoP context.
The distance from consumers to core technical innovators creates mismatches that
further innovation has to address. Resource poverty has driven cost adaptations, and
also changes to payment and float management methods. The heterogeneity of BoP
markets demands localised adaptations; adaptations that agents within the atomised
distribution networks are often responsible for, building on the strength of social capital
and interpersonal communication within poor communities. Beyond this, the
responsibilities for, nature and strategic impact of these innovations are all shaped by
the BoP context, as discussed next.
42
While the BoP context has required continuous innovation throughout ICT system
scaling, the nature of innovation, innofusion network members, and the main locus of
innovation have all changed. End users were arguably the main innovators during the
first pilot phase, but their role faded somewhat to be replaced by the lead firm, and then
a growing set of actors within the M-Pesa delivery channel27. Key innovations are
increasingly likely to come from this wider network of actors, and their innovations may
be more relevant to pushing ICT systems towards less affluent groups. This has not been
co-invention or co-creation in the conventional sense of a set of closely-related partners.
Instead – because of the nature of the BoP market – it occurs through a large,
distributed network of stakeholders working together not only to create value but also to
innovate.
The nature of that innovation has spread throughout the ICT system along what may
best be understood as a socio-technical continuum. A few innovations have been to the
technical artefacts but the bigger picture is the relative lack of technical innovation
necessary after the pilot. Some innovations have been at the direct interface of the
social and technical: ensuring the configuration of the technology to match the specific
needs and circumstances of localised consumers. But most innovations needed for BoP
scaling have been to the structures and processes that are the broadest part of the
overall ICT ‘ensemble’, and which are integral to the technology’s diffusion and use.
Those BoP-serving firms – reported earlier – which have been techno-centric in their
approach, are therefore misguided. Technical innovation has arguably been the least
important aspect of scaling for these markets, and a much greater focus is needed on
innovation within the widest sense of socio-technical systems.
More generally, the case supports the claim that strategies and business models for BoP
markets are different from conventional models that serve high-income customers. They
have been different in terms of structures, organisational arrangements, pricing, service
delivery, and other elements. Safaricom has buffered these differences in two ways.
First, by transitioning from high-income to low-income markets via mid-income;
providing a basis for less-disruptive change but also indicating that scaling for the
bottom of the pyramid may actually begin with the middle of the pyramid. Second, and
27 End users have continued to adapt and innovate – see Omwansa (2009). While their role was not the focus during the later stages of scaling, they can be seen to re-emerge in the discussion of functional expansion.

43
related, by learning and adapting intensively during the earlier periods of diffusion and
thus providing a firmer foundation for periods of high growth.
As predicted from the literature review, though, it would be a mistake to see business
strategies – at least, their specific business model content – to be wholly within the
control of the lead firm. While Safaricom largely determined the timing and content of its
main strategic shifts, it had to increasingly contend with a network of technology and
actors of growing diversity and complexity. That network – seen as an innofusion
network – was the source of innovations and unexpected effects that forced the lead firm
to react, creating some incremental drifts in the specifics of its approach.
Scaling ICT innovations to poor groups will thus depend on how lead firms enable the
innofusion network, encourage innovation, and flexibly respond to the innovation that
emerges. This will include development of a ‘scaffold’ of structures and processes that
allows them to identify innovations and then take them down one of three routes: stifle,
ignore, or support by diffusing (perhaps also adapting).
Top-down shifts in strategy therefore become increasingly hard to diffuse as the ICT
innovation scales; a challenge for lead firms reflected in the patchy progress with
Safaricom’s standardisation. While necessary in order to maintain internal commitment
and external efficiency and control, this attempted institutionalisation of a particular way
of delivering the ICT system to the BoP therefore hangs in the balance. It is a reflection
not merely of the diffuse sites for innovation with the innofusion network, but also of the
diffusion of power during scaling. The image is a little much but there is still a whiff of
the lion-tamer trying to herd ten thousand cats, with lead firms begetting a network that
“grow’d like Topsy” and which they need to both facilitate but also control; the latter
being an increasing challenge.
Indeed, all of these activities, and each one of the stages, bring both challenges and
risks that the lead firm – and other innofusion actors – must negotiate. Such are these
risks that it may be worth stepping back to admire M-Pesa a little more. Though there
are dozens that have scaled, none of the other m-money initiatives worldwide has yet
been quite as successful. There have been a few studies trying to understand M-Pesa’s
success, but we hope our focus on the process of scaling and the key role of continuous

44
innovation has helped add some insights on this matter. It shows that – where ICT firms
can embrace an innofusion network perspective – niche projects can scale to be BoP-
focused disruptive innovations that drive core growth.
This is, though, just a single case study of ICT innovation and scaling for the bottom-of-
the-pyramid, and we look forward to further studies including those with government
and NGO leads. We can say at least that this case is not incompatible with other, more
descriptive discussions of ICT scaling for the BoP (e.g. Qiu, 2007; Anderson and Kupp,
2008), and that it has helped provide specific detail for many of the conceptualised
constructions that were built from earlier literature. Further studies of M-Pesa could also
look at the drivers to transition from one stage of scaling to the next, at the factors
shaping innovation, and at the subsequent stages for both m-transfers and m-money.
REFERENCES
AFI (2010) Enabling Mobile Money Transfer: The Central Bank of Kenya’s Treatment of
M-Pesa, Bangkok: Alliance for Financial Inclusion.
Anderson, J. (2008) Developing a Route to Market Strategy for Mobile Communications
in Rural India, International Journal of Emerging Markets 3(4): 339-347.
Anderson, J. (2010) M-banking in Developing Markets: competitive and regulatory
implications, info 12(1): 18–25.
Anderson, J. and Kupp, M. (2008) Serving the Poor: Drivers of business model
innovation in mobile, info 10(1): 5–12.
Antonelli, C. (2007) The Foundations of the Economics of Innovation, Working Paper no.
2, University of Turin, Italy: Dept. of Economics.
Arora, S. and Romijn, H. (2012) The Empty Rhetoric of Poverty Reduction at the Base of
the Pyramid, Organization 19(4): 481-505.
Bhatnagar, S.C. and Singh, N. (2010) Assessing the Impact of E-Government,
Information Technologies and International Development 6(2): 109-127.
Blumenfeld, P., Fishman, B.J., Krajcik, J., Marx, R.W. & Soloway, E. (2000) Creating
Usable Innovations in Systemic Reform, Educational Psychologist 35(3): 149-164.
Bolcskei, H., Nabar, R.U., Oyman, O. and Paulraj, A. (2006) Capacity Scaling Laws in
MIMO Relay Networks, IEEE Transactions on Wireless Communications 5(6): 1433-
1444.
Braa, J., Monteiro, E. and Sahay, S. (2004) Networks of Action: Sustainable health
information systems across developing countries, MIS Quarterly 28(3): 337–363.
Camner, G. and Sjöblom, E. (2009) Can the Success of M-Pesa Be Repeated: A Review
of the Implementations in Kenya and Tanzania, Nairobi: Valuable Bits.
CBK (2010) Guideline on Agent Banking, Government Guideline, CBK/PG/15, Nairobi:
Central Bank of Kenya.
CCK (2012) Quarterly Sector Statistics Report (April-June 2012), Nairobi:
Communications Commission of Kenya.
Ciborra, C. (1999) A Theory of Information Systems Based on Improvisation, in W.L.
Currie and R.D. Galliers (eds), Rethinking Management Information Systems, Oxford:
Oxford University Press, pp.136-155.

45
Dahan, N.M., Doh, J.P., Oetzel, J. and Yaziji, M. (2010) Corporate-NGO Collaboration:
Co-creating new business models for developing markets, Long Range Planning 43:
326-342.
Davidson, N. and Leishman, P. (2010) Building, Incentivising and Managing a Network of
Mobile Money Agents: A Handbook for Mobile Network Operators, London: GSM
Association.
DFID (2006) Progress of Funded Projects: November 2006, London: DFID.
Duncombe, R. and Boateng, R. (2009) Mobile Phones and Financial Services in
Developing Countries, Third World Quarterly 30(7): 1237-1258.
Edquist, C. (1997) Systems of Innovation Approaches: Their emergence and
characteristics, in C. Edquist (ed.), Systems of Innovation: Technologies, Institutions
and Organizations. London: Routledge, pp.1–35.
Eijkman, F., Kendall, J. and Mas, I. (2009) Bridging the Cash: The Retail End of M-PESA
- The Challenge of Maintaining Liquidity for M-PESA Agent Networks, London: GSM
Association.
Elias, M.J., Zins, J.E., Graczyk, P.A. and Weissberg, R.P. (2003) Implementation,
Sustainability, and Scaling Up of Social-Emotional and Academic Innovations in Public
Schools, School Psychology Review 32(3): 303-319.
FDCF (2006) Fund Managers Report on Progress of Funded Projects: Mobile Microfinance,
London: Financial Deepening Challenge Fund, DFID.
Flaming, M., McKay, C. and Pickens, M. (2011) Agent Management Toolkit, Washington,
DC: Consultative Group to Assist the Poor (CGAP), The World Bank.
Fleck, J. (1993) Innofusion: Feedback in the innovation process, in F.A. Stowell, D. West
& J.G. Howell (eds), Systems Science, New York: Plenum Press, pp.169-174.
Freeman, C. (1995) The “National System of Innovation” in Historical Perspective,
Cambridge Journal of Economics 19(1): 5–24.
FSD Kenya (2009) FinAccess National Survey 2009: Dynamics of Kenya’s Changing
Financial Landscape, Nairobi: Financial Sector Deepening Kenya.
Franzel, S., Cooper, P. and Denning, G.L. (2001) Scaling Up the Benefits of Agroforestry
Research, Development in Practice 11(4): 524-534.
Futterman, N.F. and Shuman, R.S. (2010) AppLab Question Box: A live voice information
service in rural Uganda, paper presented at ICTD2010 conference, Royal Holloway,
London, 13-16 Dec.
GSMA (2012) Mobile Money Tracker [www document].
http://www.mobilemoneylive.org/money-tracker (accessed 19 Nov 2012).
Haas, S., Plyler, M. and Nagarajan, G. (2010) Outreach of M-PESA System in Kenya:
Emerging Trends, College Park, MD: IRIS Center, University of Maryland.
Hartmann, A. and Linn, J. (2008) Scaling Up: A Framework and Lessons for
Development Effectiveness from Literature and Practice, Wolfensohn Center for
Development Working Paper 4, Washington, DC: Brookings Institute.
Heeks, R. (2002) Information Systems and Developing Countries: Failure, success, and
local improvisations, The Information Society 18(2): 101–112.
Heeks, R. (2008) ICT4D 2.0: The next phase of applying ICT for international
development, Computer 41(6): 26–33.
Holland, C.P. and Light, B. (1999) A Critical Success Factors Model for ERP
Implementation, IEEE Software 16(3): 30-36.
Hughes, N. and Lonie, S. (2007) M-PESA: Mobile money for the “unbanked” turning
cellphones into 24-hour tellers in Kenya, Innovations 2(1-2): 63–81.
IIRR (2000) Going to Scale: Can We Bring More Benefits to More People More Quickly?,
Silong, Philippines: International Institute of Rural Reconstruction.
Jack, W. and Suri, T. (2009) The Economics of M-Pesa, Boston, MA: MIT Sloan.
Jack, W. and Suri, T. (2010) The Economics of M-Pesa: An Update, Boston, MA: MIT
Sloan.
Jacucci, E., Shaw, V. and Braa, J. (2006) Standardization of Health Information Systems
in South Africa: The challenge of local sustainability, Information Technology for
Development 12(3): 225–239.

46
KNBS (2012) Kenyan Consumer Price Index, Nairobi: Kenya National Bureau of Statistics
[www document] http://www.knbs.or.ke/consumerpriceindex.php (accessed 19 Nov
2012).
Kolk, A., Rivera-Santos, M. and Rufın, C. (2010) What do we really know about the Base
of the Pyramid? A review and research agenda, paper presented at the Academy of
Management Annual Conference, Montreal, 6-10 August.
Kuriyan, R., Ray, I. and Toyama, K. (2008) Information and Communication
Technologies for Development: The Bottom of the Pyramid Model in Practice, The
Information Society 24(2): 93-104.
Kwama, K. (2006) The Next Big Thing, The Standard, Nairobi, Kenya, 30th Oct.
Leishman, P. (2010) Is there any Money in Mobile Money?, London: GSM Association.
Leishman, P. (2010a) True Money and M-PESA: Two Unique Paths to Scale, London:
GSM Association.
London, T. (2009) Business Model R&D for New Market Entry, Working Paper, Ann Arbor,
MI: William Davidson Institute, University of Michigan.
London, T. and Hart, S.L. (2004) Reinventing Strategies for Emerging Markets: Beyond
the transnational model, Journal of International Business Studies 35(5): 350–370.
Lonie, S. (2010) Innovations in Rural and Agricultural Finance: M-PESA: Finding New
Ways to Serve the Unbanked in Kenya, Brief 8, Washington, DC: International Food
Policy Research Institute.
Lundvall, B.A. and Intarakumnerd, P. (2006) Asia’s Innovation Systems in Transition.
Cheltenham, UK: Edward Elgar Publishing.
Lundvall, B.A., Joseph, K. and Chaminade, C. (2009a) Handbook on Innovation Systems
and Developing Countries: Building Domestic Capabilities in a Global Context.
Cheltenham, UK: Edward Elgar Publishing.
Lundvall, B.A., Vang, J., Joseph, K. and Chaminade, C. (2009b) Innovation System
Research and Developing Countries, in B. A. Lundvall (ed.), Handbook on Innovation
Systems and Developing Countries: Building Domestic Capabilities in a Global
Context. Cheltenham, UK: Edward Elgar Publishing, pp.1–33.
Magnette, N. and Lock, D. (2005) Scaling Microfinance with the Remote Transaction
System, Washington, DC: World Resources Institute.
Mair, J. & Schoen, O. (2007) Successful Social Entrepreneurial Business Models in the
Context of Developing Economies: An explorative study, International Journal of
Emerging Markets 2(1): 54-68.
Mas, I. and Morawczynski, O. (2009) Designing Mobile Money Services: Lessons from M-
PESA, Innovations 4(2): 77–91.
Mas, I. and Ng’weno, A. (2010) Three Keys to M-Pesa’s Success: Branding, channel
management and pricing, Journal of Payments Strategy & Systems 4(4): 352–370.
Mas, I. & Radcliffe, D. (2010) Scaling Mobile Money, Seattle, WA: Bill & Melinda Gates
Foundation.
Monteiro, E. (1998) Scaling Information Infrastructure: The case of next-generation IP in
the Internet, The Information Society 14(3): 229–245.
Morawczynski, O. (2010) Examining the Adoption, Usage and Outcomes of Mobile Money
Services: The Case of M-PESA in Kenya. PhD Thesis. Edinburgh: University of
Edinburgh.
Morawczynski, O. and Pickens, M. (2009) Poor People Using Mobile Financial Services:
Observations on Customer Usage and Impact from M-Pesa, Brief, Washington, DC:
Consultative Group to Assist the Poor (CGAP), The World Bank.
Nakata, C. and Weidner, K. (2012) Enhancing New Product Adoption at the Base of the
Pyramid: A contextualized model, Journal of Product Innovation Management, 29(1):
21-32.
Omwansa, T. (2009) M-PESA: Progress and prospects, Innovations Special Edition for
GSMA Mobile World Congress 2009: 107-123.
Orlikowski, W. and Iacono, C.S. (2001) Desperately Seeking the “IT” in IT Research: A
call to theorizing the IT artifact, Information Systems Research 12(2): 121-134.

47
Pickens, M., Rotman, S., Mas, I. and Morawczynski, O. (2009) Agent Economics: M-
PESA, Washington, DC: Consultative Group to Assist the Poor (CGAP), The World
Bank.
Pitta, D.A., Guesalaga, R. and Marshall, P. (2008) The Quest for the Fortune at the
Bottom of the Pyramid: Potential and challenges, Journal of Consumer Marketing
25(7): 393-401.
Prahalad, C.K. (2009) The Fortune at the Bottom of the Pyramid: Eradicating Poverty
Through Profits, 5th Anniversary ed, Philadelphia, PA: Wharton School Publishing.
Prahalad, C.K. (2012) Bottom of the Pyramid as a Source of Breakthrough Innovations,
Journal of Product Innovation Management 29(1): 6-12.
Qiu, J.L. (2007) The Accidental Accomplishment of Little Smart: Understanding the
emergence of a working-class ICT, New Media & Society 9(6): 903–923.
Ramani, S.V., SadreGhazi, S. and Duysters, G. (2012) On the Diffusion of Toilets as
Bottom of the Pyramid Innovation, Technological Forecasting and Social Change
79(4): 676-687.
Ramirez, R. (1999) Value Co-Production: Intellectual origins and implications for practice
and research, Strategic Management Journal 20(1): 49-65.
Rogers, E.M. (1962) Diffusion of Innovations, New York, NY: Free Press.
Rogers, E.M. (2003) Diffusion of Innovations, 5th edn., New York, NY: Free Press.
Safaricom (2011) M-PESA Customer and Agent Numbers [www document].
http://www.safaricom.co.ke/index.php?id=1073 (accessed 5 April 2012).
Safaricom (2012a) Safaricom: Financial Reports [www document].
http://www.safaricom.co.ke/about-us/investor-relations/annual-reports-pdf
(accessed 19 Nov 2012).
Safaricom (2012b) Press Release: Safaricom Targets Low Income Users in First Ever M-
Pesa Tariff Reduction [www document].
http://www.safaricom.co.ke/index.php?id=1591 (accessed 5 April 2012).
Safaricom (2012c) Celebrating 5 Years of M-Pesa [www document].
https://squaddigital.com/beta/safaricom/facebook/saftimelineiframe/pdf/infograph.p
df (accessed 19 Nov 2012).
Sahay, S. and Walsham, G. (2006) Scaling of Health Information Systems in India:
Challenges and approaches, Information Technology for Development 12(3): 185–
200.
Sarker, S., Sarker, S., Sahaym, A. and Bjorn-Andersen, N. (2012) Exploring Value
Cocreation in Relationships between an ERP Vendor and its Partners: A revelatory
case study, MIS Quarterly 36(1): 317-338.
Schumpeter, J.A. (1939) Business Cycles: A Theoretical, Historical and Statistical
Analysis of the Capitalist Process, New York, NY: McGraw-Hill.
Schumpeter, J.A. (1947) The Creative Response in Economic History, The Journal of
Economic History 7(2): 149-159.
Simanis, E. and Hart, S. (2009) Innovation from the Inside Out, MIT Sloan Management
Review 50(4): 78–86.
Simon, J.P. (2011) The ICT Landscape in BRICS Countries, Seville: Institute for
Prospective Technological Studies.
Smits, S., Moriarty, P. and Sijbesma, C. (eds) (2007). Learning Alliances: Scaling-up
Innovations in Water, Sanitation and Hygiene. Delft, The Netherlands: IRC
International Water and Sanitation Centre.
Stuart, G. and Cohen, M. (2011) Cash In, Cash Out Kenya: The Role of MPESA in the
Lives of Low Income People, College Park, MD: IRIS Center, University of Maryland.
Tjornehoj, G. & Mathiassen, L. (2010) Improvisation During Process-Technology
Adoption, Journal of Information Technology 25(1): 20-34.
Tomasic, A., Raschid, L. and Valduriez, P. (1995) Scaling Heterogeneous Databases and
the Design of Disco, Rocquencourt, France: INRIA.
Uvin, P., Jain, P.S. and Brown, L.D. (2000) Think Large and Act Small: Toward a new
paradigm for NGO scaling up, World Development 28(8): 1409-1419.

48
Vodafone Group (2007) Mobile Account Management, Patent Number WO2007020394
[www document] http://patentscope.wipo.int/search/en/WO2007020394 (accessed
19 Nov 2012).
Walsham, G. and Sahay, S. (2006) Research on Information Systems in Developing
Countries: Current landscape and future prospects, Information Technology for
Development 12(1): 7-24.
Wambugu, C., Place, F. and Franzel, S. (2011) Research, Development and Scaling-Up
the Adoption of Fodder Shrub Innovations in East Africa, International Journal of
Agricultural Sustainability 9(1): 100-109.
World Bank (2011) Information & Communication Technologies, Sector Strategy
Approach Paper, Washington, DC: World Bank.
Top Related