


Languages
Pages
Legal

Page No
Condensed Consolidated Balance Sheet ……………………………………………………………………………………………..1
Condensed Consolidated Statements of Comprehensive Income…………………………………………………..……………..2
Condensed Consolidated Statements of Changes in Equity………………………………………………………..……………..3
Condensed Consolidated Statements of Cash Flows………………………………………………………………………………..4
Overview and notes to the financial statements
1. Overview
1.1 Company Overview………………………………………………………………………………………………………………..5
1.2 Basis of preparation of financial statements………………………………………………………………………………..5
1.3 Basis of consolidation………………………..…………………………………………………………………………………..5
1.4 Use of estimates and judgments………………………………………………………………………………………………..5
1.5 Critical accounting estimates……………………………………………………………………………………………………..5
1.6 Recent Accounting pronouncements…………………………………………………………………………………………..6
2. Notes to the Condensed Consolidated Financial Statements
2.1 Cash and cash equivalents ………………………………………………………………………………………………………..7
2.2 Investments ………………………………………………………………………………………………………..……………..8
2.3 Financial instruments …………………………………………………………………………………………………………..10
2.4 Prepayments and other assets……………………………………………………………………………………..……………..18
2.5 Other liabilities………………………………………………………………………………………………….……………..19
2.6 Provisions …………………………………………………………………………………………………………..……………..19
2.7 Property, plant and equipment………………………………………………………………………………….……………..21
2.8 Goodwill…………………………………………………………………………………………………………….……………..23
2.9 Business combination and Disposal Group held for sale…………………………………………………..……………..24
2.10 Employees' Stock Option Plans (ESOP) ……………………………………………………………………….……………..27
2.11 Income taxes…………………………………………………………………………………………………………………..30
2.12 Reconciliation of basic and diluted shares used in computing earnings per share………………………………………..31
2.13 Related party transactions ……………………………………………………………………………………………………..32
2.14 Segment Reporting………………………………………………………………………………………………………………..33
2.15 Revenue from Operations……………………………………………………………………………………………………..35
2.16 Break-up of expenses and other income, net…………………………………………………………………………………..38
2.17 Capital allocation policy………………………………………………………………………………………………………..40
2.18 Share capital and share premium………………………………………………………………………………………………..40
INFOSYS LIMITED AND SUBSIDIARIES
Condensed Consolidated Financial Statements under
International Financial Reporting Standards (IFRS) in US Dollars
for the three months and six months ended September 30, 2018
Index
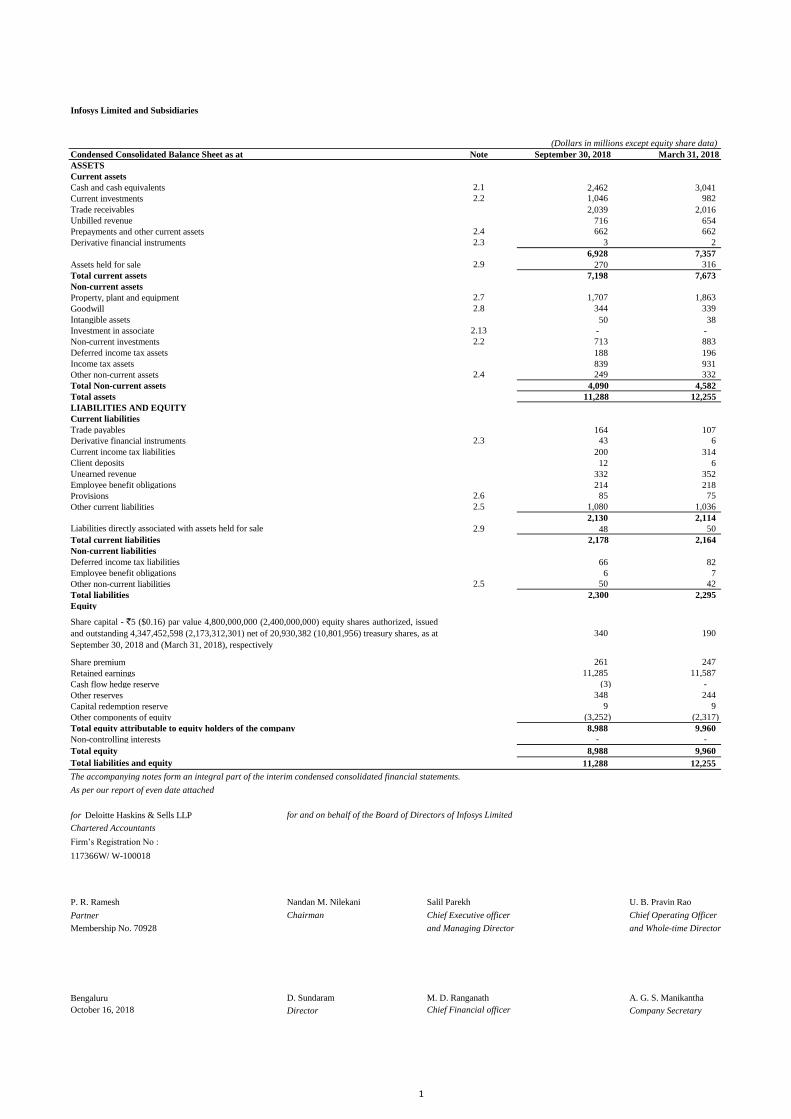
Infosys Limited and Subsidiaries
(Dollars in millions except equity share data)
Condensed Consolidated Balance Sheet as at Note September 30, 2018 March 31, 2018
ASSETS
Current assets
Cash and cash equivalents 2.1 2,462 3,041
Current investments 2.2 1,046 982
Trade receivables 2,039 2,016
Unbilled revenue 716 654
Prepayments and other current assets 2.4 662 662
Derivative financial instruments 2.3 3 2
6,928 7,357
Assets held for sale 2.9 270 316
Total current assets 7,198 7,673
Non-current assets
Property, plant and equipment 2.7 1,707 1,863
Goodwill 2.8 344 339
Intangible assets 50 38
Investment in associate 2.13 - -
Non-current investments 2.2 713 883
Deferred income tax assets 188 196
Income tax assets 839 931
Other non-current assets 2.4 249 332
Total Non-current assets 4,090 4,582
Total assets 11,288 12,255
LIABILITIES AND EQUITY
Current liabilities
Trade payables 164 107
Derivative financial instruments 2.3 43 6
Current income tax liabilities 200 314
Client deposits 12 6
Unearned revenue 332 352
Employee benefit obligations 214 218
Provisions 2.6 85 75
Other current liabilities 2.5 1,080 1,036
2,130 2,114
2.9 48 50
Total current liabilities 2,178 2,164
Non-current liabilities
Deferred income tax liabilities 66 82
Employee benefit obligations 6 7
Other non-current liabilities 2.5 50 42
Total liabilities 2,300 2,295
Equity
Share premium 261 247
Retained earnings 11,285 11,587
Cash flow hedge reserve (3) -
Other reserves 348 244
Capital redemption reserve 9 9
Other components of equity (3,252) (2,317)
Total equity attributable to equity holders of the company 8,988 9,960
Non-controlling interests - -
Total equity 8,988 9,960
Total liabilities and equity 11,288 12,255
The accompanying notes form an integral part of the interim condensed consolidated financial statements.
As per our report of even date attached
for Deloitte Haskins & Sells LLP for and on behalf of the Board of Directors of Infosys Limited
Chartered Accountants
Firm’s Registration No :
117366W/ W-100018
P. R. Ramesh Nandan M. Nilekani Salil Parekh U. B. Pravin Rao
Partner Chairman Chief Executive officer Chief Operating Officer
Membership No. 70928 and Managing Director and Whole-time Director
Bengaluru D. Sundaram M. D. Ranganath A. G. S. Manikantha
October 16, 2018 Director Chief Financial officer Company Secretary
Share capital - `5 ($0.16) par value 4,800,000,000 (2,400,000,000) equity shares authorized, issued
and outstanding 4,347,452,598 (2,173,312,301) net of 20,930,382 (10,801,956) treasury shares, as at
September 30, 2018 and (March 31, 2018), respectively
340 190
Liabilities directly associated with assets held for sale
1

Infosys Limited and Subsidiaries
(Dollars in millions except equity share and per equity share data)
Condensed Consolidated Statements of Comprehensive Income Note
2018 2017 2018 2017
Revenues 2.15 2,921 2,728 5,753 5,379
Cost of sales 2.16 1,884 1,743 3,703 3,435
Gross profit 1,037 985 2,050 1,944
Operating expenses:
Selling and marketing expenses 2.16 154 132 303 269
Administrative expenses 2.16 191 194 384 377
Total operating expenses 345 326 687 646
Operating profit 692 659 1,363 1,298
Other income, net 2.16 105 137 212 263
Reduction in the fair value of Disposal Group held for sale 2.9 - - (39) -
Share in net profit/(loss) of associate, including impairment - - - (11)
Profit before income taxes 797 796 1,536 1,550
Income tax expense 2.11 216 218 420 431
Net profit 581 578 1,116 1,119
Other comprehensive income
Items that will not be reclassified subsequently to profit or loss:
Re-measurements of the net defined benefit liability/asset, net 1 1 1 1
Equity instruments through other comprehensive income, net 2 - 2 -
3 1 3 1
Items that will be reclassified subsequently to profit or loss:
Fair valuation of investments, net 2.2 (2) 2 (9) 6
(4) 3 (3) (7)
Foreign currency translation (461) (107) (929) (47)
(467) (102) (941) (48)
Total other comprehensive income/(loss), net of tax (464) (101) (938) (47)
Total comprehensive income 117 477 178 1,072
Profit attributable to:
Owners of the company 581 578 1,116 1,119
Non-controlling interests - - - -
581 578 1,116 1,119 Total comprehensive income attributable to:
Owners of the company 117 477 178 1,072
Non-controlling interests - - - -
117 477 178 1,072 Earnings per equity share
Basic ($) 0.13 0.13 0.26 0.24
Diluted ($) 0.13 0.13 0.26 0.24
Weighted average equity shares used in computing earnings
per equity share2.12
Basic 4,347,055,177 4,571,730,722 4,346,857,296 4,571,524,372
Diluted 4,352,208,472 4,575,052,366 4,351,915,210 4,575,765,068
The accompanying notes form an integral part of the interim condensed consolidated financial statements.
As per our report of even date attached
for Deloitte Haskins & Sells LLP for and on behalf of the Board of Directors of Infosys Limited
Chartered Accountants
Firm’s Registration No :
117366W/ W-100018
P. R. Ramesh Nandan M. Nilekani Salil Parekh U. B. Pravin Rao
Partner Chairman Chief Executive officer Chief Operating Officer
Membership No. 70928 and Managing Director and Whole-time Director
Bengaluru D. Sundaram M. D. Ranganath A. G. S. Manikantha
October 16, 2018 Director Chief Financial Officer Company Secretary
Six months ended September 30,
Fair value changes on derivatives designated as cash flow hedge, net
Three months ended September 30,
2
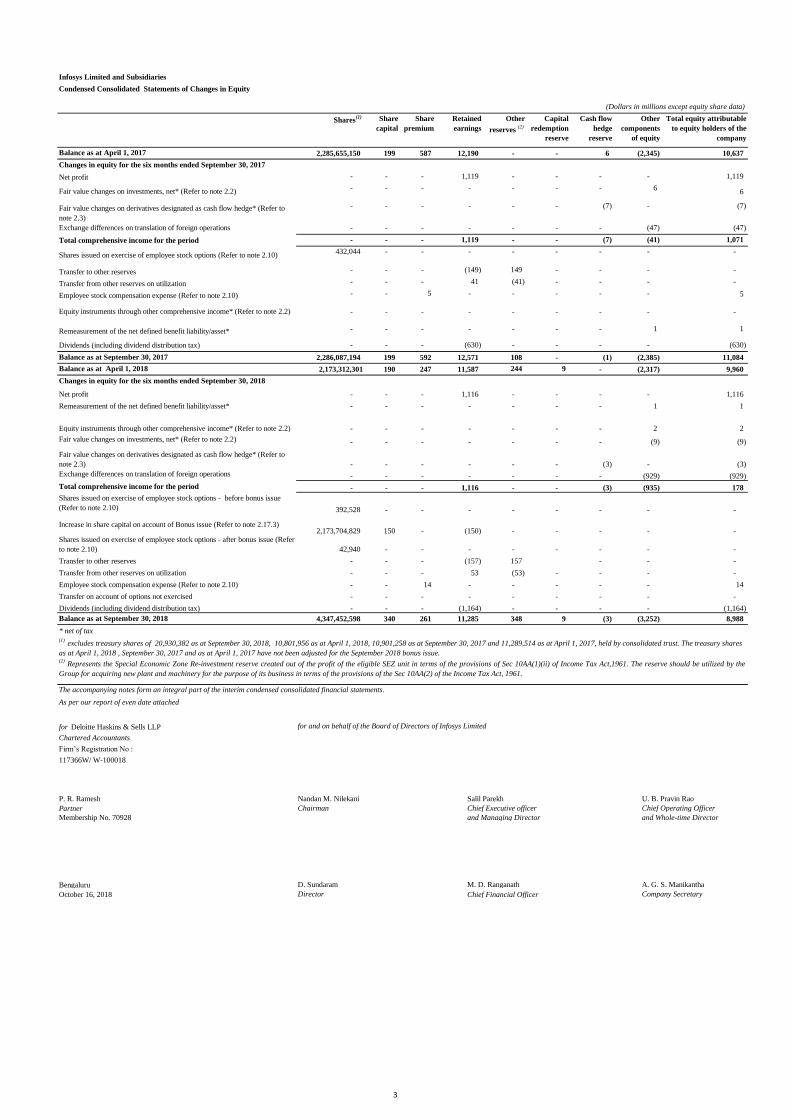
Infosys Limited and Subsidiaries
Condensed Consolidated Statements of Changes in Equity
Shares(1) Share
capital
Share
premium
Retained
earnings
Other
reserves (2)
Capital
redemption
reserve
Cash flow
hedge
reserve
Other
components
of equity
Total equity attributable
to equity holders of the
company
2,285,655,150 199 587 12,190 - - 6 (2,345) 10,637
Net profit - - - 1,119 - - - - 1,119
- - - - - - - 6 6
- - - - - - (7) - (7)
- - - - - - - (47) (47)
Total comprehensive income for the period - - - 1,119 - - (7) (41) 1,071
432,044 - - - - - - - -
Transfer to other reserves - - - (149) 149 - - - -
Transfer from other reserves on utilization - - - 41 (41) - - - -
Employee stock compensation expense (Refer to note 2.10) - - 5 - - - - - 5
- - - - - - - - -
- - - - - - - 1 1
- - - (630) - - - - (630)
2,286,087,194 199 592 12,571 108 - (1) (2,385) 11,084
2,173,312,301 190 247 11,587 244 9 - (2,317) 9,960
Net profit - - - 1,116 - - - - 1,116
- - - - - - - 1 1
- - - - - - - 2 2
- - - - - - - (9) (9)
- - - - - - (3) - (3)
- - - - - - - (929) (929)
Total comprehensive income for the period - - - 1,116 - - (3) (935) 178
392,528 - - - - - - - -
2,173,704,829 150 - (150) - - - - -
42,940 - - - - - - - -
Transfer to other reserves - - - (157) 157 - - -
Transfer from other reserves on utilization - - - 53 (53) - - - -
Employee stock compensation expense (Refer to note 2.10) - - 14 - - - - - 14
Transfer on account of options not exercised - - - - - - - - -
- - - (1,164) - - - - (1,164)
4,347,452,598 340 261 11,285 348 9 (3) (3,252) 8,988
* net of tax
As per our report of even date attached
for Deloitte Haskins & Sells LLP
Chartered Accountants
Firm’s Registration No :
117366W/ W-100018
P. R. Ramesh Nandan M. Nilekani Salil Parekh U. B. Pravin Rao
Partner Chairman Chief Executive officer Chief Operating Officer
Membership No. 70928 and Managing Director and Whole-time Director
Bengaluru D. Sundaram M. D. Ranganath A. G. S. Manikantha
October 16, 2018 Director Chief Financial Officer Company Secretary
(1) excludes treasury shares of 20,930,382 as at September 30, 2018, 10,801,956 as at April 1, 2018, 10,901,258 as at September 30, 2017 and 11,289,514 as at April 1, 2017, held by consolidated trust. The treasury shares
as at April 1, 2018 , September 30, 2017 and as at April 1, 2017 have not been adjusted for the September 2018 bonus issue.
(Dollars in millions except equity share data)
Changes in equity for the six months ended September 30, 2017
Remeasurement of the net defined benefit liability/asset*
Dividends (including dividend distribution tax)
Balance as at April 1, 2017
Equity instruments through other comprehensive income* (Refer to note 2.2)
Fair value changes on investments, net* (Refer to note 2.2)
Fair value changes on derivatives designated as cash flow hedge* (Refer to
note 2.3)
Shares issued on exercise of employee stock options (Refer to note 2.10)
Exchange differences on translation of foreign operations
Increase in share capital on account of Bonus issue (Refer to note 2.17.3)
Shares issued on exercise of employee stock options - before bonus issue
(Refer to note 2.10)
Balance as at September 30, 2017
Balance as at September 30, 2018
Remeasurement of the net defined benefit liability/asset*
(2)Represents the Special Economic Zone Re-investment reserve created out of the profit of the eligible SEZ unit in terms of the provisions of Sec 10AA(1)(ii) of Income Tax Act,1961. The reserve should be utilized by the
Group for acquiring new plant and machinery for the purpose of its business in terms of the provisions of the Sec 10AA(2) of the Income Tax Act, 1961.
The accompanying notes form an integral part of the interim condensed consolidated financial statements.
Changes in equity for the six months ended September 30, 2018
Dividends (including dividend distribution tax)
Exchange differences on translation of foreign operations
Balance as at April 1, 2018
Shares issued on exercise of employee stock options - after bonus issue (Refer
to note 2.10)
for and on behalf of the Board of Directors of Infosys Limited
Fair value changes on derivatives designated as cash flow hedge* (Refer to
note 2.3)
Equity instruments through other comprehensive income* (Refer to note 2.2)
Fair value changes on investments, net* (Refer to note 2.2)
3

Infosys Limited and Subsidiaries
Condensed Consolidated Statements of Cash Flows
Accounting Policy
(Dollars in millions)
Note
2018 2017
Operating activities:
Net Profit 1,116 1,119
Depreciation and amortization 2.16 130 141
Interest and dividend income (58) (73)
Income tax expense 2.11 420 431
Effect of exchange rate changes on assets and liabilities 8 (2)
Impairment loss under expected credit loss model 21 6
Reduction in the fair value of Disposal Group held for sale 2.9 39 -
Stock compensation expense 14 5
Other adjustments (9) (6)
Changes in working capital
Trade receivables and unbilled revenue (387) (251)
Prepayments and other assets (17) (7)
Trade payables 71 25
Client deposits 7 (3)
Unearned revenue 13 34
Other liabilities and provisions 229 102
Cash generated from operations 1,597 1,521
Income taxes paid (528) (436)
Net cash provided by operating activities 1,069 1,085
Investing activities:
(157) (149)
Loans to employees 1 3
Deposits placed with corporation (2) (3)
Interest and dividend received 46 34
Payment towards acquisition of business, net of cash acquired 2.9 (30) (4)
Payment of contingent consideration pertaining to acquisition of business (1) (5)
Investment in equity and preference securities (3) (2)
Investment in others (1) (2)
Investment in quoted debt securities (2) (16)
Redemption of quoted debt securities 45 1
Investment in certificate of deposits (183) (66)
Redemption of certificate of deposits 137 275
Redemption of commercial papers 43 -
Investment in liquid mutual fund units and fixed maturity plan securities (5,729) (4,000)
Redemption of liquid mutual fund units and fixed maturity plan securities 5,626 3,581
Net cash used in investing activities (210) (353)
Financing activities:
Payment of dividend including corporate dividend tax (1,164) (630)
Net cash used in financing activities (1,164) (630)
Effect of exchange rate changes on cash and cash equivalents (273) (16)
Net increase / (decrease) in cash and cash equivalents (305) 102
Cash and cash equivalents at the beginning of the period 2.1 3,049 3,489
Cash and cash equivalents at the end of the period 2.1 2,471 3,575
Supplementary information:
Restricted cash balance 2.1 45 85
The accompanying notes form an integral part of the interim condensed consolidated financial statements
As per our report of even date attached
for Deloitte Haskins & Sells LLP for and on behalf of the Board of Directors of Infosys Limited
Chartered Accountants
Firm’s Registration No :
117366W/ W-100018
P. R. Ramesh Nandan M. Nilekani Salil Parekh U. B. Pravin Rao
Partner Chairman Chief Executive officer Chief Operating Officer
Membership No. 70928 and Managing Director and Whole-time Director
Bengaluru D. Sundaram M. D. Ranganath A. G. S. Manikantha
October 16, 2018 Director Chief Financial Officer Company Secretary
Cash flows are reported using the indirect method, whereby profit for the period is adjusted for the effects of transactions of a non-cash nature, any deferrals or accruals of past or future operating cash
receipts or payments and item of income or expenses associated with investing or financing cash flows. The cash flows from operating, investing and financing activities of the Group are segregated.
The Group considers all highly liquid investments that are readily convertible to known amounts of cash to be cash equivalents.
Particulars Six Months ended September 30,
Adjustments to reconcile net profit to net cash provided by operating activities :
Expenditure on property, plant and equipment
4

Notes to the interim condensed consolidated financial statements
1. Overview
1.1 Company overview
Infosys Limited ('the Company' or Infosys) is a leading provider of consulting, technology, outsourcing and next-generation digital services, enabling clients to execute strategies for
their digital transformation. Infosys strategic objective is to build a sustainable organization that remains relevant to the agenda of clients, while creating growth opportunities for
employees and generating profitable returns for investors. Infosys strategy is to be a navigator for our clients as they ideate, plan and execute on their journey to a digital future.
Infosys together with its subsidiaries and controlled trusts is herein after referred to as the "Group".
The company is a public limited company incorporated and domiciled in India and has its registered office at Bengaluru, Karnataka, India. The company has its primary listings on
the BSE Ltd. and National Stock Exchange of India Limited. The company’s American Depositary Shares (ADS) representing equity shares are listed on the New York Stock
Exchange (NYSE).
Further, the company's ADS were also listed on the Euronext London and Euronext Paris. On July 5, 2018, the company voluntarily delisted its ADS from the said exchanges due
to low average daily trading volume of its ADS on these exchanges.
The Group's interim condensed consolidated financial statements are authorized for issue by the company's Board of Directors on October 16, 2018.
1.2 Basis of preparation of financial statements
These interim condensed consolidated financial statements have been prepared in compliance with IAS 34, Interim Financial Reporting as issued by the International Accounting
Standards Board (IASB), under the historical cost convention on the accrual basis except for certain financial instruments which have been measured at fair values. Accordingly,
these condensed consolidated financial statements do not include all the information required for a complete set of financial statements. These condensed consolidated financial
statements should be read in conjunction with the consolidated financial statements and related notes included in the company’s Annual Report on Form 20-F for the year ended
March 31, 2018. Accounting policies have been applied consistently to all periods presented in these interim condensed consolidated financial statements.
As the quarter and year-to-date figures are taken from the source and rounded to the nearest digits, the quarter figures in this statement added up to the figures reported for the
previous quarters might not always add up to the year-to-date figures reported in this statement.
1.3 Basis of consolidation
Infosys consolidates entities which it owns or controls. The interim condensed consolidated financial statements comprise the financial statements of the company, its controlled
trusts and its subsidiaries. Control exists when the parent has power over the entity, is exposed, or has rights, to variable returns from its involvement with the entity and has the
ability to affect those returns by using its power over the entity. Power is demonstrated through existing rights that give the ability to direct relevant activities, those which
significantly affect the entity's returns. Subsidiaries are consolidated from the date control commences until the date control ceases.
The financial statements of the Group companies are consolidated on a line-by-line basis and intra-group balances and transactions including unrealized gain / loss from such
transactions are eliminated upon consolidation. These financial statements are prepared by applying uniform accounting policies in use at the Group. Non-controlling interests which
represent part of the net profit or loss and net assets of subsidiaries that are not, directly or indirectly, owned or controlled by the company, are excluded.
1.4 Use of estimates and judgments
The preparation of the financial statements in conformity with IFRS requires management to make estimates, judgments and assumptions. These estimates, judgments and
assumptions affect the application of accounting policies and the reported amounts of assets and liabilities, the disclosures of contingent assets and liabilities at the date of the
financial statements and reported amounts of revenues and expenses during the period. Application of accounting policies that require critical accounting estimates involving
complex and subjective judgments and the use of assumptions in these financial statements have been disclosed in Note 1.5. Accounting estimates could change from period to
period. Actual results could differ from those estimates. Appropriate changes in estimates are made as management becomes aware of changes in circumstances surrounding the
estimates. Changes in estimates are reflected in the financial statements in the period in which changes are made and, if material, their effects are disclosed in the notes to the
condensed consolidated financial statements.
1.5 Critical accounting estimates
a. Revenue recognition
The group uses the percentage-of-completion method in accounting for its fixed-price contracts. Use of the percentage-of-completion method requires the group to estimate the
efforts or costs expended to date as a proportion of the total efforts or costs to be expended. Efforts or costs expended have been used to measure progress towards completion as
there is a direct relationship between input and productivity.
Further, the Group uses significant judgements while determining the transaction price allocated to performance obligations using the expected cost plus margin approach.
Provisions for estimated losses, if any, on uncompleted contracts are recorded in the period in which such losses become probable based on the expected contract estimates at the
reporting date.
b. Income taxes
The company's two major tax jurisdictions are India and the U.S., though the company also files tax returns in other overseas jurisdictions. Significant judgments are involved in
determining the provision for income taxes, including amount expected to be paid/recovered for uncertain tax positions
In assessing the realizability of deferred income tax assets, management considers whether some portion or all of the deferred income tax assets will not be realized. The ultimate
realization of deferred income tax assets is dependent upon the generation of future taxable income during the periods in which the temporary differences become deductible.
Management considers the scheduled reversals of deferred income tax liabilities, projected future taxable income and tax planning strategies in making this assessment. Based on
the level of historical taxable income and projections for future taxable income over the periods in which the deferred income tax assets are deductible, management believes that
the group will realize the benefits of those deductible differences. The amount of the deferred income tax assets considered realizable, however, could be reduced in the near term if
estimates of future taxable income during the carry forward period are reduced. (also refer to note 2.11).
5
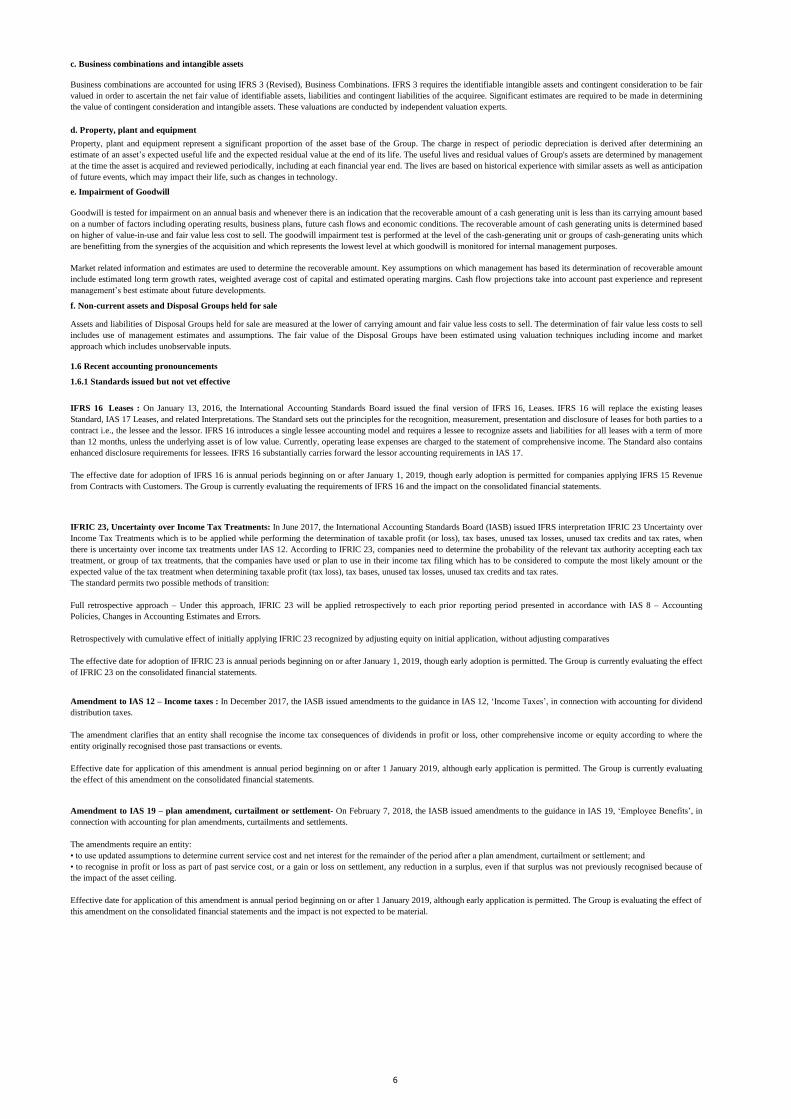
c. Business combinations and intangible assets
Business combinations are accounted for using IFRS 3 (Revised), Business Combinations. IFRS 3 requires the identifiable intangible assets and contingent consideration to be fair
valued in order to ascertain the net fair value of identifiable assets, liabilities and contingent liabilities of the acquiree. Significant estimates are required to be made in determining
the value of contingent consideration and intangible assets. These valuations are conducted by independent valuation experts.
d. Property, plant and equipment
Property, plant and equipment represent a significant proportion of the asset base of the Group. The charge in respect of periodic depreciation is derived after determining an
estimate of an asset’s expected useful life and the expected residual value at the end of its life. The useful lives and residual values of Group's assets are determined by management
at the time the asset is acquired and reviewed periodically, including at each financial year end. The lives are based on historical experience with similar assets as well as anticipation
of future events, which may impact their life, such as changes in technology.
e. Impairment of Goodwill
Goodwill is tested for impairment on an annual basis and whenever there is an indication that the recoverable amount of a cash generating unit is less than its carrying amount based
on a number of factors including operating results, business plans, future cash flows and economic conditions. The recoverable amount of cash generating units is determined based
on higher of value-in-use and fair value less cost to sell. The goodwill impairment test is performed at the level of the cash-generating unit or groups of cash-generating units which
are benefitting from the synergies of the acquisition and which represents the lowest level at which goodwill is monitored for internal management purposes.
Market related information and estimates are used to determine the recoverable amount. Key assumptions on which management has based its determination of recoverable amount
include estimated long term growth rates, weighted average cost of capital and estimated operating margins. Cash flow projections take into account past experience and represent
management’s best estimate about future developments.
f. Non-current assets and Disposal Groups held for sale
Assets and liabilities of Disposal Groups held for sale are measured at the lower of carrying amount and fair value less costs to sell. The determination of fair value less costs to sell
includes use of management estimates and assumptions. The fair value of the Disposal Groups have been estimated using valuation techniques including income and market
approach which includes unobservable inputs.
1.6 Recent accounting pronouncements
1.6.1 Standards issued but not yet effective
IFRS 16 Leases : On January 13, 2016, the International Accounting Standards Board issued the final version of IFRS 16, Leases. IFRS 16 will replace the existing leases
Standard, IAS 17 Leases, and related Interpretations. The Standard sets out the principles for the recognition, measurement, presentation and disclosure of leases for both parties to a
contract i.e., the lessee and the lessor. IFRS 16 introduces a single lessee accounting model and requires a lessee to recognize assets and liabilities for all leases with a term of more
than 12 months, unless the underlying asset is of low value. Currently, operating lease expenses are charged to the statement of comprehensive income. The Standard also contains
enhanced disclosure requirements for lessees. IFRS 16 substantially carries forward the lessor accounting requirements in IAS 17.
The effective date for adoption of IFRS 16 is annual periods beginning on or after January 1, 2019, though early adoption is permitted for companies applying IFRS 15 Revenue
from Contracts with Customers. The Group is currently evaluating the requirements of IFRS 16 and the impact on the consolidated financial statements.
IFRIC 23, Uncertainty over Income Tax Treatments: In June 2017, the International Accounting Standards Board (IASB) issued IFRS interpretation IFRIC 23 Uncertainty over
Income Tax Treatments which is to be applied while performing the determination of taxable profit (or loss), tax bases, unused tax losses, unused tax credits and tax rates, when
there is uncertainty over income tax treatments under IAS 12. According to IFRIC 23, companies need to determine the probability of the relevant tax authority accepting each tax
treatment, or group of tax treatments, that the companies have used or plan to use in their income tax filing which has to be considered to compute the most likely amount or the
expected value of the tax treatment when determining taxable profit (tax loss), tax bases, unused tax losses, unused tax credits and tax rates.
The standard permits two possible methods of transition:
Full retrospective approach – Under this approach, IFRIC 23 will be applied retrospectively to each prior reporting period presented in accordance with IAS 8 – Accounting
Policies, Changes in Accounting Estimates and Errors.
Retrospectively with cumulative effect of initially applying IFRIC 23 recognized by adjusting equity on initial application, without adjusting comparatives
The effective date for adoption of IFRIC 23 is annual periods beginning on or after January 1, 2019, though early adoption is permitted. The Group is currently evaluating the effect
of IFRIC 23 on the consolidated financial statements.
Amendment to IAS 12 – Income taxes : In December 2017, the IASB issued amendments to the guidance in IAS 12, ‘Income Taxes’, in connection with accounting for dividend
distribution taxes.
The amendment clarifies that an entity shall recognise the income tax consequences of dividends in profit or loss, other comprehensive income or equity according to where the
entity originally recognised those past transactions or events.
Effective date for application of this amendment is annual period beginning on or after 1 January 2019, although early application is permitted. The Group is currently evaluating
the effect of this amendment on the consolidated financial statements.
Amendment to IAS 19 – plan amendment, curtailment or settlement- On February 7, 2018, the IASB issued amendments to the guidance in IAS 19, ‘Employee Benefits’, in
connection with accounting for plan amendments, curtailments and settlements.
The amendments require an entity:
• to use updated assumptions to determine current service cost and net interest for the remainder of the period after a plan amendment, curtailment or settlement; and
• to recognise in profit or loss as part of past service cost, or a gain or loss on settlement, any reduction in a surplus, even if that surplus was not previously recognised because of
the impact of the asset ceiling.
Effective date for application of this amendment is annual period beginning on or after 1 January 2019, although early application is permitted. The Group is evaluating the effect of
this amendment on the consolidated financial statements and the impact is not expected to be material.
6
2. Notes to the Condensed Consolidated Interim Financial Statements
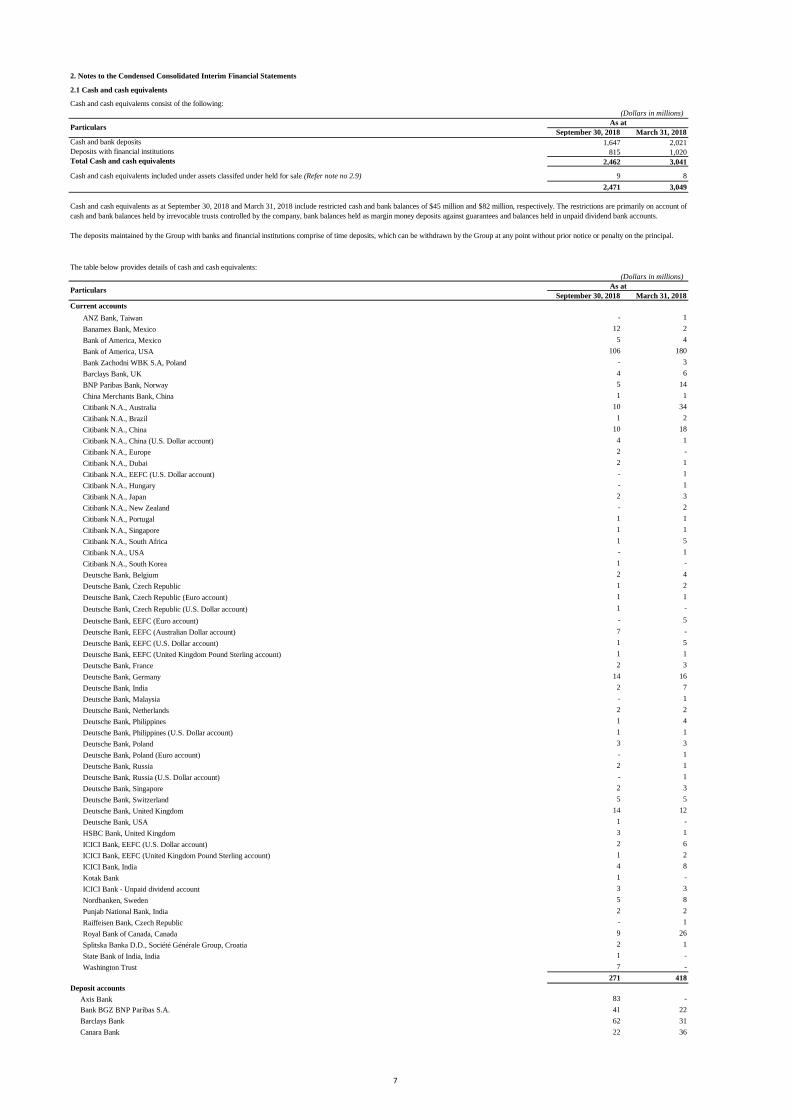
2.1 Cash and cash equivalents
Cash and cash equivalents consist of the following:
(Dollars in millions)
September 30, 2018 March 31, 2018
Cash and bank deposits 1,647 2,021
Deposits with financial institutions 815 1,020
Total Cash and cash equivalents 2,462 3,041
Cash and cash equivalents included under assets classifed under held for sale (Refer note no 2.9) 9 8
2,471 3,049
The table below provides details of cash and cash equivalents:
(Dollars in millions)
September 30, 2018 March 31, 2018
Current accounts
ANZ Bank, Taiwan - 1
Banamex Bank, Mexico 12 2
Bank of America, Mexico 5 4
Bank of America, USA 106 180
Bank Zachodni WBK S.A, Poland - 3
Barclays Bank, UK 4 6
BNP Paribas Bank, Norway 5 14
China Merchants Bank, China 1 1
Citibank N.A., Australia 10 34
Citibank N.A., Brazil 1 2
Citibank N.A., China 10 18
Citibank N.A., China (U.S. Dollar account) 4 1
Citibank N.A., Europe 2 -
Citibank N.A., Dubai 2 1
Citibank N.A., EEFC (U.S. Dollar account) - 1
Citibank N.A., Hungary - 1
Citibank N.A., Japan 2 3
Citibank N.A., New Zealand - 2
Citibank N.A., Portugal 1 1
Citibank N.A., Singapore 1 1
Citibank N.A., South Africa 1 5
Citibank N.A., USA - 1
Citibank N.A., South Korea 1 -
Deutsche Bank, Belgium 2 4
Deutsche Bank, Czech Republic 1 2
Deutsche Bank, Czech Republic (Euro account) 1 1
Deutsche Bank, Czech Republic (U.S. Dollar account) 1 -
Deutsche Bank, EEFC (Euro account) - 5
Deutsche Bank, EEFC (Australian Dollar account) 7 -
Deutsche Bank, EEFC (U.S. Dollar account) 1 5
Deutsche Bank, EEFC (United Kingdom Pound Sterling account) 1 1
Deutsche Bank, France 2 3
Deutsche Bank, Germany 14 16
Deutsche Bank, India 2 7
Deutsche Bank, Malaysia - 1
Deutsche Bank, Netherlands 2 2
Deutsche Bank, Philippines 1 4
Deutsche Bank, Philippines (U.S. Dollar account) 1 1
Deutsche Bank, Poland 3 3
Deutsche Bank, Poland (Euro account) - 1
Deutsche Bank, Russia 2 1
Deutsche Bank, Russia (U.S. Dollar account) - 1
Deutsche Bank, Singapore 2 3
Deutsche Bank, Switzerland 5 5
Deutsche Bank, United Kingdom 14 12
Deutsche Bank, USA 1 -
HSBC Bank, United Kingdom 3 1
ICICI Bank, EEFC (U.S. Dollar account) 2 6
ICICI Bank, EEFC (United Kingdom Pound Sterling account) 1 2
ICICI Bank, India 4 8
Kotak Bank 1 -
ICICI Bank - Unpaid dividend account 3 3
Nordbanken, Sweden 5 8
Punjab National Bank, India 2 2
Raiffeisen Bank, Czech Republic - 1
Royal Bank of Canada, Canada 9 26
Splitska Banka D.D., Société Générale Group, Croatia 2 1
State Bank of India, India 1 -
Washington Trust 7 -
271 418
Deposit accounts
Axis Bank 83 -
Bank BGZ BNP Paribas S.A. 41 22
Barclays Bank 62 31
Canara Bank 22 36
As at
Cash and cash equivalents as at September 30, 2018 and March 31, 2018 include restricted cash and bank balances of $45 million and $82 million, respectively. The restrictions are primarily on account of
cash and bank balances held by irrevocable trusts controlled by the company, bank balances held as margin money deposits against guarantees and balances held in unpaid dividend bank accounts.
The deposits maintained by the Group with banks and financial institutions comprise of time deposits, which can be withdrawn by the Group at any point without prior notice or penalty on the principal.
As at
Particulars
Particulars
7

Citibank 15 35
Deutsche Bank, AG 3 4
Deutsche Bank, Poland 17 32
HDFC Bank 48 383
HSBC Bank 41 -
ICICI Bank 543 568
IDBI Bank - 38
IDFC Bank 338 230
IndusInd Bank - 154
Kotak Mahindra Bank 70 -
South Indian Bank 24 69
Standard Chartered Bank 69 -
Yes Bank - 1
1,376 1,603
Deposits with financial institutions
HDFC Limited 595 836
LIC Housing Finance Limited 220 184
815 1,020
Total Cash and cash equivalents 2,462 3,041
2.2 Investments
(Dollars in millions)
September 30, 2018 March 31, 2018
(i) Current
Amortized cost
Quoted debt securities:
Cost 3 -
Fair value through profit and loss
Liquid Mutual funds
Fair value 120 12
Quoted debt securities
Fair value 131 117
Commercial Paper
Fair value - 45
Certificate of deposits
Fair value 792 808
Total current investments 1,046 982
(ii) Non-current
Amortized cost
Quoted debt securities
Cost 261 291
Fair value through Other comprehensive income
Quoted debt securities
Fair value 355 493
Unquoted equity and preference securities
Fair value 22 21
Fair Value through Other comprehensive income
As at
The carrying value of investments are as follows:
Particulars
8

Fair value through profit and loss
Unquoted convertible promissory note
Fair value - 2
Unquoted Preference securities
Fair value 4 -
Fixed maturity plan securities
Fair Value 61 66
Others
Fair value 10 10
Total Non-current investments 713 883
Total investments 1,759 1,865
264 291
Investments carried at fair value through other comprehensive income 1,300 1,484
Investments carried at fair value through profit and loss 195 90
Uncalled capital commitments outstanding as of September 30, 2018 and March 31, 2018 was $9 million and $12 million, respectively.
Details of amounts recorded in Other comprehensive income: (Dollars in millions)
Gross Tax Net Gross Tax Net
Net Gain/(loss) on
Quoted debt securities (2) - (2) 2 - 2
Certificate of deposits (1) 1 - - - -
Unquoted equity and preference securities 2 - 2 - - -
(Dollars in millions)
Gross Tax Net Gross Tax Net
Net Gain/(loss) on
Quoted debt securities (7) 1 (6) 6 - 6
Certificate of deposits (4) 1 (3) - - -
Unquoted equity and preference securities 2 - 2 - - -
Method of fair valuation: (Dollars in millions)
As at
September 30, 2018
As at
March 31, 2018
Liquid mutual funds 120 12
Fixed maturity plan securities 61 66
Quoted debt securities- carried at amortized cost 293 330
486 610
Commercial Paper - 45
Certificate of deposits 792 808
22 21
4 -
Unquoted convertible promissory note - 2
Others 10 10
1,788 1,904
Certain quoted investments are classified as Level 2 in the absence of active market for such investments.
Investment carried at amortized cost
Quoted price
Method
Market observable inputs
Quoted price and market observable inputs
Fair value
Class of investment
Three months ended
September 30, 2018 September 30, 2017
Discounted cash flows method, Market multiples method,
Option pricing model, etc.
Discounted cash flows method, Market multiples method,
Option pricing model, etc.
Discounted cash flows method, Market multiples method,
Option pricing model, etc.
Market observable inputs
Quoted debt securities- carried at Fair value through other comprehensive
income
Six months ended
September 30, 2018 September 30, 2017
Particulars
Particulars
Discounted cash flows method, Market multiples method,
Option pricing model, etc.
Quoted price and market observable inputs
Market observable inputs
Unquoted equity and preference securities at fair value through other
comprehensive income
Unquoted equity and preference securities - carried at fair value through
profit or loss
9
2.3 Financial instruments
Accounting Policy
2.3.1 Initial recognition
(i) Financial assets or financial liabilities, at fair value through profit or loss.
This category has derivative financial assets or liabilities which are not designated as hedges.
Although the group believes that these derivatives constitute hedges from an economic perspective, they may not qualify for hedge accounting under
IFRS 9, Financial Instruments. Any derivative that is either not designated as hedge, or is so designated but is ineffective as per IFRS 9, is categorized
as a financial asset or financial liability, at fair value through profit or loss.
The group recognizes financial assets and financial liabilities when it becomes a party to the contractual provisions of the instrument. All financial
assets and liabilities are recognized at fair value on initial recognition, except for trade receivables which are initially measured at transaction price.
Transaction costs that are directly attributable to the acquisition or issue of financial assets and financial liabilities, that are not at fair value through
profit or loss, are added to the fair value on initial recognition. Regular way purchase and sale of financial assets are accounted for at trade date.
A financial asset is subsequently measured at amortized cost if it is held within a business model whose objective is to hold the asset in order to collect
contractual cash flows and the contractual terms of the financial asset give rise on specified dates to cash flows that are solely payments of principal
and interest on the principal amount outstanding.
(ii) Financial assets at fair value through other comprehensive income (FVOCI)
A financial asset is subsequently measured at fair value through other comprehensive income if it is held within a business model whose objective is
achieved by both collecting contractual cash flows and selling financial assets and the contractual terms of the financial asset give rise on specified
dates to cash flows that are solely payments of principal and interest on the principal amount outstanding. The Group has made an irrevocable election
for its investments which are classified as equity instruments to present the subsequent changes in fair value in other comprehensive income based on
its business model.
Effective April 1, 2016, the Group has early adopted IFRS 9 - Financial Instruments considering April 1, 2015 as the date of initial application of the
standard even though the stipulated effective date for adoption is April 1, 2018.
As per IFRS 9, the Group has classified its financial assets into the following categories based on the business model for managing those assets and
the contractual cash flow characteristics:
- Financial assets carried at amortised cost
- Financial assets fair valued through other comprehensive income
- Financial assets fair valued through profit and loss
The adoption of IFRS 9 did not have any other material impact on the interim condensed consolidated financial statements.
2.3.2 Subsequent measurement
a. Non-derivative financial instruments
(i) Financial assets carried at amortized cost
b. Derivative financial instruments
(iii) Financial assets at fair value through profit or loss (FVTPL)
A financial asset which is not classified in any of the above categories is subsequently fair valued through profit or loss.
(iv) Financial liabilities
Financial liabilities are subsequently carried at amortized cost using the effective interest method, except for contingent consideration recognized in a
business combination which is subsequently measured at fair value through profit and loss. For trade and other payables maturing within one year from
the balance sheet date, the carrying amounts approximate fair value due to the short maturity of these instruments.
The group holds derivative financial instruments such as foreign exchange forward and option contracts to mitigate the risk of changes in exchange
rates on foreign currency exposures. The counterparty for these contracts is generally a bank.
Derivatives not designated as hedges are recognized initially at fair value and attributable transaction costs are recognized in net profit in the statement
of comprehensive income when incurred. Subsequent to initial recognition, these derivatives are measured at fair value through profit or loss and the
resulting exchange gains or losses are included in other income. Assets/ liabilities in this category are presented as current assets/current liabilities if
they are either held for trading or are expected to be realized within 12 months after the balance sheet date.
10

2.3.5 Impairment
The Group recognizes loss allowances using the expected credit loss (ECL) model for the financial assets and unbilled revenue which are not fair
valued through profit or loss. Loss allowance for trade receivables and unbilled revenues with no significant financing component is measured at an
amount equal to lifetime ECL. For all other financial assets, expected credit losses are measured at an amount equal to the 12-month ECL, unless there
has been a significant increase in credit risk from initial recognition in which case those are measured at lifetime ECL. The amount of expected credit
losses (or reversal) that is required to adjust the loss allowance at the reporting date to the amount that is required to be recognized is recognized as an
impairment gain or loss in statement of comprehensive income.
(ii) Cash flow hedge
The group derecognizes a financial asset when the contractual rights to the cash flows from the financial asset expire or it transfers the financial asset
and the transfer qualifies for derecognition under IFRS 9. A financial liability (or a part of a financial liability) is derecognized from the group's balance
sheet when the obligation specified in the contract is discharged or cancelled or expires.
The group designates certain foreign exchange forward and options contracts as cash flow hedges to mitigate the risk of foreign exchange exposure on
highly probable forecast cash transactions.
When a derivative is designated as a cash flow hedging instrument, the effective portion of changes in the fair value of the derivative is recognized in
other comprehensive income and accumulated in the cash flow hedging reserve. Any ineffective portion of changes in the fair value of the derivative is
recognized immediately in the net profit in the statement of comprehensive income. If the hedging instrument no longer meets the criteria for hedge
accounting, then hedge accounting is discontinued prospectively. If the hedging instrument expires or is sold, terminated or exercised, the cumulative
gain or loss on the hedging instrument recognized in cash flow hedging reserve till the period the hedge was effective remains in cash flow hedging
reserve until the forecasted transaction occurs. The cumulative gain or loss previously recognized in the cash flow hedging reserve is transferred to the
net profit in the statement of comprehensive income upon the occurrence of the related forecasted transaction. If the forecasted transaction is no longer
expected to occur, then the amount accumulated in cash flow hedging reserve is reclassified to net profit in the statement of comprehensive income.
Refer to table ‘Financial instruments by category’ below for the disclosure on carrying value and fair value of financial assets and liabilities. For
financial assets and liabilities maturing within one year from the Balance Sheet date and which are not carried at fair value, the carrying amounts
approximate fair value due to the short maturity of those instruments.
c. Share capital and treasury shares
(i) Ordinary Shares
2.3.3 Derecognition of financial instruments
2.3.4 Fair value of financial instruments
Ordinary shares are classified as equity. Incremental costs directly attributable to the issuance of new ordinary shares and share options and buy back of
ordinary shares are recognized as a deduction from equity, net of any tax effects.
When any entity within the Group purchases the company's ordinary shares, the consideration paid including any directly attributable incremental cost
is presented as a deduction from total equity, until they are cancelled, sold or reissued. When treasury shares are sold or reissued subsequently, the
amount received is recognized as an increase in equity, and the resulting surplus or deficit on the transaction is transferred to/ from share premium.
(ii) Treasury Shares
In determining the fair value of its financial instruments, the group uses a variety of methods and assumptions that are based on market conditions and
risks existing at each reporting date. The methods used to determine fair value include discounted cash flow analysis, available quoted market prices
and dealer quotes. All methods of assessing fair value result in general approximation of value, and such value may never actually be realized.
11

(Dollars in millions)
Amortized cost Total carrying value Total fair value
Designated
upon initial
recognition
Mandatory Equity instruments
designated upon initial
recognition
Mandatory
Assets:
Cash and cash equivalents (Refer to Note 2.1) 2,462 - - - - 2,462 2,462
Investments (Refer to Note 2.2)
Liquid mutual funds - - 120 - - 120 120
Fixed maturity plan securities - - 61 - - 61 61
Quoted debt securities 264 - - - 486 750 779 (1)
Certificate of deposits - - - - 792 792 792
Unquoted equity and preference securities: - - 4 22 - 26 26
Unquoted investment others - - 10 - - 10 10
Trade receivables 2,039 - - - - 2,039 2,039
Unbilled revenues (3)
(Refer to Note 2.15) 250 - - - - 250 250
Prepayments and other assets (Refer to Note 2.4) 418 - - - - 418 407 (2)
Derivative financial instruments - - 1 - 2 3 3
Total 5,433 - 196 22 1,280 6,931 6,949
Liabilities:
Trade payables 164 - - - - 164 164
Derivative financial instruments - - 39 - 4 43 43
Other liabilities including contingent consideration (Refer
to note 2.5)
871 - 15 - - 886 886
Total 1,035 - 54 - 4 1,093 1,093 (1)
On account of fair value changes including interest accrued(2)
Excludes interest accrued on quoted debt securities carried at amortized cost(3)
Excludes unbilled revenue for fixed price development contracts where right to consideration is conditional on factors other than passage of time
(Dollars in millions)
Amortized cost Total carrying value Total fair value
Designated
upon initial
recognition
Mandatory Equity instruments
designated upon initial
recognition
Mandatory
Assets:
Cash and cash equivalents (Refer to Note 2.1) 3,041 - - - - 3,041 3,041
Investments (Refer to Note 2.2)
Liquid mutual funds - - 12 - - 12 12
Fixed maturity plan securities - - 66 - - 66 66
Quoted debt securities 291 - - - 610 901 940 (1)
Certificate of deposits - - - - 808 808 808
Commercial papers - - - - 45 45 45
Unquoted equity and preference securities - - - 21 - 21 21
Unquoted investment others - - 10 - - 10 10
Unquoted convertible promissory note - - 2 - - 2 2
Trade receivables 2,016 - - - - 2,016 2,016
Unbilled revenues 654 - - - - 654 654
Prepayments and other assets (Refer to Note 2.4) 456 - - - - 456 443 (2)
Derivative financial instruments - - - - 2 2 2
Total 6,458 - 90 21 1,465 8,034 8,060
Liabilities:
Trade payables 107 - - - - 107 107
Derivative financial instruments - - 6 - - 6 6
Client deposits
Other liabilities including contingent consideration (Refer
to note 2.5)
836 - 8 - - 844 844
Total 943 - 14 - - 957 957
(1) On account of fair value changes including interest accrued
(2) Excludes interest accrued on quoted debt securities carried at amortized cost
The carrying value and fair value of financial instruments by categories as at March 31, 2018 were as follows:
Financial assets/ liabilities at
fair value through profit or
loss
Financial assets/liabilities at fair value through OCI
Financial instruments by category
The carrying value and fair value of financial instruments by categories as at September 30, 2018 were as follows:
Financial assets/ liabilities at
fair value through profit or
loss
Financial assets/liabilities at fair value through OCI
Particulars
Particulars
12

(Dollars in millions)
As at September
30, 2018
Level 1 Level 2 Level 3
Assets
120 120 - -
61 - 61
779 486 293 -
792 - 792 -
26 - - 26
10 - - 10
3 - 3 -
Liabilities -
43 - 43 -
15 - - 15
(Dollars in millions)
As at March 31,
2018
Level 1 Level 2 Level 3
Assets
12 12 - -
66 - 66 -
940 701 239 -
808 - 808 -
Investments in commercial paper (Refer to Note 2.2) 45 - 45 -
21 - - 21
10 - - 10
2 - - 2
2 - 2 -
Liabilities
6 - 6 -
8 - - 8
*Discounted contingent consideration of $3 million pertaining to Brilliant Basics at 10%
A one percentage point change in the unobservable inputs used in Level 3 assets and liabilities does not have a significant impact in its value.
Particulars
Investments in unquoted investments others (Refer to Note 2.2)
Derivative financial instruments - loss on outstanding foreign exchange forward and
option contracts
Fair value hierarchy
Investments in fixed maturity plan securities (Refer to Note 2.2)
Investments in certificate of deposit (Refer to Note 2.2)
Investments in unquoted investments others (Refer to Note 2.2)
Liability towards contingent consideration (Refer to Note 2.5)*
Investments in quoted debt securities (Refer to Note 2.2)
Derivative financial instruments- loss on outstanding foreign exchange forward and option
contracts
Investments in unquoted equity and preference securities (Refer to Note 2.2)
Investments in unquoted convertible promissory note (Refer to Note 2.2)
Derivative financial instruments- gain on outstanding foreign exchange forward and
option contracts
Investments in liquid mutual fund units (Refer to Note 2.2)
The following table presents fair value hierarchy of assets and liabilities as at March 31, 2018:
Fair value measurement at end of the reporting period / year
using
Level 1 - Quoted prices (unadjusted) in active markets for identical assets or liabilities.
Liability towards contingent consideration (Refer to note 2.5)*
Level 3 - Inputs for the assets or liabilities that are not based on observable market data (unobservable inputs).
Level 2 – Inputs other than quoted prices included within Level 1 that are observable for the asset or liability, either directly (i.e. as prices) or indirectly (i.e. derived from prices).
The following table presents fair value hierarchy of assets and liabilities as at September 30, 2018:
*Discounted contingent consideration of $2 million pertaining to Brilliant Basics at 10% and $17 million pertaining to Wongdoody at 16%.
Derivative financial instruments - gain on outstanding foreign exchange forward and
option contracts
During the six months ended September 30, 2018, quoted debt securities of $66 million were transferred from Level 2 to Level 1 of fair value hierarchy, since these were valued
based on Quoted price and quoted debt securities of $174 million were transferred from Level 1 to Level 2 of fair value hierarchy, since these were valued based on market
observable inputs.
Investments in liquid mutual fund units (Refer to Note 2.2)
Investments in quoted debt securities (Refer to Note 2.2)
Fair value measurement at end of the reporting period using
Investments in fixed maturity plan securities (Refer to Note 2.2)
Investments in certificate of deposit (Refer to Note 2.2)
Investments in unquoted equity and preference securities (Refer to Note 2.2)
Particulars
13
(Dollars in millions)
2018 2017 2018 2017
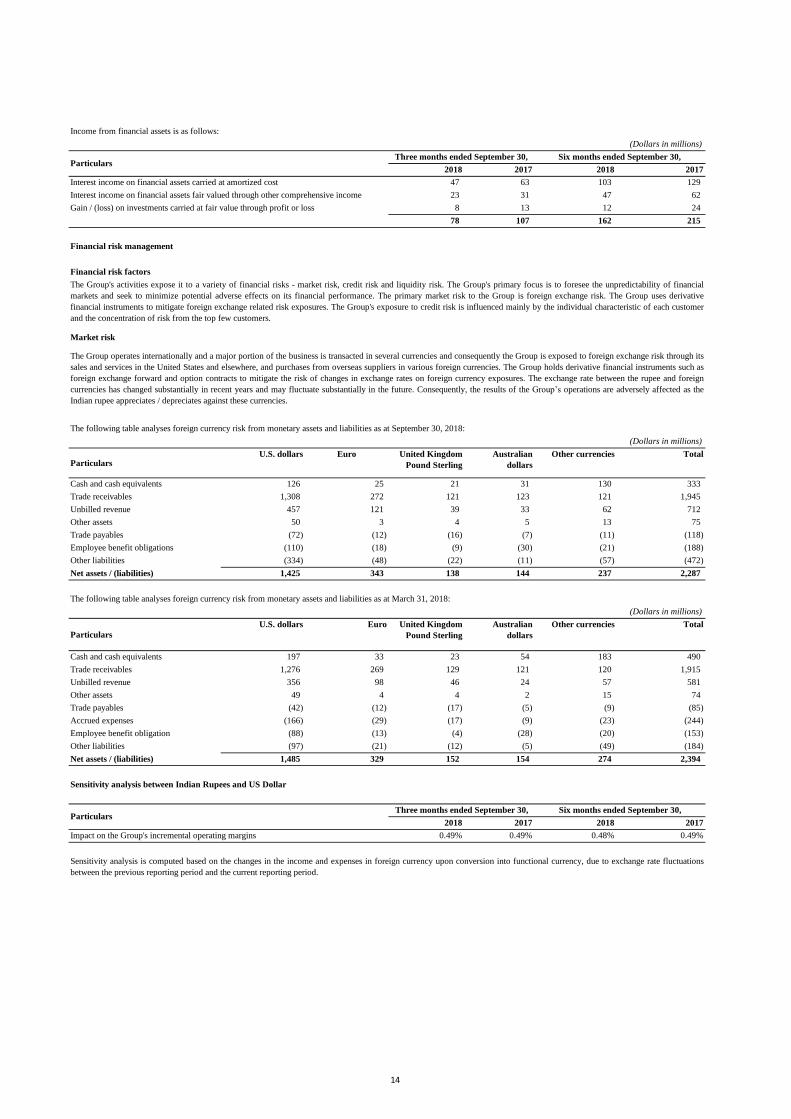
Interest income on financial assets carried at amortized cost 47 63 103 129
Interest income on financial assets fair valued through other comprehensive income 23 31 47 62
Gain / (loss) on investments carried at fair value through profit or loss 8 13 12 24
78 107 162 215
Financial risk factors
Market risk
(Dollars in millions)
Particulars U.S. dollars Euro United Kingdom
Pound Sterling
Australian
dollars
Other currencies Total
Cash and cash equivalents 126 25 21 31 130 333
Trade receivables 1,308 272 121 123 121 1,945
Unbilled revenue 457 121 39 33 62 712
Other assets 50 3 4 5 13 75
Trade payables (72) (12) (16) (7) (11) (118)
Employee benefit obligations (110) (18) (9) (30) (21) (188)
Other liabilities (334) (48) (22) (11) (57) (472)
Net assets / (liabilities) 1,425 343 138 144 237 2,287
(Dollars in millions)
Particulars
U.S. dollars Euro United Kingdom
Pound Sterling
Australian
dollars
Other currencies Total
Cash and cash equivalents 197 33 23 54 183 490
Trade receivables 1,276 269 129 121 120 1,915
Unbilled revenue 356 98 46 24 57 581
Other assets 49 4 4 2 15 74
Trade payables (42) (12) (17) (5) (9) (85)
Accrued expenses (166) (29) (17) (9) (23) (244)
Employee benefit obligation (88) (13) (4) (28) (20) (153)
Other liabilities (97) (21) (12) (5) (49) (184)
Net assets / (liabilities) 1,485 329 152 154 274 2,394
Sensitivity analysis between Indian Rupees and US Dollar
2018 2017 2018 2017
Impact on the Group's incremental operating margins 0.49% 0.49% 0.48% 0.49%
Particulars
Particulars
Income from financial assets is as follows:
Six months ended September 30,
The following table analyses foreign currency risk from monetary assets and liabilities as at September 30, 2018:
The following table analyses foreign currency risk from monetary assets and liabilities as at March 31, 2018:
Sensitivity analysis is computed based on the changes in the income and expenses in foreign currency upon conversion into functional currency, due to exchange rate fluctuations
between the previous reporting period and the current reporting period.
Financial risk management
Six months ended September 30,
The Group operates internationally and a major portion of the business is transacted in several currencies and consequently the Group is exposed to foreign exchange risk through its
sales and services in the United States and elsewhere, and purchases from overseas suppliers in various foreign currencies. The Group holds derivative financial instruments such as
foreign exchange forward and option contracts to mitigate the risk of changes in exchange rates on foreign currency exposures. The exchange rate between the rupee and foreign
currencies has changed substantially in recent years and may fluctuate substantially in the future. Consequently, the results of the Group’s operations are adversely affected as the
Indian rupee appreciates / depreciates against these currencies.
The Group's activities expose it to a variety of financial risks - market risk, credit risk and liquidity risk. The Group's primary focus is to foresee the unpredictability of financial
markets and seek to minimize potential adverse effects on its financial performance. The primary market risk to the Group is foreign exchange risk. The Group uses derivative
financial instruments to mitigate foreign exchange related risk exposures. The Group's exposure to credit risk is influenced mainly by the individual characteristic of each customer
and the concentration of risk from the top few customers.
Three months ended September 30,
Three months ended September 30,
14

(In millions)
September 30, 2018 March 31, 2018
Derivatives designated as cash flow hedges
Options contracts
In Australian dollars 180 60
In Euro 140 100
In United Kingdom Pound Sterling 25 20
Other derivatives
Forward contracts
In Australian dollars 79 5
In Canadian dollars 13 20
In Euro 161 91
In Japanese Yen 550 550
In New Zealand dollars 16 16
In Norwegian Krone 40 40
In Singapore dollars 10 5
In South African Rand - 25
In Swedish Krona 50 50
In Swiss Franc 21 21
In U.S. Dollars 806 623
In United Kingdom Pound Sterling 78 51
Options contracts
In Australian dollars - 20
In Canadian dollars - -
In Euro 65 45
In Swiss Franc - 5
In U.S. Dollars 350 320
In United Kingdom Pound Sterling - 25
(Dollars in millions)
September 30, 2018 March 31, 2018
Not later than one month 435 434
Later than one month and not later than three months 1,082 701
Later than three months and not later than one year 448 378
Total 1,965 1,513
As at
As at
The group recognized a net loss of $58 million and $11 million for the three months ended September 30, 2018 and September 30, 2017 and net loss of $85 million and $7 million
for the six month ended for the September 30, 2018 and September 30, 2017 on derivative financial instruments not designated as cash flow hedges, which are included in other
income.
Hedge effectiveness is determined at the inception of the hedge relationship, and through periodic prospective effectiveness assessments to ensure that an economic relationship
exists between the hedged item and hedging instrument, including whether the hedging instrument is expected to offset changes in cash flows of hedged items.
Derivative financial instruments
If the hedge ratio for risk management purposes is no longer optimal but the risk management objective remains unchanged and the hedge continues to qualify for hedge accounting,
the hedge relationship will be rebalanced by adjusting either the volume of the hedging instrument or the volume of the hedged item so that the hedge ratio aligns with the ratio used
for risk management purposes. Any hedge ineffectiveness is calculated and accounted for in profit or loss at the time of the hedge relationship rebalancing.
Particulars
Particulars
During the six months ended September 30, 2018 and September 30, 2017, the Group has designated certain foreign exchange forward and option contracts as cash flow hedges to
mitigate the risk of foreign exchange exposure on highly probable forecast cash transactions. The related hedge transactions for balance in cash flow hedging reserve as at September
30, 2018 are expected to occur and reclassified to statement of comprehensive income within 3 months.
The Group's holds derivative financial instruments such as foreign exchange forward and option contracts to mitigate the risk of changes in exchange rates on foreign currency
exposures. The counterparty for these contracts is generally a bank. These derivative financial instruments are valued based on quoted prices for similar assets and liabilities in active
markets or inputs that are directly or indirectly observable in the marketplace.
The following table gives details in respect of outstanding foreign exchange forward and options contracts:
The foreign exchange forward and option contracts mature within twelve months. The table below analyses the derivative financial instruments into relevant maturity groupings
based on the remaining period as at the balance sheet date:
15

(Dollars in millions)
2018 2017 2018 2017
Gain / (Loss)
Balance at the beginning of the period 1 (4) - 6
Gain / (Loss) recognized in other comprehensive income during the period (7) (8) (2) (14)
Amount reclassified to profit and loss during the period 2 12 (1) 5
Tax impact on above 1 (1) - 2
Balance at the end of the period (3) (1) (3) (1)
The following table provides quantitative information about offsetting of derivative financial assets and derivative financial liabilities:
(Dollars in millions)
Derivative
financial asset
Derivative
financial liability
Derivative
financial asset
Derivative
financial liability
Gross amount of recognized financial asset/liability 6 (46) 3 (7)
Amount set off (3) 3 (1) 1
Net amount presented in balance sheet 3 (43) 2 (6)
Credit risk
(In %)
2018 2017 2018 2017
Revenue from top customer 3.9 3.4 3.8 3.4
Revenue from top ten customers 19.4 19.5 19.3 19.7
Movement in credit loss allowance (Dollars in millions)
2018 2017 2018 2017
Balance at the beginning 77 63 69 63
Translation differences (2) - (5) -
Impairment loss recognized/(reversed) 10 6 21 6
Write offs (10) - (10) -
Balance at the end 75 69 75 69
Credit exposure (Dollars in millions)
September 30, 2018 March 31, 2018
Trade receivables 2,039 2,016
Unbilled revenues 716 654
Particulars
Particulars
As at
Six months ended September 30,
September 30, 2018
Six months ended September 30,
Six months ended September 30,
Particulars
Particulars
Particulars
Days Sales Outstanding (DSO) as of September 30, 2018 and March 31, 2018 was 66 days and 67 days respectively.
The group offsets a financial asset and a financial liability when it currently has a legally enforceable right to set off the recognized amounts and the group intends either to settle on
a net basis, or to realize the asset and settle the liability simultaneously.
Three months ended September 30,
The following table provides the reconciliation of cash flow hedge reserve for the three months and six months ended September 30, 2018 and September 30, 2017:
Three months ended September 30,
The allowance for lifetime expected credit loss on customer balances for the three months ended September 30, 2018 and September 30, 2017 was $10 million and $6 million
respectively. The allowance for lifetime expected credit loss on customer balances for the six months ended September 30, 2018 and six months ended September 30, 2017 was $21
million and $6 million respectively.
The Group’s credit period generally ranges from 30-60 days.
As at
Three months ended September 30,
The following table gives details in respect of percentage of revenues generated from top customer and top ten customers:
Credit risk exposure
March 31, 2018
Credit risk refers to the risk of default on its obligation by the counterparty resulting in a financial loss. The maximum exposure to the credit risk at the reporting date is primarily
from trade receivables amounting to $2,039 million and $2,016 million as at September 30, 2018 and March 31, 2018, respectively and unbilled revenue amounting to $716 million
and $654 million as at September 30, 2018 and March 31, 2018, respectively. Trade receivables and unbilled revenue are typically unsecured and are derived from revenue earned
from customers primarily located in the United States. Credit risk is managed through credit approvals, establishing credit limits and continuously monitoring the creditworthiness of
customers to which the Group grants credit terms in the normal course of business. On account of adoption of IFRS 9, the Group uses expected credit loss model to assess the
impairment loss or gain. The group uses a provision matrix to compute the expected credit loss allowance for trade receivables and unbilled revenues. The provision matrix takes
into account available external and internal credit risk factors such as credit default swap quotes, credit ratings from international credit rating agencies and the Group's historical
experience for customers.
16
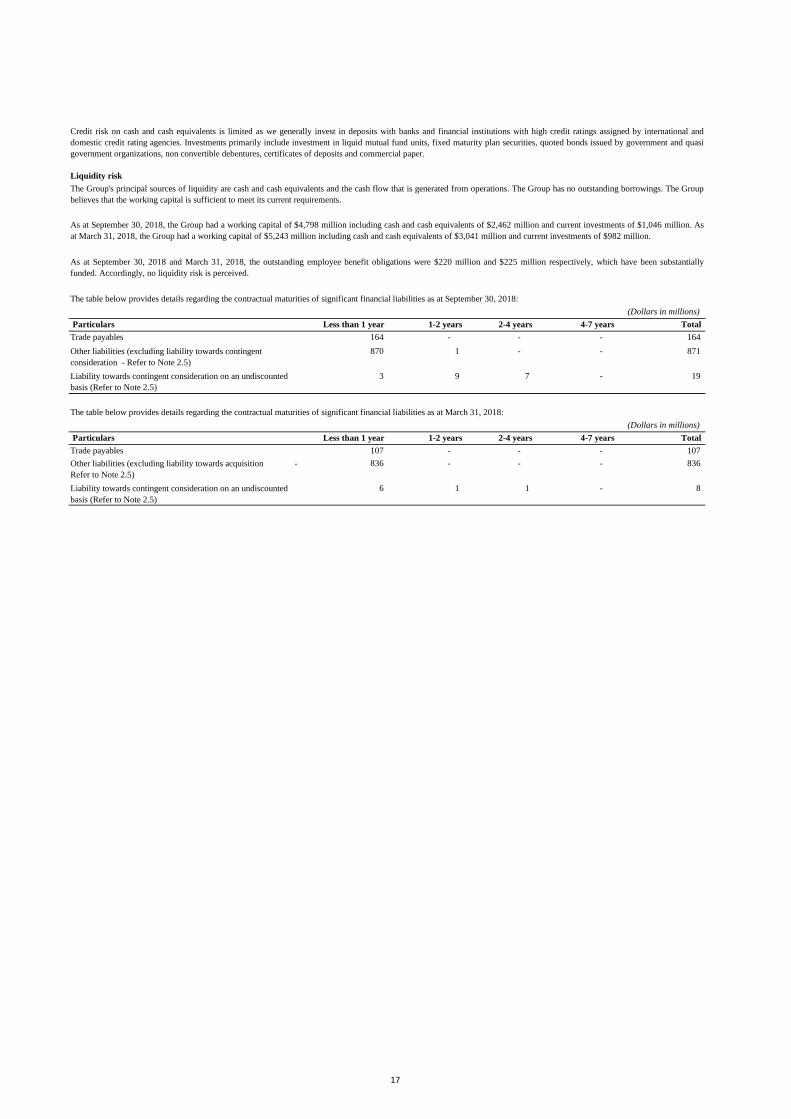
Liquidity risk
(Dollars in millions)
Particulars Less than 1 year 1-2 years 2-4 years 4-7 years Total
Trade payables 164 - - - 164
870 1 - - 871
3 9 7 - 19
(Dollars in millions)
Particulars Less than 1 year 1-2 years 2-4 years 4-7 years Total
Trade payables 107 - - - 107
836 - - - 836
6 1 1 - 8
The table below provides details regarding the contractual maturities of significant financial liabilities as at March 31, 2018:
Liability towards contingent consideration on an undiscounted
basis (Refer to Note 2.5)
Other liabilities (excluding liability towards acquisition -
Refer to Note 2.5)
Liability towards contingent consideration on an undiscounted
basis (Refer to Note 2.5)
As at September 30, 2018 and March 31, 2018, the outstanding employee benefit obligations were $220 million and $225 million respectively, which have been substantially
funded. Accordingly, no liquidity risk is perceived.
As at September 30, 2018, the Group had a working capital of $4,798 million including cash and cash equivalents of $2,462 million and current investments of $1,046 million. As
at March 31, 2018, the Group had a working capital of $5,243 million including cash and cash equivalents of $3,041 million and current investments of $982 million.
Other liabilities (excluding liability towards contingent
consideration - Refer to Note 2.5)
The Group's principal sources of liquidity are cash and cash equivalents and the cash flow that is generated from operations. The Group has no outstanding borrowings. The Group
believes that the working capital is sufficient to meet its current requirements.
The table below provides details regarding the contractual maturities of significant financial liabilities as at September 30, 2018:
Credit risk on cash and cash equivalents is limited as we generally invest in deposits with banks and financial institutions with high credit ratings assigned by international and
domestic credit rating agencies. Investments primarily include investment in liquid mutual fund units, fixed maturity plan securities, quoted bonds issued by government and quasi
government organizations, non convertible debentures, certificates of deposits and commercial paper.
17

2.4 Prepayments and other assets
Prepayments and other assets consist of the following:
(Dollars in millions)
September 30, 2018 March 31, 2018
Current
Rental deposits 4 2
Security deposits 1 1
Loans to employees 32 37
Prepaid expenses (1) 81 72
Interest accrued and not due 99 117
Withholding taxes and others(1) 189 158
Advance payments to vendors for supply of goods (1) 11 18
Deposit with corporations 213 236
Deferred contract cost(1) 8 7
Other assets 24 14
662 662
Non-current
Loans to employees 5 6
Security deposits 7 8
Deposit with corporations 10 9
Prepaid gratuity (1) 5 7
Prepaid expenses (1) 19 17
Deferred contract cost (1) 41 40
Withholding taxes and others(1) 139 219
Rental Deposits 23 26
Total Non- current prepayment and other assets 249 332
Total prepayment and other assets 911 994
Financial assets in prepayments and other assets 418 456
(1) Non
financial assets
As at
Withholding taxes and others primarily consist of input tax credits. Security deposits relate principally to leased telephone lines and
electricity supplies. Deferred contract costs are upfront costs incurred for the contract and are amortized over the term of the contract.
Total Current prepayment and other assets
Deposit with corporation represents amounts deposited to settle certain employee-related obligations as and when they arise during the
normal course of business.
Particulars
18

2.5 Other liabilities
Other liabilities comprise the following:
(Dollars in millions)
September 30, 2018 March 31, 2018
Current
Accrued compensation to employees 344 385
Accrued expenses 434 376
Withholding taxes and others (1) 202 190
Retention money 13 20
Liabilities of controlled trusts 24 21
Liability towards contingent consideration (Refer to note 2.9) 3 6
Deferred rent (1) 5 4
Others 55 34
Total Current other liabilities 1,080 1,036
Non-Current
Liability towards contingent consideration (Refer to note 2.9) 12 2
Accrued compensation to employees 1 -
Accrued gratuity(1) 4 4
Deferred income - government grant on land use rights (1) 6 7
Deferred income (1) 5 5
Deferred rent (1) 22 24
Total Non-current other liabilities 50 42
Total other liabilities 1,130 1,078
886 844
19 8
2.6 Provisions
Accounting Policy
Provisions
Post sales client support
Financial liability towards contingent consideration on an undiscounted basis (Refer
to Note 2.9)
Financial liabilities included in other liabilities
As atParticulars
(1) Non financial liabilities
Accrued expenses primarily relate to cost of technical sub-contractors, telecommunication charges, legal and professional charges, brand
building expenses, overseas travel expenses and office maintenance. Others include unpaid dividend balances and capital creditors.
Provisions for onerous contracts are recognized when the expected benefits to be derived by the Group from a contract are lower than the
unavoidable costs of meeting the future obligations under the contract. The provision is measured at the present value of the lower of the
expected cost of terminating the contract and the expected net cost of continuing with the contract. Before a provision is established the
Group recognizes any impairment loss on the assets associated with that contract.
A provision is recognized if, as a result of a past event, the Group has a present legal or constructive obligation that is reasonably
estimable, and it is probable that an outflow of economic benefits will be required to settle the obligation. Provisions are determined by
discounting the expected future cash flows at a pre-tax rate that reflects current market assessments of the time value of money and the
risks specific to the liability.
The Group provides its clients with a fixed-period post sales support for corrections of errors and support on all its fixed-price, fixed-
timeframe contracts. Costs associated with such support services are accrued at the time related revenues are recorded and included in
cost of sales. The Group estimates such costs based on historical experience and estimates are reviewed on a periodic basis for any
material changes in assumptions and likelihood of occurrence.
Onerous contracts
19

Provisions comprise the following:
(Dollars in millions)
September 30, 2018 March 31, 2018
Provision for post sales client support and other provisions 85 75
85 75
(Dollars in millions)
Three months ended
September 30, 2018
Six months ended
September 30, 2018
Balance at the beginning 76 75
Translation differences 1 1
Provision recognized/(reversed) 11 18
Provision utilized (3) (9)
Balance at the end 85 85
The Company is subject to legal proceedings and claims, which have arisen in the ordinary course of business. The company’s
management does not reasonably expect that these legal actions, when ultimately concluded and determined, will have a material and
adverse effect on the company’s results of operations or financial condition.
As at September 30, 2018 and March 31, 2018, claims against the company, not acknowledged as debts, (excluding demands from
income tax authorities- Refer to Note 2.11) amounted to ₹260 crore ($36 million) and ₹260 crore ($40 million), respectively.
Provision for post sales client support and other provisions is included in cost of sales in the condensed consolidated statement of
comprehensive income.
Provision for post sales client support and other provisions represents costs associated with providing sales support services which are
accrued at the time of recognition of revenues and are expected to be utilized over a period of 6 months to 1 year.
As at
The movement in the provision for post sales client support and other provisions is as follows:
Particulars
Particulars
20

2.7 Property, plant and equipment
Accounting Policy
Building 22-25 years
Plant and machinery 5 years
Computer equipment 3-5 years
Furniture and fixtures 5 years
Vehicles 5 years
Leasehold improvements Over lease term
Following are the changes in the carrying value of property, plant and equipment for the three months ended September 30, 2018:
(Dollars in millions)
Particulars Land Buildings Plant and
machinery
Computer
equipment
Furniture
and
fixtures
Vehicles Total
Gross carrying value as at July 1, 2018 284 1,201 497 745 277 5 3,009
Additions/adjustments - 6 8 24 6 1 45
Deletions/adjustments - - - (6) - - (6)
Translation difference (15) (65) (28) (40) (16) (1) (165)
Gross carrying value as at September 30, 2018 269 1,142 477 723 267 5 2,883
Accumulated depreciation as at July 1, 2018 (5) (408) (357) (553) (201) (3) (1,527)
Depreciation - (11) (16) (26) (9) - (62)
Accumulated depreciation on deletions - - - 6 - - 6
Translation difference - 23 21 29 11 - 84
Accumulated depreciation as at September 30, 2018 (5) (396) (352) (544) (199) (3) (1,499)
Capital work-in progress as at July 1, 2018 299
Carrying value as at July 1, 2018 279 793 140 192 76 2 1,781
Capital work-in progress as at September 30, 2018 323
Carrying value as at September 30, 2018 264 746 125 179 68 2 1,707
Following are the changes in the carrying value of property, plant and equipment for the three months ended September 30, 2017:
(Dollars in millions)
Particulars Land Buildings Plant and
machinery
Computer
equipment
Furniture
and
fixtures
Vehicles Total
Gross carrying value as at July 1, 2017 273 1,136 477 724 269 5 2,884
Additions - 8 9 11 6 - 34
Deletions - - (2) (4) (2) - (8)
Translation difference (2) (10) (4) (7) (3) - (26)
Gross carrying value as at September 30, 2017 271 1,134 480 724 270 5 2,884
Accumulated depreciation as at July 1, 2017 (4) (388) (318) (495) (179) (3) (1,387)
Depreciation - (11) (15) (28) (9) - (63)
Accumulated depreciation on deletions - - 2 4 2 - 8
Translation difference - 4 3 6 1 - 14
Accumulated depreciation as at September 30, 2017 (4) (395) (328) (513) (185) (3) (1,428)
Capital work-in progress as at July 1, 2017 337
Carrying value as at July 1, 2017 269 748 159 229 90 2 1,834
Capital work-in progress as at September 30, 2017 358
Carrying value as at September 30, 2017 267 739 152 211 85 2 1,814
Property, plant and equipment are stated at cost, less accumulated depreciation and impairment, if any. Costs directly attributable to acquisition are capitalized until the property,
plant and equipment are ready for use, as intended by management. The group depreciates property, plant and equipment over their estimated useful lives using the straight-line
method. The estimated useful lives of assets are as follows:
Depreciation methods, useful lives and residual values are reviewed periodically, including at each financial year end.
Advances paid towards the acquisition of property, plant and equipment outstanding at each balance sheet date and the cost of assets not put to use before such date are disclosed
under ‘Capital work-in-progress’. Subsequent expenditures relating to property, plant and equipment is capitalized only when it is probable that future economic benefits associated
with these will flow to the Group and the cost of the item can be measured reliably. Repairs and maintenance costs are recognized in the statement of comprehensive income when
incurred. The cost and related accumulated depreciation are eliminated from the financial statements upon sale or retirement of the asset and the resultant gains or losses are
recognized in net profit in the statement of comprehensive income.
(ii) Impairment
Property, plant and equipment are evaluated for recoverability whenever events or changes in circumstances indicate that their carrying amounts may not be recoverable. For the
purpose of impairment testing, the recoverable amount (i.e. the higher of the fair value less cost to sell and the value-in-use) is determined on an individual asset basis unless the asset
does not generate cash flows that are largely independent of those from other assets. In such cases, the recoverable amount is determined for the Cash Generating Unit (CGU) to
which the asset belongs.
If such assets are considered to be impaired, the impairment to be recognized in net profit in the statement of comprehensive income is measured by the amount by which the carrying
value of the assets exceeds the estimated recoverable amount of the asset. An impairment loss is reversed in net profit in the statement of comprehensive income if there has been a
change in the estimates used to determine the recoverable amount. The carrying amount of the asset is increased to its revised recoverable amount, provided that this amount does not
exceed the carrying amount that would have been determined (net of any accumulated amortization or depreciation) had no impairment loss been recognized for the asset in prior
years.
21
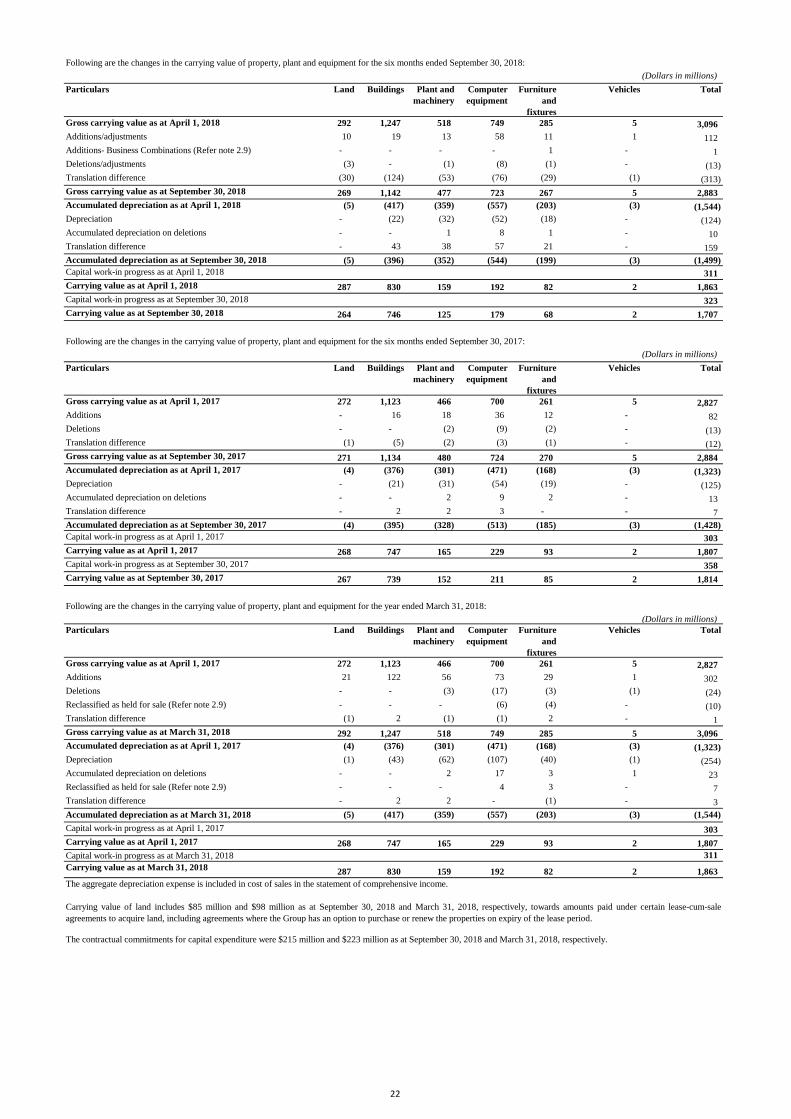
Following are the changes in the carrying value of property, plant and equipment for the six months ended September 30, 2018:
(Dollars in millions)
Particulars Land Buildings Plant and
machinery
Computer
equipment
Furniture
and
fixtures
Vehicles Total
Gross carrying value as at April 1, 2018 292 1,247 518 749 285 5 3,096
Additions/adjustments 10 19 13 58 11 1 112
Additions- Business Combinations (Refer note 2.9) - - - - 1 - 1
Deletions/adjustments (3) - (1) (8) (1) - (13)
Translation difference (30) (124) (53) (76) (29) (1) (313)
Gross carrying value as at September 30, 2018 269 1,142 477 723 267 5 2,883
Accumulated depreciation as at April 1, 2018 (5) (417) (359) (557) (203) (3) (1,544)
Depreciation - (22) (32) (52) (18) - (124)
Accumulated depreciation on deletions - - 1 8 1 - 10
Translation difference - 43 38 57 21 - 159
Accumulated depreciation as at September 30, 2018 (5) (396) (352) (544) (199) (3) (1,499)
Capital work-in progress as at April 1, 2018 311
Carrying value as at April 1, 2018 287 830 159 192 82 2 1,863
Capital work-in progress as at September 30, 2018 323
Carrying value as at September 30, 2018 264 746 125 179 68 2 1,707
Following are the changes in the carrying value of property, plant and equipment for the six months ended September 30, 2017:
(Dollars in millions)
Particulars Land Buildings Plant and
machinery
Computer
equipment
Furniture
and
fixtures
Vehicles Total
Gross carrying value as at April 1, 2017 272 1,123 466 700 261 5 2,827
Additions - 16 18 36 12 - 82
Deletions - - (2) (9) (2) - (13)
Translation difference (1) (5) (2) (3) (1) - (12)
Gross carrying value as at September 30, 2017 271 1,134 480 724 270 5 2,884
Accumulated depreciation as at April 1, 2017 (4) (376) (301) (471) (168) (3) (1,323)
Depreciation - (21) (31) (54) (19) - (125)
Accumulated depreciation on deletions - - 2 9 2 - 13
Translation difference - 2 2 3 - - 7
Accumulated depreciation as at September 30, 2017 (4) (395) (328) (513) (185) (3) (1,428)
Capital work-in progress as at April 1, 2017 303
Carrying value as at April 1, 2017 268 747 165 229 93 2 1,807
Capital work-in progress as at September 30, 2017 358
Carrying value as at September 30, 2017 267 739 152 211 85 2 1,814
Following are the changes in the carrying value of property, plant and equipment for the year ended March 31, 2018:
(Dollars in millions)
Particulars Land Buildings Plant and
machinery
Computer
equipment
Furniture
and
fixtures
Vehicles Total
Gross carrying value as at April 1, 2017 272 1,123 466 700 261 5 2,827
Additions 21 122 56 73 29 1 302
Deletions - - (3) (17) (3) (1) (24)
Reclassified as held for sale (Refer note 2.9) - - - (6) (4) - (10)
Translation difference (1) 2 (1) (1) 2 - 1
Gross carrying value as at March 31, 2018 292 1,247 518 749 285 5 3,096
Accumulated depreciation as at April 1, 2017 (4) (376) (301) (471) (168) (3) (1,323)
Depreciation (1) (43) (62) (107) (40) (1) (254)
Accumulated depreciation on deletions - - 2 17 3 1 23
Reclassified as held for sale (Refer note 2.9) - - - 4 3 - 7
Translation difference - 2 2 - (1) - 3
Accumulated depreciation as at March 31, 2018 (5) (417) (359) (557) (203) (3) (1,544)
Capital work-in progress as at April 1, 2017 303
Carrying value as at April 1, 2017 268 747 165 229 93 2 1,807
Capital work-in progress as at March 31, 2018 311
Carrying value as at March 31, 2018287 830 159 192 82 2 1,863
Carrying value of land includes $85 million and $98 million as at September 30, 2018 and March 31, 2018, respectively, towards amounts paid under certain lease-cum-sale
agreements to acquire land, including agreements where the Group has an option to purchase or renew the properties on expiry of the lease period.
The contractual commitments for capital expenditure were $215 million and $223 million as at September 30, 2018 and March 31, 2018, respectively.
The aggregate depreciation expense is included in cost of sales in the statement of comprehensive income.
22
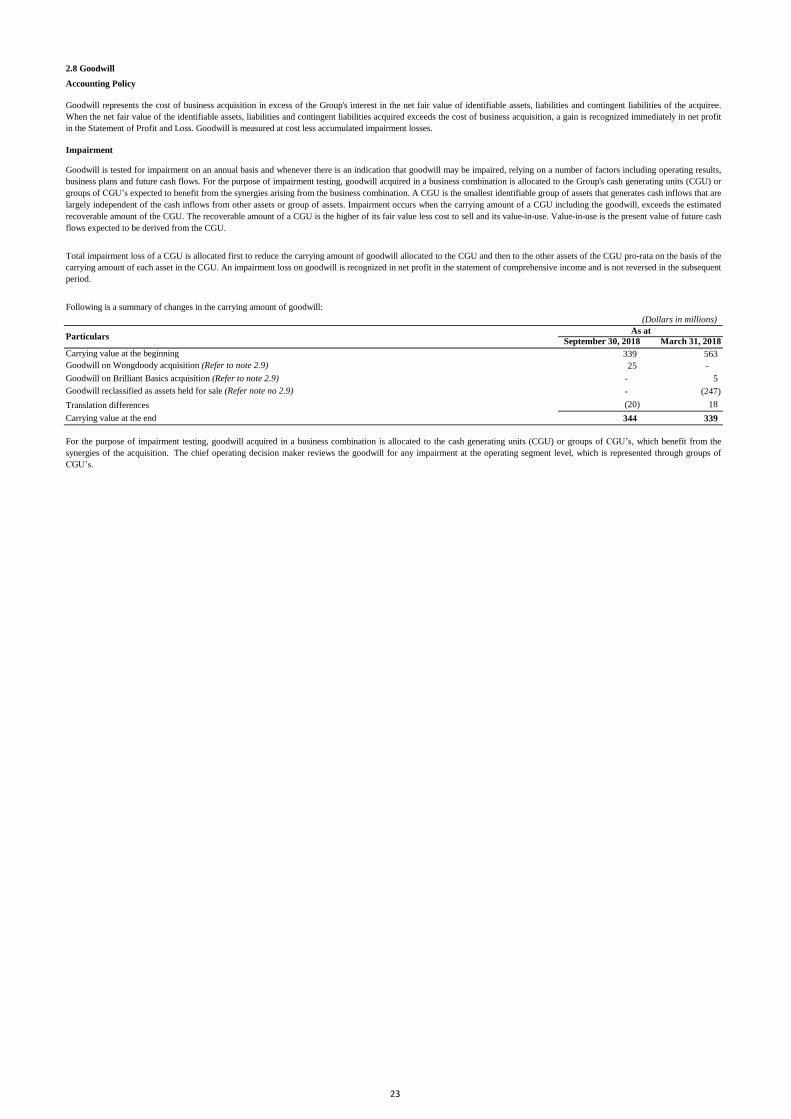
2.8 Goodwill
Accounting Policy
Following is a summary of changes in the carrying amount of goodwill:
(Dollars in millions)
September 30, 2018 March 31, 2018
Carrying value at the beginning 339 563
Goodwill on Wongdoody acquisition (Refer to note 2.9) 25 -
Goodwill on Brilliant Basics acquisition (Refer to note 2.9) - 5
Goodwill reclassified as assets held for sale (Refer note no 2.9) - (247)
Translation differences (20) 18
Carrying value at the end 344 339
As at
For the purpose of impairment testing, goodwill acquired in a business combination is allocated to the cash generating units (CGU) or groups of CGU’s, which benefit from the
synergies of the acquisition. The chief operating decision maker reviews the goodwill for any impairment at the operating segment level, which is represented through groups of
CGU’s.
Total impairment loss of a CGU is allocated first to reduce the carrying amount of goodwill allocated to the CGU and then to the other assets of the CGU pro-rata on the basis of the
carrying amount of each asset in the CGU. An impairment loss on goodwill is recognized in net profit in the statement of comprehensive income and is not reversed in the subsequent
period.
Impairment
Particulars
Goodwill is tested for impairment on an annual basis and whenever there is an indication that goodwill may be impaired, relying on a number of factors including operating results,
business plans and future cash flows. For the purpose of impairment testing, goodwill acquired in a business combination is allocated to the Group's cash generating units (CGU) or
groups of CGU’s expected to benefit from the synergies arising from the business combination. A CGU is the smallest identifiable group of assets that generates cash inflows that are
largely independent of the cash inflows from other assets or group of assets. Impairment occurs when the carrying amount of a CGU including the goodwill, exceeds the estimated
recoverable amount of the CGU. The recoverable amount of a CGU is the higher of its fair value less cost to sell and its value-in-use. Value-in-use is the present value of future cash
flows expected to be derived from the CGU.
Goodwill represents the cost of business acquisition in excess of the Group's interest in the net fair value of identifiable assets, liabilities and contingent liabilities of the acquiree.
When the net fair value of the identifiable assets, liabilities and contingent liabilities acquired exceeds the cost of business acquisition, a gain is recognized immediately in net profit
in the Statement of Profit and Loss. Goodwill is measured at cost less accumulated impairment losses.
23
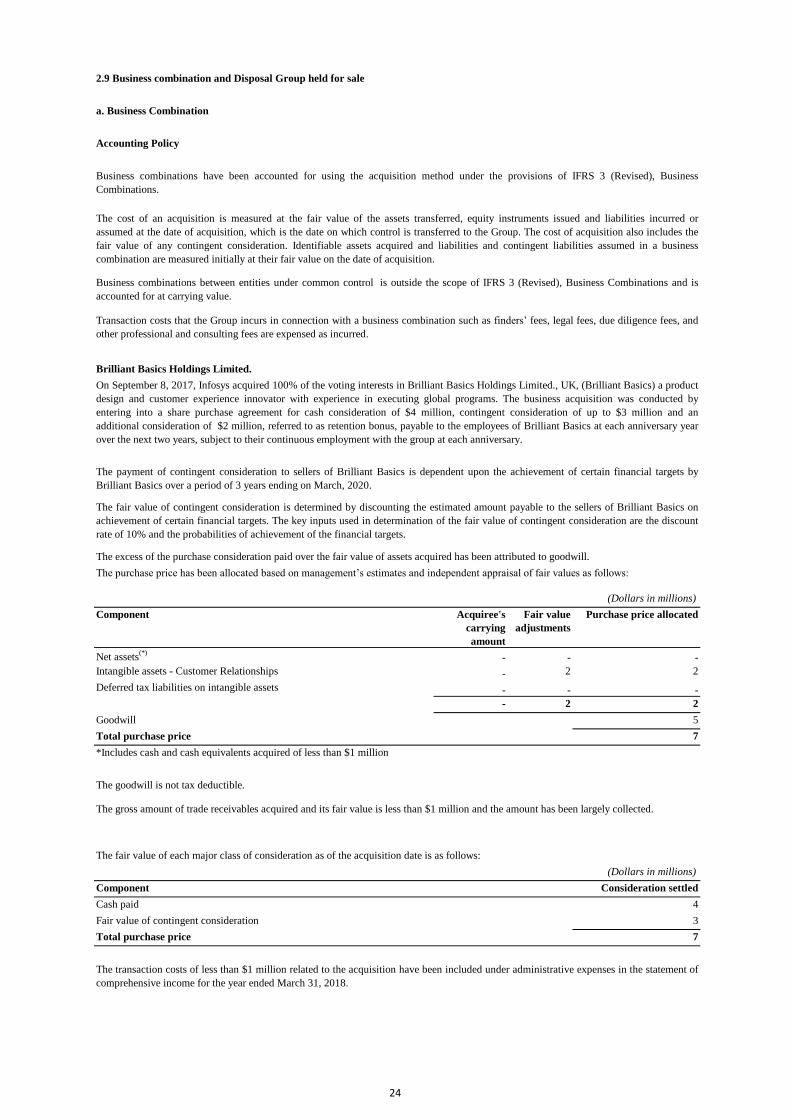
2.9 Business combination and Disposal Group held for sale
a. Business Combination
Accounting Policy
(Dollars in millions)
Net assets(*)
- - -
Intangible assets - Customer Relationships - 2 2
Deferred tax liabilities on intangible assets - - -
- 2 2
Goodwill 5
Total purchase price 7
(Dollars in millions)
Component Consideration settled
Cash paid 4
Fair value of contingent consideration 3
Total purchase price 7
Purchase price allocated
The payment of contingent consideration to sellers of Brilliant Basics is dependent upon the achievement of certain financial targets by
Brilliant Basics over a period of 3 years ending on March, 2020.
The fair value of contingent consideration is determined by discounting the estimated amount payable to the sellers of Brilliant Basics on
achievement of certain financial targets. The key inputs used in determination of the fair value of contingent consideration are the discount
rate of 10% and the probabilities of achievement of the financial targets.
Transaction costs that the Group incurs in connection with a business combination such as finders’ fees, legal fees, due diligence fees, and
other professional and consulting fees are expensed as incurred.
Business combinations have been accounted for using the acquisition method under the provisions of IFRS 3 (Revised), Business
Combinations.
The cost of an acquisition is measured at the fair value of the assets transferred, equity instruments issued and liabilities incurred or
assumed at the date of acquisition, which is the date on which control is transferred to the Group. The cost of acquisition also includes the
fair value of any contingent consideration. Identifiable assets acquired and liabilities and contingent liabilities assumed in a business
combination are measured initially at their fair value on the date of acquisition.
Business combinations between entities under common control is outside the scope of IFRS 3 (Revised), Business Combinations and is
accounted for at carrying value.
On September 8, 2017, Infosys acquired 100% of the voting interests in Brilliant Basics Holdings Limited., UK, (Brilliant Basics) a product
design and customer experience innovator with experience in executing global programs. The business acquisition was conducted by
entering into a share purchase agreement for cash consideration of $4 million, contingent consideration of up to $3 million and an
additional consideration of $2 million, referred to as retention bonus, payable to the employees of Brilliant Basics at each anniversary year
over the next two years, subject to their continuous employment with the group at each anniversary.
The purchase price has been allocated based on management’s estimates and independent appraisal of fair values as follows:
Component Acquiree's
carrying
amount
Fair value
adjustments
Brilliant Basics Holdings Limited.
The excess of the purchase consideration paid over the fair value of assets acquired has been attributed to goodwill.
The transaction costs of less than $1 million related to the acquisition have been included under administrative expenses in the statement of
comprehensive income for the year ended March 31, 2018.
*Includes cash and cash equivalents acquired of less than $1 million
The goodwill is not tax deductible.
The gross amount of trade receivables acquired and its fair value is less than $1 million and the amount has been largely collected.
The fair value of each major class of consideration as of the acquisition date is as follows:
24

Wongdoody Holding Company Inc.
(Dollars in millions)
Net assets(*) 5 - 5
Intangible assets - Customer contracts and relationships - 20 20
Intangible assets - Trade name - 1 1
5 21 26
Goodwill 25
Total purchase price 51
* Includes cash and cash equivalents acquired of $8 million.
(Dollars in millions)
Cash consideration 38
Fair value of contingent consideration 13
Total purchase price 51
Acquisitions
Trusted Source Pte Ltd
Fluido Oy
On May 22, 2018, Infosys acquired 100% of the voting interests in WongDoody Holding Company Inc., (WongDoody) an US-based, full-
service creative and consumer insights agency. The business acquisition was conducted by entering into a share purchase agreement for a
total consideration of up to $75 million, which includes a cash consideration of $38 million, contingent consideration of up to $28 million
and an additional consideration of up to $9 million, referred to as retention bonus, payable to the employees of WongDoody over the next
three years, subject to their continuous employment with the group.
WongDoody, brings to Infosys the creative talent and marketing and brand engagement expertise. Further the acquisition is expected to
strengthen Infosys’ creative, branding and customer experience capabilities to bring innovative thinking, talent and creativity to clients.
The purchase price has been allocated based on management’s estimates and independent appraisal of fair values as follows:
Component Acquiree's
carrying
amount
Fair value
adjustments
Purchase price allocated
Goodwill is tax deductible
The fair value of each major class of consideration as of the acquisition date is as follows:
Component Consideration settled
The gross amount of trade receivables acquired and its fair value is $2 million and the amount has been fully collected.
The payment of contingent consideration to sellers of WongDoody is dependent upon the achievement of certain financial targets by
WongDoody. At the acquisition date, the key inputs used in determination of the fair value of contingent consideration are the discount rate
of 16% and the probabilities of achievement of the financial targets. The undiscounted value of contingent consideration as of September
30, 2018 is $17 million.
The transaction costs of less than $1 million related to the acquisition have been included under administrative expenses in the statement of
comprehensive income for the six months ended September 30, 2018.
On September 7, 2018, Infosys Consulting Pte Limited (a wholly owned subsidiary of Infosys Limited) entered into a definitive agreement
to acquire 60% stake in Trusted Source Pte Ltd (a wholly owned subsidiary of Temasek Management Services Pte. Ltd.), a Singapore based
IT services company for a total consideration of up to SGD 12 million (approximately $9 million), subject to regulatory approvals and
fulfillment of closing conditions.
On October 11, 2018, Infosys Consulting Pte Limited (a wholly owned subsidiary of Infosys Limited) acquired 100% of voting interests in
Fluido Oy (Fluido), a Nordic-based salesforce advisor and consulting partner in cloud consulting, implementation and training services for a
total consideration of upto Euro 65 million (approximately $75 million), comprising of cash consideration of Euro 45 million
(approximately $52 million), contingent consideration of upto Euro 12 million (approximately $14 million) and retention payouts of upto
Euro 8 million (approximately $9 million), payable to the employees of Fluido over the next three years, subject to their continuous
employment with the group. The payment of contingent consideration to sellers of Fluido is dependent upon the achievement of certain
financial targets by Fluido.
As of October 16, 2018 (i.e., the date of adoption of financial statements by the Board of Directors), the Company is in the process of
finalizing the accounting for acquisition of Fluido, including allocation of purchase consideration to identifiable assets and liabilities.
25

b. Disposal Group held for sale
Accounting policy
Non current assets and Disposal Group are classified as held for sale if their carrying amount is intended to be recovered principally through
sale rather than through continuing use. The condition for classification of held for sale is met when the non current asset or the Disposal
Group is available for immediate sale and the same is highly probable of being completed within one year from the date of classification as
held for sale. Non current assets and Disposal Group held for sale are measured at the lower of carrying amount and fair value less cost to
sell.
In the quarter ended March 2018, on conclusion of a strategic review of the portfolio businesses, the Company initiated identification and
evaluation of potential buyers for its subsidiaries, Kallidus and Skava (together referred to as "Skava”) and Panaya (collectively referred to
as the “Disposal Group”). The Company anticipates completion of the sale by March 2019. On reclassification, assets and liabilities in
respect of the Disposal Group have been reclassified as “held for sale" and measured at the lower of carrying amount and fair value less cost
to sell. Consequently, a reduction in the fair value of Disposal Group held for sale amounting to $18 million in respect of Panaya has been
recognized in the consolidated statement of comprehensive income for the quarter and year ended March 31, 2018. During the quarter
ended June 30, 2018, on remeasurement, including consideration of progress in negotiations on offers from prospective buyers for Panaya,
the Company has recorded a reduction in the fair value of Disposal Group held for sale amounting to $39 million in respect of Panaya.
As of September 30, 2018 assets amounting to $270 million and liabilities amounting to $48 million in respect of the Disposal Group have
been classified as “held for sale" as of September 30, 2018. The Disposal Group does not constitute a separate major component of the
company and therefore has not been classified as discontinued operations.
26
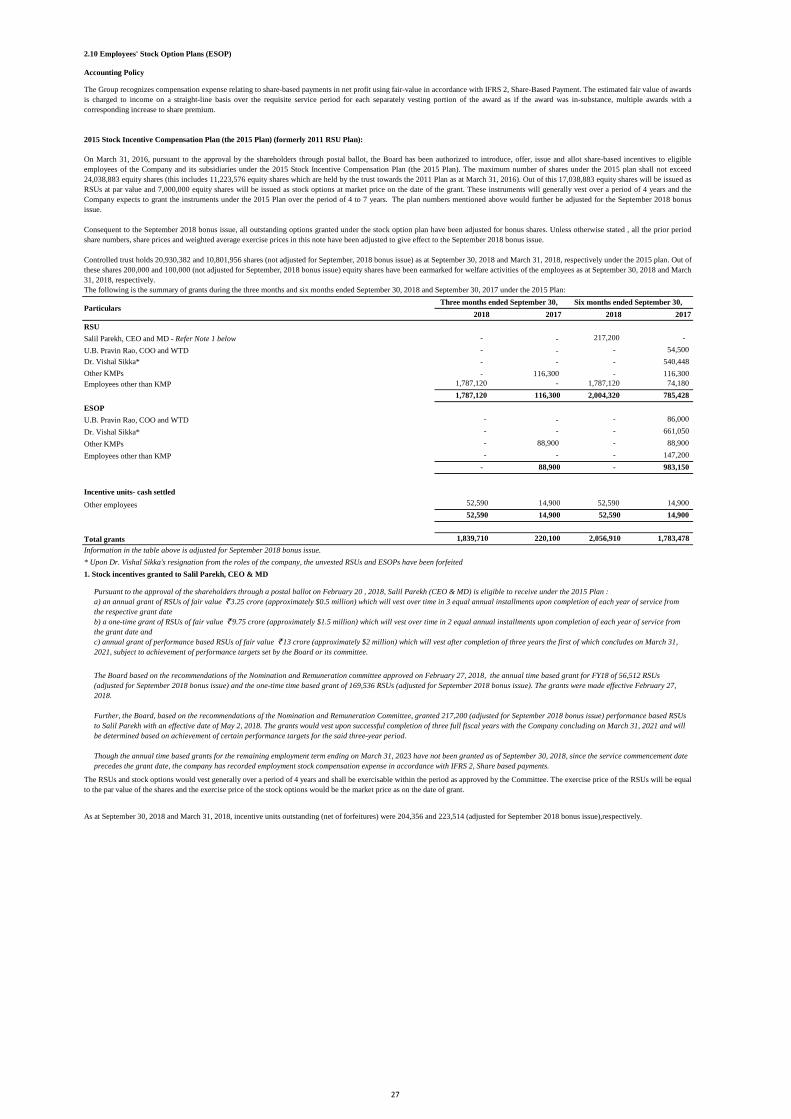
2.10 Employees' Stock Option Plans (ESOP)
Accounting Policy
2018 2017 2018 2017
RSU
Salil Parekh, CEO and MD - Refer Note 1 below - - 217,200 -
U.B. Pravin Rao, COO and WTD - - - 54,500
Dr. Vishal Sikka* - - - 540,448
Other KMPs - 116,300 - 116,300
Employees other than KMP 1,787,120 - 1,787,120 74,180
1,787,120 116,300 2,004,320 785,428
ESOP
U.B. Pravin Rao, COO and WTD - - - 86,000
Dr. Vishal Sikka* - - - 661,050
Other KMPs - 88,900 - 88,900
Employees other than KMP - - - 147,200
- 88,900 - 983,150
Incentive units- cash settled
Other employees 52,590 14,900 52,590 14,900
52,590 14,900 52,590 14,900
Total grants 1,839,710 220,100 2,056,910 1,783,478
1. Stock incentives granted to Salil Parekh, CEO & MD
Particulars
2015 Stock Incentive Compensation Plan (the 2015 Plan) (formerly 2011 RSU Plan):
On March 31, 2016, pursuant to the approval by the shareholders through postal ballot, the Board has been authorized to introduce, offer, issue and allot share-based incentives to eligible
employees of the Company and its subsidiaries under the 2015 Stock Incentive Compensation Plan (the 2015 Plan). The maximum number of shares under the 2015 plan shall not exceed
24,038,883 equity shares (this includes 11,223,576 equity shares which are held by the trust towards the 2011 Plan as at March 31, 2016). Out of this 17,038,883 equity shares will be issued as
RSUs at par value and 7,000,000 equity shares will be issued as stock options at market price on the date of the grant. These instruments will generally vest over a period of 4 years and the
Company expects to grant the instruments under the 2015 Plan over the period of 4 to 7 years. The plan numbers mentioned above would further be adjusted for the September 2018 bonus
issue.
Consequent to the September 2018 bonus issue, all outstanding options granted under the stock option plan have been adjusted for bonus shares. Unless otherwise stated , all the prior period
share numbers, share prices and weighted average exercise prices in this note have been adjusted to give effect to the September 2018 bonus issue.
Controlled trust holds 20,930,382 and 10,801,956 shares (not adjusted for September, 2018 bonus issue) as at September 30, 2018 and March 31, 2018, respectively under the 2015 plan. Out of
these shares 200,000 and 100,000 (not adjusted for September, 2018 bonus issue) equity shares have been earmarked for welfare activities of the employees as at September 30, 2018 and March
31, 2018, respectively.
The following is the summary of grants during the three months and six months ended September 30, 2018 and September 30, 2017 under the 2015 Plan:
The Group recognizes compensation expense relating to share-based payments in net profit using fair-value in accordance with IFRS 2, Share-Based Payment. The estimated fair value of awards
is charged to income on a straight-line basis over the requisite service period for each separately vesting portion of the award as if the award was in-substance, multiple awards with a
corresponding increase to share premium.
Pursuant to the approval of the shareholders through a postal ballot on February 20 , 2018, Salil Parekh (CEO & MD) is eligible to receive under the 2015 Plan :
a) an annual grant of RSUs of fair value ` 3.25 crore (approximately $0.5 million) which will vest over time in 3 equal annual installments upon completion of each year of service from
the respective grant date
b) a one-time grant of RSUs of fair value ` 9.75 crore (approximately $1.5 million) which will vest over time in 2 equal annual installments upon completion of each year of service from
the grant date and
c) annual grant of performance based RSUs of fair value ` 13 crore (approximately $2 million) which will vest after completion of three years the first of which concludes on March 31,
2021, subject to achievement of performance targets set by the Board or its committee.
Information in the table above is adjusted for September 2018 bonus issue.
Six months ended September 30,
The RSUs and stock options would vest generally over a period of 4 years and shall be exercisable within the period as approved by the Committee. The exercise price of the RSUs will be equal
to the par value of the shares and the exercise price of the stock options would be the market price as on the date of grant.
Three months ended September 30,
* Upon Dr. Vishal Sikka's resignation from the roles of the company, the unvested RSUs and ESOPs have been forfeited
The Board based on the recommendations of the Nomination and Remuneration committee approved on February 27, 2018, the annual time based grant for FY18 of 56,512 RSUs
(adjusted for September 2018 bonus issue) and the one-time time based grant of 169,536 RSUs (adjusted for September 2018 bonus issue). The grants were made effective February 27,
2018.
Further, the Board, based on the recommendations of the Nomination and Remuneration Committee, granted 217,200 (adjusted for September 2018 bonus issue) performance based RSUs
to Salil Parekh with an effective date of May 2, 2018. The grants would vest upon successful completion of three full fiscal years with the Company concluding on March 31, 2021 and will
be determined based on achievement of certain performance targets for the said three-year period.
Though the annual time based grants for the remaining employment term ending on March 31, 2023 have not been granted as of September 30, 2018, since the service commencement date
precedes the grant date, the company has recorded employment stock compensation expense in accordance with IFRS 2, Share based payments.
As at September 30, 2018 and March 31, 2018, incentive units outstanding (net of forfeitures) were 204,356 and 223,514 (adjusted for September 2018 bonus issue),respectively.
27
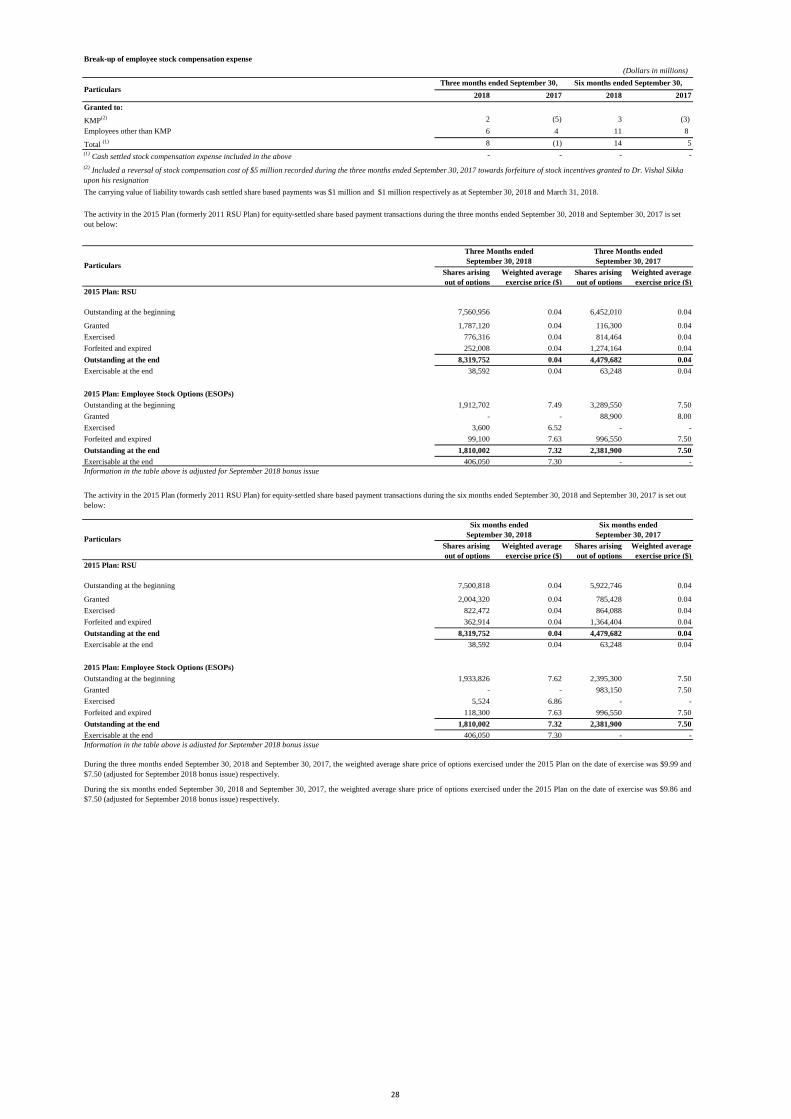
(Dollars in millions)
2018 2017 2018 2017
Granted to:
KMP(2) 2 (5) 3 (3)
Employees other than KMP 6 4 11 8
Total (1) 8 (1) 14 5
- - - -
Shares arising
out of options
Weighted average
exercise price ($)
Shares arising
out of options
Weighted average
exercise price ($)
2015 Plan: RSU
Outstanding at the beginning 7,560,956 0.04 6,452,010 0.04
Granted 1,787,120 0.04 116,300 0.04
Exercised 776,316 0.04 814,464 0.04
Forfeited and expired 252,008 0.04 1,274,164 0.04
Outstanding at the end 8,319,752 0.04 4,479,682 0.04
Exercisable at the end 38,592 0.04 63,248 0.04
2015 Plan: Employee Stock Options (ESOPs)
Outstanding at the beginning 1,912,702 7.49 3,289,550 7.50
Granted - - 88,900 8.00
Exercised 3,600 6.52 - -
Forfeited and expired 99,100 7.63 996,550 7.50
Outstanding at the end 1,810,002 7.32 2,381,900 7.50
Exercisable at the end 406,050 7.30 - -
Information in the table above is adjusted for September 2018 bonus issue
Shares arising
out of options
Weighted average
exercise price ($)
Shares arising
out of options
Weighted average
exercise price ($)
2015 Plan: RSU
Outstanding at the beginning 7,500,818 0.04 5,922,746 0.04
Granted 2,004,320 0.04 785,428 0.04
Exercised 822,472 0.04 864,088 0.04
Forfeited and expired 362,914 0.04 1,364,404 0.04
Outstanding at the end 8,319,752 0.04 4,479,682 0.04
Exercisable at the end 38,592 0.04 63,248 0.04
2015 Plan: Employee Stock Options (ESOPs)
Outstanding at the beginning 1,933,826 7.62 2,395,300 7.50
Granted - - 983,150 7.50
Exercised 5,524 6.86 - -
Forfeited and expired 118,300 7.63 996,550 7.50
Outstanding at the end 1,810,002 7.32 2,381,900 7.50
Exercisable at the end 406,050 7.30 - -
Information in the table above is adjusted for September 2018 bonus issue
Particulars
Particulars
Particulars
The activity in the 2015 Plan (formerly 2011 RSU Plan) for equity-settled share based payment transactions during the six months ended September 30, 2018 and September 30, 2017 is set out
below:
Six months ended
September 30, 2018
During the six months ended September 30, 2018 and September 30, 2017, the weighted average share price of options exercised under the 2015 Plan on the date of exercise was $9.86 and
$7.50 (adjusted for September 2018 bonus issue) respectively.
During the three months ended September 30, 2018 and September 30, 2017, the weighted average share price of options exercised under the 2015 Plan on the date of exercise was $9.99 and
$7.50 (adjusted for September 2018 bonus issue) respectively.
The activity in the 2015 Plan (formerly 2011 RSU Plan) for equity-settled share based payment transactions during the three months ended September 30, 2018 and September 30, 2017 is set
out below:
(2) Included a reversal of stock compensation cost of $5 million recorded during the three months ended September 30, 2017 towards forfeiture of stock incentives granted to Dr. Vishal Sikka
upon his resignation
Three Months ended
September 30, 2018
Six months ended
September 30, 2017
Three Months ended
September 30, 2017
Three months ended September 30, Six months ended September 30,
(1) Cash settled stock compensation expense included in the above
Break-up of employee stock compensation expense
The carrying value of liability towards cash settled share based payments was $1 million and $1 million respectively as at September 30, 2018 and March 31, 2018.
28

The following table summarizes information about equity settled RSUs and ESOPs outstanding as at September 30, 2018:
No. of shares arising
out of options
Weighted
average
remaining
contractual life
Weighted average
exercise price ($)
2015 Plan:
0 - 0.04 (RSU) 8,319,752 1.77 0.04
6 - 8 (ESOP) 1,810,002 5.64 7.32
10,129,754 2.46 1.34
Information in the table above is adjusted for September 2018 bonus issue
The following table summarizes information about equity settled RSUs and ESOPs outstanding as at March 31, 2018:
No. of shares arising
out of options
Weighted
average
remaining
contractual life
Weighted average
exercise price ($)
2015 Plan:
0 - 0.04 (RSU) 7,500,818 1.89 0.04
6 - 8 (ESOP) 1,933,826 6.60 7.62
9,434,644 2.57 1.59
Information in the table above is adjusted for September 2018 bonus issue
The fair value of each equity settled award is estimated on the date of grant using the Black-Scholes-Merton model with the following assumptions:
Fiscal 2019-
Equity Shares-
RSU
Fiscal 2019-
ADS-RSU
Weighted average share price (`) / ($- ADS)(1)
669 20.35
Exercise price (`)/ ($- ADS)(1)
2.50 0.04
Expected volatility (%) 21-25 22-26
Expected life of the option (years) 1-4 1-4
Expected dividends (%) 2.65 2.65
Risk-free interest rate (%) 7-8 2-3
Weighted average fair value as on grant date (`) / ($- ADS)(1)
623 9.49
Fiscal 2018-
Equity Shares-
RSU
Fiscal 2018-
Equity shares ESOP
Fiscal 2018-
ADS-RSU
Fiscal 2018-
ADS- ESOP
Weighted average share price (`) / ($- ADS)(1) 572 461 8.31 7.32
Exercise price (`)/ ($- ADS)(1)
2.50 459 0.04 7.33
Expected volatility (%) 20-25 25-28 21-26 25-31
Expected life of the option (years) 1 - 4 3 - 7 1 - 4 3 - 7
Expected dividends (%) 2.78 2.78 2.74 2.74
Risk-free interest rate (%) 6 - 7 6 - 7 1 - 2 1 - 2
Weighted average fair value as on grant date (`) / ($- ADS)(1)
533 127 7.74 1.47 (1)
Adjusted for September 2018 bonus issue
Particulars
For options granted in
Options outstanding
Range of exercise prices per share ($)
Particulars
The expected life of the RSU / ESOP is estimated based on the vesting term and contractual term of the RSU / ESOP, as well as expected exercise behavior of the employee who receives the
RSU / ESOP. Expected volatility during the expected term of the RSU / ESOP is based on historical volatility of the observed market prices of the Company's publicly traded equity shares
during a period equivalent to the expected term of the RSU / ESOP.
Range of exercise prices per share ($)
Options outstanding
For options granted in
29
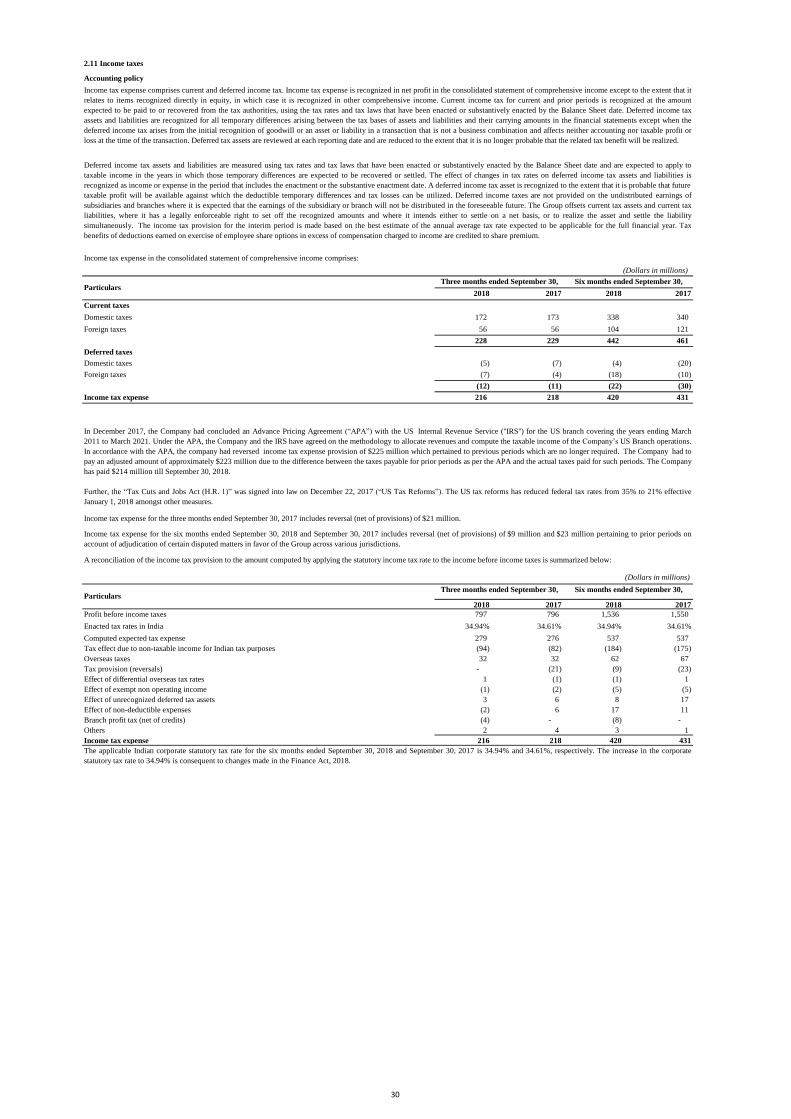
2.11 Income taxes
Accounting policy
(Dollars in millions)
2018 2017 2018 2017
Current taxes
Domestic taxes 172 173 338 340
Foreign taxes 56 56 104 121
228 229 442 461
Deferred taxes
Domestic taxes (5) (7) (4) (20)
Foreign taxes (7) (4) (18) (10)
(12) (11) (22) (30)
Income tax expense 216 218 420 431
(Dollars in millions)
2018 2017 2018 2017
Profit before income taxes 797 796 1,536 1,550
Enacted tax rates in India 34.94% 34.61% 34.94% 34.61%
Computed expected tax expense 279 276 537 537
Tax effect due to non-taxable income for Indian tax purposes (94) (82) (184) (175)
Overseas taxes 32 32 62 67
Tax provision (reversals) - (21) (9) (23)
Effect of differential overseas tax rates 1 (1) (1) 1
Effect of exempt non operating income (1) (2) (5) (5)
Effect of unrecognized deferred tax assets 3 6 8 17
Effect of non-deductible expenses (2) 6 17 11
Branch profit tax (net of credits) (4) - (8) -
Others 2 4 3 1
Income tax expense 216 218 420 431
Particulars
Particulars
Deferred income tax assets and liabilities are measured using tax rates and tax laws that have been enacted or substantively enacted by the Balance Sheet date and are expected to apply to
taxable income in the years in which those temporary differences are expected to be recovered or settled. The effect of changes in tax rates on deferred income tax assets and liabilities is
recognized as income or expense in the period that includes the enactment or the substantive enactment date. A deferred income tax asset is recognized to the extent that it is probable that future
taxable profit will be available against which the deductible temporary differences and tax losses can be utilized. Deferred income taxes are not provided on the undistributed earnings of
subsidiaries and branches where it is expected that the earnings of the subsidiary or branch will not be distributed in the foreseeable future. The Group offsets current tax assets and current tax
liabilities, where it has a legally enforceable right to set off the recognized amounts and where it intends either to settle on a net basis, or to realize the asset and settle the liability
simultaneously. The income tax provision for the interim period is made based on the best estimate of the annual average tax rate expected to be applicable for the full financial year. Tax
benefits of deductions earned on exercise of employee share options in excess of compensation charged to income are credited to share premium.
Income tax expense for the six months ended September 30, 2018 and September 30, 2017 includes reversal (net of provisions) of $9 million and $23 million pertaining to prior periods on
account of adjudication of certain disputed matters in favor of the Group across various jurisdictions.
Six months ended September 30,
The applicable Indian corporate statutory tax rate for the six months ended September 30, 2018 and September 30, 2017 is 34.94% and 34.61%, respectively. The increase in the corporate
statutory tax rate to 34.94% is consequent to changes made in the Finance Act, 2018.
Income tax expense in the consolidated statement of comprehensive income comprises:
Six months ended September 30,Three months ended September 30,
In December 2017, the Company had concluded an Advance Pricing Agreement (“APA”) with the US Internal Revenue Service ("IRS") for the US branch covering the years ending March
2011 to March 2021. Under the APA, the Company and the IRS have agreed on the methodology to allocate revenues and compute the taxable income of the Company’s US Branch operations.
In accordance with the APA, the company had reversed income tax expense provision of $225 million which pertained to previous periods which are no longer required. The Company had to
pay an adjusted amount of approximately $223 million due to the difference between the taxes payable for prior periods as per the APA and the actual taxes paid for such periods. The Company
has paid $214 million till September 30, 2018.
Further, the “Tax Cuts and Jobs Act (H.R. 1)” was signed into law on December 22, 2017 (“US Tax Reforms”). The US tax reforms has reduced federal tax rates from 35% to 21% effective
January 1, 2018 amongst other measures.
Income tax expense for the three months ended September 30, 2017 includes reversal (net of provisions) of $21 million.
A reconciliation of the income tax provision to the amount computed by applying the statutory income tax rate to the income before income taxes is summarized below:
Three months ended September 30,
Income tax expense comprises current and deferred income tax. Income tax expense is recognized in net profit in the consolidated statement of comprehensive income except to the extent that it
relates to items recognized directly in equity, in which case it is recognized in other comprehensive income. Current income tax for current and prior periods is recognized at the amount
expected to be paid to or recovered from the tax authorities, using the tax rates and tax laws that have been enacted or substantively enacted by the Balance Sheet date. Deferred income tax
assets and liabilities are recognized for all temporary differences arising between the tax bases of assets and liabilities and their carrying amounts in the financial statements except when the
deferred income tax arises from the initial recognition of goodwill or an asset or liability in a transaction that is not a business combination and affects neither accounting nor taxable profit or
loss at the time of the transaction. Deferred tax assets are reviewed at each reporting date and are reduced to the extent that it is no longer probable that the related tax benefit will be realized.
30

2.12 Reconciliation of basic and diluted shares used in computing earnings per share
Accounting Policy
2018 2017 2018 2017
Basic earnings per equity share - weighted average number of equity shares outstanding(1) 4,347,055,177 4,571,730,722 4,346,857,296 4,571,524,372
Effect of dilutive common equivalent shares - share options outstanding 5,153,295 3,321,644 5,057,914 4,240,696
4,352,208,472 4,575,052,366 4,351,915,210 4,575,765,068
(1) excludes treasury shares
Particulars
The above table is adjusted for September 2018 bonus issue
Three months ended September 30,
Infosys is subject to a 15% Branch Profit Tax (BPT) in the U.S. to the extent its U.S. branch's net profit during the year is greater than the increase in the net assets of the U.S. branch during the
year, computed in accordance with the Internal Revenue Code. As of March 31, 2018, Infosys' U.S. branch net assets amounted to approximately $772 million. As of September 30, 2018, the
Company has a deferred tax liability for branch profit tax of $17 million (net of credits), as the Company estimates that these branch profits are expected to be distributed in the foreseeable
future.
Entire deferred income tax for the three months and six months ended September 30, 2018 and September 30, 2017, relates to origination and reversal of temporary differences.
The foreign tax expense is due to income taxes payable overseas, principally in the United States. In India, the Group has benefited from certain income tax incentives that the Government of
India had provided for export of software from the units registered under the Special Economic Zones Act (SEZs), 2005. SEZ units which began the provision of services on or after April 1,
2005 are eligible for a deduction of 100% of profits or gains derived from the export of services for the first five years from the financial year in which the unit commenced the provision of
services and 50% of such profits or gains for further five years. Up to 50% of such profits or gains is also available for a further five years subject to creation of a Special Economic Zone re-
investment Reserve out of the profit for the eligible SEZ units and utilization of such reserve by the Company for acquiring new plant and machinery for the purpose of its business as per the
provisions of the Income Tax Act, 1961.
Six months ended September 30,
Diluted earnings per equity share - weighted average number of equity shares and common equivalent shares
outstanding
As at March 31, 2018, claims against the Group not acknowledged as debts from the Indian Income tax authorities amounted to `4,542 crore ($697 million). Amount paid to statutory authorities
against this amounted to `6,540 crore ($1,003 million).
As at September 30, 2018, claims against the Group not acknowledged as debts from the Income tax authorities amounted to `3,011 crore ($415 million). These matters are pending before
various Appellate Authorities and the management including its tax advisors expect that its position will likely be upheld on ultimate resolution and will not have a material adverse effect on the
Group's financial position and results of operations.
Amount paid to statutory authorities against the above tax claims amounted to `6,539 crore ($902 million).
Subsequent to March 31, 2018, the Supreme Court of India ruled favorably in respect of certain income tax claims which have been given effect in the above disclosure of claims as of
September 30, 2018.
Basic earnings per equity share is computed by dividing the net profit attributable to the equity holders of the company by the weighted average number of equity shares outstanding during the
period. Diluted earnings per equity share is computed by dividing the net profit attributable to the equity holders of the company by the weighted average number of equity shares considered for
deriving basic earnings per equity share and also the weighted average number of equity shares that could have been issued upon conversion of all dilutive potential equity shares. The dilutive
potential equity shares are adjusted for the proceeds receivable had the equity shares been actually issued at fair value (i.e. the average market value of the outstanding equity shares). Dilutive
potential equity shares are deemed converted as of the beginning of the period, unless issued at a later date. Dilutive potential equity shares are determined independently for each period
presented.
The number of equity shares and potentially dilutive equity shares are adjusted retrospectively for all periods presented for any share splits and bonus shares issues including for changes
effected prior to the approval of the financial statements by the Board of Directors.
For the three months and six months ended September 30, 2018, there were no options to purchase equity shares that had an anti-dilutive effect.
For the three months and six months ended September 30, 2017, 380,908 (adjusted for September 2018 bonus issue) and 375,760 (adjusted for September 2018 bonus issue) number of options
to purchase equity shares had an anti-dilutive effect respectively.
The following is a reconciliation of the equity shares used in the computation of basic and diluted earnings per equity share:
31

2.13 Related party transactions
Changes in Subsidiaries
During the six months ended September 30, 2018, the following are the changes in the subsidiaries:
- On August 6, 2018, Infosys Luxembourg SARL was incorporated as a wholly-owned subsidiary of Infosys Limited
-
-
- Infosys Consulting Ltda became the majority owned and controlled subsidiary of Infosys Limited
Changes in Key management personnel
• Michael Nelson Gibbs appointed as an Independent Director effective July 13, 2018.
• Ravi Venkatesan, resigned from his position as Co-Chairman effective August 24, 2017 and resigned as member of the Board effective May 11, 2018
Transactions with key management personnel
(Dollars in millions)
2018 2017 2018 2017
4 (2) 7 2
Commission and other benefits to non-executive/ independent directors - 1 1 1
Total 4 (1) 8 3
Investment in Associate
Salaries and other employee benefits to whole-time directors and executive officers(1)(2)
During the three months ended June 30, 2017, the Company has written down the entire carrying value of the investment in its associate DWA Nova LLC amounting to $11 million.
The table below describes the compensation to key management personnel which comprise directors and executive officers:
(1)Total employee stock compensation expense for the three months and six months ended September 30, 2018 includes $2 million and $3 million, respectively towards key managerial personnel. For
the three months and six months ended September 30, 2017, a reversal of employee stock compensation expense of $5 million and $3 million, respectively, was recorded towards key managerial
personnel.(Refer to note 2.10)
(2) Includes a reversal of stock compensation cost of $5 million recorded during the three months and six months ended September 30, 2017 towards forfeiture of stock incentive granted to Dr. Vishal
Sikka upon his resignation (Refer to note 2.10)
Particulars Six months ended September 30,
Lodestone Management Consultants Inc. has been liquidated effective May 17, 2018
Three months ended September 30,
On May 22, 2018, Infosys acquired 100% voting rights in WongDoody Holding Company Inc., along with its two subsidiaries, WDW Communications, Inc and WongDoody, Inc. (Refer note 2.9)
• On August 18, 2018, the Board accepted the resignation of M. D. Ranganath as the Chief Financial Officer of the Company. Ranganath will continue in his current position as Chief Financial Officer
till November 16, 2018.
Refer Note 2.19 "Related party transactions" in the Company’s 2018 Annual Report on Form 20-F for the full names and other details of the Company's subsidiaries, associate and controlled trusts.
Infosys has provided guarantee for performance of certain contracts entered into by its subsidiaries.
The following were the changes in key management personnel:-
• Ravi Venkatesan, resigned from his position as Co-Chairman effective August 24, 2017 and resigned as member of the Board effective May 11, 2018
32
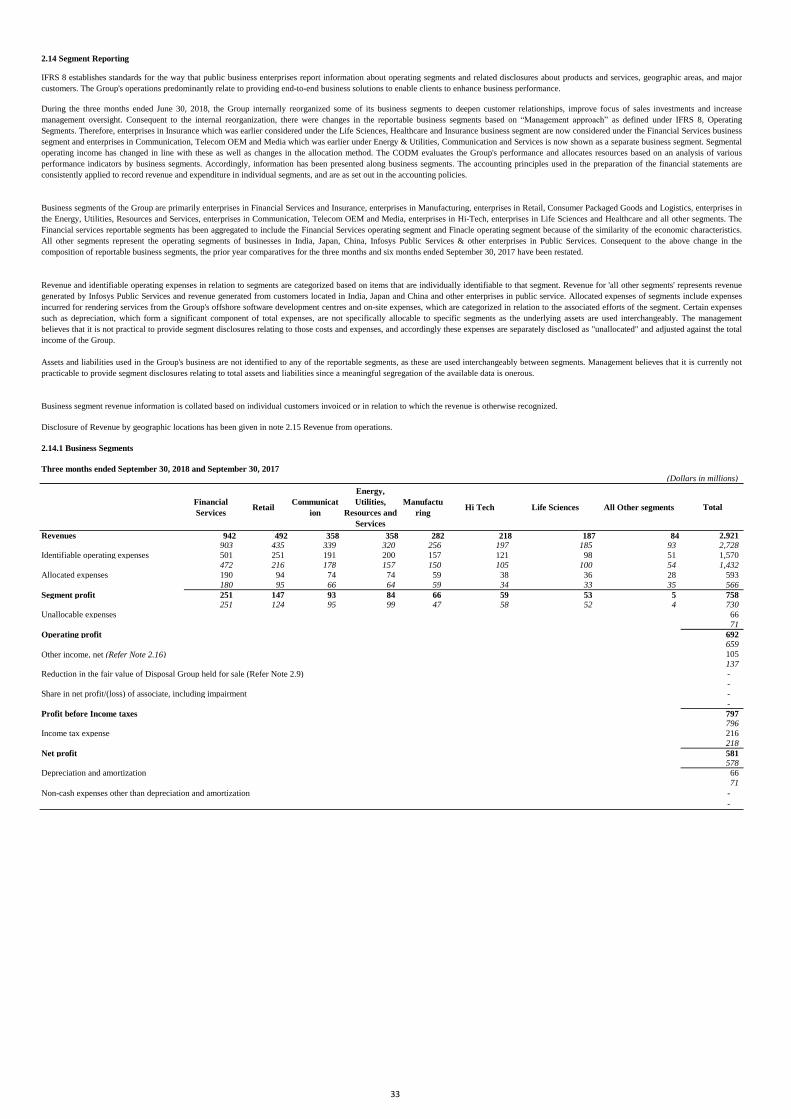
2.14 Segment Reporting
2.14.1 Business Segments
Three months ended September 30, 2018 and September 30, 2017(Dollars in millions)
Financial
ServicesRetail
Communicat
ion
Energy,
Utilities,
Resources and
Services
Manufactu
ringHi Tech Life Sciences All Other segments Total
Revenues 942 492 358 358 282 218 187 84 2,921 903 435 339 320 256 197 185 93 2,728
Identifiable operating expenses 501 251 191 200 157 121 98 51 1,570
472 216 178 157 150 105 100 54 1,432
Allocated expenses 190 94 74 74 59 38 36 28 593
180 95 66 64 59 34 33 35 566
Segment profit 251 147 93 84 66 59 53 5 758 251 124 95 99 47 58 52 4 730
Unallocable expenses 66
71
Operating profit 692 659
Other income, net (Refer Note 2.16) 105
137
Reduction in the fair value of Disposal Group held for sale (Refer Note 2.9) -
-
Share in net profit/(loss) of associate, including impairment -
-
Profit before Income taxes 797 796
Income tax expense 216
218
Net profit 581 578
Depreciation and amortization 66
71
Non-cash expenses other than depreciation and amortization -
-
IFRS 8 establishes standards for the way that public business enterprises report information about operating segments and related disclosures about products and services, geographic areas, and major
customers. The Group's operations predominantly relate to providing end-to-end business solutions to enable clients to enhance business performance.
During the three months ended June 30, 2018, the Group internally reorganized some of its business segments to deepen customer relationships, improve focus of sales investments and increase
management oversight. Consequent to the internal reorganization, there were changes in the reportable business segments based on “Management approach” as defined under IFRS 8, Operating
Segments. Therefore, enterprises in Insurance which was earlier considered under the Life Sciences, Healthcare and Insurance business segment are now considered under the Financial Services business
segment and enterprises in Communication, Telecom OEM and Media which was earlier under Energy & Utilities, Communication and Services is now shown as a separate business segment. Segmental
operating income has changed in line with these as well as changes in the allocation method. The CODM evaluates the Group's performance and allocates resources based on an analysis of various
performance indicators by business segments. Accordingly, information has been presented along business segments. The accounting principles used in the preparation of the financial statements are
consistently applied to record revenue and expenditure in individual segments, and are as set out in the accounting policies.
Business segment revenue information is collated based on individual customers invoiced or in relation to which the revenue is otherwise recognized.
Business segments of the Group are primarily enterprises in Financial Services and Insurance, enterprises in Manufacturing, enterprises in Retail, Consumer Packaged Goods and Logistics, enterprises in
the Energy, Utilities, Resources and Services, enterprises in Communication, Telecom OEM and Media, enterprises in Hi-Tech, enterprises in Life Sciences and Healthcare and all other segments. The
Financial services reportable segments has been aggregated to include the Financial Services operating segment and Finacle operating segment because of the similarity of the economic characteristics.
All other segments represent the operating segments of businesses in India, Japan, China, Infosys Public Services & other enterprises in Public Services. Consequent to the above change in the
composition of reportable business segments, the prior year comparatives for the three months and six months ended September 30, 2017 have been restated.
Assets and liabilities used in the Group's business are not identified to any of the reportable segments, as these are used interchangeably between segments. Management believes that it is currently not
practicable to provide segment disclosures relating to total assets and liabilities since a meaningful segregation of the available data is onerous.
Disclosure of Revenue by geographic locations has been given in note 2.15 Revenue from operations.
Revenue and identifiable operating expenses in relation to segments are categorized based on items that are individually identifiable to that segment. Revenue for 'all other segments' represents revenue
generated by Infosys Public Services and revenue generated from customers located in India, Japan and China and other enterprises in public service. Allocated expenses of segments include expenses
incurred for rendering services from the Group's offshore software development centres and on-site expenses, which are categorized in relation to the associated efforts of the segment. Certain expenses
such as depreciation, which form a significant component of total expenses, are not specifically allocable to specific segments as the underlying assets are used interchangeably. The management
believes that it is not practical to provide segment disclosures relating to those costs and expenses, and accordingly these expenses are separately disclosed as "unallocated" and adjusted against the total
income of the Group.
33

Six months ended September 30, 2018 and September 30, 2017
(Dollars in millions)
Financial
ServicesRetail
Communicat
ion
Energy,
Utilities,
Resources and
Services
Manufactu
ringHi Tech Life Sciences All Other segments Total
Revenues 1,841 961 718 710 554 428 374 167 5,753 1,777 866 673 620 502 391 360 190 5,379
Identifiable operating expenses 983 489 378 387 309 237 197 101 3,081
923 433 344 307 293 212 188 108 2,808
Allocated expenses 375 187 147 146 119 74 72 59 1,179
365 189 132 128 120 69 65 64 1,132
Segment profit 483 285 193 177 126 117 105 7 1,493 489 244 197 185 89 110 107 18 1,439
Unallocable expenses 130
141
Operating profit 1,363 1,298
Other income, net (Refer Note 2.16) 212
263
Reduction in the fair value of Disposal Group held for sale (Refer Note 2.9) (39)
-
Share in net profit/(loss) of associate, including impairment -
(11)
Profit before Income taxes 1,536 1,550
Income tax expense 420
431
Net profit 1,116 1,119
Depreciation and amortization 130
141
Non-cash expenses other than depreciation and amortization 39
-
2.14.2 Significant clients
No client individually accounted for more than 10% of the revenues for the three months and six ended September 30, 2018 and September 30, 2017, respectively.
34

2.15 Revenue from Operations
Accounting Policy:
Revenue from licenses where the customer obtains a “right to use” the licenses is recognized at the time the license is made available to the customer. Revenue from
licenses where the customer obtains a “right to access” is recognized over the access period. Arrangements to deliver software products generally have three elements:
license, implementation and Annual Technical Services (ATS). The Group has applied the principles under IFRS 15 to account for revenues from these performance
obligations. When implementation services are provided in conjunction with the licensing arrangement and the license and implementation have been identified as
two separate performance obligations, the transaction price for such contracts are allocated to each performance obligation of the contract based on their relative
standalone selling prices. In the absence of standalone selling price for implementation, the performance obligation is estimated using the expected cost plus margin
approach. Where the license is required to be substantially customized as part of the implementation service the entire arrangement fee for license and
implementation is considered to be a single performance obligation and the revenue is recognized using the percentage-of-completion method as the implementation is
performed. Revenue from client training, support and other services arising due to the sale of software products is recognized as the performance obligations are
satisfied. ATS revenue is recognized ratably over the period in which the services are rendered.
The Group accounts for volume discounts and pricing incentives to customers as a reduction of revenue based on the ratable allocation of the discounts/ incentives to
each of the underlying performance obligation that corresponds to the progress by the customer towards earning the discount/ incentive. Also, when the level of
discount varies with increases in levels of revenue transactions, the Group recognizes the liability based on its estimate of the customer's future purchases. If it is
probable that the criteria for the discount will not be met, or if the amount thereof cannot be estimated reliably, then discount is not recognized until the payment is
probable and the amount can be estimated reliably. The Group recognizes changes in the estimated amount of obligations for discounts in the period in which the
change occurs.
Contract modifications are accounted for when additions, deletions or changes are approved either to the contract scope or contract price. The accounting for
modifications of contracts involves assessing whether the services added to an existing contract are distinct and whether the pricing is at the standalone selling price.
Services added that are not distinct are accounted for on a cumulative catch up basis, while those that are distinct are accounted for prospectively, either as a separate
contract, if the additional services are priced at the standalone selling price, or as a termination of the existing contract and creation of a new contract if not priced at
the standalone selling price.
Deferred contract costs are incremental costs of obtaining a contract which are recognised as assets and amortized over the term of the contract.
Effective April 1, 2018, the Group adopted IFRS 15 “Revenue from Contracts with Customers” using the cumulative catch-up transition method, applied to contracts
that were not completed as of April 1, 2018. In accordance with the cumulative catch-up transition method, the comparatives have not been retrospectively adjusted.
The following is a summary of new and/or revised significant accounting policies related to revenue recognition. Refer Note 2.10 "Revenue from operations" in the
Company’s 2018 Annual Report on Form 20-F for the policies in effect for revenue prior to April 1, 2018. The effect on adoption of IFRS 15 was insignificant.
The Group derives revenues primarily from business IT services comprising of software development and related services, consulting and package implementation
and from the licensing of software products and platforms across our core and digital offerings (“together called as software related services”)
Arrangements with customers for software related services are either on a fixed-price, fixed-timeframe or on a time-and-material basis.
Revenue on time-and-material contracts are recognized as the related services are performed and revenue from the end of the last invoicing to the reporting date is
recognized as unbilled revenue. Revenue from fixed-price, fixed-timeframe contracts, where the performance obligations are satisfied over time and where there is no
uncertainty as to measurement or collectability of consideration, is recognized as per the percentage-of-completion method. When there is uncertainty as to
measurement or ultimate collectability, revenue recognition is postponed until such uncertainty is resolved. Efforts or costs expended have been used to measure
progress towards completion as there is a direct relationship between input and productivity. Maintenance revenue is recognized ratably over the term of the
underlying maintenance arrangement.
In arrangements for software development and related services and maintenance services, the Group has applied the guidance in IFRS 15, Revenue from contract with
customer, by applying the revenue recognition criteria for each distinct performance obligation. The arrangements with customers generally meet the criteria for
considering software development and related services as distinct performance obligations. For allocating the transaction price, the Group has measured the revenue
in respect of each performance obligation of a contract at its relative standalone selling price. The price that is regularly charged for an item when sold separately is
the best evidence of its standalone selling price. In cases where the Group is unable to determine the standalone selling price, the Group uses the expected cost plus
margin approach in estimating the standalone selling price. For software development and related services, the performance obligations are satisfied as and when the
services are rendered since the customer generally obtains control of the work as it progresses.
Revenue is recognized upon transfer of control of promised products or services to customers in an amount that reflects the consideration we expect to receive in
exchange for those products or services.
Revenues in excess of invoicing are classified as contract assets (which we refer as unbilled revenue) while invoicing in excess of revenues are classified as contract
liabilities (which we refer to as unearned revenues).
35

(Dollars in millions)
Particulars
2018 2017 2018 2017
Revenue from software services 2,773 2,587 5,468 5,096
Revenue from products and platforms 148 141 285 283
Total revenue from operations 2,921 2,728 5,753 5,379
Three months ended September 30, 2018
(Dollars in millions)
ParticularsFinancial
Services (1) Retail
(2)Communica
tion (3)
Energy ,
Utilities,
resources and
Services
Manufactur
ingHi Tech
Life
Sciences(4) Others
(5) Total
Revenues by Geography
North America 575 317 181 204 151 209 111 14 1,762
Europe 176 136 66 121 122 4 71 5 701
India 42 1 1 - 3 4 1 21 73
Rest of the world 149 38 110 33 6 1 4 44 385
Total 942 492 358 358 282 218 187 84 2,921
Revenue by offerings
Services
Digital 270 155 122 96 77 72 41 12 845
Core 575 321 232 254 198 144 135 69 1,928
Subtotal 845 476 354 350 275 216 176 81 2,773
Products and platforms
Digital 24 14 4 4 4 2 6 2 60
Core 73 2 - 4 3 - 5 1 88
Subtotal 97 16 4 8 7 2 11 3 148
Total 942 492 358 358 282 218 187 84 2,921
Digital 294 169 126 100 81 74 47 14 905
Core 648 323 232 258 201 144 140 70 2,016
Revenues by contract type
Fixed Price 402 314 209 213 144 110 87 40 1,519
Time & Materials 540 178 149 145 138 108 100 44 1,402
Total 942 492 358 358 282 218 187 84 2,921
(Dollars in millions)
ParticularsFinancial
Services (1) Retail
(2)Communica
tion (3)
Energy ,
Utilities,
resources and
Services
Manufactur
ingHi Tech
Life
Sciences(4) Others
(5) Total
Revenues by Geography
North America 1,118 625 358 406 296 411 221 26 3,461
Europe 348 267 138 239 240 6 143 10 1,391
India 82 2 3 - 6 10 1 42 146
Rest of the world 293 67 219 65 12 1 9 89 755
Total 1,841 961 718 710 554 428 374 167 5,753
Revenue by offerings
Services
Digital 506 292 228 190 144 139 79 21 1,599
Core 1,148 641 480 505 394 287 273 141 3,869
Subtotal 1,654 933 708 695 538 426 352 162 5,468
Products and platforms
Digital 42 24 10 5 10 2 13 3 109
Core 145 4 - 10 6 - 9 2 176
Subtotal 187 28 10 15 16 2 22 5 285
Total 1,841 961 718 710 554 428 374 167 5,753
Digital 548 316 238 195 154 141 92 24 1,708
Core 1,293 645 480 515 400 287 282 143 4,045
Revenues by contract type
Fixed Price 785 610 409 425 280 224 173 79 2,985
Time & Materials 1,056 351 309 285 274 204 201 88 2,768
Total 1,841 961 718 710 554 428 374 167 5,753
Disaggregate revenue information
The Group presents revenues net of indirect taxes in its consolidated statement of comprehensive income.
The table below presents disaggregated revenues from contracts with customers by geography, offerings and contract-type for each of our business segments. The
Group believes this disaggregation best depicts how the nature, amount, timing and uncertainty of revenues and cash flows are affected by industry, market and other
economic factors.
Six months ended
September 30,
Three months ended
September 30,
Six months ended September 30, 2018
Revenues for the three months and six months ended September 30, 2018 and September 30, 2017 is as follows:
36

Digital Services
Core Services
Products & platforms
Trade Receivables and Contract Balances
(Dollars in millions)
Particulars
Balance at the beginning 444 431
Add : Revenue recognized during the period 313 593
Less : Invoiced during the period 291 558
Less : Impairment / (reversal) during the period (1) (2)
(1) (2)
Balance at the end 466 466
(Dollars in millions)
Particulars
Balance at the beginning 340 352
Less: Revenue recognized during the period 197 345
Add: Invoiced during the period but not recognized as revenues 189 324
Add: Translation loss / (gain) - 1
Balance at the end 332 332
Performance obligations and remaining performance obligations
The aggregate value of performance obligations that are completely or partially unsatisfied as of September 30, 2018, other than those meeting the exclusion criteria
mentioned above, is $6,815 million. Out of this, the Group expects to recognize revenue of around 50% within the next one year and the remaining thereafter. This
includes contracts that can be terminated for convenience without a substantive penalty since, based on current assessment, the occurrence of the same is expected to
be remote.
The impact on account of applying the erstwhile IAS 18 - Revenue instead of IFRS 15- Revenue from contract with customers on the financials results of the Group
for the three months and six months ended and as at September 30, 2018 is insignificant. On account of adoption of IFRS 15, unbilled revenues of $466 million as of
September 30, 2018 has been considered as Non financial asset.
(1) Financial Services include enterprises in Financial Services and Insurance
(2) Retail includes enterprises in Retail, Consumer Packaged Goods and Logistics
(4) Life Sciences includes enterprises in Life sciences and Health care
(3) Communication includes enterprises in Communication, Telecom OEM and Media
The following table discloses the movement in unbilled revenue on fixed price development contracts during the three months and six months ended September 30,
2018
For the six months ended
September 30, 2018
The following table discloses the movement in unearned revenue balances during the three months and six months ended September 30, 2018
The remaining performance obligation disclosure provides the aggregate amount of the transaction price yet to be recognized as of the end of the reporting period and
an explanation as to when the Group expects to recognize these amounts in revenue. Applying the practical expedient as given in IFRS 15, the Group has not
disclosed the remaining performance obligation related disclosures for contracts where the revenue recognized corresponds directly with the value to the customer of
the entity's performance completed to date, typically those contracts where invoicing is on time and material basis. Remaining performance obligation estimates are
subject to change and are affected by several factors, including terminations, changes in the scope of contracts, periodic revalidations, adjustment for revenue that has
not materialized and adjustments for currency.
For the six months ended
September 30, 2018
(5) Others include operating segments of businesses in India, Japan, China, Infosys Public Services & other enterprises in Public Services
Digital Services comprise of service and solution offerings of the Group that enable our clients to transform their businesses. These include offerings that enhance
customer experience, leverage AI-based analytics and big data, engineer digital products and IoT, modernize legacy technology systems, migrate to cloud applications
and implement advanced cyber security systems.
Core Services comprise traditional offerings of the Group that have scaled and industrialized over a number of years. These primarily include application management
services, proprietary application development services, independent validation solutions, product engineering and management, infrastructure management services,
traditional enterprise application implementation, support and integration services.
The Group also derives revenues from the sale of products and platforms including Finacle – core banking solution, Edge Suite of products, Infosys Nia - Artificial
Intelligence (AI) platform which applies next-generation AI and machine learning and Infosys McCamish- insurance platform
The Group classifies the right to consideration in exchange for deliverables as either a receivable or as unbilled revenue.
A receivable is a right to consideration that is unconditional upon passage of time. Revenue for time and material contracts are recognised as related service are
performed. Revenue for fixed price maintenance contracts is recognized on a straight line basis over the period of the contract. Revenues in excess of billings is
recorded as unbilled revenue and is classified as a financial asset for these cases as right to consideration is unconditional upon passage of time .
Revenue recognition for fixed price development contracts is based on percentage of completion method. Invoicing to the clients is based on milestones as defined in
the contract. This would result in the timing of revenue recognition being different from the timing of billing the customers. Unbilled revenue for fixed price
development contracts is classified as non financial asset as the contractual right to consideration is dependent on completion of contractual milestones.
Invoicing in excess of earnings are classified as unearned revenue.
Trade receivable and unbilled revenues are presented net of impairment in the consolidated statements of financial position.
Add : Translation gain/(Loss)
For the three months ended
September 30, 2018
For the three months ended
September 30, 2018
37
2.16 Break-up of expenses and other income, net
Accounting Policy
2.16.1 Gratuity
The Group provides for gratuity, a defined benefit retirement plan ('the Gratuity Plan') covering eligible employees of Infosys and its Indian subsidiaries. The Gratuity Plan
provides a lump-sum payment to vested employees at retirement, death, incapacitation or termination of employment, of an amount based on the respective employee's salary and
the tenure of employment with the group.
Liabilities with regard to the Gratuity Plan are determined by actuarial valuation, performed by an independent actuary, at each balance sheet date using the projected unit credit
method. The company fully contributes all ascertained liabilities to the Infosys Limited Employees' Gratuity Fund Trust (the Trust). In case of Infosys BPM (formerly Infosys
BPO) and EdgeVerve, contributions are made to the Infosys BPM Employees' Gratuity Fund Trust and EdgeVerve Systems Limited Employees' Gratuity Fund Trust,
respectively. Trustees administer contributions made to the Trusts and contributions are invested in a scheme with Life Insurance Corporation of India as permitted by law of
India.
The Group recognizes the net obligation of a defined benefit plan in its balance sheet as an asset or liability. Gains and losses through re-measurements of the net defined benefit
liability / asset are recognized in other comprehensive income and not reclassified to profit and loss in subsequent period. The actual return of the portfolio of plan assets, in
excess of the yields computed by applying the discount rate used to measure the defined benefit obligation is recognized in other comprehensive income. The effect of any plan
amendments are recognized in net profits in the statement of comprehensive income.
2.16.2 Superannuation
The Group has a policy on compensated absences which are both accumulating and non-accumulating in nature. The expected cost of accumulating compensated absences is
determined by actuarial valuation performed by an independent actuary at each balance sheet date using projected unit credit method on the additional amount expected to be
paid/availed as a result of the unused entitlement that has accumulated at the balance sheet date. Expense on non-accumulating compensated absences is recognized in the period
in which the absences occur.
Certain employees of Infosys, Infosys BPM (formerly Infosys BPO) and EdgeVerve are participants in a defined contribution plan. The Group has no further obligations to the
Plan beyond its monthly contributions which are periodically contributed to a trust fund, the corpus of which is invested with the Life Insurance Corporation of India.
2.16.3 Provident fund
Eligible employees of Infosys receive benefits from a provident fund, which is a defined benefit plan. Both the eligible employee and the company make monthly contributions to
the provident fund plan equal to a specified percentage of the covered employee's salary. The company contributes a portion of the contributions to the Infosys Limited
Employees' Provident Fund Trust. The trust invests in specific designated instruments as permitted by Indian law. The remaining portion is contributed to the government
administered pension fund. The rate at which the annual interest is payable to the beneficiaries by the trust is being administered by the government. The company has an
obligation to make good the shortfall, if any, between the return from the investments of the Trust and the notified interest rate.
In respect of Indian subsidiaries, eligible employees receive benefits from a provident fund, which is a defined contribution plan. Both the eligible employee and the respective
companies make monthly contributions to this provident fund plan equal to a specified percentage of the covered employee's salary. Amounts collected under the provident fund
plan are deposited in a government administered provident fund. The companies have no further obligation to the plan beyond its monthly contributions.
2.16.4 Compensated absences
38

Cost of sales
(Dollars in millions)
2018 2017 2018 2017
Employee benefit costs 1,415 1,333 2,800 2,626
Depreciation and amortization 66 71 130 141
Travelling costs 62 55 128 115
Cost of technical sub-contractors 216 169 407 334
Cost of software packages for own use 31 34 62 68
Third party items bought for service delivery to clients 53 42 102 76
Operating lease payments 13 13 24 25
Consultancy and professional charges 2 2 3 4
Communication costs 9 9 17 18
Repairs and maintenance 13 11 25 22
Provision for post-sales client support 4 4 4 5
Others - - 1 1
Total 1,884 1,743 3,703 3,435
Sales and marketing expenses
(Dollars in millions)
2018 2017 2018 2017
Employee benefit costs 111 102 222 205
Travelling costs 14 11 29 23
Branding and marketing 18 11 32 25
Operating lease payments 3 3 5 6
Consultancy and professional charges 6 3 10 5
Communication costs 1 1 2 2
Others 1 1 3 3
Total 154 132 303 269
Administrative expenses
(Dollars in millions)
2018 2017 2018 2017
Employee benefit costs 56 57 110 114
Consultancy and professional charges 33 37 73 71
Repairs and maintenance 32 30 62 65
Power and fuel 9 8 18 16
Communication costs 8 10 17 20
Travelling costs 9 9 18 18
Rates and taxes 9 12 14 19
Operating lease payments 5 6 10 11
Insurance charges 2 2 5 4
Impairment loss recognized/(reversed) under expected credit loss model 11 6 21 6
Commission to non-whole time directors - - - 1
Contributions towards Corporate Social Responsibility 8 9 19 16
Others 9 8 17 16
Total 191 194 384 377
Other income, net
(Dollars in millions)
2018 2017 2018 2017
Interest income on financial assets carried at amortized cost 47 63 103 129
23 31 47 62
Gain/(loss) on investments carried at fair value through profit or loss 8 13 12 24
Exchange gains / (losses) on forward and options contracts (58) (11) (85) (7)
Exchange gains / (losses) on translation of other assets and liabilities 81 21 115 28
Others 4 20 20 27
105 137 212 263
2.16.5 Other income
Other income is comprised primarily of interest income, dividend income, gain/loss on investment and exchange gain/loss on forward and options contracts and on translation of
other assets and liabilities. Interest income is recognized using the effective interest method. Dividend income is recognized when the right to receive payment is established.
Three months ended September 30,
Three months ended September 30,
Three months ended September 30,
Six months ended September 30,
Six months ended September 30,
Six months ended September 30,
2.16.6 Operating Profits
Operating profit of the Group is computed considering the revenues, net of cost of sales, selling and marketing expenses and administrative expenses.
During the three months ended June 30, 2018, the company has adopted IFRS interpretation IFRIC 22- Foreign Currency Transactions and Advance Consideration which
clarifies the date of transaction for the purpose of determining the exchange rate to use on initial recognition of the related asset, expense or income when an entity has received
or paid advance consideration in a foreign currency. The effect on account of adoption of this amendment was insignificant.
Three months ended September 30,
Interest income on financial assets fair valued through other comprehensive
income
Six months ended September 30, Particulars
39

2.17 Capital allocation policy
2.17.1 Dividend
Amount of per share dividend recognised as distribution to equity shareholders:
in ` in US Dollars in ` in US Dollars
Final dividend for fiscal 2018 10.25 0.16 - -
Special dividend for fiscal 2018 5.00 0.08 - -
Final dividend for fiscal 2017 - - 7.38 0.12
2.17.2 Buyback
2.18 Share capital and share premium
for and on behalf of the Board of Directors of Infosys Limited
Nandan M. Nilekani Salil Parekh U. B. Pravin Rao
Chairman Chief Executive officer Chief Operating Officer
and Managing Director and Whole-time Director
D. Sundaram M. D. Ranganath A. G. S. Manikantha
Director Chief Financial Officer Company Secretary
Bengaluru
October 16, 2018
The Company declares and pays dividends in Indian rupees. The remittance of dividends outside India is governed by Indian law on foreign exchange and is subject to applicable
distribution taxes. Dividend distribution tax paid by subsidiaries may be reduced / available as credit against dividend distribution tax payable by Infosys Limited.
The amount received in excess of the par value has been classified as share premium. Additionally, share-based compensation recognized in net profit in the consolidated
statement of comprehensive income is credited to share premium.
The Company has only one class of shares referred to as equity shares having a par value of `5/- each. 20,930,382 shares and 10,801,956 shares(not adjusted for September 2018
bonus issue) were held by controlled trust, as at September 30, 2018 and March 31, 2018, respectively.
Six Months ended September 30, 2018 Six Months ended September 30, 2017Particulars
The Board, at its meeting on August 19, 2017, approved a proposal for the Company to buyback its fully paid-up equity shares of face value of `5/- each from the eligible equity
shareholders of the Company for an amount not exceeding `13,000 crore ($2 billion). The shareholders approved the said proposal of Buyback of Equity Shares through the
postal ballot that concluded on October 7, 2017. The Buyback offer comprised a purchase of 113,043,478 Equity Shares aggregating 4.92% of the paid-up equity share capital of
the Company at a price of `1,150 per Equity share. The buyback was offered to all eligible equity shareholders (including those who became equity shareholders as on the
Record date by cancelling American Depository Shares and withdrawing underlying Equity shares) of the Company as on the Record Date (i.e. November 1, 2017) on a
proportionate basis through the "Tender offer" route. The Company concluded the buyback procedures on December 27, 2017 and 113,043,478 shares were extinguished. The
company utilized its securities premium and general reserve for the buyback of its shares. In accordance with section 69 of the Companies Act, 2013, the company created
‘Capital Redemption Reserve’ of $9 million equal to the nominal value of the shares bought back as an appropriation from general reserve during the year ended March 31, 2018.
The Board of Directors in their meeting on October 16, 2018 declared an interim dividend of ₹7/- per equity share (approximately $0.10 per equity share) which would result in a
net cash outflow of approximately $506 million, (excluding dividend paid on treasury shares) inclusive of corporate dividend tax.
Effective from Financial Year 2018, the Company's policy is to payout up to 70% of the free cash flow of the corresponding Financial Year in such manner (including by way of
dividend and / or share buyback) as may be decided by the Board from time to time, subject to applicable laws and requisite approvals, if any. Free cash flow is defined as net
cash provided by operating activities less capital expenditure as per the consolidated statement of cash flows prepared under IFRS. Dividend payout includes dividend
distribution tax.
The Company has allotted 2,18,41,91,490 fully paid up equity shares (including treasury shares) of face value ₹5/- each during the three months ended September 30, 2018
pursuant to a bonus issue approved by the shareholders through postal ballot. Record date fixed by the Board of Directors was September 5, 2018. The bonus shares were issued
by capitalization of profits transferred from general reserve. Bonus share of one equity share for every equity share held, and a bonus issue, viz., a stock dividend of one
American Depositary Share (ADS) for every ADS held, respectively, has been allotted. Consequently, the ratio of equity shares underlying the ADSs held by an American
Depositary Receipt holder remains unchanged. Options granted under the stock option plan have been adjusted for bonus shares.
The final dividend on shares is recorded as a liability on the date of approval by the shareholders and interim dividends are recorded as a liability on the date of declaration by the
Company's Board of Directors.
The Company’s objective when managing capital is to safeguard its ability to continue as a going concern and to maintain an optimal capital structure so as to maximize
shareholder value. In order to maintain or achieve an optimal capital structure, the Company may adjust the amount of dividend payment, return capital to shareholders, issue new
shares or buy back issued shares. As of September 30, 2018, the Company has only one class of equity shares and has no debt. Consequent to the above capital structure there
are no externally imposed capital requirements
2.17.3 Bonus issue
Note: Dividend per equity share disclosed in the above table represents dividends declared previously, retrospectively adjusted for September 2018 bonus issue.
40
Top Related