


Languages
Pages
Legal

American Journal of Applied Scientific Research 2016; 2(6): 65-74
http://www.sciencepublishinggroup.com/j/ajasr
doi: 10.11648/j.ajasr.20160206.16
ISSN: 2471-9722 (Print); ISSN: 2471-9730 (Online)
Influence of Spatial Variation in Subgrade Properties on the Design of Highway Flexible Pavements
Nwakaire Chidozie Madu1, *
, Chukwu Chinagorom Joshua1, Udemba Jonathan Nwachukwu
2
1Department of Civil Engineering, Nnamdi Azikiwe University, Awka, Nigeria 2National Inland Waterways Authority, Warri, Nigeria
Email address: [email protected] (N. C. Madu) *Corresponding author
To cite this article: Nwakaire Chidozie Madu, Chukwu Chinagorom Joshua, Udemba Jonathan Nwachukwu. Influence of Spatial Variation in Subgrade
Properties on the Design of Highway Flexible Pavements. American Journal of Applied Scientific Research. Vol. 2, No. 6, 2016, pp. 65-74.
doi: 10.11648/j.ajasr.20160206.16
Received: October 1, 2016; Accepted: November 18, 2016; Published: December 21, 2016
Abstract: Influence of spatial variation in subgrade properties on the integrity of highway pavement design is the burden of
this research. Interruption, delay and discomfort in transportation flow that characterize roads across the globe due to poor
pavement conditions are pathetic experiences. This work is an attempt to investigate the influence of subgrade variation on the
design thicknesses of highway flexible pavements, using subgrade properties and traffic characteristics encountered along the
Enugu-Onitsha expressway. Soil samples collected from selected sections of the expressway were subjected to geotechnical
laboratory tests like particles size distribution, Atterberg’s limits, compaction and California bearing ratio in order to analyse
their properties. The results generated from these three samples from different stations across the road showed that the soil
materials along the Enugu-Onitsha expressway vary significantly. Sample from Nkpor, Awkuzu and Kwata stations contain
15%, 45% and 80% fines (silt and clay) respectively, likewise their MDD and OMC are 1852KN/m3, 1980KN/m
3 and
1788KN/m3; 11.7%, 11%, and 14.6% respectively. The 48 hour soaked CBR values of soil samples from Nkpor and Awkuzu
stations are 8% and 9% respectively while Kwata station is 2.3%. The plasticity index and liquid limit results were also 11%;
31% and 9%; 27.4% for Awkuzu and Kwata samples while Nkpor sample in a non-plastic soil. Based on ASSHTO
classification, the soils fall within A-2-4, A-6 and A-4 categories which depicted a significant variation in properties, fair to
bad. Based on the design outputs for pavement thicknesses, it was concluded that designing a length of highway with a single
CBR value will be uneconomical for areas with significantly higher surface modulus as well as providing insufficient
thicknesses for areas with lower actual CBR than the observed. Sectional pavement design at not more than 1km intervals was
recommended.
Keywords: Pavement, Design, Subgrade, Variation, CBR, Asphalt
1. Introduction
Over the years, significant efforts have been made in
Nigeria towards the development of highway infrastructures,
but despite the efforts the undue failure of road pavements at
quite an alarming rate remains characteristic of most
Nigerian roads. Different stakeholders have been worried
about the causes and possible remedies to this menace.
Besides, it has been observed that not all the sections of the
road pavements fail at the same time. Some sections of the
road pavements still stand and some have outlasted their
design life. From the Civil Engineer’s perspective, this
scenario could be as a result of one or combination of some
of these; carelessness workmanship, poor supervision and
quality control, inadequate drainage provisions, ignorance of
regular maintenance programs, insufficient initial soil
exploration, among others. Whichever be the case, the
influence of bad roads on traffic flow, travelers comfort, and
environmental condition of an area cannot be over
emphasized. The Enugu-Onitsha Expressway within South-
66 Nwakaire Chidozie Madu et al.: Influence of Spatial Variation in Subgrade Properties on the
Design of Highway Flexible Pavements
East Nigeria was chosen as a case study for this study. This
major road that connects important locations between
Anambra and Enugu States have recorded tremendous loss of
lives and properties, human injuries, environmental pollution,
traffic congestion, as well as armed robbery attacks. All these
could be linked, directly or indirectly, to the deteriorated
state of the highway.
Roads are very significant infrastructures that remain
critical to the well-being, growth and expansion of any
geographical location. Due to the high investment cost
involved in their provision, they are expected to be durable
and resilient, and to perform satisfactorily throughout their
service lives [1]. A Flexible pavement is a structure that
typically consists of layers of different materials that increase
with strength towards the surface (weakest layer on the
bottom, strongest layer at the surface) [2]. A flexible
pavement relies on this layered system to distribute traffic
loads over the sub-grade. The load carrying capacity of a
flexible pavement is brought about by the load distributing
characteristics of each layer in the layered system. The layers
of a flexible pavement structure typically consist of hot mix
asphalt (HMA) at the surface (wearing course), a binder
course (HMA), base course (well-graded gravel), and sub-
base course gravel, all placed on the sub-grade (natural soil
along the highway right-of-way). The integrity of highway
pavements can be affected by various factors, ranging from
environmental, structural, traffic, construction and
maintenance. But the scope of this research would be
restricted as much as possible to the structural factors
basically the subgrade (geotechnical) contributions.
A highway pavement is a structure consisting of
superimposed layers of selected and processed materials
above the natural soil or subgrade, whose primary function is
to distribute the vehicle applied load to the subgrade [3]. The
pavement structure should be able to provide a surface of
acceptable riding quality, adequate skid resistance,
favourable light characteristics, and low noise pollution. The
aim is to ensure that the transmitted stresses due to wheel
load are sufficiently reduced, so that they will not exceed the
bearing capacity of the subgrade. Two types of pavements
are majorly recognized, which are flexible and rigid
pavements [4]. The flexible pavement is the main focus of
this work. Flexible pavements are the most widely used
transportation infrastructures all around the world. The
choice of flexible pavements depends on different factors
such as the design period, initial cost, traffic, ground
conditions (i.e. subgrade layer of the pavement), and
environmental factors. Long-term considerations, for
example lifetime cost and maintenance budget, are also
important factors to be taken into account. The main concept
behind design of conventional flexible pavement is to
provide layered systems with stiffer materials on the top
where the intensity of stress is high and less stiff materials at
the bottom where the stress intensity is less. A typical
flexible pavement section is composed of asphalt concrete
layer, bounded and /or unbounded base layer, sub-base and
subgrade layers.
A pavement section can be generally defined as the
structural materials placed above a subgrade layer [5]. The
structural layers of highway pavements are; the subgrade
(support), sub-base, base and surfacing. The characteristic
of the soil bed over which the entire pavement system rests
represents the subgrade soil. The subgrade provides a
foundation for supporting the pavement structure. As a
result, the required pavement thickness and the performance
obtained from the pavement during its design life would
depend largely upon the strength and uniformity of the
subgrade. Hence, a thorough investigation of the subgrade
should be made so that the design and construction will
ensure uniformity of support for the pavement structure and
realization of the maximum strength potential from the
particular sub-grade soils. Hence, the subgrade soil
properties is a key factor that affects pavement structure
design. As noted by [6], all pavements derive their ultimate
support from the underlying subgrade soils making.
Virtually every Civil Engineering structure is built on the
ground of which the carriageway pavement is not an
exception. However, highway pavements are constructed on
the processed subgrade (natural soil) of each section along
the roadway. The subgrade can be defined generally as a
layer which serves as a foundation in a highway pavement
construction. It is a surface of the earth rock levelled off to
receive Civil Engineering structures. But the variation of
subgrade properties plays undeniable roles in the integrity
of highway pavement, so to be able to build a stable and
durable pavement, the existing soil strength have to be
determined over space as these properties vary over space
and over time. Since the subgrade properties along the
highway differ, it is important to collect a natural soil
sample at many locations along the proposed highway for
laboratory tests. The subgrade elastic modulus is paramount
to highway pavement design; for granular soils, California
Bearing Ratio (CBR) is an indicator which serves as a
common way of determining the elastic modulus of
subgrade and for cohesive soils (clay) plasticity index is
always used.
The objective of pavement design is to provide a structural
and economical combination of materials to carry traffic
loadings in a given period over the existing soil conditions
for a specified time interval of design life. It also functions to
receive and transmit traffic loads through the pavement
layers to the sub-grade [7]. Highway pavement, just like
other Civil Engineering structures, is expected to be durable
and resilient; so for it to perform satisfactorily through the
design life, characterizing subgrade material is crucial in
pavement design, construction, as well as rehabilitation
activities.
Pavement integrity is the ability of the pavement
structures to uphold adequate serviceability, safety, and
good riding quality at least within the design life. Subgrade
is the foundation of the pavement infrastructure as it is the
layer of pavement that receive loads from the overlaying
structures and disseminate it to the earth. So where the
foundation of any structure especially in Civil Engineering
American Journal of Applied Scientific Research 2016; 2(6): 65-74 67
construction is defective, automatically it will affect the
look and also the performance of such structure. Some
defects that are often observed on the road pavement
infrastructure include; rutting, many forms of cracking,
potholes, depression, upheaval and so on. These are signs of
pavement failure. Reference [8] established some major
factors responsible for road failures which include: poor
road construction, poor road design, excessive traffic axle
load, high water table, wrong choice of construction
materials, and collapse of drainage substructures. The
transport road research laboratory [9] also argued that
climatic factors can also affect the strength of the road
structure. Temperature fluctuation and acidic rain attack the
base material of the road in waterlogged area, and this
likewise aid to weaken the sub base of the road. Also the
capillary action of water reduces the supporting power of
the road pavement. Some other scholars are of opinion that
poor maintenance is the main cause of failure to many road
pavements [10, 11]. The poor geotechnical characteristics
of many in-situ soils cannot be overlooked since [12] made
it clear that the subgrade soil is an integral part of a road
pavement structure, as it provides support to the pavement
from beneath; and therefore should possess sufficient
strength and stability under adverse climatic and loading
condition, so as to avoid failure. This is very important to
note as it explained why a road with identical climatic,
environmental, traffic loading, maintenance and other stated
factors fail at different rates and different severity at various
locations along the road. The subgrade properties could
vary significantly even at close ranges.
Previous studies have concluded that the condition of the
subgrade soil is key to pavement structural performance [13,
14, 15]. It is, therefore, obvious that poor condition of roads
such as that of Enugu – Onitsha roadway could be as a result
of poor subgrade properties. Variation in subgrade
geotechnical properties is a problem not only in recent era; it
has always been an issue of main concern as most design
methodologies consider it as a key design factor. The
inspection of Enugu-Onitsha Expressway shows that many
sections of the road pavement have severely failed without
reaching the design life, but the fact remains that not all parts
of the pavement failed at the same period, despite been plied
by the same public service vehicle and other heavy goods
vehicles.
Coarse grained soils serve as good subgrades for
supporting pavements whereas fine grained soils, particularly
clay soils pose problems to Engineering structures like
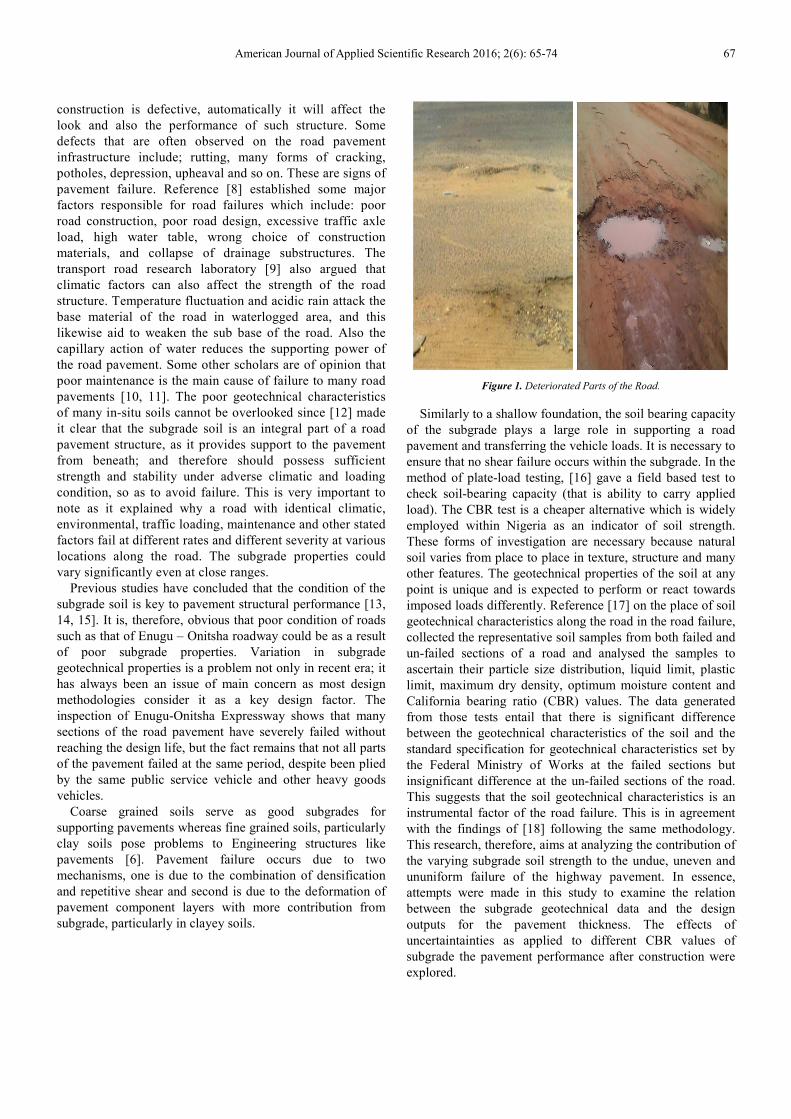
pavements [6]. Pavement failure occurs due to two
mechanisms, one is due to the combination of densification
and repetitive shear and second is due to the deformation of
pavement component layers with more contribution from
subgrade, particularly in clayey soils.
Figure 1. Deteriorated Parts of the Road.
Similarly to a shallow foundation, the soil bearing capacity
of the subgrade plays a large role in supporting a road
pavement and transferring the vehicle loads. It is necessary to
ensure that no shear failure occurs within the subgrade. In the
method of plate-load testing, [16] gave a field based test to
check soil-bearing capacity (that is ability to carry applied
load). The CBR test is a cheaper alternative which is widely
employed within Nigeria as an indicator of soil strength.
These forms of investigation are necessary because natural
soil varies from place to place in texture, structure and many
other features. The geotechnical properties of the soil at any
point is unique and is expected to perform or react towards
imposed loads differently. Reference [17] on the place of soil
geotechnical characteristics along the road in the road failure,
collected the representative soil samples from both failed and
un-failed sections of a road and analysed the samples to
ascertain their particle size distribution, liquid limit, plastic
limit, maximum dry density, optimum moisture content and
California bearing ratio (CBR) values. The data generated
from those tests entail that there is significant difference
between the geotechnical characteristics of the soil and the
standard specification for geotechnical characteristics set by
the Federal Ministry of Works at the failed sections but
insignificant difference at the un-failed sections of the road.
This suggests that the soil geotechnical characteristics is an
instrumental factor of the road failure. This is in agreement
with the findings of [18] following the same methodology.
This research, therefore, aims at analyzing the contribution of
the varying subgrade soil strength to the undue, uneven and
ununiform failure of the highway pavement. In essence,
attempts were made in this study to examine the relation
between the subgrade geotechnical data and the design
outputs for the pavement thickness. The effects of
uncertaintainties as applied to different CBR values of
subgrade the pavement performance after construction were
explored.
68 Nwakaire Chidozie Madu et al.: Influence of Spatial Variation in Subgrade Properties on the
Design of Highway Flexible Pavements
2. Research Methodology
2.1. Location of Study
This research work was carried out on the Enugu – Onitsha
expressway (a trunk “A” highway), to investigate the effect
of the variation in natural soil properties along the roadway.
Enugu – Onitsha dual carriageway was first constructed in
the late 1970s in Nigeria which is made up of the two
carriageway of 7300mm width each.
2.2. Sample Collection
The soil samples were collected in trial pits of 600mm to
1200mm depth located very close to the road in question.
These representative soil were collected from Nkpor junction
(very close to the overhead bridge), Awkuzu junction (about
100mm away from the junction along the expressway), and
Kwata junction. The soil samples were used in all the
laboratory tests.
2.3. Material Testing
All tests conducted were in conformity with AASHTO
sampling and testing procedures and also as specified by [19]
for Roads and Bridges. Specific gravity, sieve analysis,
Atterberg limits, compaction, and CBR tests were performed
on the samples. Specific gravity is the ratio of the mass of
unit volume of soil at a stated temperature to the mass of the
same volume of gas-free distilled water at the same
temperature. In order to ascertain the percentage of various
sizes of soil contained in a particular soil sample, the soil was
subjected to sieve analysis. The mechanical or sieve analysis
is performed to determine the distribution of the coarser,
larger-sized particles, and the hydrometer method is used to
determine the distribution of the finer particles. The liquid
limit (LL) of a given soil specimen is arbitrarily defined as
the water content, in percent, at which a part of soil in a
standard Cassagrande cup and cut by a groove of standard
dimensions will flow together at the base of the groove for a
distance of 13 mm when subjected to 25 numbers of blows or
impact from the cup being dropped 10 mm in a standard limit
apparatus operated at a rate of two drops or impact per
second. The liquid limit is the moisture content that defines
where the soil changes from a plastic to a viscous fluid state.
On the other hand, the plastic limit (PL) is the water content,
in percent, at which a soil can no longer be deformed by
rolling into 3.18mm diameter threads without crumbling. The
plastic limit is the moisture content that defines where the
soil changes from a semi-solid to a plastic (flexible) state.
These Atterberg limits are also used to classify a fine-grained
soil according to the Unified Soil Classification system or
AASHTO system. Compaction is a mechanical means for the
densification of soil. Several methods are used to compact
soil in the field, and some examples include tamping,
kneading, vibration, and static load compaction, but in the
laboratory the tamping or impact compaction methods are
employed [20]. The British standard light (BSL) compaction
was adopted for this research and the optimum moisture
contents established therefrom were used for the CBR tests.
Table 1 is the summary of the BSL compactive effort
parameters.
Table 1. The Compaction Parameters.
Compaction BS Light
Number of layers 3
Number of blows 27
Rammer weight (Kg) 2.5
Mould volume (cm3) 1000
Height of fall (m) 0.45
The CBR is a small scale penetration test defined as the
ratio of the force per unit area required to penetrate a soil
mass with a circular plunger of 50mm diameter at the rate of
1.25mm/min to that required for a corresponding penetration
of a standard material. This laboratory test covers the
determination of the California bearing ratio of a soil which
is obtained by measuring the relation between load and
penetration when a cylindrical plunger is made to penetrate
the soil at a given rate. At any value of penetration the
California Bearing Ratio (C.B.R) values are normally quoted
for 2.50mm and 5.00mm penetration.
2.4. Traffic Survey
A four hour road count was made at the same locations
where the soil samples were collected (Nkpor, Awkuzu,
kwata). The traffic count was done by direct observation and
manual counting, the collected data were recorded and
analysed using recording sheets. The commercial vehicles
counted were classified thus; Buses and Coaches, 2-axle rigid,
3-axle rigid, 4-axle rigid, 3-axle articulated, 4-axle articulated,
5-axle articulated, and 6-axle articulated.
2.5. Traffic Assessment and Structural Design
The traffic assessment and structural design was done
using the Design Manual for Highways and Bridges [21]
methodology. The design Traffic was determined and the
thicknesses of the pavement layers were selected accordingly.
Equations 1 and 2 below are the models for computing the
design traffic. Whereas the parameters like the percentage of
commercial vehicles in heaviest traffic lane (P), growth
factor (G), and Wear factor (W) were gotten from relevant
charts, the traffic flow (F) was gotten from the survey data
and design life (Y) was taken as 20 years which is typical for
flexible pavements.
Weighted Annual Traffic = 365 × � × � ×� × 10�msa (1)
Design Traffic (T) =365 × � × × � ×� × � × 10�msa (2)
3. Results and Discussion
3.1. Particle Size Distribution
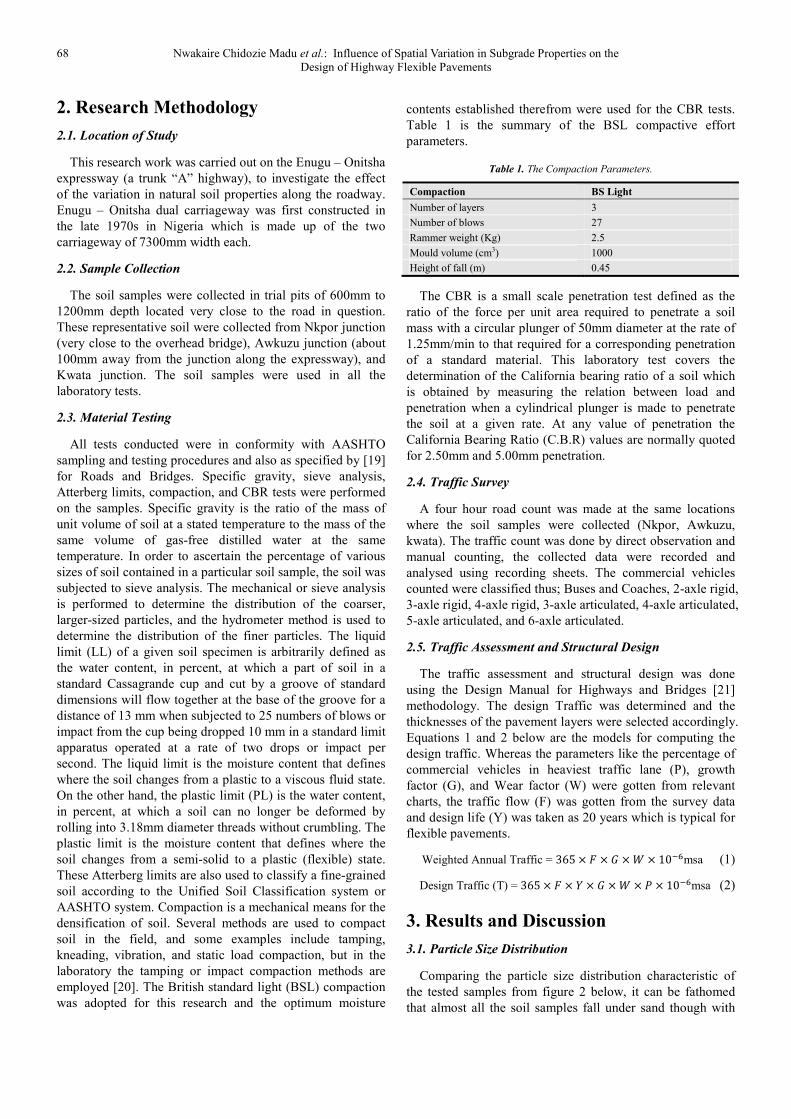
Comparing the particle size distribution characteristic of
the tested samples from figure 2 below, it can be fathomed
that almost all the soil samples fall under sand though with
American Journal of Applied Scientific Research 2016; 2(6): 65-74 69
some unique characteristics. The soil samples from Nkpor
area according to the graph contains about 85% sand and
fines of about 15%, this indicates that the soils in that area
are mostly sands. Kwata junction region is almost direct
reverse of Nkpor soil sample because it contains about 80%
fines and 20% sand, which entails that the soil is of high clay
content. Close to 45% and 55% fines and sands respectively
were identified to be contained by the soil sample from
Awkuzu junction area, showing that the soil contains close
amounts of fines and sand.
Figure 2. Particle Size Distribution Curves for the Three Soil Samples.
From the skewedness of the curves, the soil sample from
Awkuzu, Nkpor, and Kwata are well graded, poorly graded,
and well-graded respectively. From the above particle size
analysis result, the three soil samples contain quite a high
amount of sand that makes them non-plastic. The D10 has no
value for both soil samples. The coefficients of uniformity and
curvature (Cu and Cc) were not ascertained hence were not
used for the soil classification. In this case, therefore, the
American Association of State Highway and Transport
Official (AASHTO) soil classification method was used to
classify the samples. The Nkpor soil sample was classified as
an A-2 (A-2-4) indicating that the sample is non-plastic silty or
clayey sand which could be rated as good to fair subgrade/fill
materials. From the curve D30, D60 can be gotten as 0.16 and
0.28 respectively. The sample collected at Awkuzu, with 45%
fines was classified as an A-6 (2) soil which indicates a
moderately plastic soil that could perform fairly or even badly
as a subgrade material. The Kwata sample contains much
higher fines. Therefore the 80% of fine in Kwata soil sample in
comparison with not greater than or equal 35% stated in code
shows that it is bad subgrade material for road constructions.
Looking at curve of this sample, the coefficient of uniformity
(Cu) or curvature (Cc) cannot be calculated just like for the
other two samples, but in this case even D30 and D60 could not
be estimated. So the sample were classified with AASHTO
soil classification method as the A-4 (5), showing that it is
clayey and silty fines mainly with little sand.
The particle/grain size distribution of a soil is an important
determinant of its geotechnical characteristics. In Civil
Engineering construction, clay materials are seen as
troublesome, though porous but is less permeable and to
determine the percentage of clay present in the natural soil
(subgrade) in order to know whether it will serve as a good
subgrade, particle size distribution determination is inevitable.
And the analyses for these three samples already points to
subgrade weakness as a major contributor to pavement
failure along the Enugu-Onitsha express road. The summary
of these results and some other Index properties of the soil
samples are presented in the table 2 below.
Table 2. Summary of the Laboratory Tests Results and estimated Index Properties.
Sample locations
NKPOR AWKUZU KWATA
Depth (mm) 750 1200 650
Sieve Analysis Fines (passing 75�m) 15 45 80
Sand (%) 85 55 20
Atterberg Limits
Liquid Limit (%) - 31 27.4
Plastic Limit (%) - 20 18.35
Plasticity Index - 11 9
Specific Gravity 2.62 2.6 2.58
Compaction OMC (%) 11.7 11 14.6
MDD (Kg/m3) 1852 1980 1788
AASHTO Classification A-2-4 A-6 A-4
Group Index (GI)
0 2 5
Usual type of material Silty or Clayey sand Clayey Soil Silty Soil
Subgrade rating Good Fair to Bad Fair to Bad
70 Nwakaire Chidozie Madu et al.: Influence of Spatial Variation in Subgrade Properties on the
Design of Highway Flexible Pavements
3.2. Consistency Limits
These limits measure the moisture content at which soils
change from one state to the other as water is added or
withdrawn from that particular soil sample. It has been found
useful in evaluation of subgrade and subbase materials. The
results for the three soil samples are presented in table 2.
From the results, it could be said that the soil sample
collected at Awkuzu, is plastic in nature with liquid limit of
31%. Since this value do not exceed the standard specified by
FMW for roads and bridges (that is LL �
80%andPI �55%), it could be used for subgrade and fill
material. The soil sample been classified with AASHTO soil
classification method indicates that it is in class of A-6 (2)
which accredited as fair to poor subgrade material and the
usual material is mostly silty soils. There the value of liquid
Limit for the Kwata soil sample is 27.4%. This shows that
the soil is plastic in nature with liquid limit (LL) value less
than the specification in the standard code of practice
maximum specifications (LL � 80%� for subgrade materials,
it therefore suggests that Kwata soil could be used as
subgrade materials since it met the required specification.
The result computation shows that the plasticity index ranges
from 9% to 11% which is an indication that the both sample
are of medium plasticity and these values do not exceed the
standard specification of � 55%. Since the samples met the
specification, it then suggest that soil sample could be used
as subgrade materials. But these are will remain subject to
the CBR values which is a more acceptable performance
indicator.
3.3. Specific Gravity
The specific gravity values gotten from the tests are within
the range of 2.58 to 2.62 showing that it is silt or clay fine-
sand with appreciable amount of silt or clay. The values of
the specific gravity of the three samples have been indicated
in table 2. They are above the specified minimum for
subgrade materials thereby implying that they could be
adequate.
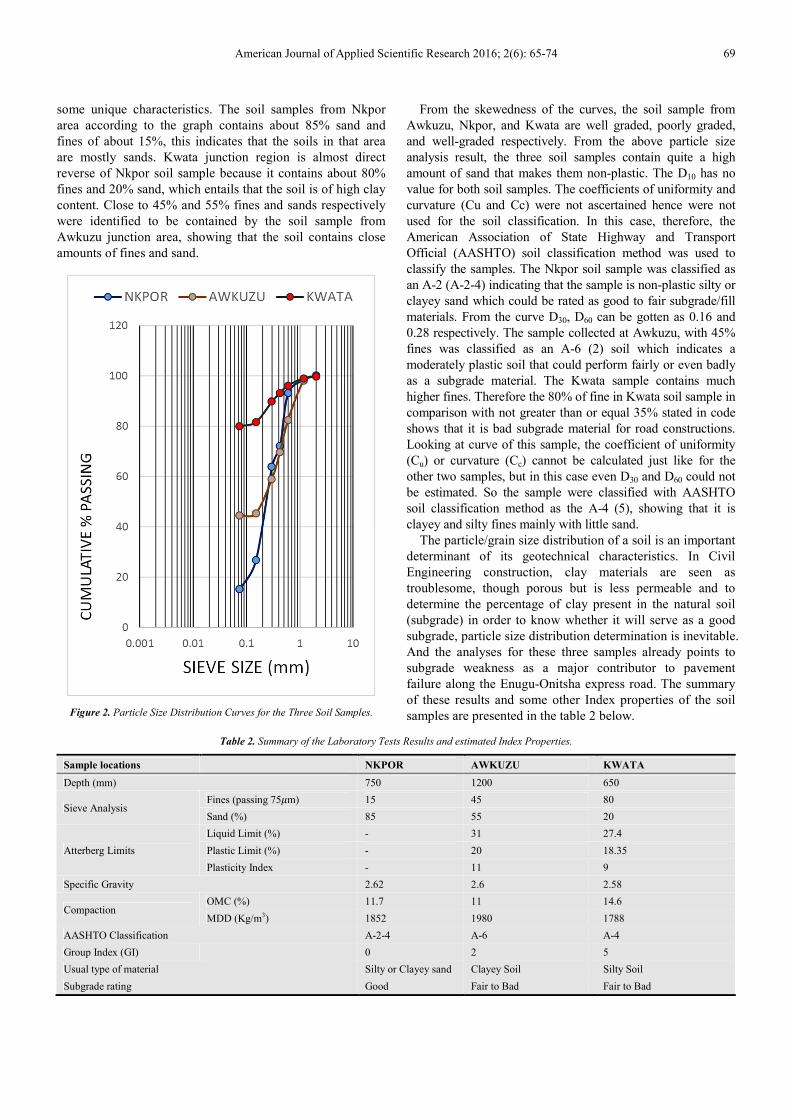
3.4. Compaction
It was ascertained that the maximum dry density (MDD)
and optimum moisture content (OMC) varied between
1788Kg/m3 and 1980Kg/m
3, 11% and 14.6% respectively for
the three samples. The MDD values are within the range for
good subgrade soils. Figure 3 is the compaction curves for
the three samples tested.
Figure 3. The Compaction Curves for the Three Soil Samples.
As expected, it can be observed from the figure 5 that the
higher the Maximum Dry Density (MDD), the lower the
Optimum Moisture Content (OMC). Awkuzu soil sample has
the highest MDD but lowest OMC, while the sample
collected from Kwata which has the highest OMC among the
tested samples achieved the lowest MDD at the same
compactive effort. Besides, the optimum moisture content
range of 3.6% is quite significant to note.
The variation in the compaction characteristics of the
subgrade soils along the length of the expressway is quite
significant, indicating that using a particular OMC for the
construction at the subgrade level would not achieve a the
best compaction for all the sections of the road. The
minimum value of MDD for subgrade materials is 1760kg/m3
according to the Federal Ministry of Works and Housing
(FMWH) specification. And can be seen from table 2 and
figure 5, the three soil samples met this requirement but
varies from each other.
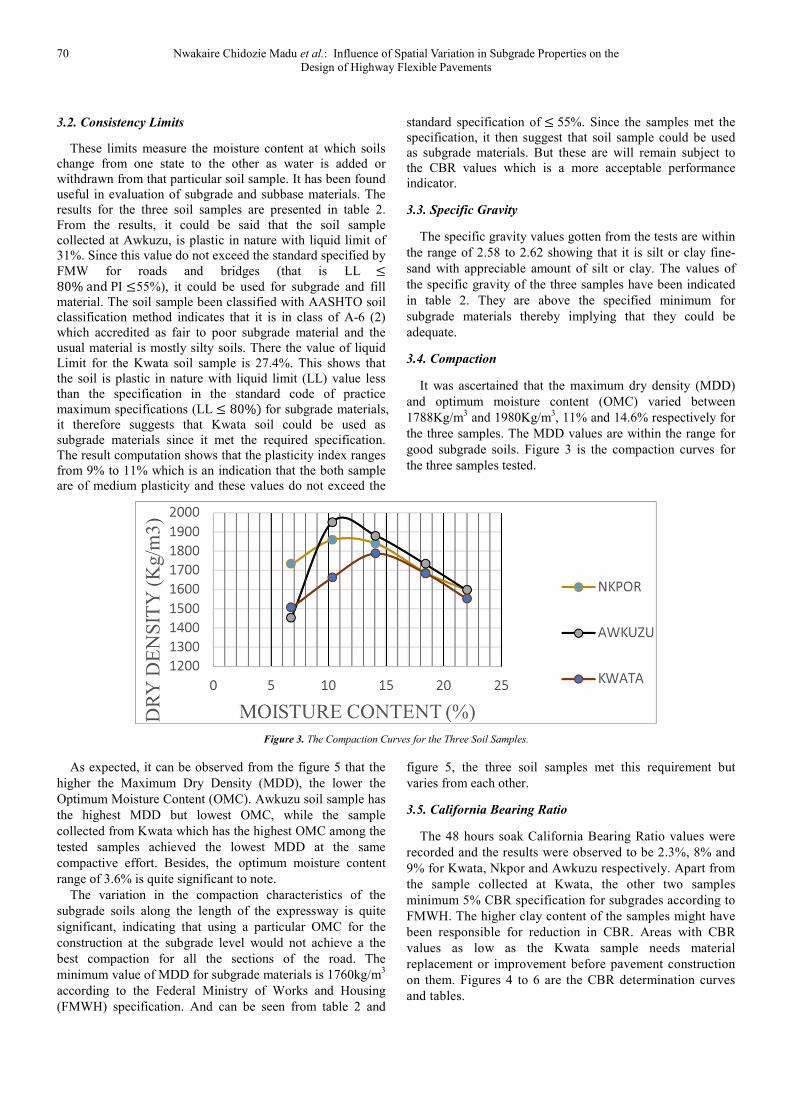
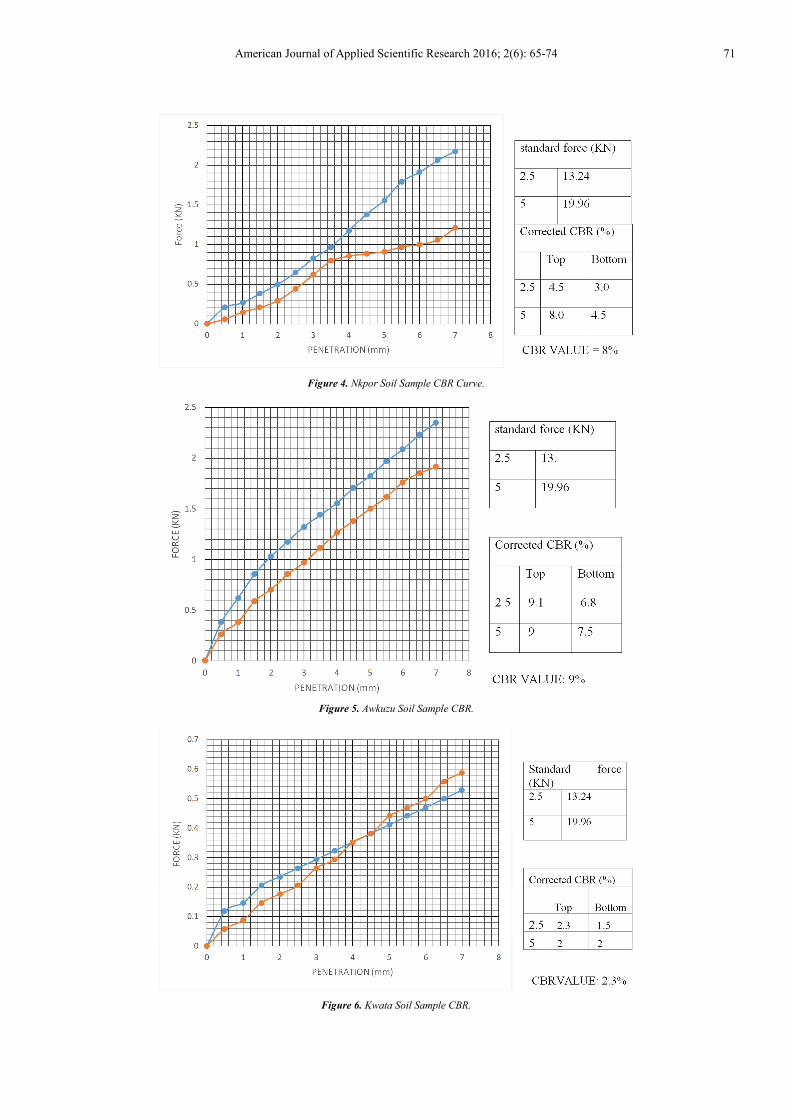
3.5. California Bearing Ratio
The 48 hours soak California Bearing Ratio values were
recorded and the results were observed to be 2.3%, 8% and
9% for Kwata, Nkpor and Awkuzu respectively. Apart from
the sample collected at Kwata, the other two samples
minimum 5% CBR specification for subgrades according to
FMWH. The higher clay content of the samples might have
been responsible for reduction in CBR. Areas with CBR
values as low as the Kwata sample needs material
replacement or improvement before pavement construction
on them. Figures 4 to 6 are the CBR determination curves
and tables.
American Journal of Applied Scientific Research 2016; 2(6): 65-74 71
Figure 4. Nkpor Soil Sample CBR Curve.
Figure 5. Awkuzu Soil Sample CBR.
Figure 6. Kwata Soil Sample CBR.
72 Nwakaire Chidozie Madu et al.: Influence of Spatial Variation in Subgrade Properties on the
Design of Highway Flexible Pavements
3.6. Traffic Assessment
Table 3 below is the summary of the traffic assessment carried out at the three different locations using the HD 24/06 traffic
assessment method.
Table 3. Summary of Traffic Data Analysis.
Location NKPOR AWKUZU KWATA
Total weighted annual traffic (x 10-6) 6.034 3.76 3.422
Total Daily flow (cv/d) 6763 3909 3729
Percentage of vehicle in heaviest traffic lane (P) 77% 85% 83%
Design Period (Y) 20 20 20
Design Traffic (T) 92.92 msa 63.92 msa 56.81 msa
From this summary table, the variation in traffic
characteristics at the three locations can be deciphered.
Whereas the Awkuzu and Kwata locations could be said to
have identical traffic characteristics, the Nkpor Area seems to
have much higher traffic volume of commercial vehicles and
consequently, a very high design traffic. This suggests that
variation in design traffic can also affect the reliability of
pavement design. Besides, the major aim of this traffic
assessment exercise is to generate the design traffic necessary
for the pavement thickness selection.
3.7. The Thicknesses of Pavement Layers
Modern pavement design is concerned with developing the
most economical combination of pavement layers that will
ensure traffic and other climatic loads are transmitted evenly
on the subgrade and still sustain its performance adequately
at least within the design life. The HD26/06 design code
designs pavement with different foundation classes
considering the subgrade surface modulus which in turn is a
function of subgrade CBR. Figures 7 to 9 illustrates the
design outputs for the pavement thicknesses based on
foundation classes 3 and 4 as well as different construction
materials. The CBR values gotten from the Nkpor and
Awkuzu locations were employed for the pavement designs.
As expected, lower CBR values requires higher pavement
thicknesses. The difference in the output is more pronounced
at the base layer which is the major structural layer of a
flexible pavement.
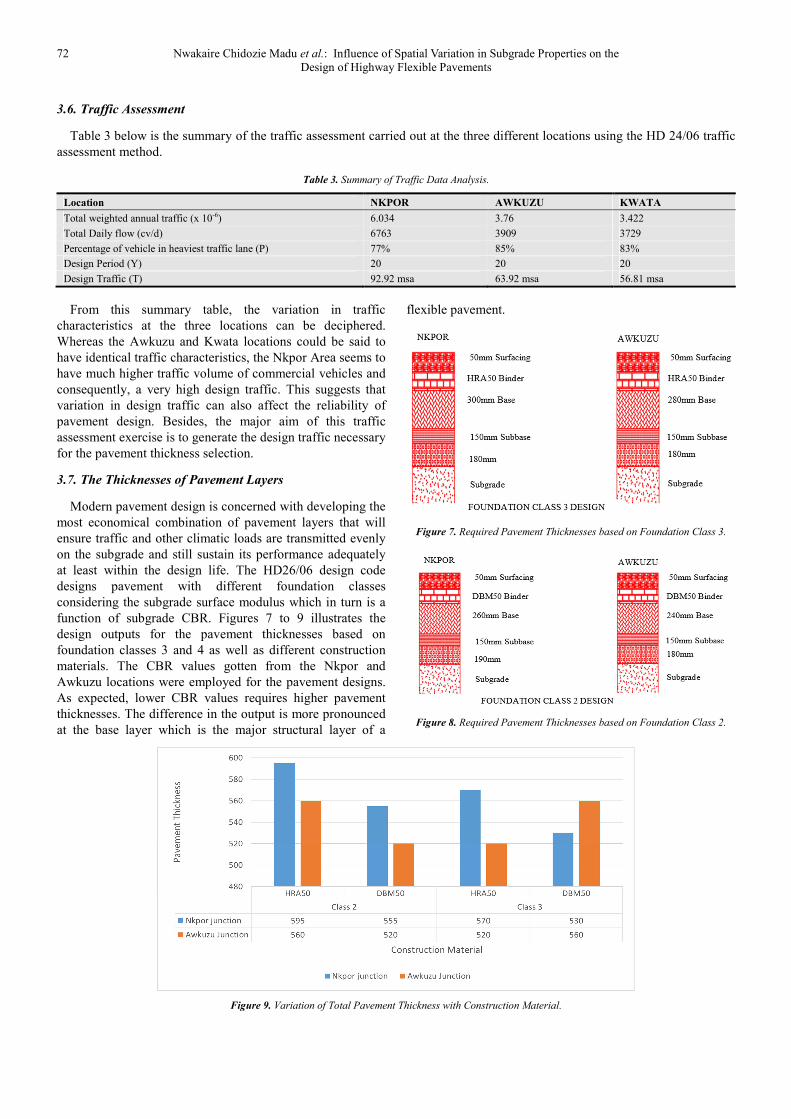
Figure 7. Required Pavement Thicknesses based on Foundation Class 3.
Figure 8. Required Pavement Thicknesses based on Foundation Class 2.
Figure 9. Variation of Total Pavement Thickness with Construction Material.
American Journal of Applied Scientific Research 2016; 2(6): 65-74 73
Figure 9 shows variations in total pavement thicknesses
when different materials are used for the road construction. It
shows that HRA50 would give same performance as DBM50
only at a higher thickness. When constructing pavements
with either hot rolled asphalt (HRA) or dense bitumen
macadam (DBM), one will expect lesser pavement thickness
with foundation class 3 design than class 2.
The practice by most local construction companies has
been to design a length of highway with the observed worst
CBR value. In other words, the road pavements are designed
with the least CBR value gotten along the road in question. In
the stations examined along Enugu-Onitsha expressway, the
least CBR value is 2.3%. It could be possible for contractors
to have taken samples at locations with higher CBR values,
and designing with such values is wrong as the actual worst
condition has not been considered. It is therefore necessary to
dissuade such practice of designing a long length of road
with the observed worst CBR. This will be uneconomical for
areas with significantly higher surface modulus as well as
providing insufficient thicknesses for areas with lower actual
CBR than the observed.
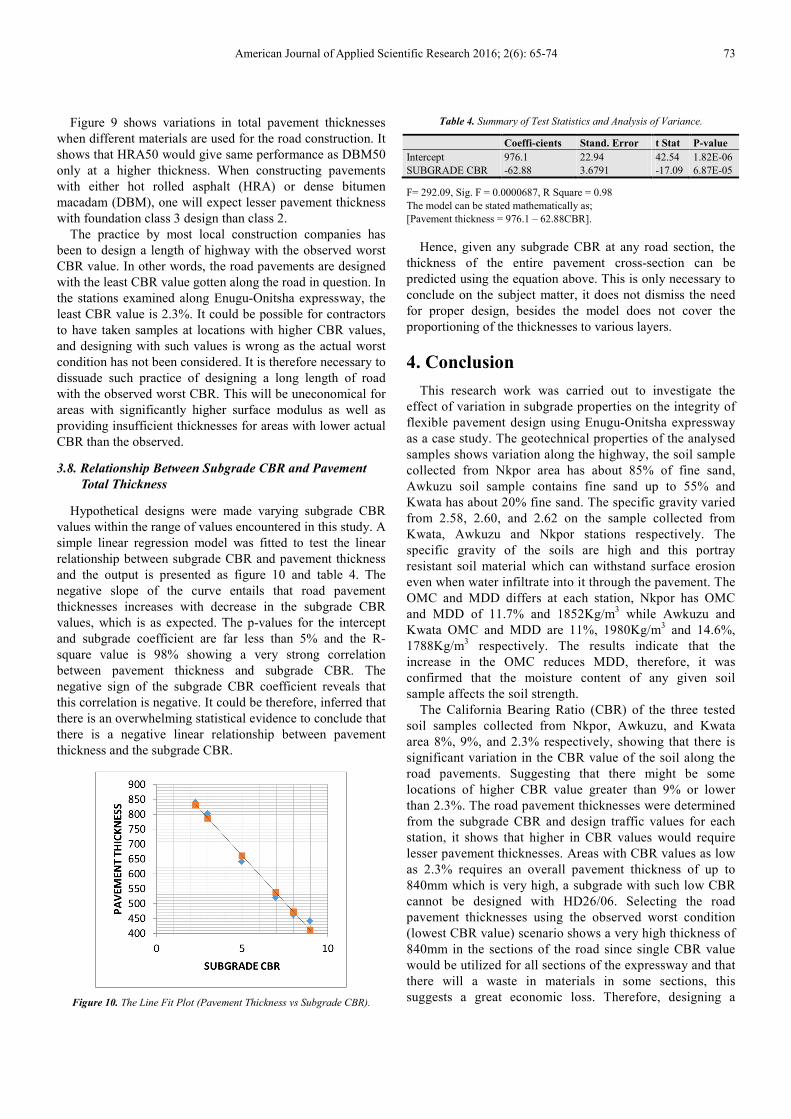
3.8. Relationship Between Subgrade CBR and Pavement
Total Thickness
Hypothetical designs were made varying subgrade CBR
values within the range of values encountered in this study. A
simple linear regression model was fitted to test the linear
relationship between subgrade CBR and pavement thickness
and the output is presented as figure 10 and table 4. The
negative slope of the curve entails that road pavement
thicknesses increases with decrease in the subgrade CBR
values, which is as expected. The p-values for the intercept
and subgrade coefficient are far less than 5% and the R-
square value is 98% showing a very strong correlation
between pavement thickness and subgrade CBR. The
negative sign of the subgrade CBR coefficient reveals that
this correlation is negative. It could be therefore, inferred that
there is an overwhelming statistical evidence to conclude that
there is a negative linear relationship between pavement
thickness and the subgrade CBR.
Figure 10. The Line Fit Plot (Pavement Thickness vs Subgrade CBR).
Table 4. Summary of Test Statistics and Analysis of Variance.
Coeffi-cients Stand. Error t Stat P-value
Intercept 976.1 22.94 42.54 1.82E-06
SUBGRADE CBR -62.88 3.6791 -17.09 6.87E-05
F= 292.09, Sig. F = 0.0000687, R Square = 0.98
The model can be stated mathematically as;
[Pavement thickness = 976.1 – 62.88CBR].
Hence, given any subgrade CBR at any road section, the
thickness of the entire pavement cross-section can be
predicted using the equation above. This is only necessary to
conclude on the subject matter, it does not dismiss the need
for proper design, besides the model does not cover the
proportioning of the thicknesses to various layers.
4. Conclusion
This research work was carried out to investigate the
effect of variation in subgrade properties on the integrity of
flexible pavement design using Enugu-Onitsha expressway
as a case study. The geotechnical properties of the analysed
samples shows variation along the highway, the soil sample
collected from Nkpor area has about 85% of fine sand,
Awkuzu soil sample contains fine sand up to 55% and
Kwata has about 20% fine sand. The specific gravity varied
from 2.58, 2.60, and 2.62 on the sample collected from
Kwata, Awkuzu and Nkpor stations respectively. The
specific gravity of the soils are high and this portray
resistant soil material which can withstand surface erosion
even when water infiltrate into it through the pavement. The
OMC and MDD differs at each station, Nkpor has OMC
and MDD of 11.7% and 1852Kg/m3 while Awkuzu and
Kwata OMC and MDD are 11%, 1980Kg/m3 and 14.6%,
1788Kg/m3 respectively. The results indicate that the
increase in the OMC reduces MDD, therefore, it was
confirmed that the moisture content of any given soil
sample affects the soil strength.
The California Bearing Ratio (CBR) of the three tested
soil samples collected from Nkpor, Awkuzu, and Kwata
area 8%, 9%, and 2.3% respectively, showing that there is
significant variation in the CBR value of the soil along the
road pavements. Suggesting that there might be some
locations of higher CBR value greater than 9% or lower
than 2.3%. The road pavement thicknesses were determined
from the subgrade CBR and design traffic values for each
station, it shows that higher in CBR values would require
lesser pavement thicknesses. Areas with CBR values as low
as 2.3% requires an overall pavement thickness of up to
840mm which is very high, a subgrade with such low CBR
cannot be designed with HD26/06. Selecting the road
pavement thicknesses using the observed worst condition
(lowest CBR value) scenario shows a very high thickness of
840mm in the sections of the road since single CBR value
would be utilized for all sections of the expressway and that
there will a waste in materials in some sections, this
suggests a great economic loss. Therefore, designing a
74 Nwakaire Chidozie Madu et al.: Influence of Spatial Variation in Subgrade Properties on the
Design of Highway Flexible Pavements
length of highway with a single CBR value will be
uneconomical for areas with significantly higher surface
modulus as well as providing insufficient thicknesses for
areas with lower actual CBR than the observed. Sectional
pavement design at not more than 1km intervals is
recommended.
References
[1] L. Qiang, M. Leslie, and M. Sue. “The Implication of Climate Change on Pavement Performance and Design”. A Report Submitted to the University of Delaware Transportation Centre (UD-UTC) 2011.
[2] Florida Department of Transport. “Flexible Pavement Design Manual” 2008. [Online] Assesed from http://www.dot.fl.us/pavementmanagement.com/ Assessed on 3rd March 2016.
[3] C. A. O’Flaherty. “Highways: The Location, Design, Construction, and Maintenance of Pavements”. Butterworths and Heinemann, Oxford United Kingdom (2012).
[4] M. Rogers. “Highway Engineering”. Second Edition, Blackwell Publishing, Oxford, UK (2012).
[5] J. W. Adrox and W. R. Woods. “A General Characterization of Pavement System Failures with Emphasis on a Method for Selecting Repair Process”. Journal of Construction Education, 7 (1), (2002) pp 58-62.
[6] E. J. Yoder and M. W. Witzack. “Principle of Pavement” (2nd ed.), John Wiley & Sons, New York (1975).
[7] L. R. Kadiyali. “Highway Engineering” 3rd edition. CBS Publishers and Distributors Pvt Ltd. New Delhi, India (1989).
[8] S. W. Abynayaka. “Prediction of Road Construction Failure in Developing Countries”. Proceedings. Institute of Civil Engineering Vol. 62 (3) Part I, ICE Virtual Library (1997), Pp 419-446.
[9] Transport Road Research Laboratory (TRRL). “Maintenance Techniques for District Engineers”, Vol. 2, (1991) TRRL. Crow Thorne England.
[10] T. Igomu. “Year Major Highways Collapsed into Death
Traps”. Daily sun newspaper Thursday 29th December 2011, page 34.
[11] H. N. Paul, and J. P. Radnor. “Highway Engineering”, John Willey and Sons, New York (1976).
[12] B. L. Gupta, and A. Gupta. “Highway and Bridge Engineering”, Standard Publishers Distributors, Delhi, India (2008).
[13] O. A. Adeleke, and A. O. Madebor. “Effect of Hydrated Lime on the Atterberg Limits of Black Cotton Soil of Nigeria”. 9th Regional Conference for Africa on Soil Mechanics and Foundation Engineering, 1, (1987). pp 155-160.
[14] O. M. Ogundipe. “Road pavement failure caused by poor soil properties along Aramoko-Ileha Highway Nigeria”. Medwell journal of Engineering and Applied Science. Vol. 3 (3), (2006) pp 239–241.
[15] G. Jegede. “Highway Pavement Failure Induced by Poor Geotechnical Properties along a Section of F209 Okitipupa-Igbokoda Highway”. Nigeria Ife Journal Science, 6 (1), (2004). pp 41-44.
[16] B. M. Das. “Principles of Geotechnical Engineering”, 6th edition, Thomson, Brooks/Cole 97, (2006).
[17] D. C. Onuoha, and S. U. Onwuka. “The Place of Soil Geotechnical Characteristics in Road Failure, a Study of the Onitsha-Enugu Expressway, Southeastern Nigeria”. Civil and Environmental Research. Vol. 6 (1), (2014) pp 55-66.
[18] G. O. Adeyemi, M. O. Oloruntola, and A. O. Adeleye. “Geotechnical Properties of Subgrade Soil along Sections of the Ibadan-Ife Expressway, South-Western Nigeria”; Journal for Natural Science Research. Vol. 4 (23) (2014) pp 55–67.
[19] Federal Ministry of Works and Housing (FMWH). “General Specification for Roads and Bridges” Revised Edition Vol. 2. : Federal Ministry of Works, Abuja (1997).
[20] C. M. Nwakaire, C. M. O. Nwaiwu, and C. H. Aginam. “Equivalent Blows Approach to the Calibration of a Minicompactor for Laboratory Use”. IISTE Journal of Civil and Environmental Research. Vol 7, Issue 8. (2015) pp 63-74.
[21] Traffic Assessment, HD/06, “Design Manual for Roads and Bridges”, Vol. 7, Section 2. London: The Department of Transport, February 1996.
Top Related