


Languages
Pages
Legal

1
Abstract
The motivation for this research work comes
from the HELENA project and the later
initiative of 4 central European countries
devoted to the creation of modern European
Regional Aircraft. The paper presents a
configuration of a significantly lower noise,
emission, top-class operational economy, highly
increased safety level, extra ordinary cabin
comfort and reduced boarding time. Aircraft is
powered by one external engine, selected for
cruise conditions and supplemented by another
internally located engine, used mainly for take-
off and emergency. Both engines are located in
the rear part of aircraft, in its plane of
symmetry which is beneficial when one of the
engines is non-operational. Every engine can
maintain a steady level flight and safe landing if
the other unit fails. The reason for big
improvement of flight economy, numerically
proved in this paper, did not come from
aerodynamic drag reduction, but mainly from
much better performance of the selected
cruising engines. Larger turbofans are usually
more fuel efficient because of more advanced
technologies used and the characteristics of the
phenomena occurring inside the engines.
Specific fuel consumption for turbofans used in
research variants of the airplane is respectively
19.65 % and 31.12 % lower than for CF-34-8E,
which is very similar to final profits. The most
likely percent of fuel consumption reduction that
can be achieved is between these two values
received from performed calculations.
1 Introduction
This paper was triggered out by an initiative
proposed by Prof. J. Szodruch of DLR in the
HELENA project [1] in 2008. Among the main
goals of this initiative was the transfer of
research excellence into a world class product.
In order to achieve this goal, a number of
actions were planned including (1) keeping
Aeronautics and Air Transport Research on
political agenda for maintaining Europe’s
competitive position; (2) concentrating the
ACARE activity on pre-competitive research;
(3) providing the European Commission with
attractive political, technical, economical pilot-
project in Aeronautics/Air Transport; (4)
bridging the gap between excellent research and
ecological/economical world class product; (5)
integrating (mainly) new member states and
countries with lower aeronautical profile,
decreasing their dependency on the value chain
of established OEM’s (Original Equipment
Manufacturer) and (6) strengthening the
position in the regional aircraft market in
Europe (vs. Japan, Brazil, Canada, Russia,
China and India). The project proposal was then
advanced by an international team of designers
and researcher from DLR (Germany), ILOT
(Poland), VZLU (Czech Republic) and INCAS
(Romania). Under the umbrella of this initiative,
the Polish group of designers representing ILOT
and PW have developed a conceptual design of
turbo-fan aircraft endowed with 2 engines (1
main, external for cruise and landing) and one
internal (auxiliary, for take-off and emergency if
necessary).
The subject of this paper is the estimation
of potential benefits associated with the use of
innovative configuration of regional class
passenger aircraft, equipped with one cruising
INFLUENCE OF POWER UNIT CONFIGURATION LAYOUT OF A REGIONAL JET ON PERFORMANCE
AND DIRECT OPERATING COST
Z. Goraj *, A. Sieradzki *
*Institute of Aviation
Keywords: regional jet, configuration, safety, direct operating cost, CFD
Z. GORAJ, A. SIERADZKI
2
engine and one auxiliary. The auxiliary engine,
located inside the fuselage and used only in the
emergency situations and in flight near the
ground, remains off during high altitude flight
in order to reduce fuel consumption. In addition,
the research configuration is equipped with a V-
type tail. The study focused on assessing the
benefits only from power unit layout change and
adding V-type tail configuration. Other
innovations specific to the HELENA [1] project,
further progressed by PW-ILOT team (forward
swept wing, Canard wing, etc.) [2,3] were
neglected in this paper in order to focus on
potential benefits expected from the
replacement of 2 engine configuration into
configuration with 1 main engine for cruise and
landing, and one auxiliary engine for take-off
and emergency only (shut-down during cruise).
The geometry of Embraer E-175 LR airplane
was chosen as initial geometry for further
modifications. Comparison of the fuel
consumption, range and flight endurance
between classical configuration and the single
external engine configurations presented in this
paper is based on the numerical simulation
performed by A. Sieradzki [4]. These results
might be further used for the assessment of the
European requirements related to the
strengthening of Air Transport System, both the
smaller one provided by SAT [5] and by its
greater segment provided by commuters.
2 Regional jet market tendencies
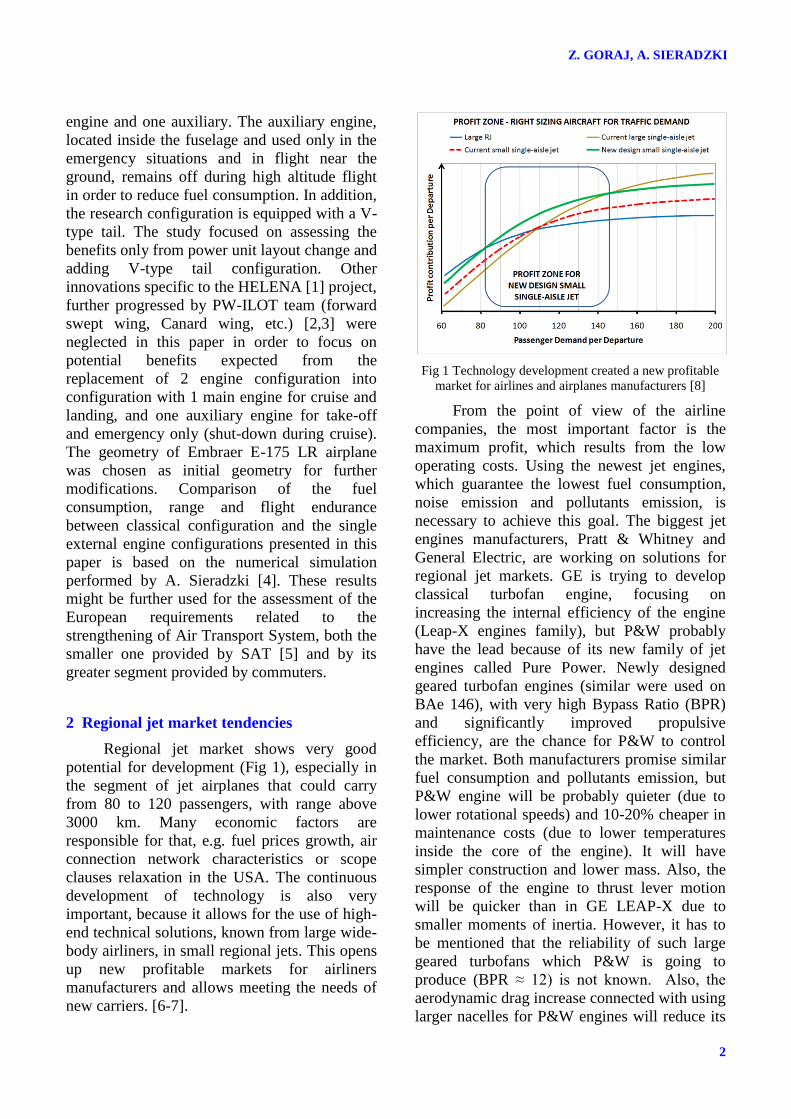
Regional jet market shows very good
potential for development (Fig 1), especially in
the segment of jet airplanes that could carry
from 80 to 120 passengers, with range above
3000 km. Many economic factors are
responsible for that, e.g. fuel prices growth, air
connection network characteristics or scope
clauses relaxation in the USA. The continuous
development of technology is also very
important, because it allows for the use of high-
end technical solutions, known from large wide-
body airliners, in small regional jets. This opens
up new profitable markets for airliners
manufacturers and allows meeting the needs of
new carriers. [6-7].
Fig 1 Technology development created a new profitable
market for airlines and airplanes manufacturers [8]
From the point of view of the airline
companies, the most important factor is the
maximum profit, which results from the low
operating costs. Using the newest jet engines,
which guarantee the lowest fuel consumption,
noise emission and pollutants emission, is
necessary to achieve this goal. The biggest jet
engines manufacturers, Pratt & Whitney and
General Electric, are working on solutions for
regional jet markets. GE is trying to develop
classical turbofan engine, focusing on
increasing the internal efficiency of the engine
(Leap-X engines family), but P&W probably
have the lead because of its new family of jet
engines called Pure Power. Newly designed
geared turbofan engines (similar were used on
BAe 146), with very high Bypass Ratio (BPR)
and significantly improved propulsive
efficiency, are the chance for P&W to control
the market. Both manufacturers promise similar
fuel consumption and pollutants emission, but
P&W engine will be probably quieter (due to
lower rotational speeds) and 10-20% cheaper in
maintenance costs (due to lower temperatures
inside the core of the engine). It will have
simpler construction and lower mass. Also, the
response of the engine to thrust lever motion
will be quicker than in GE LEAP-X due to
smaller moments of inertia. However, it has to
be mentioned that the reliability of such large
geared turbofans which P&W is going to
produce (BPR ≈ 12) is not known. Also, the
aerodynamic drag increase connected with using
larger nacelles for P&W engines will reduce its
3
INFLUENCE OF POWER UNIT CONFIGURATION LAYOUT OF
A REGIONAL JET ON PERFORMANCE AND DIRECT OPERATING COST
advantage. Taking this all into consideration, it
is hard to clearly state that P&W took better
strategy to develop its jet engines [9-10].
3 Flight conditions
In this phase of the work, the computational
flight conditions were determined on the basis
of the Embraer E-175 LR specification and the
International Standard Atmosphere (ISA)
model. They are similar to cruise conditions for
current airliners. The altitude of 10 000 m and
flight speed of 0.7 Ma was assumed. Actually,
the airliners achieve higher airspeeds during
cruise, but due to the intensification of wave
phenomena, the decision was made to perform
the calculations for slightly lower Mach
number. Moreover, the assumed flight speed
represents, to a certain extent, also the other
(slower) phases of flight, such as climbing or
descend, which in case of short regional flights
take relatively high amount of time.
The average mass of the Embraer E-175
LR during cruise was calculated with use of
relationships described in [11] and the
assumption of 6% fuel reserve during landing,
and equals mav = 33721 kg. The average lift
coefficient was received from the below
equation:
5,09,72*7,209*413,0
81,9*33721*2222
SV
gmC av
L
(1)
where: mav - average mass of aircraft; g -
acceleration due to gravity; ρ - air density; V -
airspeed; S - wing reference area.
4 Initial configuration
The main part of the work began with the
creation of initial configuration geometry based
on the very popular Embraer E-175 LR. Its
geometry was reconstructed from the available
pictures and sketches. The wing and tail airfoils
were chosen from NASA and NACA airfoils
family respectively, on the basis of NASA
guidelines [12] and experimental data [13]. For
the wing section, the supercritical NASA SC(2)-
0714 was chosen. It was designed to minimize
the wave drag associated with local supersonic
flow above top surface of the airfoil. The
thickness of NASA SC(2)-0714 is 14% (similar
value measured in E-175 LR sketches) and
design lift coefficient is 0.7. For V-tail section
NACA0012 airfoil was used, due to the fact that
the thickness of the horizontal/vertical
stabilizers measured in the E-175 LR sketches
varied from 11 to 12%. The same airfoil
(NACA0012) was also used in the winglets
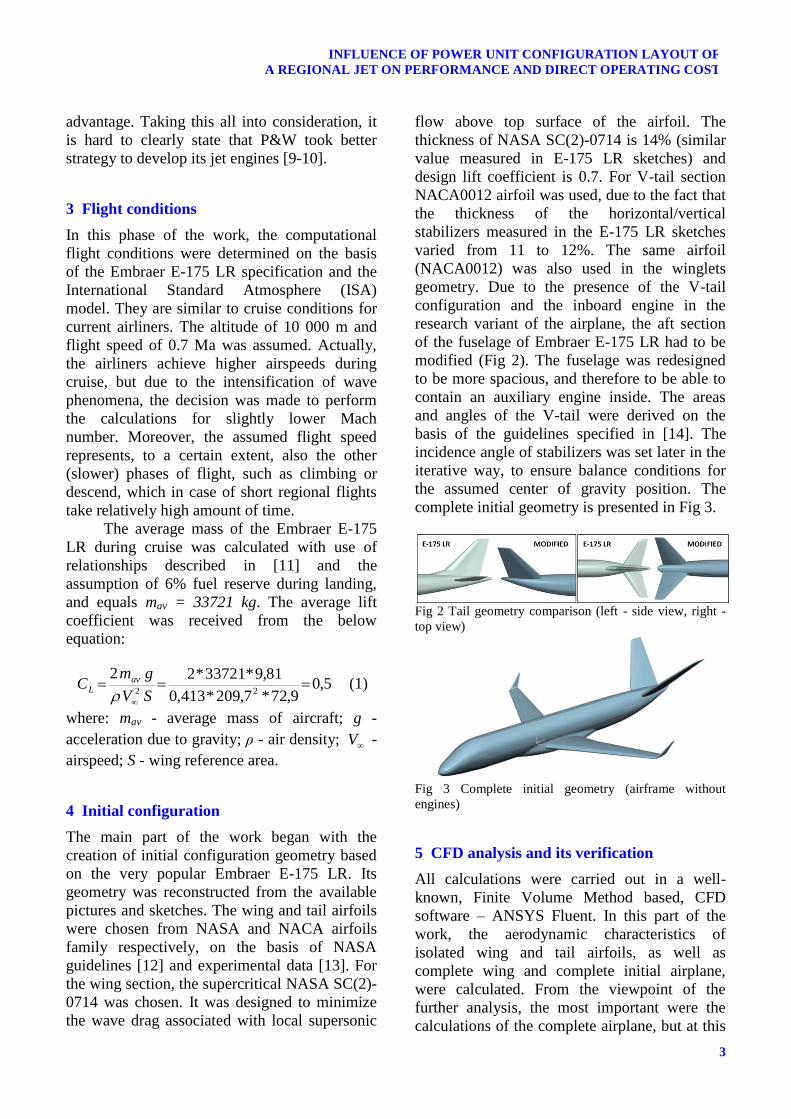
geometry. Due to the presence of the V-tail
configuration and the inboard engine in the
research variant of the airplane, the aft section
of the fuselage of Embraer E-175 LR had to be
modified (Fig 2). The fuselage was redesigned
to be more spacious, and therefore to be able to
contain an auxiliary engine inside. The areas
and angles of the V-tail were derived on the
basis of the guidelines specified in [14]. The
incidence angle of stabilizers was set later in the
iterative way, to ensure balance conditions for
the assumed center of gravity position. The
complete initial geometry is presented in Fig 3.
Fig 2 Tail geometry comparison (left - side view, right -
top view)
Fig 3 Complete initial geometry (airframe without
engines)
5 CFD analysis and its verification
All calculations were carried out in a well-
known, Finite Volume Method based, CFD
software – ANSYS Fluent. In this part of the
work, the aerodynamic characteristics of
isolated wing and tail airfoils, as well as
complete wing and complete initial airplane,
were calculated. From the viewpoint of the
further analysis, the most important were the
calculations of the complete airplane, but at this
Z. GORAJ, A. SIERADZKI
4
stage, some simpler configurations were also
examined. This allowed verifying the CFD
results accuracy, on the basis of experimental
data of applied wing airfoil [13], and the
analytically derived complete wing
characteristics (based on half-empirical
relationships described in [15]).
All cases were analyzed with the same
solver settings. Double Precision, Density Based
Solver with ideal gas model and Spalart-
Allmaras turbulence model were used. The
energy equation was also taken into account in
calculations.
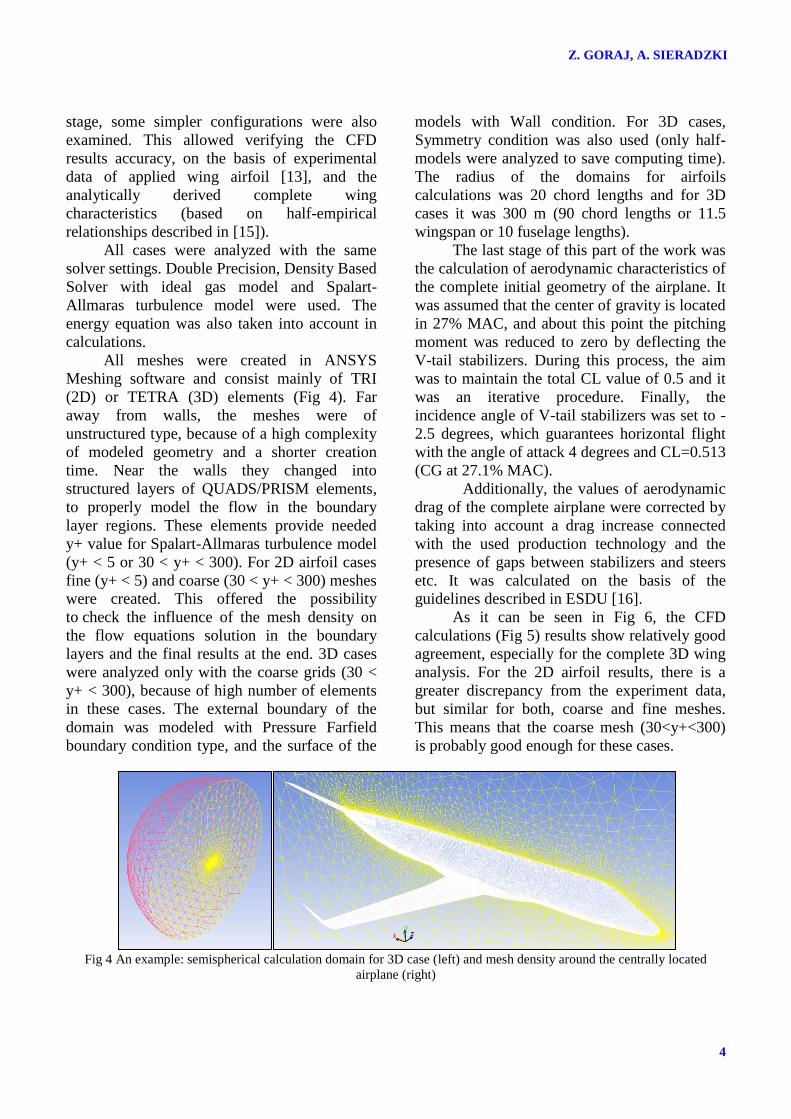
All meshes were created in ANSYS
Meshing software and consist mainly of TRI
(2D) or TETRA (3D) elements (Fig 4). Far
away from walls, the meshes were of
unstructured type, because of a high complexity
of modeled geometry and a shorter creation
time. Near the walls they changed into
structured layers of QUADS/PRISM elements,
to properly model the flow in the boundary
layer regions. These elements provide needed
y+ value for Spalart-Allmaras turbulence model
(y+ < 5 or 30 < y+ < 300). For 2D airfoil cases
fine (y+ < 5) and coarse (30 < y+ < 300) meshes
were created. This offered the possibility
to check the influence of the mesh density on
the flow equations solution in the boundary
layers and the final results at the end. 3D cases
were analyzed only with the coarse grids (30 <
y+ < 300), because of high number of elements
in these cases. The external boundary of the
domain was modeled with Pressure Farfield
boundary condition type, and the surface of the
models with Wall condition. For 3D cases,
Symmetry condition was also used (only half-
models were analyzed to save computing time).
The radius of the domains for airfoils
calculations was 20 chord lengths and for 3D
cases it was 300 m (90 chord lengths or 11.5
wingspan or 10 fuselage lengths).
The last stage of this part of the work was
the calculation of aerodynamic characteristics of
the complete initial geometry of the airplane. It
was assumed that the center of gravity is located
in 27% MAC, and about this point the pitching
moment was reduced to zero by deflecting the
V-tail stabilizers. During this process, the aim
was to maintain the total CL value of 0.5 and it
was an iterative procedure. Finally, the
incidence angle of V-tail stabilizers was set to -
2.5 degrees, which guarantees horizontal flight
with the angle of attack 4 degrees and CL=0.513
(CG at 27.1% MAC).
Additionally, the values of aerodynamic
drag of the complete airplane were corrected by
taking into account a drag increase connected
with the used production technology and the
presence of gaps between stabilizers and steers
etc. It was calculated on the basis of the
guidelines described in ESDU [16].
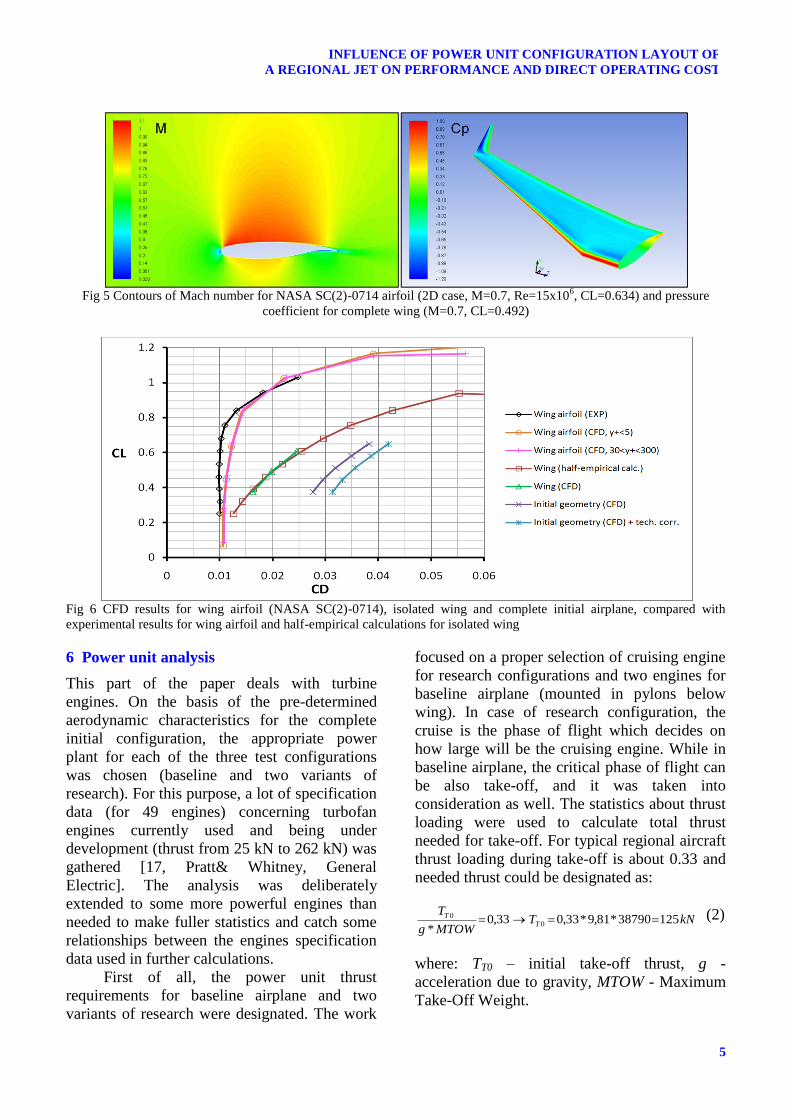
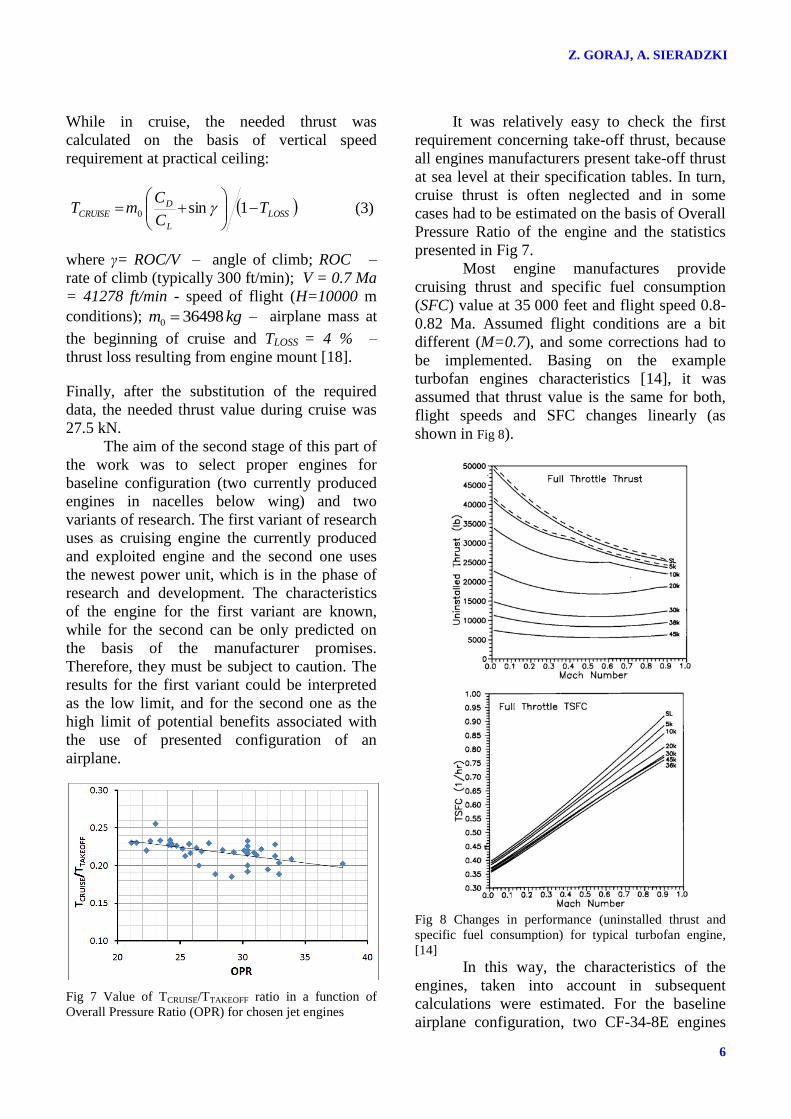
As it can be seen in Fig 6, the CFD
calculations (Fig 5) results show relatively good
agreement, especially for the complete 3D wing
analysis. For the 2D airfoil results, there is a
greater discrepancy from the experiment data,
but similar for both, coarse and fine meshes.
This means that the coarse mesh (30<y+<300)
is probably good enough for these cases.
Fig 4 An example: semispherical calculation domain for 3D case (left) and mesh density around the centrally located
airplane (right)
5
INFLUENCE OF POWER UNIT CONFIGURATION LAYOUT OF
A REGIONAL JET ON PERFORMANCE AND DIRECT OPERATING COST
Fig 5 Contours of Mach number for NASA SC(2)-0714 airfoil (2D case, M=0.7, Re=15x10
6, CL=0.634) and pressure
coefficient for complete wing (M=0.7, CL=0.492)
Fig 6 CFD results for wing airfoil (NASA SC(2)-0714), isolated wing and complete initial airplane, compared with
experimental results for wing airfoil and half-empirical calculations for isolated wing
6 Power unit analysis
This part of the paper deals with turbine
engines. On the basis of the pre-determined
aerodynamic characteristics for the complete
initial configuration, the appropriate power
plant for each of the three test configurations
was chosen (baseline and two variants of
research). For this purpose, a lot of specification
data (for 49 engines) concerning turbofan
engines currently used and being under
development (thrust from 25 kN to 262 kN) was
gathered [17, Pratt& Whitney, General
Electric]. The analysis was deliberately
extended to some more powerful engines than
needed to make fuller statistics and catch some
relationships between the engines specification
data used in further calculations.
First of all, the power unit thrust
requirements for baseline airplane and two
variants of research were designated. The work
focused on a proper selection of cruising engine
for research configurations and two engines for
baseline airplane (mounted in pylons below
wing). In case of research configuration, the
cruise is the phase of flight which decides on
how large will be the cruising engine. While in
baseline airplane, the critical phase of flight can
be also take-off, and it was taken into
consideration as well. The statistics about thrust
loading were used to calculate total thrust
needed for take-off. For typical regional aircraft
thrust loading during take-off is about 0.33 and
needed thrust could be designated as:
kNTMTOWg
TT
T 12538790*81,9*33,033,0*
0
0 (2)
where: TT0 – initial take-off thrust, g -
acceleration due to gravity, MTOW - Maximum
Take-Off Weight.
Z. GORAJ, A. SIERADZKI
6
While in cruise, the needed thrust was
calculated on the basis of vertical speed
requirement at practical ceiling:
LOSS
L
DCRUISE T
C
CmT
1sin0 (3)
where γ= ROC/V – angle of climb; ROC –
rate of climb (typically 300 ft/min); V = 0.7 Ma
= 41278 ft/min - speed of flight (H=10000 m
conditions); kgm 364980 – airplane mass at
the beginning of cruise and TLOSS = 4 % –
thrust loss resulting from engine mount [18].
Finally, after the substitution of the required
data, the needed thrust value during cruise was
27.5 kN.
The aim of the second stage of this part of
the work was to select proper engines for
baseline configuration (two currently produced
engines in nacelles below wing) and two
variants of research. The first variant of research
uses as cruising engine the currently produced
and exploited engine and the second one uses
the newest power unit, which is in the phase of
research and development. The characteristics
of the engine for the first variant are known,
while for the second can be only predicted on
the basis of the manufacturer promises.
Therefore, they must be subject to caution. The
results for the first variant could be interpreted
as the low limit, and for the second one as the
high limit of potential benefits associated with
the use of presented configuration of an
airplane.
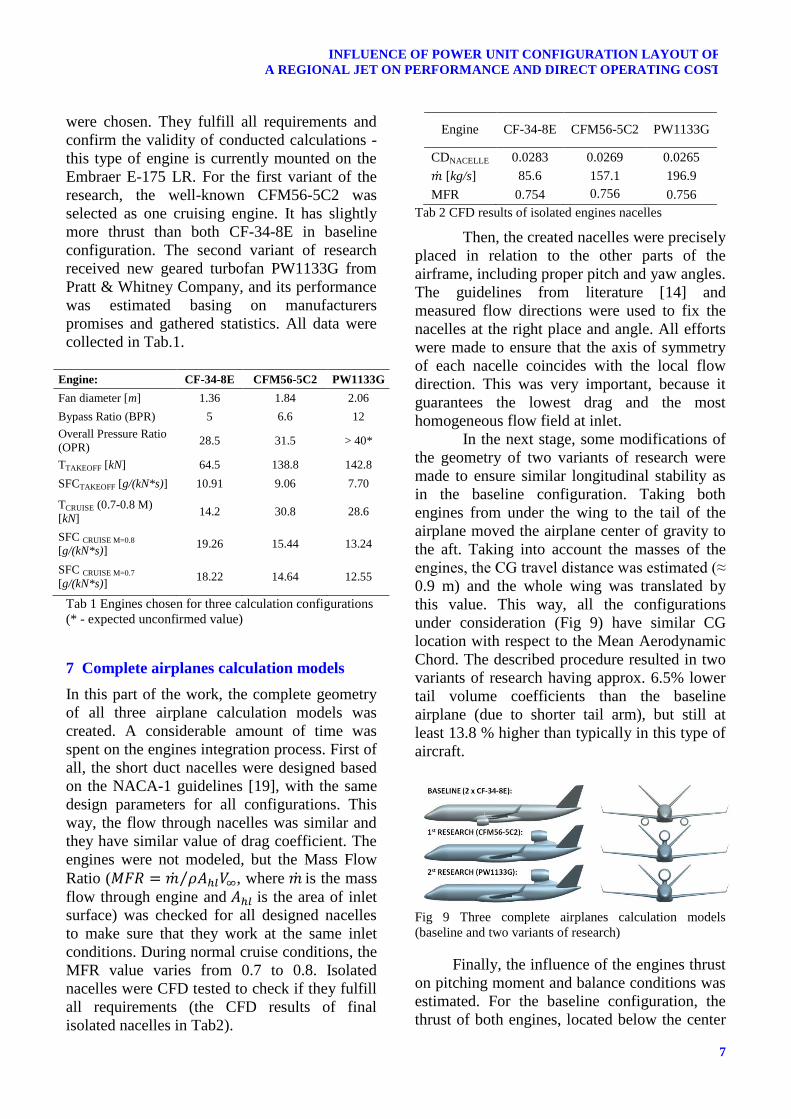
Fig 7 Value of TCRUISE/TTAKEOFF ratio in a function of
Overall Pressure Ratio (OPR) for chosen jet engines
It was relatively easy to check the first
requirement concerning take-off thrust, because
all engines manufacturers present take-off thrust
at sea level at their specification tables. In turn,
cruise thrust is often neglected and in some
cases had to be estimated on the basis of Overall
Pressure Ratio of the engine and the statistics
presented in Fig 7.
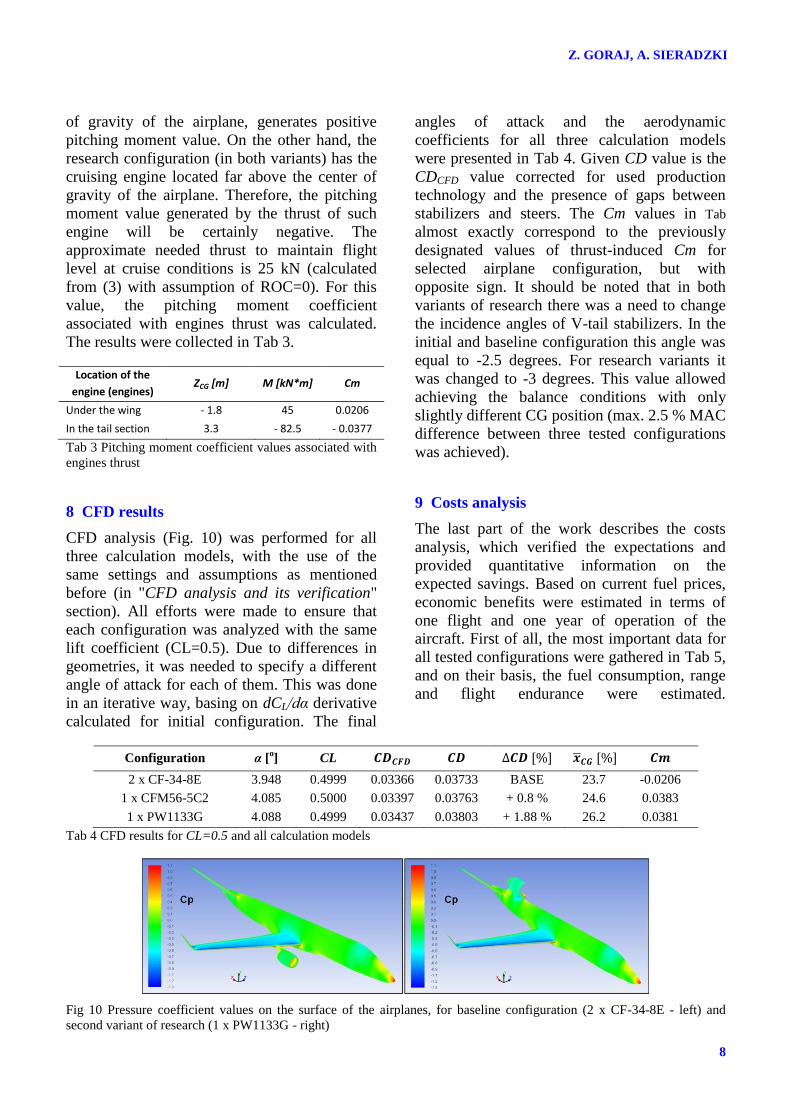
Most engine manufactures provide
cruising thrust and specific fuel consumption
(SFC) value at 35 000 feet and flight speed 0.8-
0.82 Ma. Assumed flight conditions are a bit
different (M=0.7), and some corrections had to
be implemented. Basing on the example
turbofan engines characteristics [14], it was
assumed that thrust value is the same for both,
flight speeds and SFC changes linearly (as
shown in Fig 8).
Fig 8 Changes in performance (uninstalled thrust and
specific fuel consumption) for typical turbofan engine,
[14]
In this way, the characteristics of the
engines, taken into account in subsequent
calculations were estimated. For the baseline
airplane configuration, two CF-34-8E engines
7
INFLUENCE OF POWER UNIT CONFIGURATION LAYOUT OF
A REGIONAL JET ON PERFORMANCE AND DIRECT OPERATING COST
were chosen. They fulfill all requirements and
confirm the validity of conducted calculations -
this type of engine is currently mounted on the
Embraer E-175 LR. For the first variant of the
research, the well-known CFM56-5C2 was
selected as one cruising engine. It has slightly
more thrust than both CF-34-8E in baseline
configuration. The second variant of research
received new geared turbofan PW1133G from
Pratt & Whitney Company, and its performance
was estimated basing on manufacturers
promises and gathered statistics. All data were
collected in Tab.1.
Engine: CF-34-8E CFM56-5C2 PW1133G
Fan diameter [m] 1.36 1.84 2.06
Bypass Ratio (BPR) 5 6.6 12
Overall Pressure Ratio
(OPR) 28.5 31.5 > 40*
TTAKEOFF [kN] 64.5 138.8 142.8
SFCTAKEOFF [g/(kN*s)] 10.91 9.06 7.70
TCRUISE (0.7-0.8 M)
[kN] 14.2 30.8 28.6
SFC CRUISE M=0.8
[g/(kN*s)] 19.26 15.44 13.24
SFC CRUISE M=0.7
[g/(kN*s)] 18.22 14.64 12.55
Tab 1 Engines chosen for three calculation configurations
(* - expected unconfirmed value)
7 Complete airplanes calculation models
In this part of the work, the complete geometry
of all three airplane calculation models was
created. A considerable amount of time was
spent on the engines integration process. First of
all, the short duct nacelles were designed based
on the NACA-1 guidelines [19], with the same
design parameters for all configurations. This
way, the flow through nacelles was similar and
they have similar value of drag coefficient. The
engines were not modeled, but the Mass Flow
Ratio (𝑀𝐹𝑅 = �̇� 𝜌𝐴ℎ𝑙𝑉∞⁄ , where �̇� is the mass
flow through engine and 𝐴ℎ𝑙 is the area of inlet
surface) was checked for all designed nacelles
to make sure that they work at the same inlet
conditions. During normal cruise conditions, the
MFR value varies from 0.7 to 0.8. Isolated
nacelles were CFD tested to check if they fulfill
all requirements (the CFD results of final
isolated nacelles in Tab2).
Engine CF-34-8E CFM56-5C2 PW1133G
CDNACELLE 0.0283 0.0269 0.0265
�̇� [kg/s] 85.6 157.1 196.9
MFR 0.754 0.756 0.756
Tab 2 CFD results of isolated engines nacelles
Then, the created nacelles were precisely
placed in relation to the other parts of the
airframe, including proper pitch and yaw angles.
The guidelines from literature [14] and
measured flow directions were used to fix the
nacelles at the right place and angle. All efforts
were made to ensure that the axis of symmetry
of each nacelle coincides with the local flow
direction. This was very important, because it
guarantees the lowest drag and the most
homogeneous flow field at inlet.
In the next stage, some modifications of
the geometry of two variants of research were
made to ensure similar longitudinal stability as
in the baseline configuration. Taking both
engines from under the wing to the tail of the
airplane moved the airplane center of gravity to
the aft. Taking into account the masses of the
engines, the CG travel distance was estimated (≈
0.9 m) and the whole wing was translated by
this value. This way, all the configurations
under consideration (Fig 9) have similar CG
location with respect to the Mean Aerodynamic
Chord. The described procedure resulted in two
variants of research having approx. 6.5% lower
tail volume coefficients than the baseline
airplane (due to shorter tail arm), but still at
least 13.8 % higher than typically in this type of
aircraft.
Fig 9 Three complete airplanes calculation models
(baseline and two variants of research)
Finally, the influence of the engines thrust
on pitching moment and balance conditions was
estimated. For the baseline configuration, the
thrust of both engines, located below the center
Z. GORAJ, A. SIERADZKI
8
of gravity of the airplane, generates positive
pitching moment value. On the other hand, the
research configuration (in both variants) has the
cruising engine located far above the center of
gravity of the airplane. Therefore, the pitching
moment value generated by the thrust of such
engine will be certainly negative. The
approximate needed thrust to maintain flight
level at cruise conditions is 25 kN (calculated
from (3) with assumption of ROC=0). For this
value, the pitching moment coefficient
associated with engines thrust was calculated.
The results were collected in Tab 3.
Location of the
engine (engines) ZCG [m] M [kN*m] Cm
Under the wing - 1.8 45 0.0206
In the tail section 3.3 - 82.5 - 0.0377
Tab 3 Pitching moment coefficient values associated with
engines thrust
8 CFD results
CFD analysis (Fig. 10) was performed for all
three calculation models, with the use of the
same settings and assumptions as mentioned
before (in "CFD analysis and its verification"
section). All efforts were made to ensure that
each configuration was analyzed with the same
lift coefficient (CL=0.5). Due to differences in
geometries, it was needed to specify a different
angle of attack for each of them. This was done
in an iterative way, basing on dCL/dα derivative
calculated for initial configuration. The final
angles of attack and the aerodynamic
coefficients for all three calculation models
were presented in Tab 4. Given CD value is the
CDCFD value corrected for used production
technology and the presence of gaps between
stabilizers and steers. The Cm values in Tab
almost exactly correspond to the previously
designated values of thrust-induced Cm for
selected airplane configuration, but with
opposite sign. It should be noted that in both
variants of research there was a need to change
the incidence angles of V-tail stabilizers. In the
initial and baseline configuration this angle was
equal to -2.5 degrees. For research variants it
was changed to -3 degrees. This value allowed
achieving the balance conditions with only
slightly different CG position (max. 2.5 % MAC
difference between three tested configurations
was achieved).
9 Costs analysis
The last part of the work describes the costs
analysis, which verified the expectations and
provided quantitative information on the
expected savings. Based on current fuel prices,
economic benefits were estimated in terms of
one flight and one year of operation of the
aircraft. First of all, the most important data for
all tested configurations were gathered in Tab 5,
and on their basis, the fuel consumption, range
and flight endurance were estimated.
Configuration α [o] CL 𝑪𝑫𝑪𝑭𝑫 𝑪𝑫 ∆𝑪𝑫 [%] 𝒙𝑪𝑮 [%] 𝑪𝒎
2 x CF-34-8E 3.948 0.4999 0.03366 0.03733 BASE 23.7 -0.0206
1 x CFM56-5C2 4.085 0.5000 0.03397 0.03763 + 0.8 % 24.6 0.0383
1 x PW1133G 4.088 0.4999 0.03437 0.03803 + 1.88 % 26.2 0.0381
Tab 4 CFD results for CL=0.5 and all calculation models
Fig 10 Pressure coefficient values on the surface of the airplanes, for baseline configuration (2 x CF-34-8E - left) and
second variant of research (1 x PW1133G - right)
9
INFLUENCE OF POWER UNIT CONFIGURATION LAYOUT OF
A REGIONAL JET ON PERFORMANCE AND DIRECT OPERATING COST
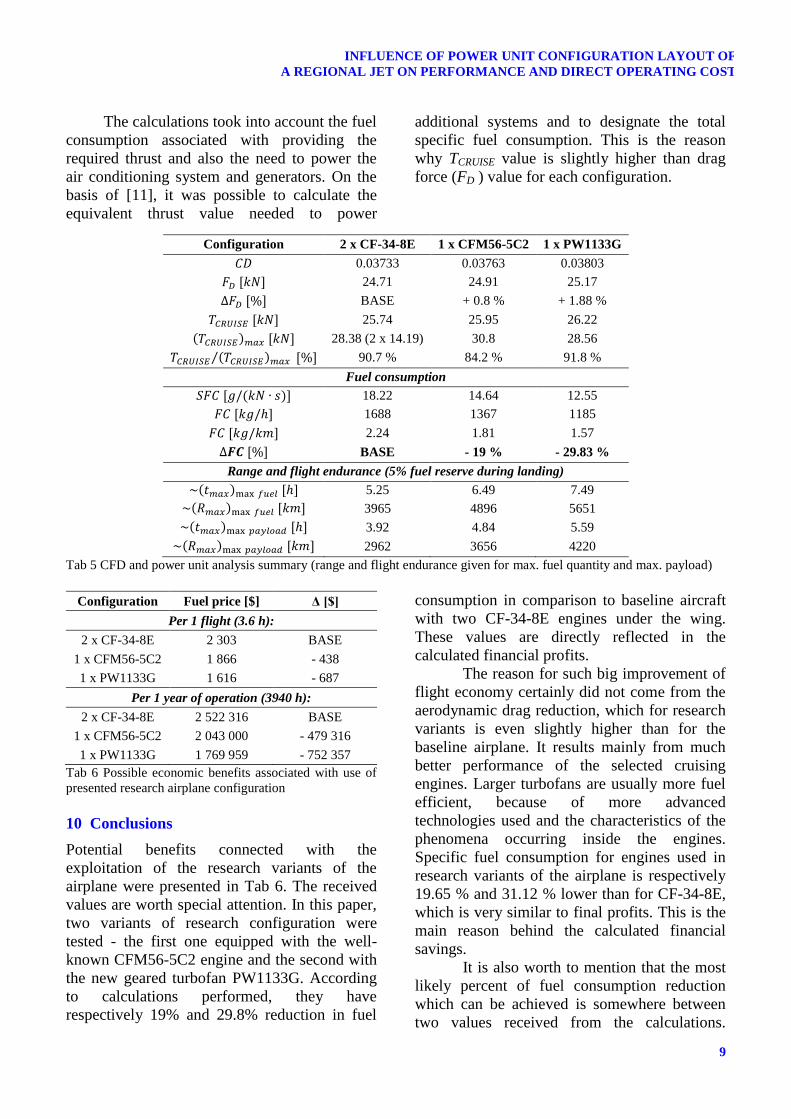
The calculations took into account the fuel
consumption associated with providing the
required thrust and also the need to power the
air conditioning system and generators. On the
basis of [11], it was possible to calculate the
equivalent thrust value needed to power
additional systems and to designate the total
specific fuel consumption. This is the reason
why TCRUISE value is slightly higher than drag
force (FD ) value for each configuration.
Configuration 2 x CF-34-8E 1 x CFM56-5C2 1 x PW1133G
𝐶𝐷 0.03733 0.03763 0.03803
𝐹𝐷 [𝑘𝑁] 24.71 24.91 25.17
∆𝐹𝐷 [%] BASE + 0.8 % + 1.88 %
𝑇𝐶𝑅𝑈𝐼𝑆𝐸 [𝑘𝑁] 25.74 25.95 26.22
(𝑇𝐶𝑅𝑈𝐼𝑆𝐸)𝑚𝑎𝑥 [𝑘𝑁] 28.38 (2 x 14.19) 30.8 28.56
𝑇𝐶𝑅𝑈𝐼𝑆𝐸 (𝑇𝐶𝑅𝑈𝐼𝑆𝐸)𝑚𝑎𝑥⁄ [%] 90.7 % 84.2 % 91.8 %
Fuel consumption
𝑆𝐹𝐶 [𝑔/(𝑘𝑁 ∙ 𝑠)] 18.22 14.64 12.55
𝐹𝐶 [𝑘𝑔/ℎ] 1688 1367 1185
𝐹𝐶 [𝑘𝑔/𝑘𝑚] 2.24 1.81 1.57
∆𝑭𝑪 [%] BASE - 19 % - 29.83 %
Range and flight endurance (5% fuel reserve during landing)
~(𝑡𝑚𝑎𝑥)max 𝑓𝑢𝑒𝑙 [ℎ] 5.25 6.49 7.49
~(𝑅𝑚𝑎𝑥)max 𝑓𝑢𝑒𝑙 [𝑘𝑚] 3965 4896 5651
~(𝑡𝑚𝑎𝑥)max 𝑝𝑎𝑦𝑙𝑜𝑎𝑑 [ℎ] 3.92 4.84 5.59
~(𝑅𝑚𝑎𝑥)max 𝑝𝑎𝑦𝑙𝑜𝑎𝑑 [𝑘𝑚] 2962 3656 4220
Tab 5 CFD and power unit analysis summary (range and flight endurance given for max. fuel quantity and max. payload)
Configuration Fuel price [$] Δ [$]
Per 1 flight (3.6 h):
2 x CF-34-8E 2 303 BASE
1 x CFM56-5C2 1 866 - 438
1 x PW1133G 1 616 - 687
Per 1 year of operation (3940 h):
2 x CF-34-8E 2 522 316 BASE
1 x CFM56-5C2 2 043 000 - 479 316
1 x PW1133G 1 769 959 - 752 357
Tab 6 Possible economic benefits associated with use of
presented research airplane configuration
10 Conclusions
Potential benefits connected with the
exploitation of the research variants of the
airplane were presented in Tab 6. The received
values are worth special attention. In this paper,
two variants of research configuration were
tested - the first one equipped with the well-
known CFM56-5C2 engine and the second with
the new geared turbofan PW1133G. According
to calculations performed, they have
respectively 19% and 29.8% reduction in fuel
consumption in comparison to baseline aircraft
with two CF-34-8E engines under the wing.
These values are directly reflected in the
calculated financial profits.
The reason for such big improvement of
flight economy certainly did not come from the
aerodynamic drag reduction, which for research
variants is even slightly higher than for the
baseline airplane. It results mainly from much
better performance of the selected cruising
engines. Larger turbofans are usually more fuel
efficient, because of more advanced
technologies used and the characteristics of the
phenomena occurring inside the engines.
Specific fuel consumption for engines used in
research variants of the airplane is respectively
19.65 % and 31.12 % lower than for CF-34-8E,
which is very similar to final profits. This is the
main reason behind the calculated financial
savings.
It is also worth to mention that the most
likely percent of fuel consumption reduction
which can be achieved is somewhere between
two values received from the calculations.
Z. GORAJ, A. SIERADZKI
10
Probably, it would be lower than 29.8%,
because the performance of PW1133G was only
estimated on the basis of the manufacturers
promises, and higher than 19% because,
nowadays, it is very rare to design new airliner
with the use of existing engines. Usually, they
are designed in parallel with the use of the most
recent technologies available.
11 References
[1] Szodruch J., Möller U., Rossow C., DLR, -
HELENA- Highly Environmental Low Emission
Next generation regional Aircraft. Berlin 16. July
2010 (unpublished presentation).
[2] Goraj Z., European Regional Jet – Polish
Contribution to the Future Joint European
Undertaking. Unpublished presentation given in
European Commission, Brussels, June 23, 2010.
[3] Goraj Z., Frydrychewicz A., Grendysa W., Jonas
M., European Regional Jet – Rationales for Future
Joint European Undertaking, Proceedings of
“Research and Education for Aircraft Design”
Conference. Warsaw June 28, 2010.
[4] Sieradzki A., Power plant configuration analysis of
the regional jet aircraft with single cruising engine.
M.Sc. Thesis, Warsaw University of Technology,
Aircraft Design Department, Warsaw Oct 2014
(unpublished).
[5] Piwek, K., Wisniowski, W. (2016), Small Air
Transport Aircraft Entry Requirements Evoked by
Flightpath 2050. Aircraft Engineering and
Aerospace Technology, Volume 88, Issue 2, pp.
341-347, Special Issue: 4th EASN Workshop: Part
I.
[6] Arvai E., The Dynamic Regional Jet Market,
„AirInsight”, 04/2011. Link: http:// airinsight.
com/wp-content /uploads/2011/10/RJ-Summary
.pdf [available 23 Nov 2013].
[7] Preston N., Development of the North American &
European regional markets, „Aircraft Commerce”
2010, Issue 72, s. 5 -16.
[8] Bombardier Aerospace, Commercial Aircraft
Market Forecast 2012-2031, 2012. Link: http://
www2.bombardier.com/en/3_0/3_8/market_foreca
st/BCA_2012_Market_Forecast.pdf [available 23
Nov 2013].
[9] Arvai E., The Core of the PW1000G Geared
Turbo-Fan, „AirInsight”, 10/2012. Link: http://
airinsight.com/2012/10/02/airinsight-technical-
analysis-the-core-of-the-pw1000g-geared-turbo-
fan/ [available 23 Nov 2013].
[10] Arvai E., Comparing the new technology Narrow-
body engines: GTF vs LEAP maintenance costs,
„AirInsight”, 11/2011. Link: http://airinsight.com/
2011/11/09/comparing-the-new-technology-
narrow-body-engines-gtf-vs-leap-maintenance-
costs/ [available 23 Nov 2013].
[11] Corke T. C., Design of Aircraft, Upper Sadle
River: Pearson Education Inc., 2003. ISBN 0-13-
089234-3.
[12] Harris C. D., NASA Supercritical Airfoils: A
Matrix of Family-Related Airfoils, Hampton:
Langley Research Center, NASA TP-2969, 1990.
[13] Jenkins R. V., Hill A. S., Ray E. J., Aerodynamic
Performance and Pressure Distributions for a
NASA SC(2)-0714 Airfoil Tested in the Langley
0.3-Meter Transonic Cryogenic Tunnel, Hampton:
Langley Research Center, NASA TM-4044, 1988.
[14] Raymer D. P., Aircraft Design: A Conceptual
Approach, Washington: American Institute of
Aeronautics and Astronautics, 1992. ISBN 0-
930403-51-7.
[15] Nita M., Scholz D., Estimating the Oswald Factor
from basic aircraft geometrical parameters,
Hamburg: Hamburg University of Applied
Sciences, 2012.
[16] ESDU, Royal Aeronautical Society (1954), ESDU
(Engineering Sciences Data Unit), Aerodynamic
Sub-Series, Royal Aeronautical Society, London.
[17] Roux É., Turbofan and Turbojet Engines:
Database Handbook, Blagnac: Éditions Élodie
Roux, 2007. ISBN 978-2-9529380-1-3.
[18] Kundu A. K., Aircraft Design, Cambridge:
Cambridge University Press, 2010. ISBN 978-0-
511-67785-4.
[19] Langley M. J., The Design of Axisymmetric Cowls
for Podded Nacelles for High By-Pass Ratio
Turbofan Engines, Aircraft Research Association
Ltd., Bedford, 1979.
12 Contact Author Email Address
Mailto: [email protected]
13 Copyright Statement
The authors confirm that they, and/or their company or
organization, hold copyright on all of the original material
included in this paper. The authors also confirm that they
have obtained permission, from the copyright holder of
any third party material included in this paper, to publish
it as part of their paper. The authors confirm that they
give permission, or have obtained permission from the
copyright holder of this paper, for the publication and
distribution of this paper as part of the ICAS proceedings
or as individual off-prints from the proceedings.
Top Related