


Languages
Pages
Legal

INDUCTION HEATING MODEL OF CERMET FUEL ELEMENT ENVIRONMENTAL TEST (CFEET)
C.F. Gomez, D.E. Bradley, D.P. Cavender, O.R. Mireles, R.R. Hickman, D. Trent,
E. Stewart
ABSTRACT
Deep space missions with large payloads require high specific impulse and relatively high thrust to achieve mission goals in reasonable time frames. Nuclear Thermal Rockets (NTR) are capable of producing a high specific impulse by employing heat produced by a fission reactor to heat and therefore accelerate hydrogen through a rocket nozzle providing thrust. Fuel element temperatures are very high (up to 3000 K) and hydrogen is highly reactive with most materials at high temperatures. Data covering the effects of high‐temperature hydrogen exposure on fuel elements are limited. The primary concern is the mechanical failure of fuel elements due to large thermal gradients; therefore, high‐melting‐point ceramics‐metallic matrix composites (cermets) are one of the fuels under consideration as part of the Nuclear Cryogenic Propulsion Stage (NCPS) Advance Exploration System (AES) technology project at the Marshall Space Flight Center. The purpose of testing and analytical modeling is to determine their ability to survive and maintain thermal performance in a prototypical NTR reactor environment of exposure to hydrogen at very high temperatures and obtain data to assess the properties of the non‐nuclear support materials. The fission process and the resulting heating performance are well known and do not require that active fissile material to be integrated in this testing. A small‐scale test bed; Compact Fuel Element Environmental Tester (CFEET), designed to heat fuel element samples via induction heating and expose samples to hydrogen is being developed at MSFC to assist in optimal material and manufacturing process selection without utilizing fissile material. This paper details the analytical approach to help design and optimize the test bed using COMSOL Multiphysics for predicting thermal gradients induced by electromagnetic heating (Induction heating) and Thermal Desktop for radiation calculations.
INTRODUCTION
The objective for the Cermet Fuel Element Environmental Test (CFEET) simulation effort is to develop and correlate a mathematical model for induction heating of cermet samples. The primary interest is for samples to reach temperatures of 3000 K and determine their ability to survive and maintain thermal performance in an Induction heating environment. Initial test show that reaching high temperatures by induction heating has proved difficult due to large amounts of thermal energy being lost by radiation and the low energy efficiency of the inductor coil. Power and energy can be computed using text book equations for induction heating and processing, but these values are only estimations which don’t take into account accurate energy losses such as radiation and electromagnetic losses. Thermal Desktop is being used to
https://ntrs.nasa.gov/search.jsp?R=20140002997 2018-05-28T00:42:04+00:00Z
TFAWS 2013 – July 29 – August 2, 2013 2
model and improve the energy transferred to the sample in order to reach high temperatures. In addition, an Induction heating model created in Common Solution Multi Physics (COMSOL) will be used to predict the energy induced by the electromagnetic field. The analytical approach using both simulations will help design a better and more efficient test bed.
INDUCTION HEAT THEORY
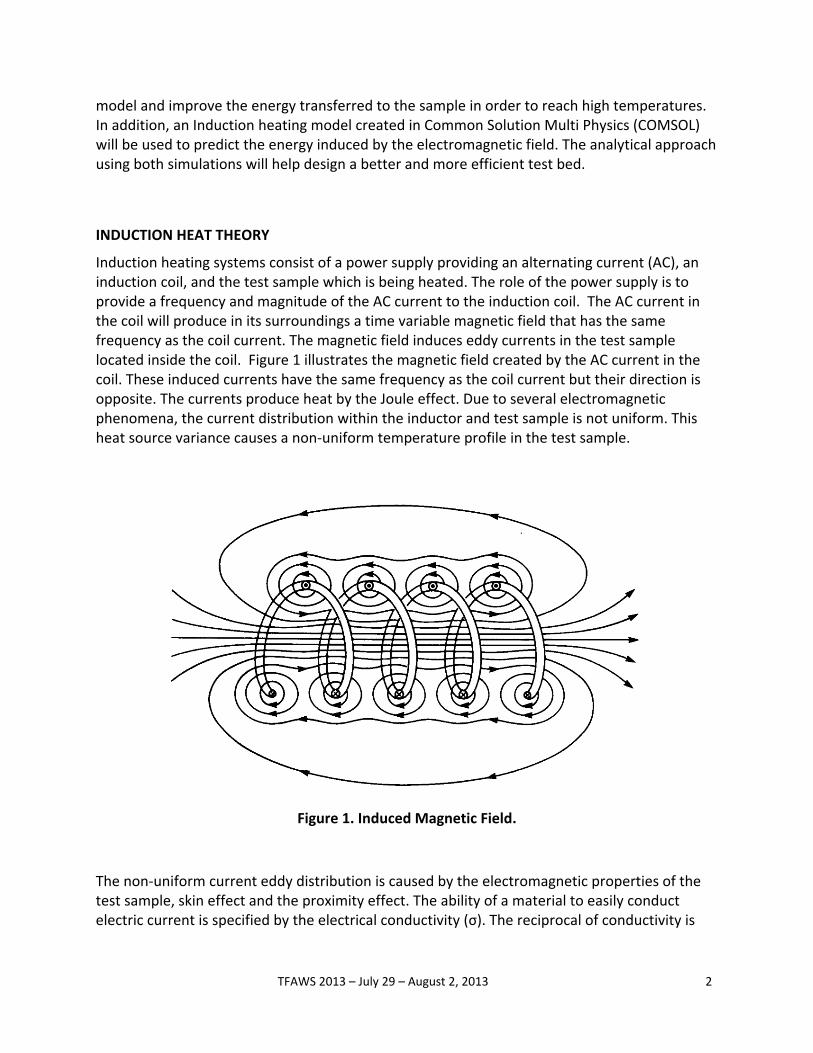
Induction heating systems consist of a power supply providing an alternating current (AC), an induction coil, and the test sample which is being heated. The role of the power supply is to provide a frequency and magnitude of the AC current to the induction coil. The AC current in the coil will produce in its surroundings a time variable magnetic field that has the same frequency as the coil current. The magnetic field induces eddy currents in the test sample located inside the coil. Figure 1 illustrates the magnetic field created by the AC current in the coil. These induced currents have the same frequency as the coil current but their direction is opposite. The currents produce heat by the Joule effect. Due to several electromagnetic phenomena, the current distribution within the inductor and test sample is not uniform. This heat source variance causes a non‐uniform temperature profile in the test sample.
Figure 1. Induced Magnetic Field.
The non‐uniform current eddy distribution is caused by the electromagnetic properties of the test sample, skin effect and the proximity effect. The ability of a material to easily conduct electric current is specified by the electrical conductivity (σ). The reciprocal of conductivity is
TFAWS 2013 – July 29 – August 2, 2013 3
electrical resistivity (ρ). Electrical resistivity varies with temperature. Metals and Alloys are considered to be good conductors and have much less electrical resistance compared to other materials. Electrical resistivity is an imperative physical property since it affects practically all the important parameters of an induction heating systems.
Relative magnetic permeability ( ) indicates the ability of a material to conduct the magnetic flux better than vacuum or air. Magnetic permeability is also a function of temperature. This non‐dimensional parameter effects coil calculation and computation of electromagnetic field distribution on the test sample.
SKIN EFFECT AND EQUIVALENT POWER
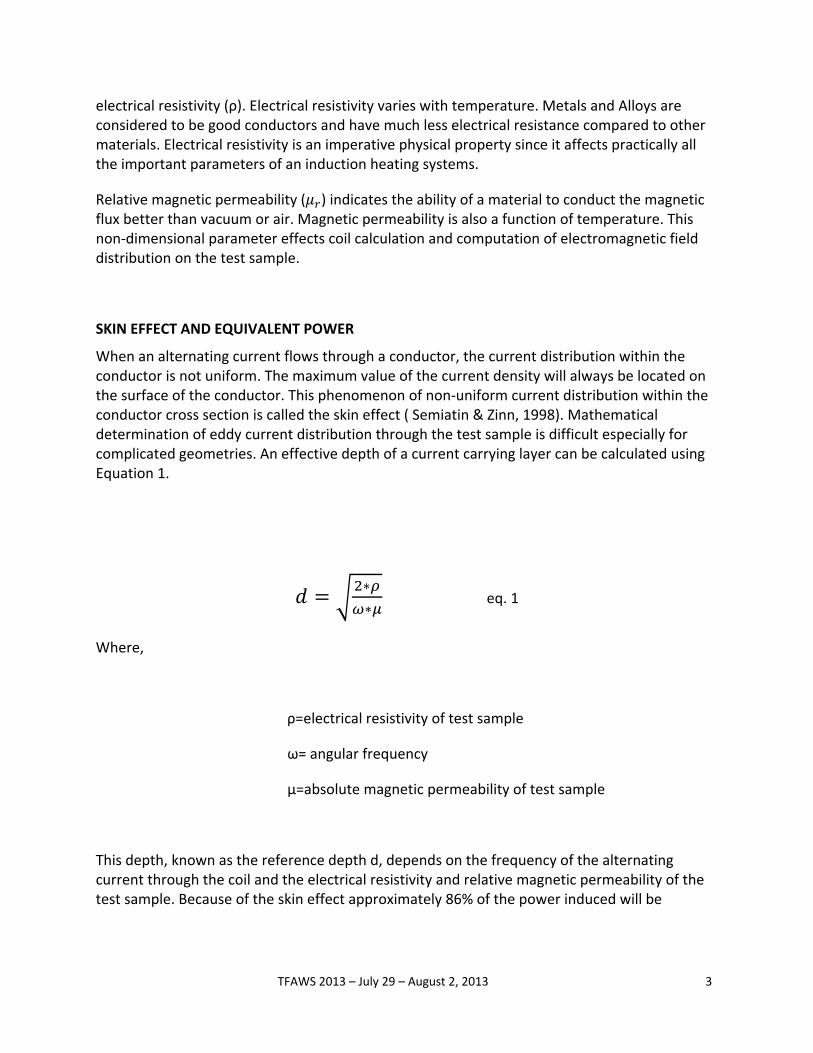
When an alternating current flows through a conductor, the current distribution within the conductor is not uniform. The maximum value of the current density will always be located on the surface of the conductor. This phenomenon of non‐uniform current distribution within the conductor cross section is called the skin effect ( Semiatin & Zinn, 1998). Mathematical determination of eddy current distribution through the test sample is difficult especially for complicated geometries. An effective depth of a current carrying layer can be calculated using Equation 1.
∗
∗ eq. 1
Where,
ρ=electrical resistivity of test sample
ω= angular frequency
μ=absolute magnetic permeability of test sample
This depth, known as the reference depth d, depends on the frequency of the alternating current through the coil and the electrical resistivity and relative magnetic permeability of the test sample. Because of the skin effect approximately 86% of the power induced will be
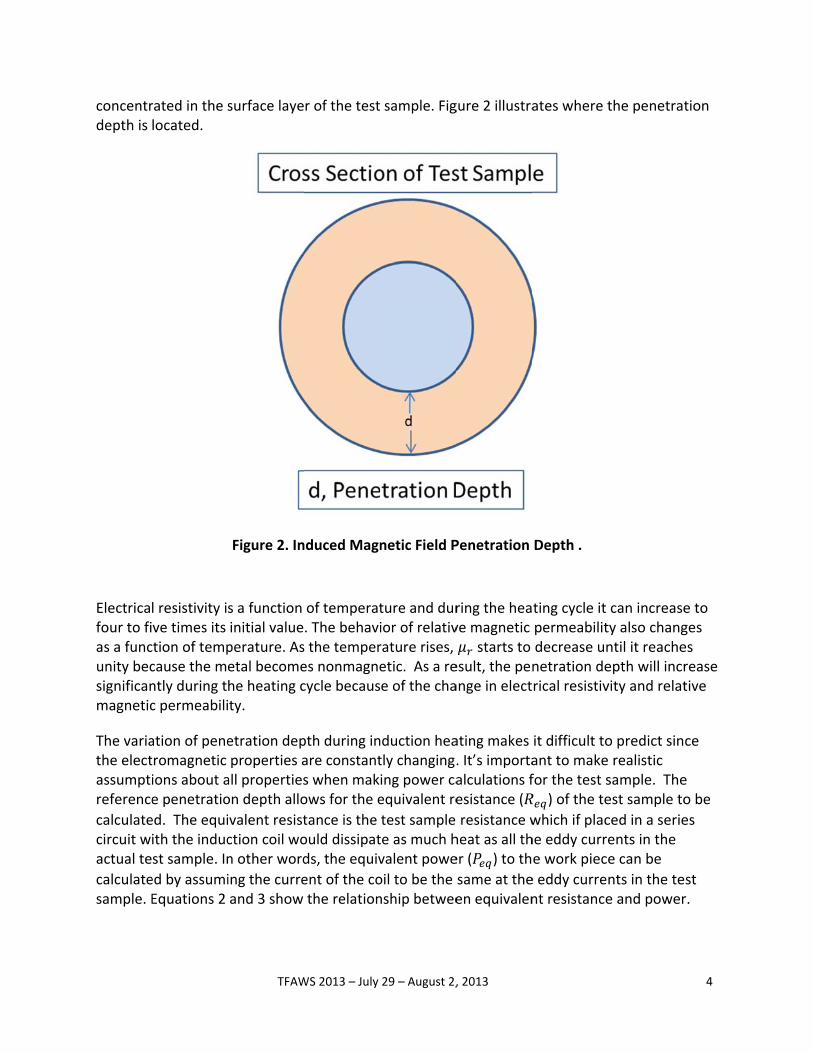
concentrdepth is
Electricafour to fias a funcunity becsignificanmagnetic
The variathe electassumptireference
calculatecircuit wactual te
calculatesample. E
rated in the slocated.
l resistivity isve times its ction of tempcause the mently during tc permeabili
ation of penetromagnetic ions about ae penetratio
ed. The equiith the inducst sample. In
ed by assumiEquations 2
TFAW
surface laye
Figure 2. In
s a function initial valueperature. Asetal becomehe heating cty.
etration depproperties aall propertieson depth allo
valent resistction coil won other word
ing the curreand 3 show
WS 2013 – July
r of the test
nduced Magn
of temperat. The behavis the temperes nonmagnecycle becaus
pth during inare constants when makows for the e
tance is the ould dissipatds, the equiv
ent of the cothe relation
29 – August 2,
sample. Fig
netic Field P
ture and durior of relativrature rises, etic. As a ree of the cha
nduction heatly changing.ing power caequivalent re
test samplete as much hvalent powe
oil to be the nship betwee
, 2013
gure 2 illustra
Penetration
ring the heave magnetic
starts to esult, the penange in elect
ating makes. It’s importaalculations fesistance (
resistance wheat as all ther ( ) to th
same at theen equivalen
ates where t
Depth .
ting cycle it permeabilitdecrease unnetration derical resistiv
it difficult toant to makefor the test s
) of the te
which if plache eddy curree work piece
e eddy currennt resistance
the penetrat
can increasety also changntil it reacheepth will incrvity and relat
o predict sin realistic sample. Theest sample to
ced in a serieents in the e can be
nts in the tee and power
4
tion
e to ges es rease tive
ce
e o be
es
st r.
TFAWS 2013 – July 29 – August 2, 2013 5
∗ ∗ ∗ ∗
∗ eq. 2
∗ eq. 3
Where,
ρ= electrical resistivity of test sample
D=bar diameter
Kr= electrical path factor
N=number of turns of coil
d=penetration depth
L=bar height
Ic= current in coil
For a solid round bar, such as the test sample, it turns out that the is equal to the number
of turns in the coil and the resistance of the reference penetration depth d located on the surface. The dependence of on the number of induction coil turns N is a result of the fact
that the induced voltage and eddy currents both increase linearly with N according to Faraday’s Ohm’s Law.
It’s important to note that the power supply will not provide the full rated power directly to the test sample. There will be power losses through the circuit system of the power supply, electromagnetic losses, and losses through the induction coil (Rudnev, Loveless, Cook, & Black, 2003). The equations listed, gives a steady state approximation of the power being induced to the test sample by just knowing the coil design and the electrical current. This power was used as the main heat source on the Thermal Desktop model.
TEST SET
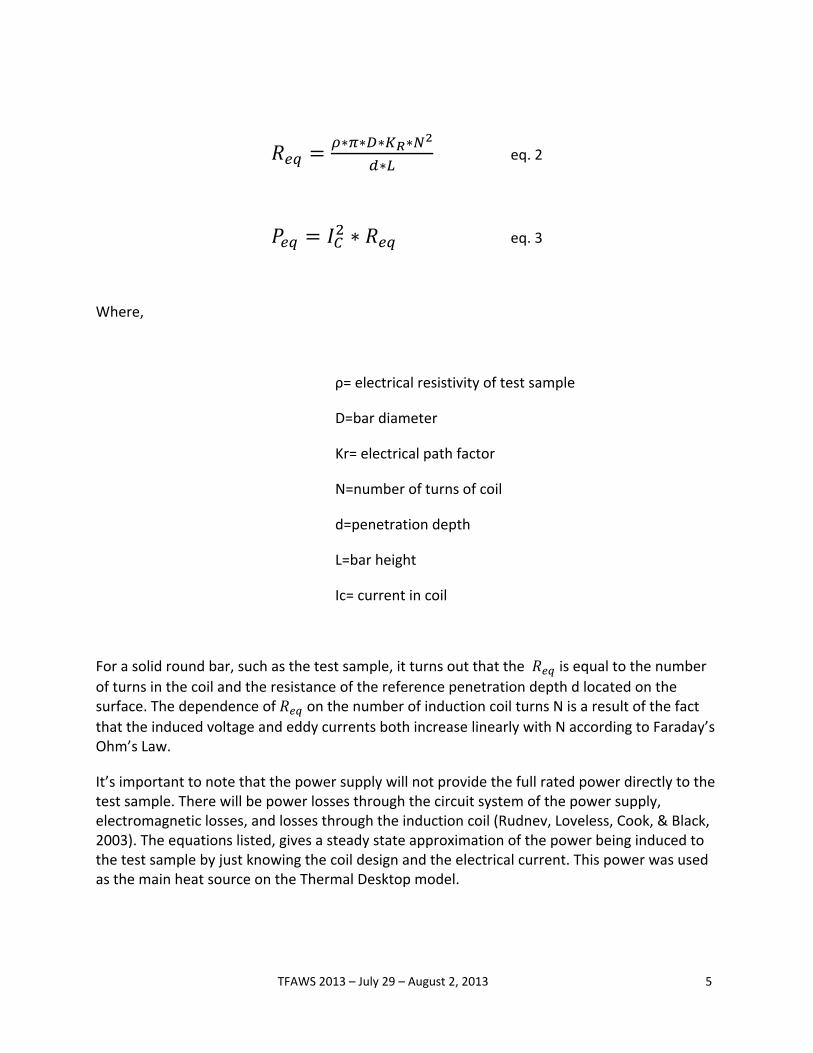
The test in. tall thinduction3 shows
The induFlexitunean outpufunctionewater wathrough tthe build
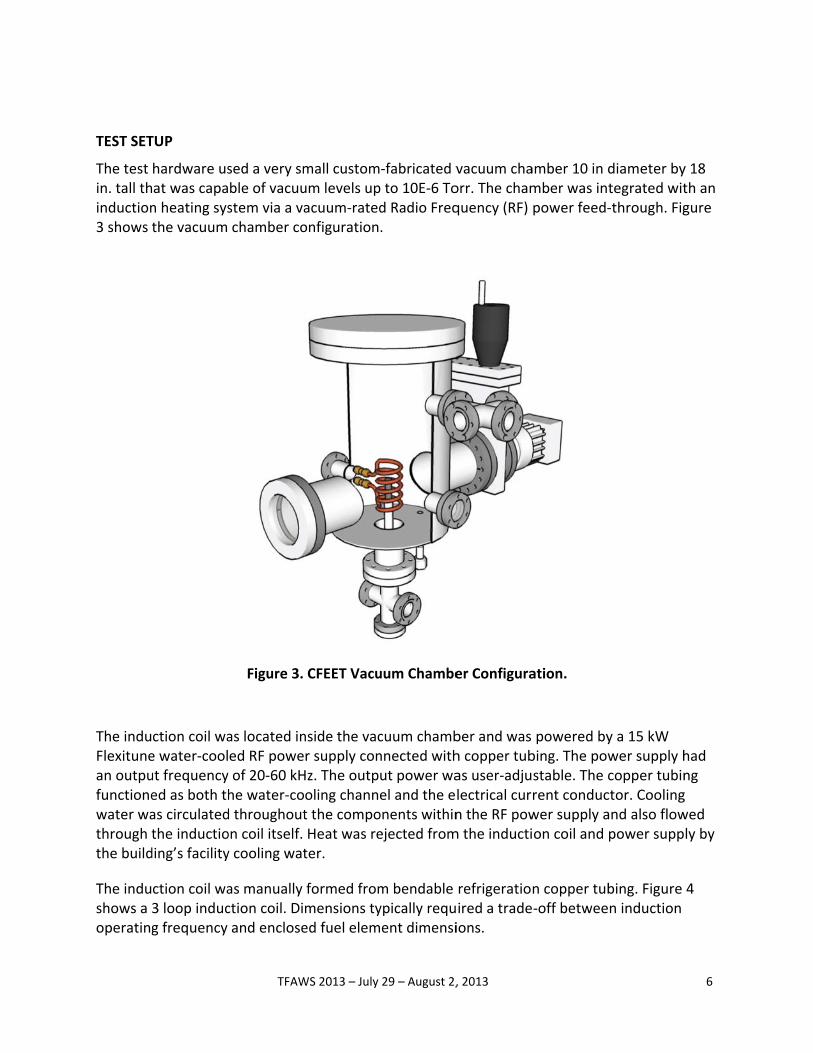
The indushows a operating
TUP
hardware usat was capan heating systhe vacuum
ction coil wae water‐coolut frequencyed as both thas circulatedthe inductioding’s facility
ction coil wa3 loop inducg frequency
TFAW
sed a very smble of vacuustem via a vachamber co
Figure 3.
as located ined RF powey of 20‐60 kHhe water‐cod throughouton coil itself. y cooling wat
as manually ction coil. Diand enclose
WS 2013 – July
mall customum levels upacuum‐ratedonfiguration
CFEET Vacu
nside the vacr supply conHz. The outpoling channet the compoHeat was reter.
formed frommensions tyed fuel elem
29 – August 2,
‐fabricated vp to 10E‐6 Tod Radio Freq.
uum Chambe
cuum chambnnected withut power wael and the eonents withinejected from
m bendable ypically requent dimensi
, 2013
vacuum chaorr. The chamquency (RF)
er Configura
ber and was h copper tubas user‐adjulectrical curn the RF powm the inducti
refrigeratioired a tradeions.
amber 10 in dmber was intpower feed‐
ation.
powered bybing. The powstable. The crent conducwer supply aon coil and
n copper tub‐off betwee
diameter bytegrated wit‐through. Fig
y a 15 kW wer supply hcopper tubinctor. Coolingand also flowpower supp
bing. Figure n induction
6
y 18 th an gure
had ng g wed ly by
4
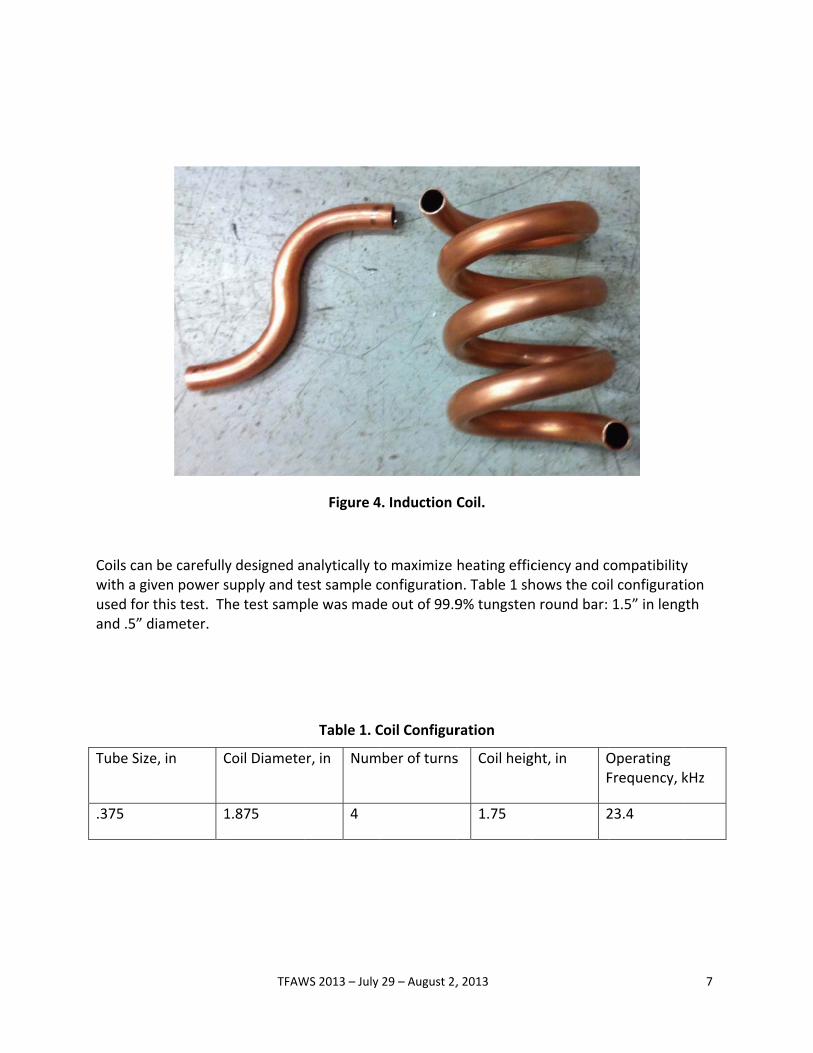
Coils canwith a givused for and .5” d
Tube Size
.375
be carefullyven power sthis test. Thdiameter.
e, in C
1
TFAW
y designed asupply and tehe test samp
Coil Diamete
1.875
WS 2013 – July
Figure 4
nalytically toest sample cple was mad
Table 1. C
er, in Num
4
29 – August 2,
4. Induction
o maximize configuratione out of 99.9
Coil Configur
mber of turns
, 2013
Coil.
heating efficn. Table 1 sh9% tungsten
ration
s Coil heig
1.75
ciency and chows the coin round bar:
ght, in OF
2
compatibilityil configurat1.5” in leng
Operating Frequency, k
23.4
7
y ion gth
kHz
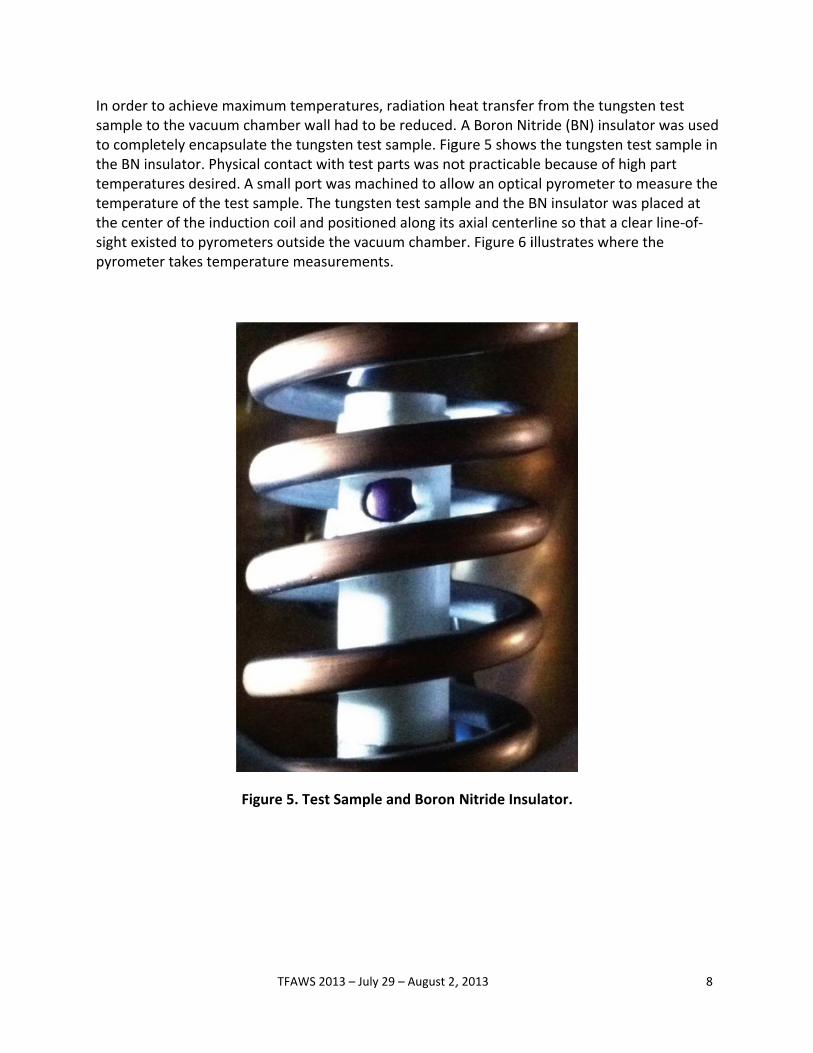
In order tsample tto complthe BN intemperattemperatthe centesight exispyromet
to achieve mo the vacuuetely encapnsulator. Phytures desireture of the ter of the indsted to pyroer takes tem
TFAW
maximum tem chamber sulate the tuysical contacd. A small potest sample. uction coil ameters outsmperature m
Figure 5. T
WS 2013 – July
mperatures,wall had to ungsten testct with test port was macThe tungsteand positionside the vacumeasurement
Test Sample
29 – August 2,
, radiation hbe reduced.t sample. Figparts was nochined to alloen test samped along its uum chambets.
e and Boron
, 2013
heat transfer A Boron Nitgure 5 showsot practicablow an opticaple and the Baxial centerer. Figure 6 i
Nitride Insu
r from the tutride (BN) ins the tungstee because oal pyrometeBN insulator rline so that illustrates w
ulator.
ungsten test nsulator was en test sampof high part er to measur was placed a clear line‐
where the
8
used ple in
e the at ‐of‐
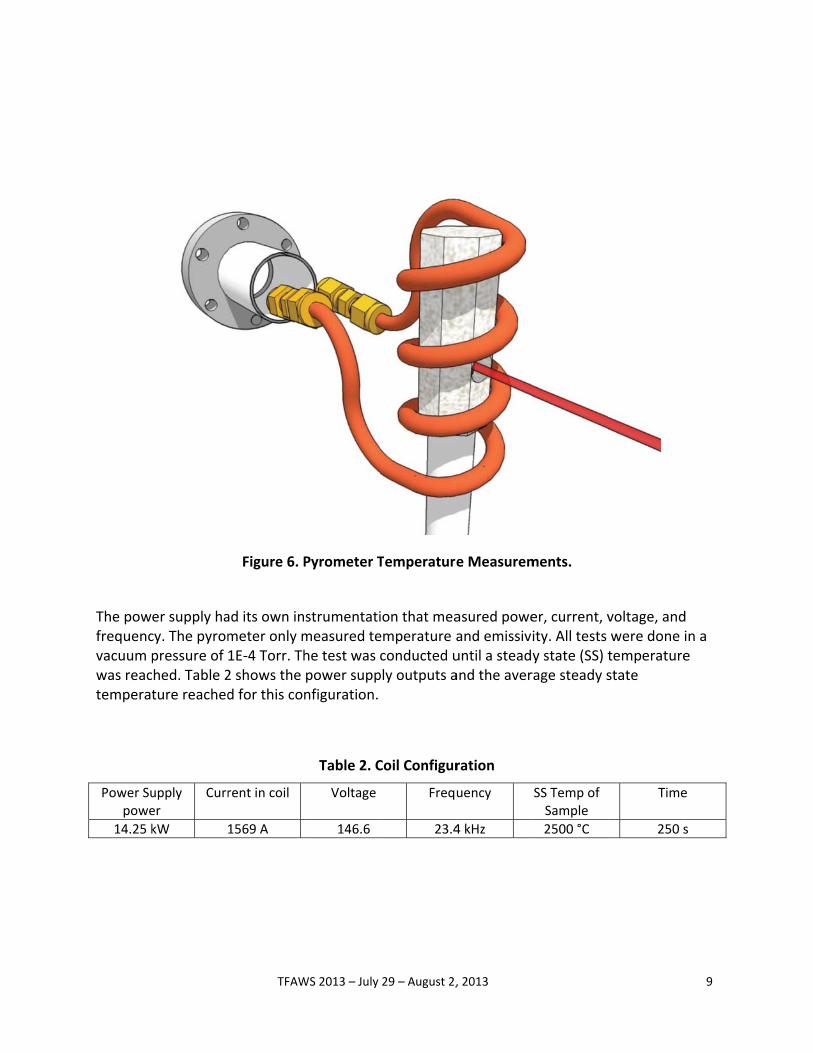
The powfrequencvacuum pwas reactemperat
Power Supowe
14.25 k
er supply hacy. The pyrompressure of hed. Table 2ture reached
upply er
Curr
kW
TFAW
Figure 6. P
ad its own inmeter only m1E‐4 Torr. Th2 shows the d for this co
rent in coil
1569 A
WS 2013 – July
Pyrometer T
strumentatimeasured tehe test was cpower suppnfiguration.
Table 2. C
Voltage
146.6
29 – August 2,
Temperature
ion that meaemperature aconducted uply outputs a
Coil Configur
Freq
23.4
, 2013
e Measurem
asured poweand emissivuntil a steadand the aver
ration
uency
4 kHz
ments.
er, current, vity. All tests y state (SS) trage steady s
SS Temp of Sample
2500 °C
voltage, andwere done temperaturestate
Time
250 s
9
d in a e
e
s
TFAWS 2013 – July 29 – August 2, 2013 10
THERMAL DESKTOP MODEL
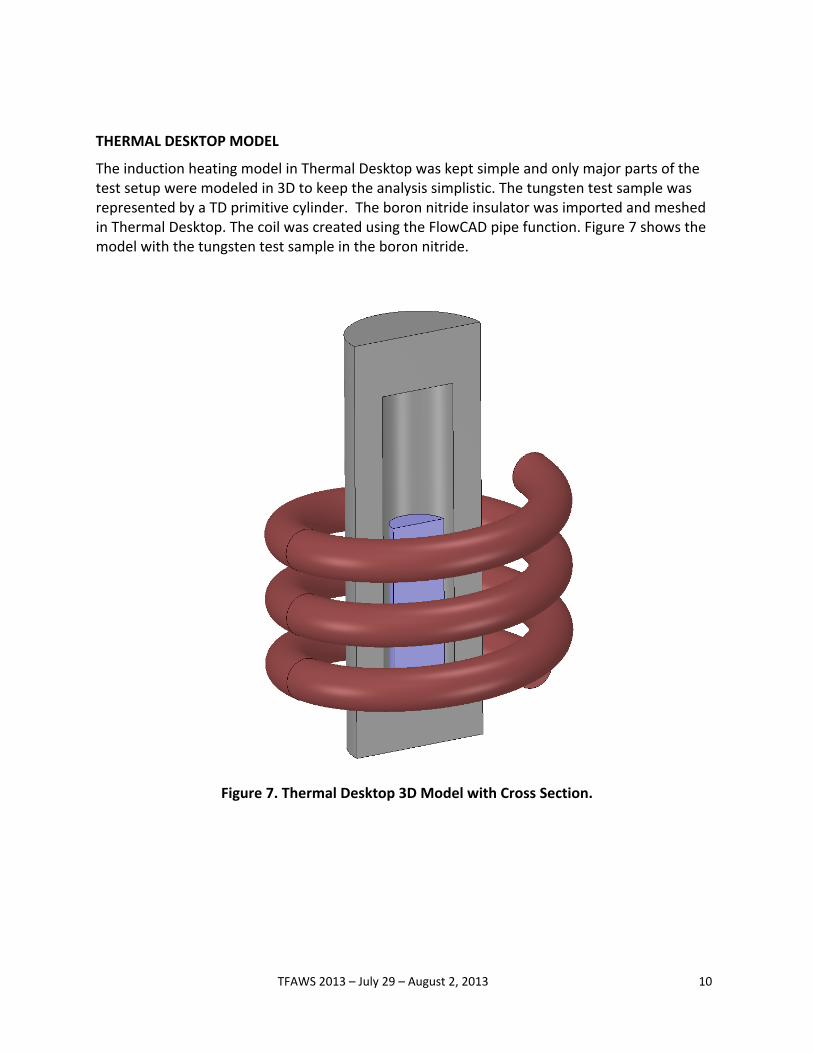
The induction heating model in Thermal Desktop was kept simple and only major parts of the test setup were modeled in 3D to keep the analysis simplistic. The tungsten test sample was represented by a TD primitive cylinder. The boron nitride insulator was imported and meshed in Thermal Desktop. The coil was created using the FlowCAD pipe function. Figure 7 shows the model with the tungsten test sample in the boron nitride.
Figure 7. Thermal Desktop 3D Model with Cross Section.
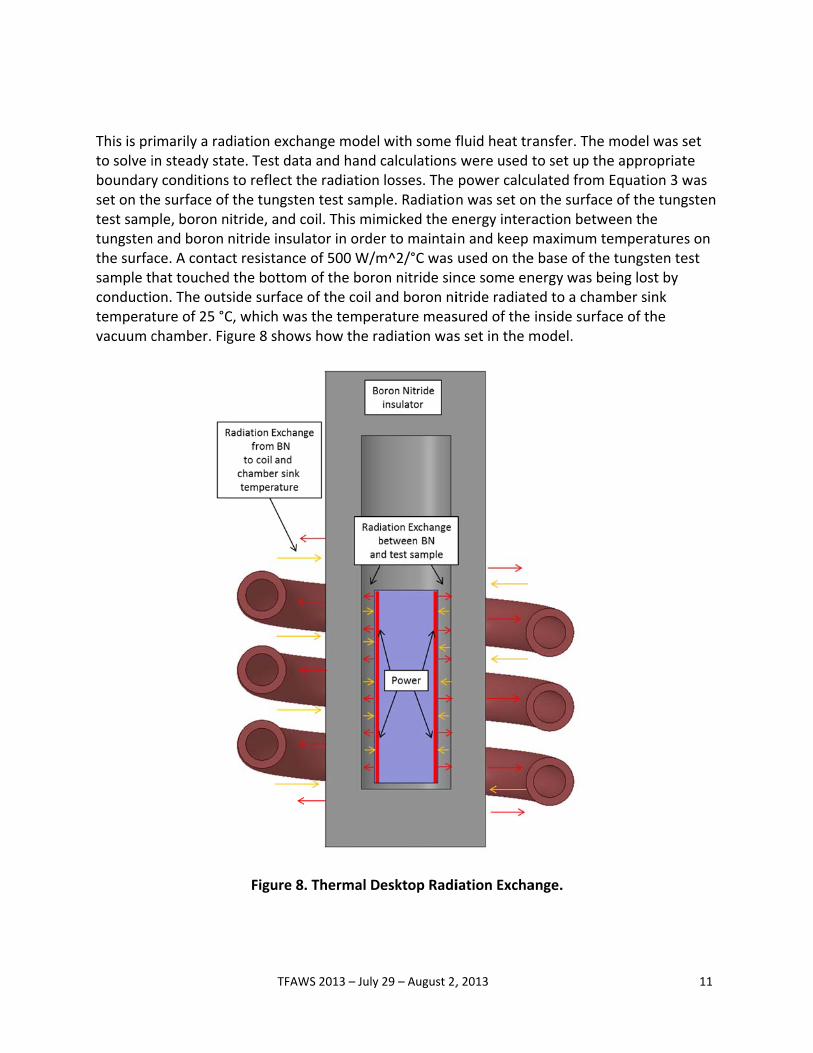
This is prto solve iboundaryset on thtest samtungstenthe surfasample tconductitemperatvacuum c
rimarily a radin steady stay conditionse surface ofple, boron nn and boron ace. A contachat touchedon. The outsture of 25 °Cchamber. Fig
TFAW
diation exchate. Test dats to reflect thf the tungstenitride, and cnitride insulct resistanced the bottomside surface C, which wasgure 8 show
Figure 8
WS 2013 – July
ange modela and hand he radiation en test sampcoil. This mimator in ordee of 500 W/mm of the boroof the coil as the temperws how the ra
. Thermal D
29 – August 2,
with some fcalculationslosses. The
ple. Radiationmicked the er to maintaim^2/°C was on nitride sinand boron nirature measadiation was
esktop Radi
, 2013
fluid heat trs were used tpower calcun was set onenergy interan and keep used on thence some enitride radiatesured of the s set in the m
iation Excha
ansfer. The to set up theulated from n the surfaceaction betwmaximum tee base of thenergy was beed to a chaminside surfamodel.
ange.
model was se appropriatEquation 3 we of the tungeen the emperaturee tungsten teeing lost by mber sink ce of the
11
set te was gsten
s on est
The coil wand flowof the floallowed hnitride ancoil prodsurface oresistivity
COMSOL
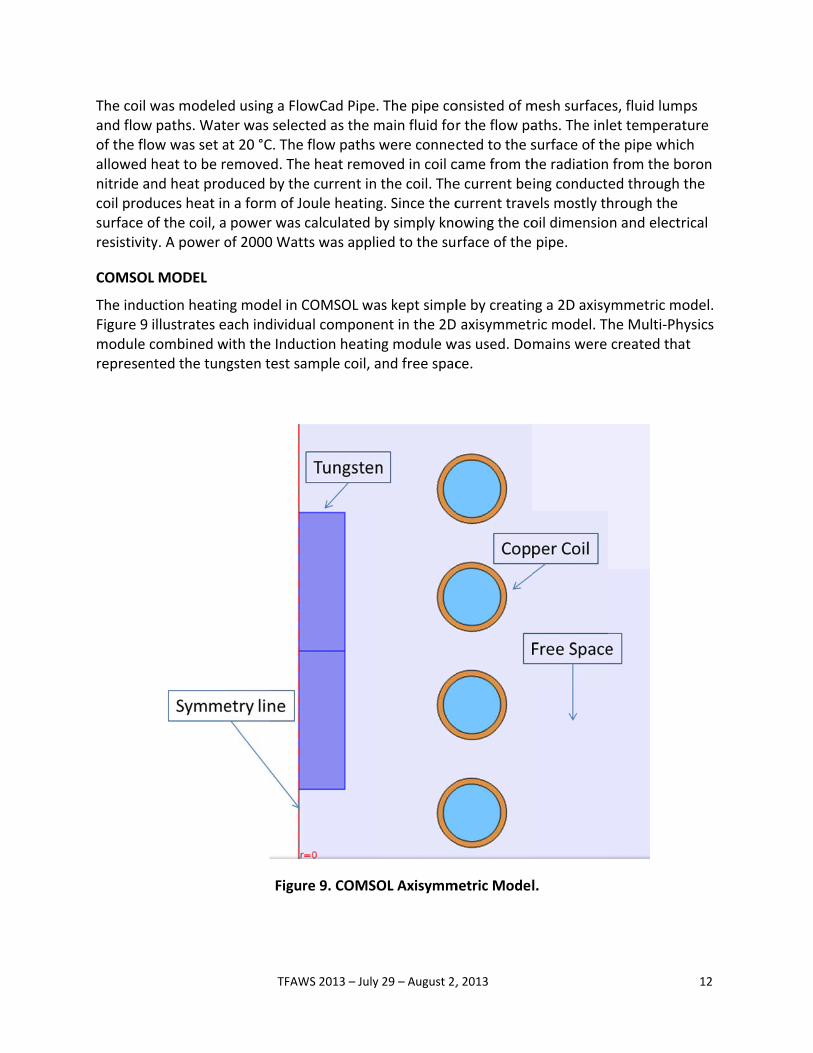
The induFigure 9 module crepresen
was modele paths. Wateow was set aheat to be rend heat produces heat inof the coil, a y. A power o
L MODEL
ction heatinillustrates eacombined wnted the tung
TFAW
d using a Floer was selecat 20 °C. The emoved. Theduced by then a form of Jopower was of 2000 Watt
ng model in Cach individuith the Indugsten test sa
Figur
WS 2013 – July
owCad Pipe. cted as the mflow paths we heat remoe current in oule heatingcalculated bts was applie
COMSOL waal componection heatinample coil, a
re 9. COMSO
29 – August 2,
The pipe comain fluid forwere connecoved in coil cthe coil. Theg. Since the cby simply knoed to the su
s kept simplnt in the 2Dg module wand free spac
OL Axisymm
, 2013
onsisted of mr the flow pacted to the scame from the current becurrent traveowing the corface of the
le by creatin axisymmetr
was used. Doce.
metric Model
mesh surfaceaths. The inlsurface of thhe radiationing conductels mostly thoil dimensiopipe.
ng a 2D axisyric model. Tmains were
l.
es, fluid lumpet temperathe pipe whic from the boed through through the n and electr
ymmetric mohe Multi‐Phycreated tha
12
ps ture ch oron the
rical
odel. ysics t
TFAWS 2013 – July 29 – August 2, 2013 13
The COMSOL model uses an expanded version of the energy equation that combines features from magnetic fields in the time harmonic formulation with heat transfer for modeling induction and eddy current heating. The model was set as transient. The primary purpose of this model was to predict the total power being induced to the tungsten test sample by the magnetic field created by the coil design. This power was then compared to the hand calculations to demonstrate its accuracy.
The thermal physical and electrical properties were assigned to each domain that was being affected by induction. All properties used were based on the highest temperature reached during testing. Since the boron nitride insulator has no electrical resistance and a magnetic permeability equal to free space, it was completely ignored and does not affect the analysis. The only inputs required in COMSOL were current, frequency and time. These inputs are listed in Table 2 from the test data recorded. A current of 1569 Amps and a frequency 23.4 kHz were used. Since the model can only be set as transient, a time of 3000 seconds was used to achieve steady state conditions.
TFAWS 2013 – July 29 – August 2, 2013 14
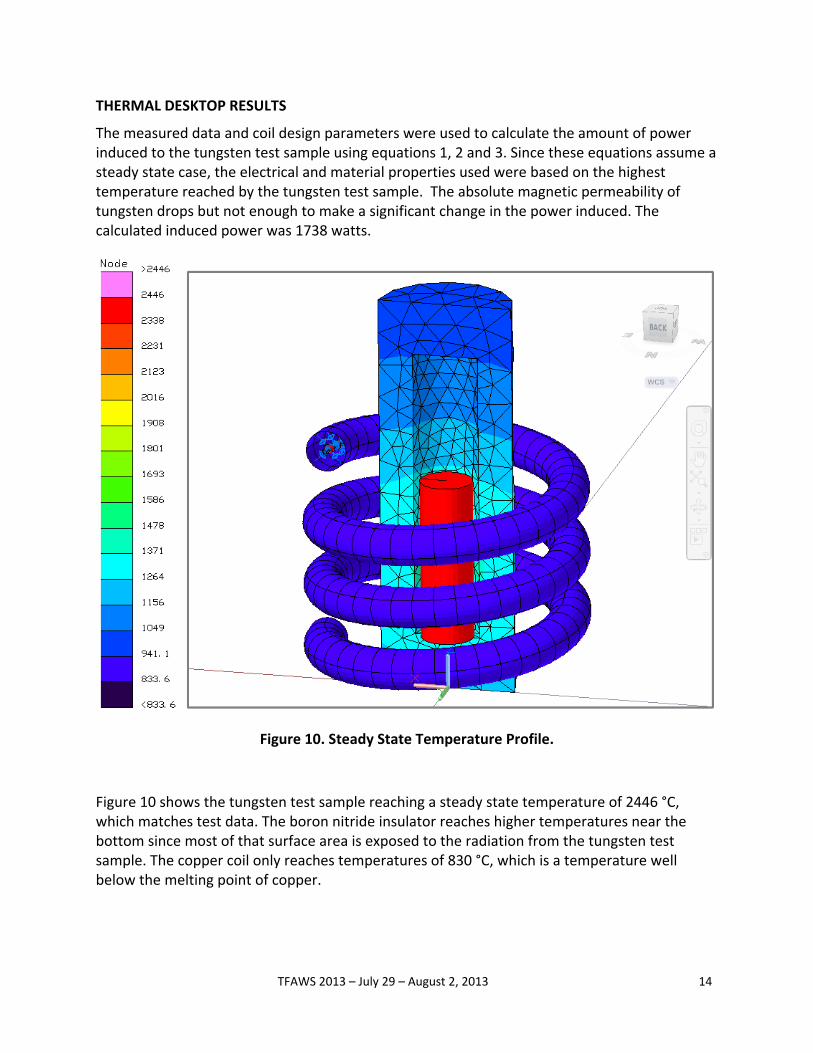
THERMAL DESKTOP RESULTS
The measured data and coil design parameters were used to calculate the amount of power induced to the tungsten test sample using equations 1, 2 and 3. Since these equations assume a steady state case, the electrical and material properties used were based on the highest temperature reached by the tungsten test sample. The absolute magnetic permeability of tungsten drops but not enough to make a significant change in the power induced. The calculated induced power was 1738 watts.
Figure 10. Steady State Temperature Profile.
Figure 10 shows the tungsten test sample reaching a steady state temperature of 2446 °C, which matches test data. The boron nitride insulator reaches higher temperatures near the bottom since most of that surface area is exposed to the radiation from the tungsten test sample. The copper coil only reaches temperatures of 830 °C, which is a temperature well below the melting point of copper.
TFAWS 2013 – July 29 – August 2, 2013 15
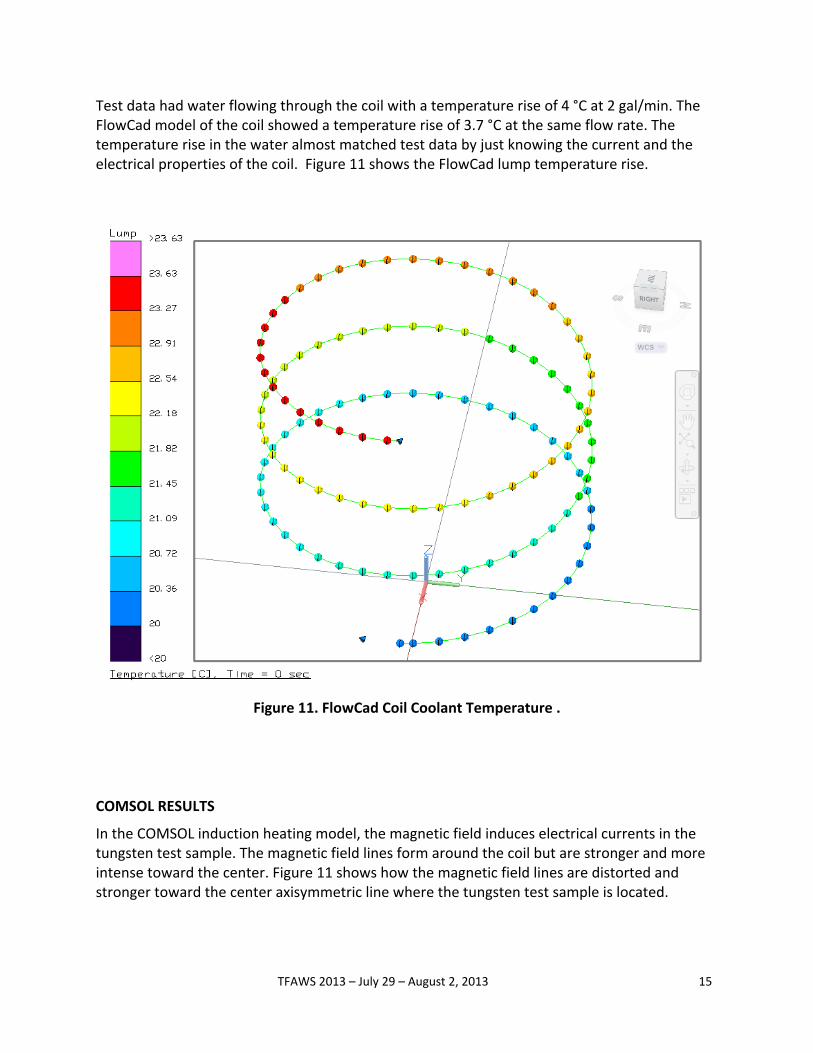
Test data had water flowing through the coil with a temperature rise of 4 °C at 2 gal/min. The FlowCad model of the coil showed a temperature rise of 3.7 °C at the same flow rate. The temperature rise in the water almost matched test data by just knowing the current and the electrical properties of the coil. Figure 11 shows the FlowCad lump temperature rise.
Figure 11. FlowCad Coil Coolant Temperature .
COMSOL RESULTS
In the COMSOL induction heating model, the magnetic field induces electrical currents in the tungsten test sample. The magnetic field lines form around the coil but are stronger and more intense toward the center. Figure 11 shows how the magnetic field lines are distorted and stronger toward the center axisymmetric line where the tungsten test sample is located.
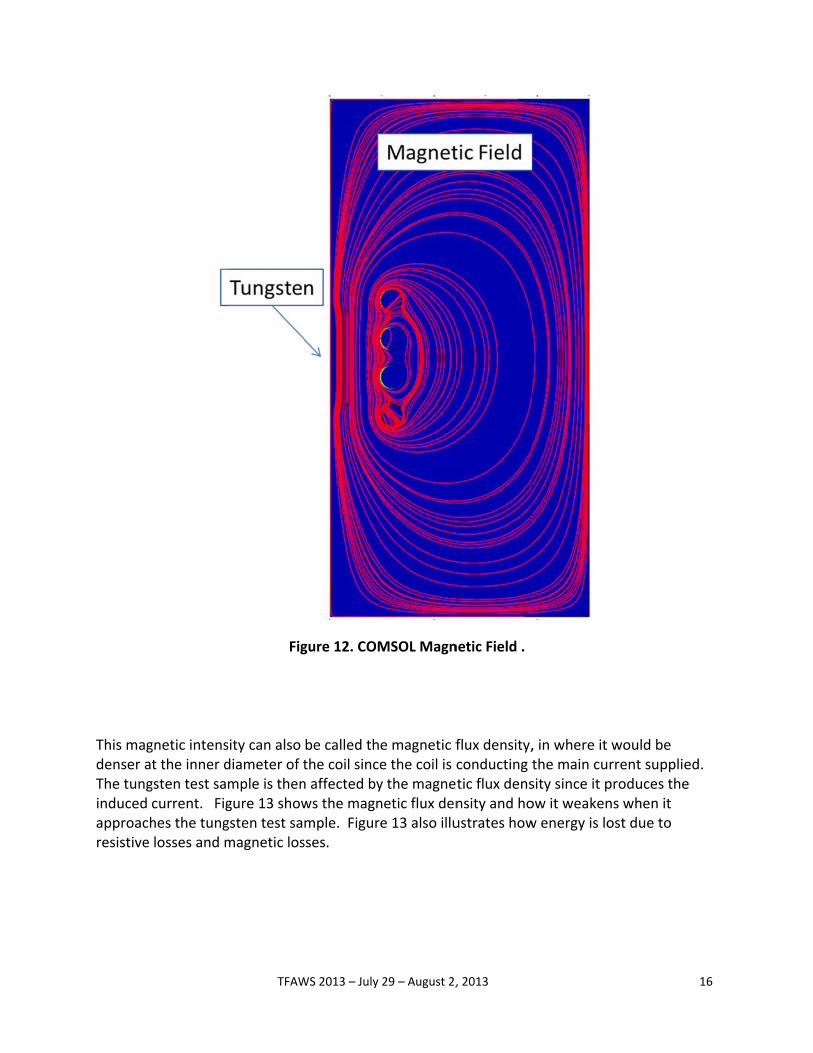
This magdenser atThe tunginduced approachresistive
gnetic intenst the inner dgsten test samcurrent. Fighes the tunglosses and m
TFAW
Fig
sity can also diameter of tmple is thengure 13 showgsten test samagnetic los
WS 2013 – July
gure 12. COM
be called ththe coil sincen affected byws the magnmple. Figursses.
29 – August 2,
MSOL Magn
e magnetic fe the coil is cy the magnenetic flux dene 13 also illu
, 2013
netic Field .
flux density,conducting ttic flux densnsity and houstrates how
, in where it the main cusity since it pow it weakenw energy is lo
would be rrent supplieproduces thens when it ost due to
16
ed. e
TFAWS 2013 – July 29 – August 2, 2013 17
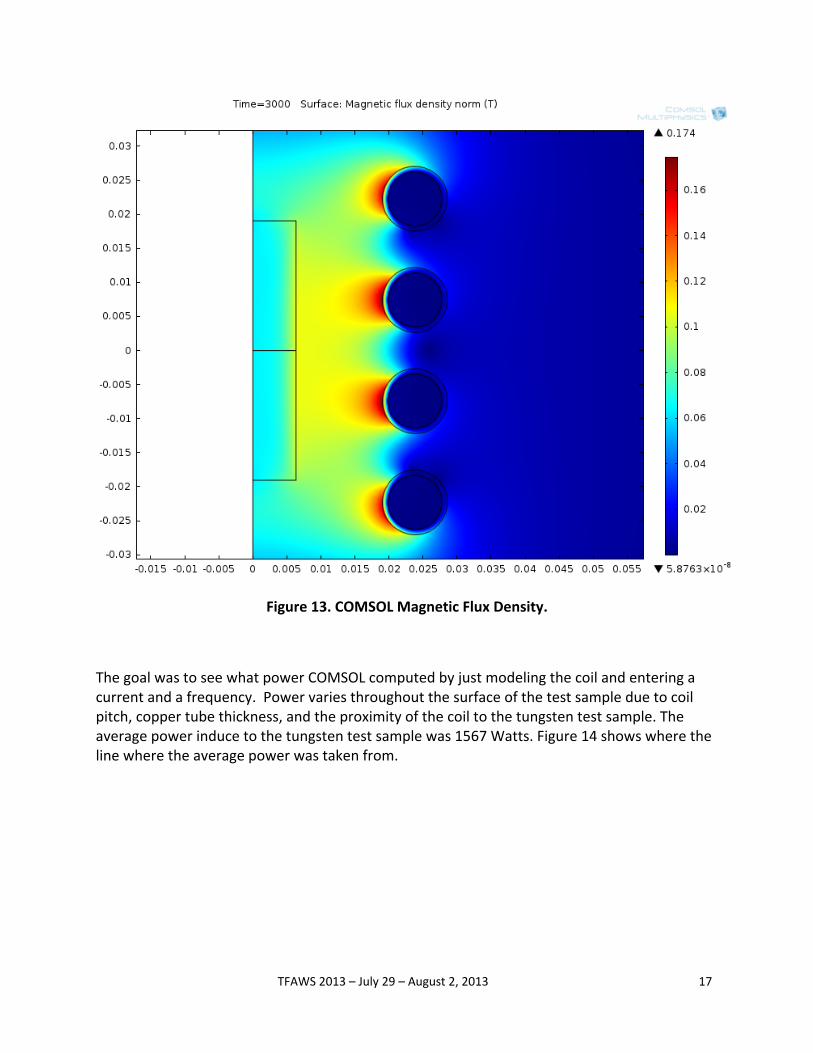
Figure 13. COMSOL Magnetic Flux Density.
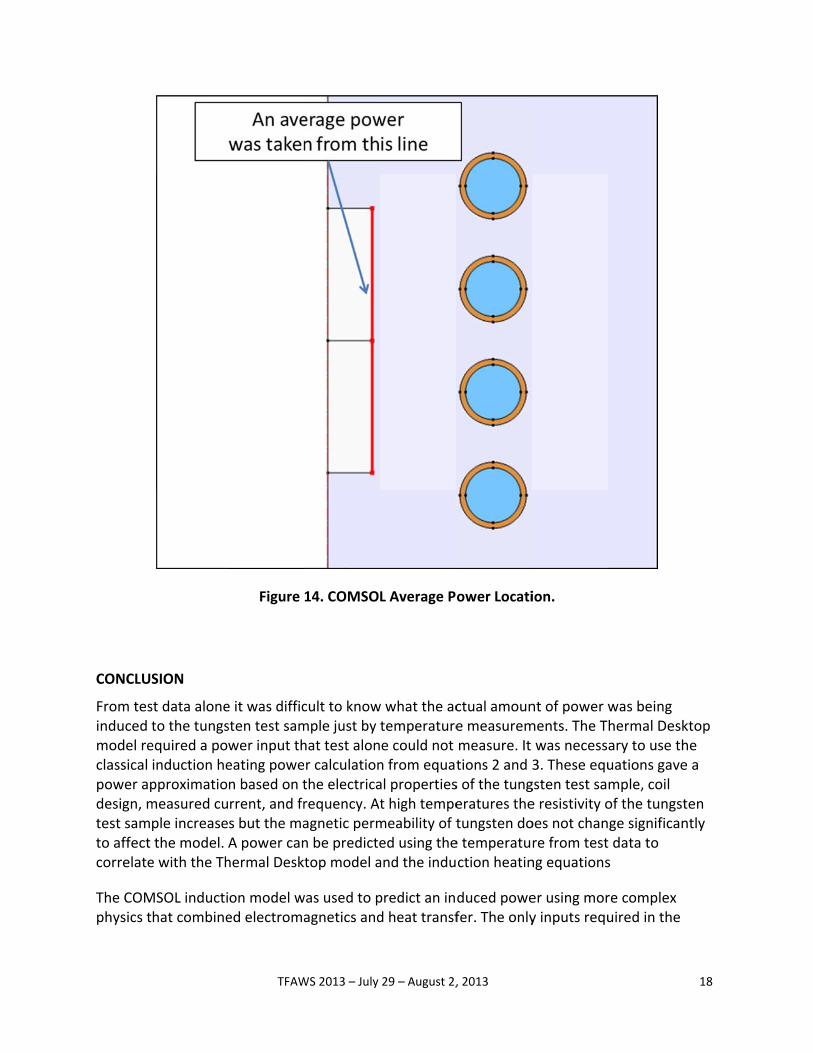
The goal was to see what power COMSOL computed by just modeling the coil and entering a current and a frequency. Power varies throughout the surface of the test sample due to coil pitch, copper tube thickness, and the proximity of the coil to the tungsten test sample. The average power induce to the tungsten test sample was 1567 Watts. Figure 14 shows where the line where the average power was taken from.
CONCLUS
From tesinduced tmodel reclassical power apdesign, mtest samto affect correlate
The COMphysics t
SION
st data aloneto the tungsequired a poinduction hepproximatiomeasured cuple increasethe model. e with the Th
MSOL inductihat combine
TFAW
Figure
e it was difficsten test samwer input theating powen based on trrent, and frs but the maA power canhermal Desk
on model wed electroma
WS 2013 – July
14. COMSO
cult to knowmple just by hat test alonr calculationthe electricarequency. Atagnetic permn be predictetop model a
was used to pagnetics and
29 – August 2,
L Average P
w what the actemperaturee could not n from equatal propertiest high tempemeability of ted using theand the indu
predict an ind heat transf
, 2013
ower Locati
ctual amoune measuremmeasure. It tions 2 and 3s of the tungeratures thetungsten doe temperatuction heatin
duced powefer. The only
ion.
nt of power wments. The Twas necess3. These equgsten test sae resistivity ooes not chanre from testng equations
er using mory inputs requ
was being hermal Deskary to use thuations gavemple, coil of the tungstge significan data to s
re complex uired in the
18
ktop he e a
ten ntly
TFAWS 2013 – July 29 – August 2, 2013 19
model were current and frequency. The same approach was taken from what was learned in the Thermal Desktop model: the electrical resistivity of tungsten was increased while magnetic permeability was kept the same. The COMSOL model gave different power values that varied by the surface location of the tungsten test sample. This was due to the high magnetic flux densities based on coil loop, pitch and location. An average power was taken from the surface of the tungsten test sample and compared to the hand calculation.
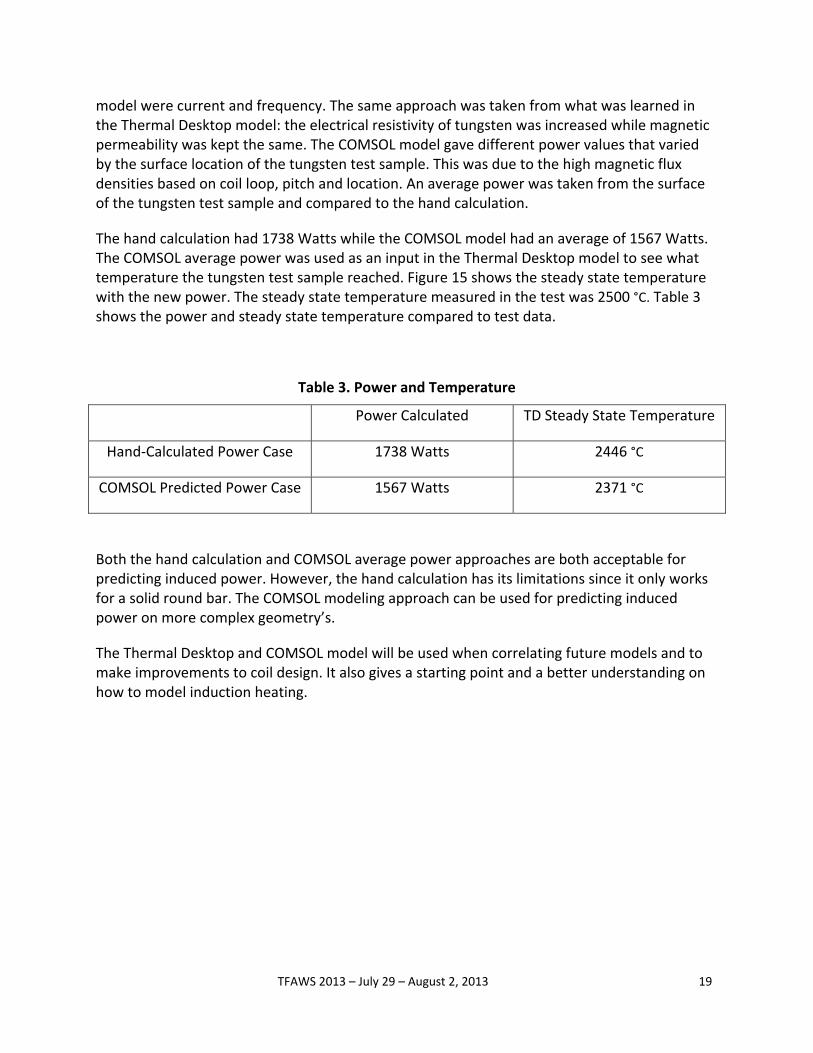
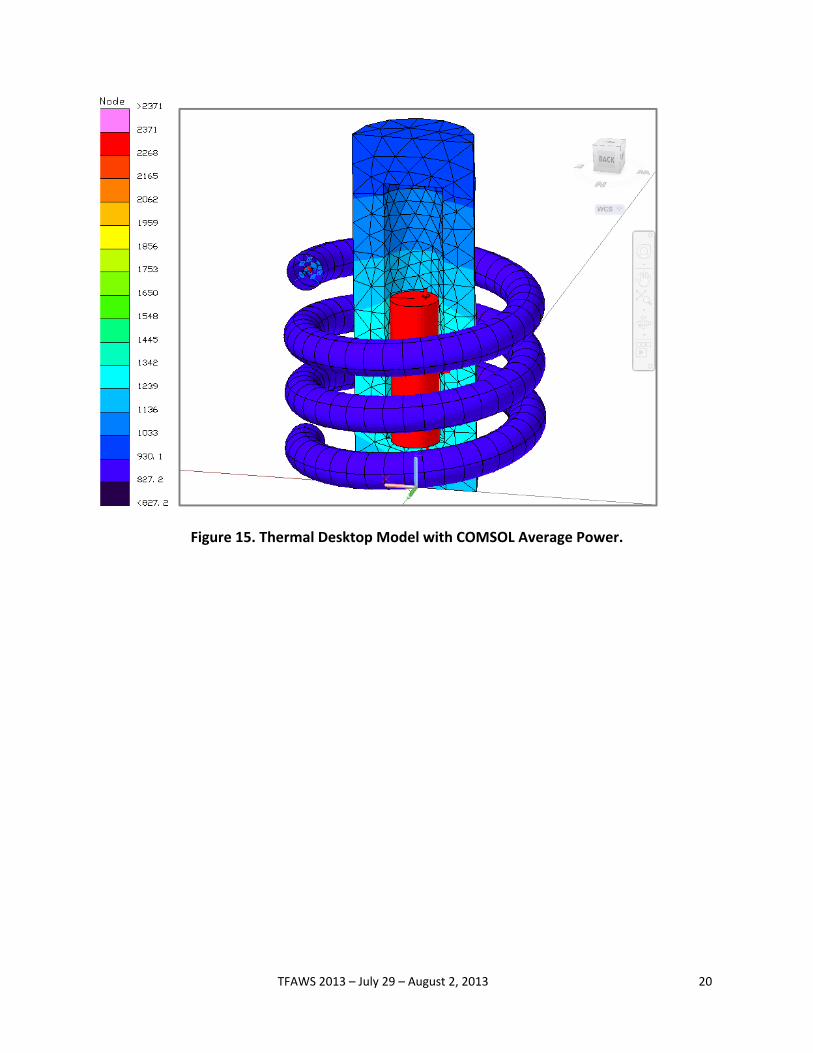
The hand calculation had 1738 Watts while the COMSOL model had an average of 1567 Watts. The COMSOL average power was used as an input in the Thermal Desktop model to see what temperature the tungsten test sample reached. Figure 15 shows the steady state temperature with the new power. The steady state temperature measured in the test was 2500 °C. Table 3 shows the power and steady state temperature compared to test data.
Table 3. Power and Temperature
Power Calculated TD Steady State Temperature
Hand‐Calculated Power Case 1738 Watts 2446 °C
COMSOL Predicted Power Case 1567 Watts 2371 °C
Both the hand calculation and COMSOL average power approaches are both acceptable for predicting induced power. However, the hand calculation has its limitations since it only works for a solid round bar. The COMSOL modeling approach can be used for predicting induced power on more complex geometry’s.
The Thermal Desktop and COMSOL model will be used when correlating future models and to make improvements to coil design. It also gives a starting point and a better understanding on how to model induction heating.
TFAWS 2013 – July 29 – August 2, 2013 20
Figure 15. Thermal Desktop Model with COMSOL Average Power.

TFAWS 2013 – July 29 – August 2, 2013 21
NOMENCLATURE
σ, electrical conductivity
ρ, electrical resistivity
, relative magnetic permeability
μ, absolute magnetic permeability
ω, angular frequency
d, penetration depth
D, bar diameter
L, bar length
Kr, electrical path factor
N, number of turns of coil
, equivalent resistance of work piece
Ic, current in coil
, Power equivalent on work piece
AC, alternating current
SS, steady state
BN, boron Nitride
TD, thermal desktop

TFAWS 2013 – July 29 – August 2, 2013 22
BIBLIOGRAPHY
Semiatin, S., & Zinn, S. (1998). Elements of Induction Heating. Carnes Publications.
Rudnev, V., Loveless, D., Cook, R., & Black, M. (2003). Handbook of Induction Heating. Marcel Dekker.
Top Related