


Languages
Pages
Legal

INDIANA UNIVERSITY PURDUE UNIVERSITY -
INDIANAPOLIS CARBON FOOTPRINT
4/10/2009 Greenhouse Gas (GHG) Report for IUPUI Campus
This report provides the Carbon Footprint for the Indiana University Purdue
University – Indianapolis (IUPUI) Campus. Contained herein are the calculated
greenhouse gas (GHG) emissions for the IUPUI campus from July 2007 to June 2008
and recommendations to administrators, faculty, and students to reduce the carbon
footprint for IUPUI. Team Members: Dan Martin, Hai Hong, Youssef Sayah
Indiana University Purdue University - Indianapolis Carbon Footprint
Page 1
Table of Contents
INTRODUCTION ................................................................................................................... 2 What is a carbon footprint? ................................................................................................................... 2 What is carbon?........................................................................................................................................ 3 What are greenhouse gases (GHG)? .................................................................................................. 4
EMISSION FACTORS ............................................................................................................ 5 Normalized Emission Factors .................................................................................................................. 5 Emissions – Site & Source ........................................................................................................................ 6 IUPUI Campus ............................................................................................................................................ 6
CARBON FOOTPRINT .......................................................................................................... 7 Direct Emission Sources ............................................................................................................................ 7 Imported Indirect Emission Sources ........................................................................................................ 7 Outside Indirect Emission Sources .......................................................................................................... 8
Commuting to and from campus ......................................................................................................... 8 Travel ....................................................................................................................................................... 8 Wastewater ............................................................................................................................................ 8
Analysis of Data ....................................................................................................................................... 8 Total CO2 Emissions at IUPUI ............................................................................................................... 9 Total CO2 Emission by Category ....................................................................................................... 9 Total CO2 Emissions by Scope ............................................................................................................ 9 Demographic Emissions Summary .................................................................................................... 10 Energy Use by Sector ........................................................................................................................ 12 Demographic Energy Use Summary ................................................................................................ 13
WE KNOW WHERE WE’RE AT, WE KNOW WHERE WE WANT TO BE .................................. 14 How do we get there ............................................................................................................................ 14
HVAC and Lighting ............................................................................................................................. 14 Transportation ..................................................................................................................................... 15 Individuals ............................................................................................................................................ 15 Join the ACUPPC ................................................................................................................................. 15
CLOSING THOUGHTS ........................................................................................................ 16
WORKS CITED .................................................................................................................... 17
Indiana University Purdue University - Indianapolis Carbon Footprint
Page 2
Indiana University Purdue University - Indianapolis Carbon Footprint I T S T I M E T O C L E A N - U P T H E J U N G L E
INTRODUCTION Research has recently began to prove the theories by the world’s leading scientists that greenhouse gases (GHG) do have a negative impact upon our environment and is a leading contributor to climate change. As such, public opinion has swayed as we realize our responsibility as custodians of this world that we have reached a critical point in human history that we must either reduce carbon dioxide (CO2) emissions drastically over our lifetimes or we will risk permanently altering the atmosphere of our planet.
This report, which began as a simple class project to compute the CO2 footprint at IUPUI, has grown into a mission statement for each of us that are members of the IUPUI community and ask that we individually and collectively look at our impact on the environment as that we are all contributors to the emission of greenhouse gases.
This report, while filled with well intensions, should be considered a rough draft and a prelude for the campus to commission a comprehensive inventory of all greenhouse gas emissions. It is the wish of the authors of this report that IUPUI will adopt an action plan in the near future to work toward becoming climate neutral.
In researching for this report, we found that a number of universities and colleges have prepared similar reports to ours computing the carbon footprint for their respective institution. In looking for a template to go by, we felt the University of Pennsylvania’s Carbon Footprint report was the most comprehensive. The University of Pennsylvania’s report relied heavily on the Clean Air/Cool Planet Campus Carbon Calculator to organize and calculate the emission factors. This report was arranged under the same metrics. (Clean Air - Cool Planet )As such to wish to acknowledge the outstanding work of the professors and students of the University Of Pennsylvania School Of Design and that we modeled this report after theirs. (Braham, Malkawi and Martin)
What is a carbon footprint? A carbon footprint is a measure of the impact our activities have on the environment, and in particular climate change. It relates to the amount of greenhouse gases produced in our day-to-day lives through the burning of fossil fuels for, including but not limited to, electricity, heating, and transportation. (Carbon Footprint, Ltd)
Indiana University Purdue University - Indianapolis Carbon Footprint
Page 3
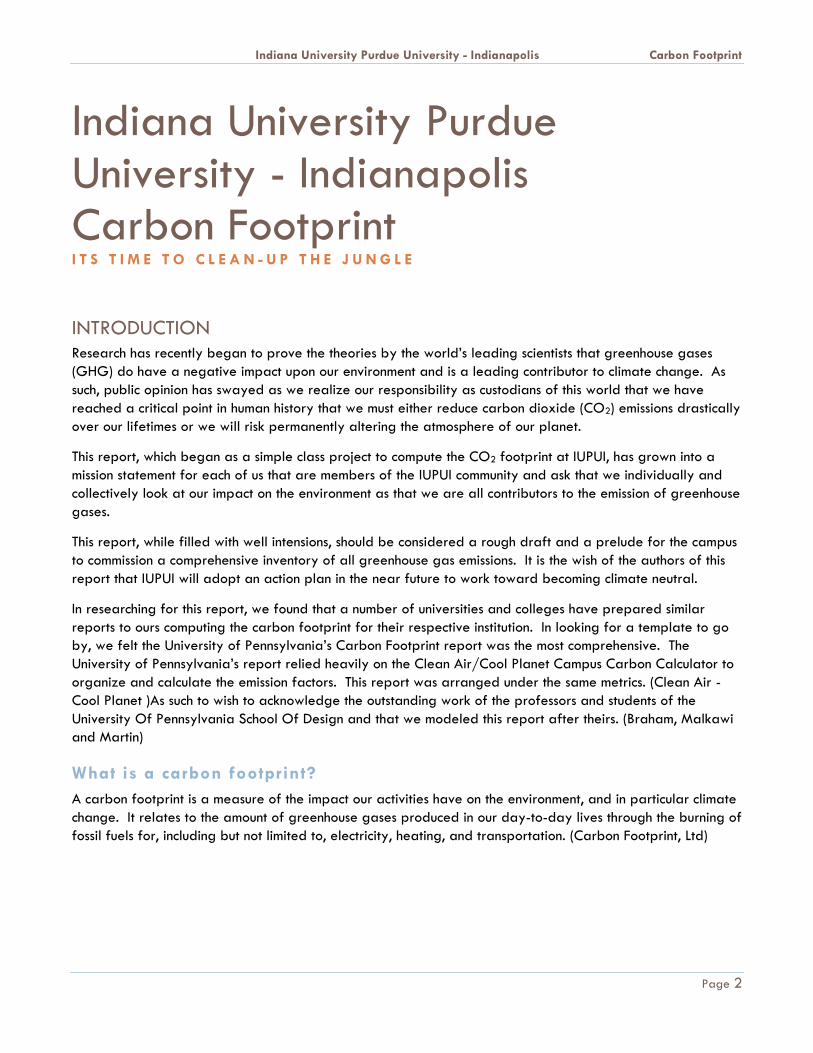
FIGURE 1- MAIN ELEMENTS OF CO2 FOOTPRINT (CARBON FOOTPRINT, LTD)
As shown in the above chart, we each have two basic metrics to our carbon footprint, primary (green) and secondary (yellow). The primary footprint is the CO2 emissions resulting from the burning of fossil fuels, such as heating, lighting, transportation. The secondary footprint is based upon the manufacturing of products we buy and/or use which resulted in the emission of CO2. (Carbon Footprint, Ltd)
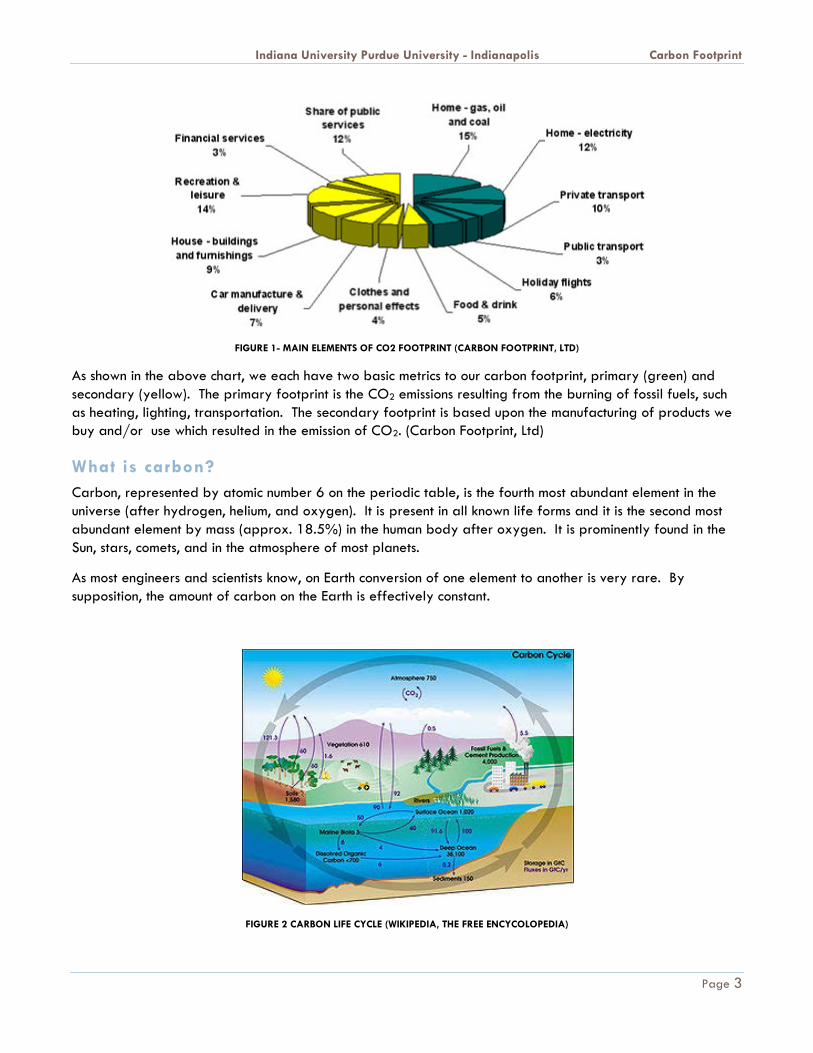
What is carbon? Carbon, represented by atomic number 6 on the periodic table, is the fourth most abundant element in the universe (after hydrogen, helium, and oxygen). It is present in all known life forms and it is the second most abundant element by mass (approx. 18.5%) in the human body after oxygen. It is prominently found in the Sun, stars, comets, and in the atmosphere of most planets.
As most engineers and scientists know, on Earth conversion of one element to another is very rare. By supposition, the amount of carbon on the Earth is effectively constant.
FIGURE 2 CARBON LIFE CYCLE (WIKIPEDIA, THE FREE ENCYCOLOPEDIA)
Indiana University Purdue University - Indianapolis Carbon Footprint
Page 4
While there are several types of compounds that carbon is found in; organic, inorganic, and organometellic. In organic compounds, when carbon is combined with hydrogen it forms what is called a hydrocarbon. Hydrocarbons form fossil fuels, which when burned are oxidized to carbon dioxide (CO2) and water. The contribution of CO2 into the atmosphere is one of the greenhouse gasses (GHG) that enhance radiative forcing whih contributes to climate change. Hydrocarbons are also used in production of refrigerants, lubricants, solvents and used as chemical feedstock for the manufacture of plastics and petrochemicals.
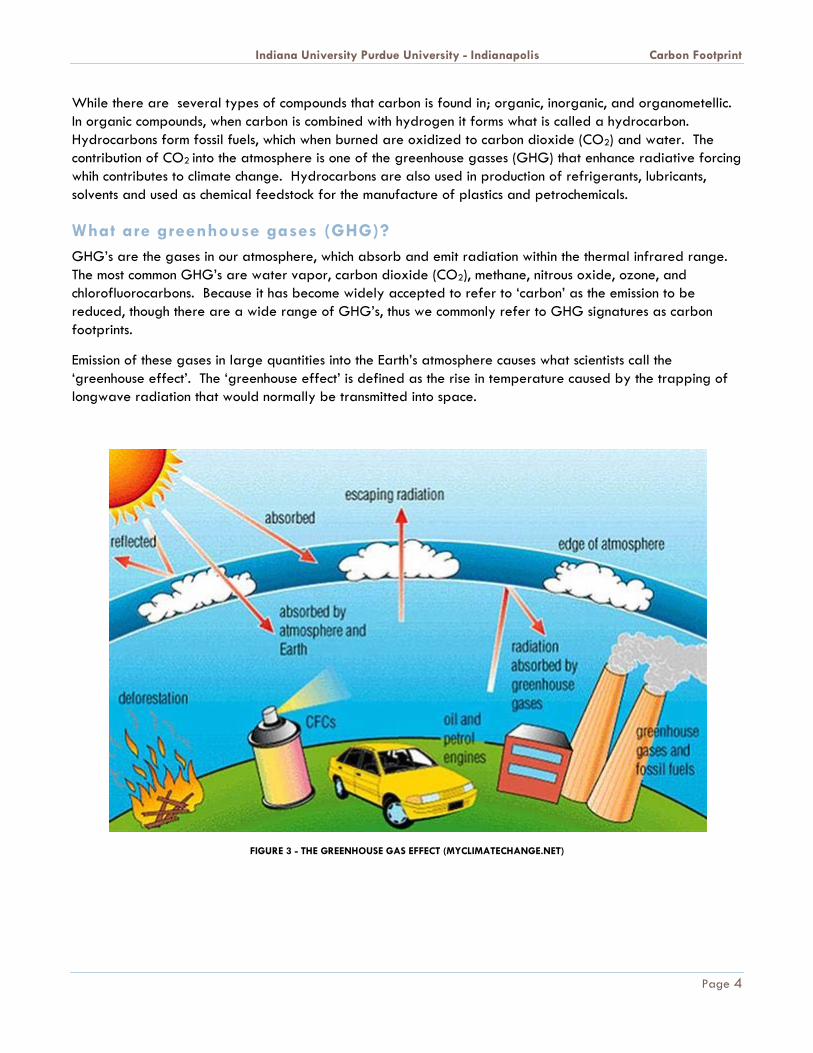
What are greenhouse gases (GHG)? GHG’s are the gases in our atmosphere, which absorb and emit radiation within the thermal infrared range. The most common GHG’s are water vapor, carbon dioxide (CO2), methane, nitrous oxide, ozone, and chlorofluorocarbons. Because it has become widely accepted to refer to ‘carbon’ as the emission to be reduced, though there are a wide range of GHG’s, thus we commonly refer to GHG signatures as carbon footprints.
Emission of these gases in large quantities into the Earth’s atmosphere causes what scientists call the ‘greenhouse effect’. The ‘greenhouse effect’ is defined as the rise in temperature caused by the trapping of longwave radiation that would normally be transmitted into space.
FIGURE 3 - THE GREENHOUSE GAS EFFECT (MYCLIMATECHANGE.NET)
Indiana University Purdue University - Indianapolis Carbon Footprint
Page 5
EMISSION FACTORS The team members at the University of Pennsylvania (Penn) broke their GHG emissions into three categories:
1. Direct – GHG sources that are owned or controlled by the university (e.g. production of electricity, heat, steam, transportation, products, waste, community members, and unintentional leaks)
2. Imported Indirect – Imported GHG sources (e.g. electricity, heat, or steam purchased from utility)
3. Outside Indirect – GHG sources that occur as the result of the university, but are owned or controlled by another entity (e.g. business travel, commuting to and from campus, outsourced activities and contracts, and waste emissions – such as methane emissions from landfill)
In breaking down the GHG emissions by IUPUI, we combined Direct and Imported Indirect into one analysis and the Outside Indirect into the other. We also found the same challenge that that the Penn team members did in that different forms of emissions had different units of usage. As such, we normalized the usage of carbon into basic units.123
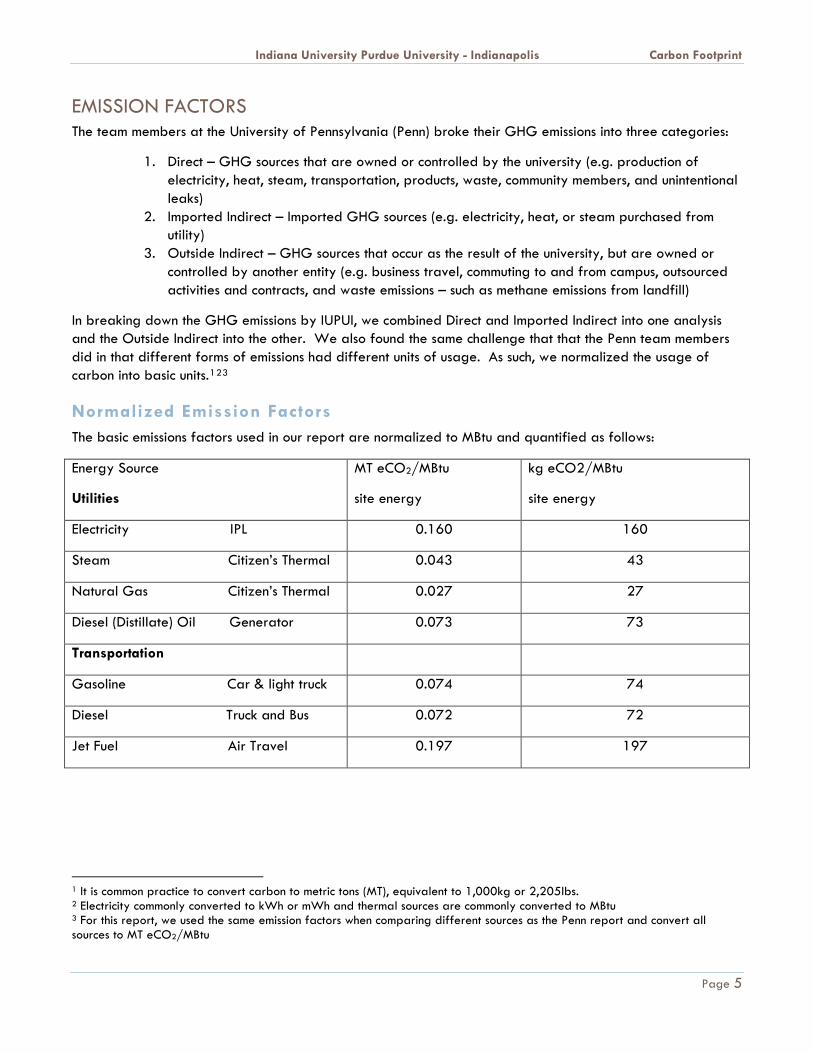
Normalized Emission Factors The basic emissions factors used in our report are normalized to MBtu and quantified as follows:
Energy Source
Utilities
MT eCO2/MBtu
site energy
kg eCO2/MBtu
site energy
Electricity IPL 0.160 160
Steam Citizen’s Thermal 0.043 43
Natural Gas Citizen’s Thermal 0.027 27
Diesel (Distillate) Oil Generator 0.073 73
Transportation
Gasoline Car & light truck 0.074 74
Diesel Truck and Bus 0.072 72
Jet Fuel Air Travel 0.197 197
1 It is common practice to convert carbon to metric tons (MT), equivalent to 1,000kg or 2,205lbs. 2 Electricity commonly converted to kWh or mWh and thermal sources are commonly converted to MBtu 3 For this report, we used the same emission factors when comparing different sources as the Penn report and convert all sources to MT eCO2/MBtu
Indiana University Purdue University - Indianapolis Carbon Footprint
Page 6
Emissions – Site & Source It is important to note that there is a difference between energy that we use on campus (site) vs. the energy that is used at the utility provide (source). ‘Site’ emissions are generated by the energy consumed when it is delivered at the building or end-user. ‘Source’ emissions that are the produce of fuels burned at the plant or utility in order to provide the utility service (e.g. water, natural gas, electricity, steam, etc.). (Braham, Malkawi and Martin)
The reason tracking this information is important is to compute the inefficiencies of the utility provider (e.g. transmission losses in wire, losses from process piping, etc) which are inherent to utility transmission. Improving the transmission process is an important part of GHG reduction. For example; electricity looses 60-70% of the initial fuel value to waste heat. So for every unit of electricity used, approximately three units of emissions are produced. Basically it is like giving someone a dollar or a quarter.
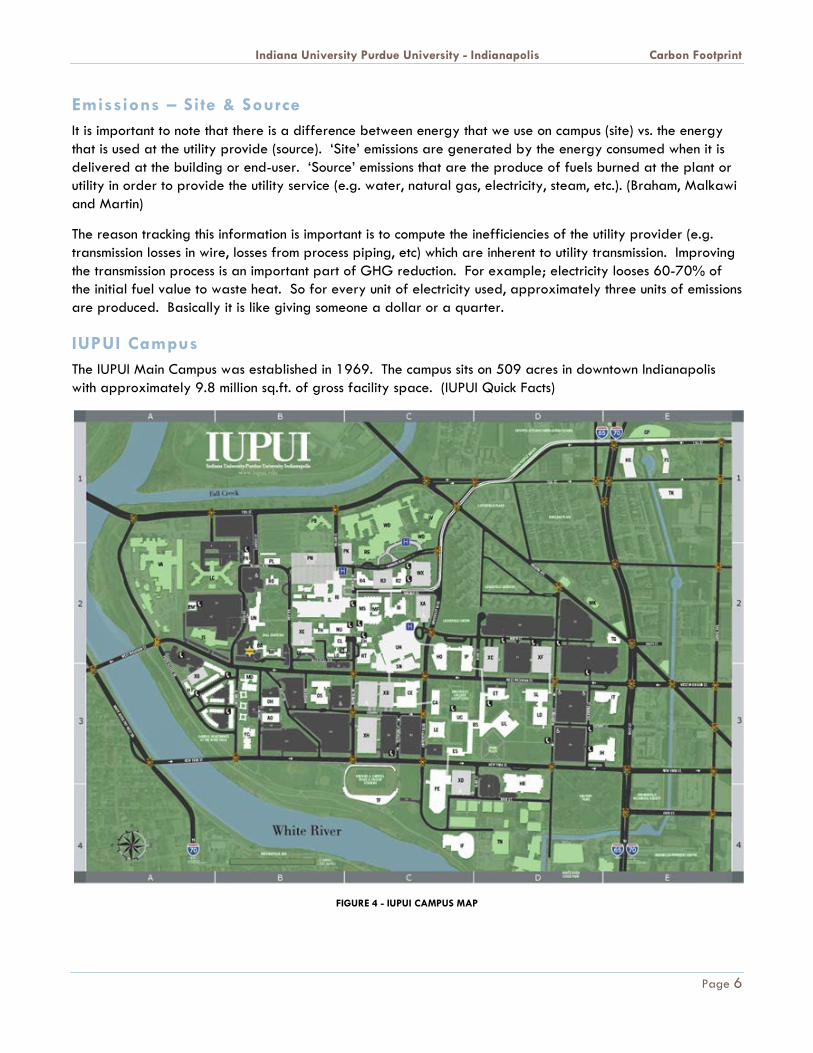
IUPUI Campus The IUPUI Main Campus was established in 1969. The campus sits on 509 acres in downtown Indianapolis with approximately 9.8 million sq.ft. of gross facility space. (IUPUI Quick Facts)
FIGURE 4 - IUPUI CAMPUS MAP
Indiana University Purdue University - Indianapolis Carbon Footprint
Page 7
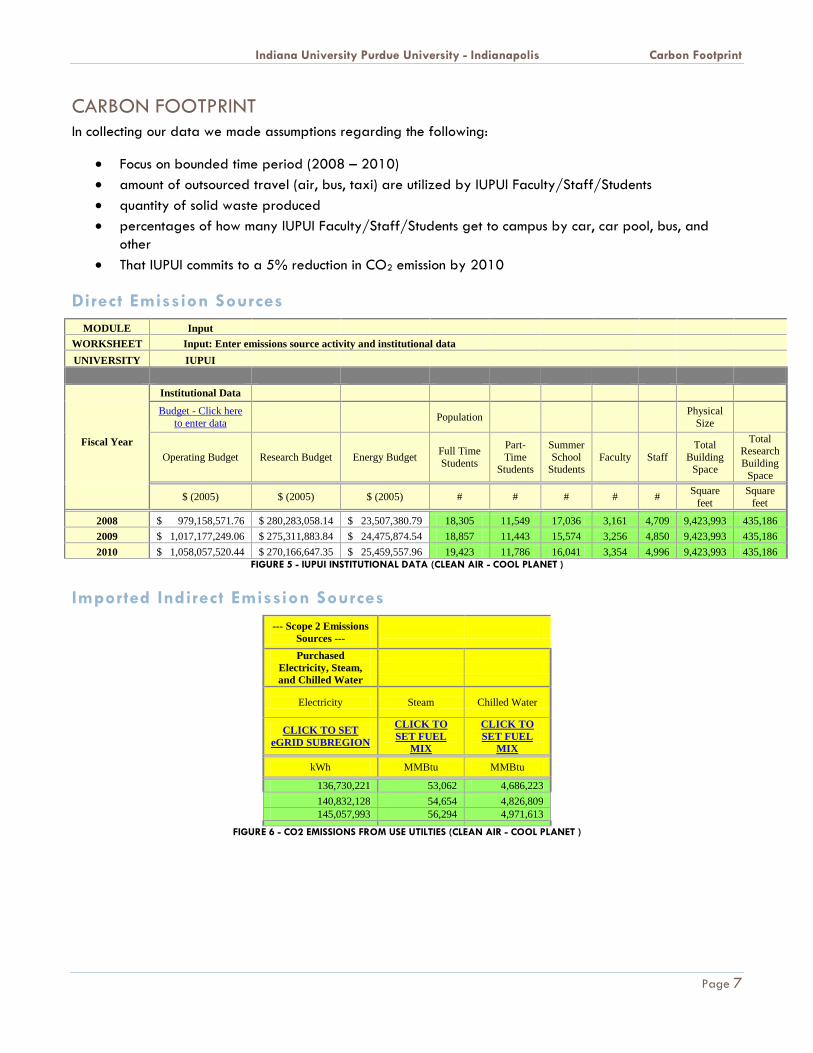
CARBON FOOTPRINT In collecting our data we made assumptions regarding the following:
• Focus on bounded time period (2008 – 2010) • amount of outsourced travel (air, bus, taxi) are utilized by IUPUI Faculty/Staff/Students • quantity of solid waste produced • percentages of how many IUPUI Faculty/Staff/Students get to campus by car, car pool, bus, and
other • That IUPUI commits to a 5% reduction in CO2 emission by 2010
Direct Emission Sources MODULE Input
WORKSHEET Input: Enter emissions source activity and institutional data UNIVERSITY IUPUI
Institutional Data
Fiscal Year
Budget - Click here to enter data Population
Physical Size
Operating Budget Research Budget Energy Budget Full Time Students
Part-Time
Students
Summer School
Students Faculty Staff
Total Building
Space
Total Research Building
Space
$ (2005) $ (2005) $ (2005) # # # # # Square feet
Square feet
2008 $ 979,158,571.76 $ 280,283,058.14 $ 23,507,380.79 18,305 11,549 17,036 3,161 4,709 9,423,993 435,186 2009 $ 1,017,177,249.06 $ 275,311,883.84 $ 24,475,874.54 18,857 11,443 15,574 3,256 4,850 9,423,993 435,186 2010 $ 1,058,057,520.44 $ 270,166,647.35 $ 25,459,557.96 19,423 11,786 16,041 3,354 4,996 9,423,993 435,186
FIGURE 5 - IUPUI INSTITUTIONAL DATA (CLEAN AIR - COOL PLANET )
Imported Indirect Emission Sources --- Scope 2 Emissions
Sources ---
Purchased Electricity, Steam, and Chilled Water
Electricity Steam Chilled Water
CLICK TO SET eGRID SUBREGION
CLICK TO SET FUEL
MIX
CLICK TO SET FUEL
MIX
kWh MMBtu MMBtu
136,730,221 53,062 4,686,223 140,832,128 54,654 4,826,809 145,057,993 56,294 4,971,613
FIGURE 6 - CO2 EMISSIONS FROM USE UTILTIES (CLEAN AIR - COOL PLANET )
Indiana University Purdue University - Indianapolis Carbon Footprint
Page 8
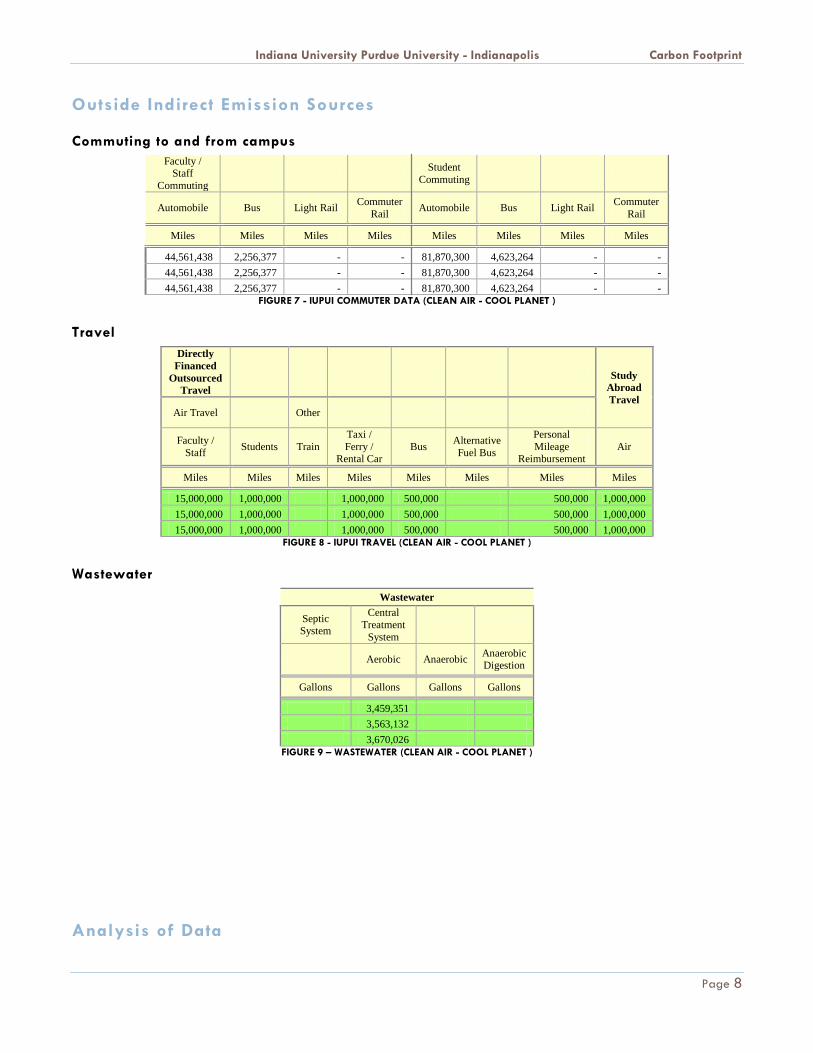
Outside Indirect Emission Sources
Commuting to and from campus Faculty /
Staff Commuting
Student Commuting
Automobile Bus Light Rail Commuter Rail Automobile Bus Light Rail Commuter
Rail
Miles Miles Miles Miles Miles Miles Miles Miles
44,561,438 2,256,377 - - 81,870,300 4,623,264 - - 44,561,438 2,256,377 - - 81,870,300 4,623,264 - - 44,561,438 2,256,377 - - 81,870,300 4,623,264 - -
FIGURE 7 - IUPUI COMMUTER DATA (CLEAN AIR - COOL PLANET )
Travel Directly
Financed Outsourced
Travel
Study Abroad Travel
Air Travel Other
Faculty / Staff Students Train
Taxi / Ferry /
Rental Car Bus Alternative
Fuel Bus
Personal Mileage
Reimbursement Air
Miles Miles Miles Miles Miles Miles Miles Miles
15,000,000 1,000,000 1,000,000 500,000 500,000 1,000,000 15,000,000 1,000,000 1,000,000 500,000 500,000 1,000,000 15,000,000 1,000,000 1,000,000 500,000 500,000 1,000,000
FIGURE 8 - IUPUI TRAVEL (CLEAN AIR - COOL PLANET )
Wastewater
Wastewater
Septic System
Central Treatment
System
Aerobic Anaerobic Anaerobic Digestion
Gallons Gallons Gallons Gallons
3,459,351 3,563,132 3,670,026
FIGURE 9 – WASTEWATER (CLEAN AIR - COOL PLANET )
Analysis of Data
Indiana University Purdue University - Indianapolis Carbon Footprint
Page 9
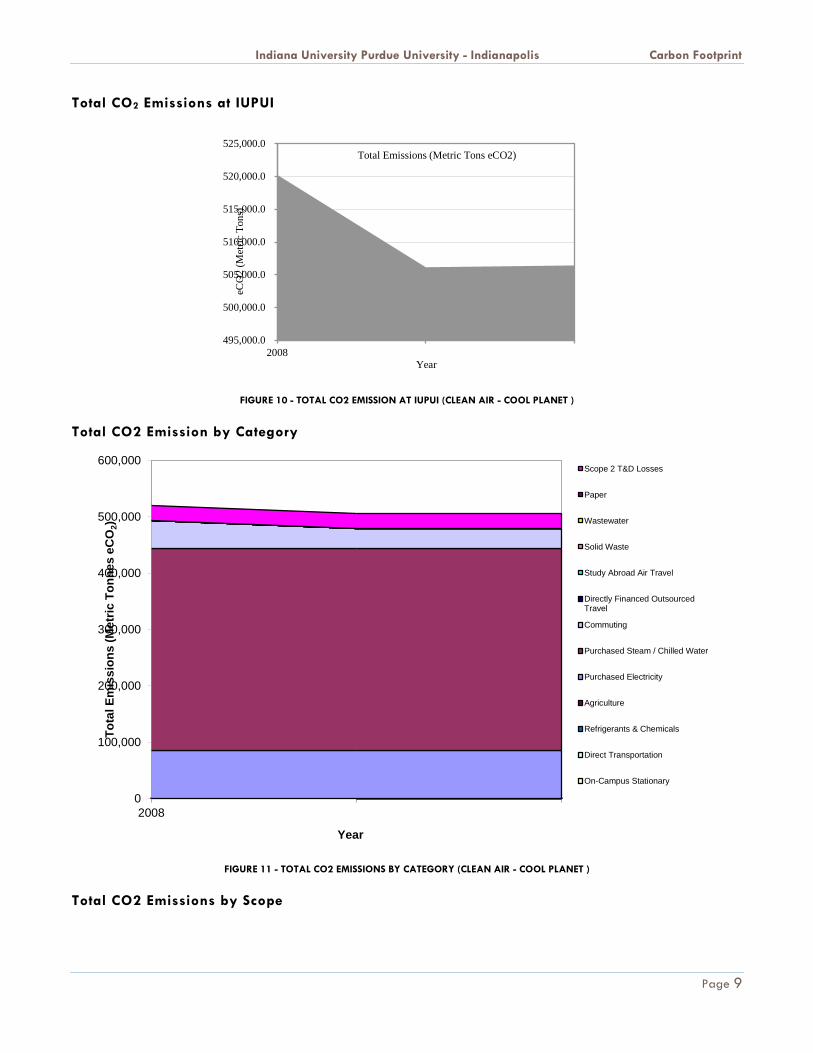
Total CO2 Emissions at IUPUI
FIGURE 10 - TOTAL CO2 EMISSION AT IUPUI (CLEAN AIR - COOL PLANET )
Total CO2 Emission by Category
FIGURE 11 - TOTAL CO2 EMISSIONS BY CATEGORY (CLEAN AIR - COOL PLANET )
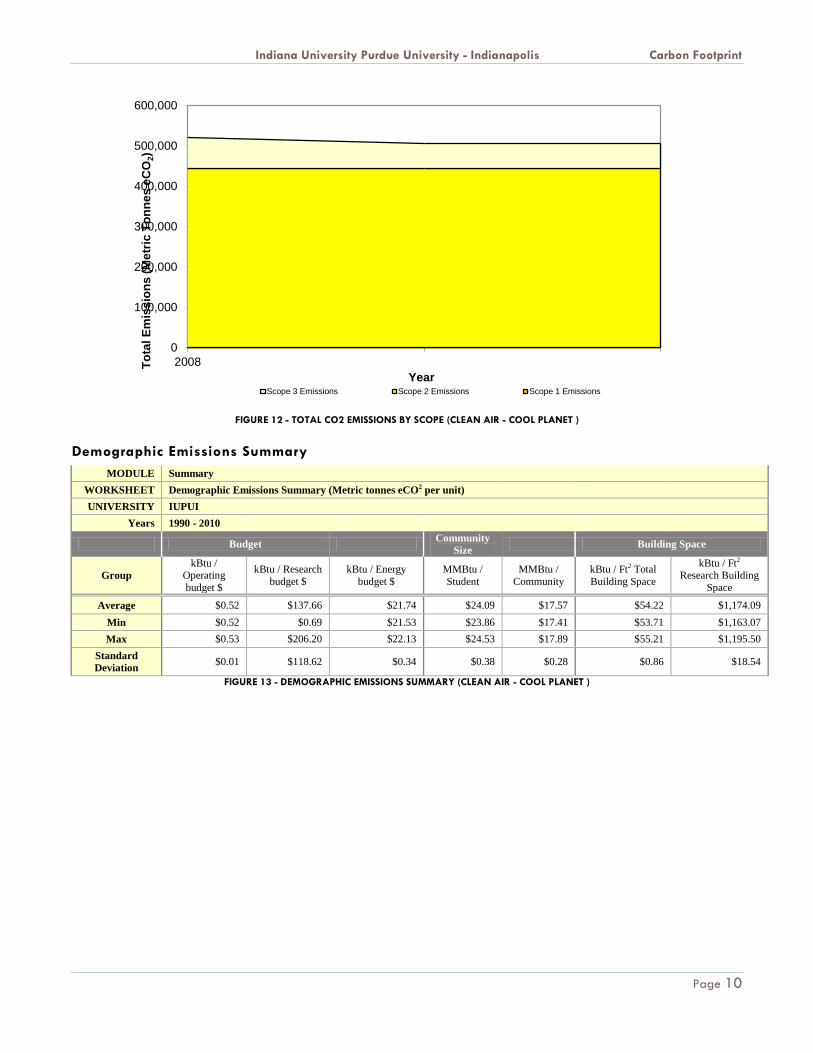
Total CO2 Emissions by Scope
495,000.0
500,000.0
505,000.0
510,000.0
515,000.0
520,000.0
525,000.0
2008
eCO
2 (M
etric
Ton
s)
Year
Total Emissions (Metric Tons eCO2)
0
100,000
200,000
300,000
400,000
500,000
600,000
2008
Tota
l Em
issi
ons
(Met
ric T
onne
s eC
O2)
Year
Scope 2 T&D Losses
Paper
Wastewater
Solid Waste
Study Abroad Air Travel
Directly Financed OutsourcedTravel
Commuting
Purchased Steam / Chilled Water
Purchased Electricity
Agriculture
Refrigerants & Chemicals
Direct Transportation
On-Campus Stationary
Indiana University Purdue University - Indianapolis Carbon Footprint
Page 10
FIGURE 12 - TOTAL CO2 EMISSIONS BY SCOPE (CLEAN AIR - COOL PLANET )
Demographic Emissions Summary MODULE Summary
WORKSHEET Demographic Emissions Summary (Metric tonnes eCO2 per unit) UNIVERSITY IUPUI
Years 1990 - 2010
Budget Community Size Building Space
Group kBtu /
Operating budget $
kBtu / Research budget $
kBtu / Energy budget $
MMBtu / Student
MMBtu / Community
kBtu / Ft2 Total Building Space
kBtu / Ft2 Research Building
Space
Average $0.52 $137.66 $21.74 $24.09 $17.57 $54.22 $1,174.09 Min $0.52 $0.69 $21.53 $23.86 $17.41 $53.71 $1,163.07 Max $0.53 $206.20 $22.13 $24.53 $17.89 $55.21 $1,195.50
Standard Deviation $0.01 $118.62 $0.34 $0.38 $0.28 $0.86 $18.54
FIGURE 13 - DEMOGRAPHIC EMISSIONS SUMMARY (CLEAN AIR - COOL PLANET )
0
100,000
200,000
300,000
400,000
500,000
600,000
2008Tota
l Em
issi
ons
(Met
ric T
onne
s eC
O2)
Year Scope 3 Emissions Scope 2 Emissions Scope 1 Emissions
Indiana University Purdue University - Indianapolis Carbon Footprint
Page 11
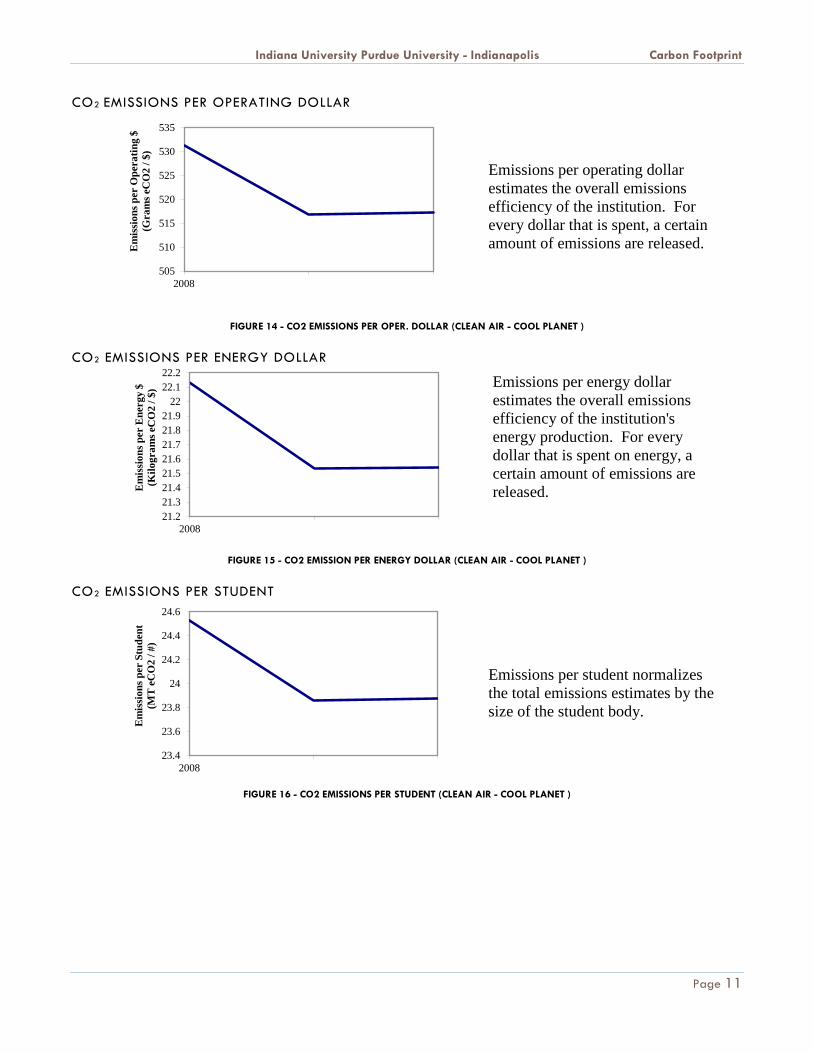
CO2 EMISSIONS PER OPERATING DOLLAR
Emissions per operating dollar estimates the overall emissions efficiency of the institution. For every dollar that is spent, a certain amount of emissions are released.
FIGURE 14 - CO2 EMISSIONS PER OPER. DOLLAR (CLEAN AIR - COOL PLANET )
CO2 EMISSIONS PER ENERGY DOLLAR
Emissions per energy dollar estimates the overall emissions efficiency of the institution's energy production. For every dollar that is spent on energy, a certain amount of emissions are released.
FIGURE 15 - CO2 EMISSION PER ENERGY DOLLAR (CLEAN AIR - COOL PLANET )
CO2 EMISSIONS PER STUDENT
Emissions per student normalizes the total emissions estimates by the size of the student body.
FIGURE 16 - CO2 EMISSIONS PER STUDENT (CLEAN AIR - COOL PLANET )
505
510
515
520
525
530
535
2008
Em
issi
ons p
er O
pera
ting
$ (G
ram
s eC
O2
/ $)
21.221.321.421.521.621.721.821.9
2222.122.2
2008
Em
issi
ons p
er E
nerg
y $
(Kilo
gram
s eC
O2
/ $)
23.4
23.6
23.8
24
24.2
24.4
24.6
2008
Em
issi
ons p
er S
tude
nt
(MT
eC
O2
/ #)
Indiana University Purdue University - Indianapolis Carbon Footprint
Page 12
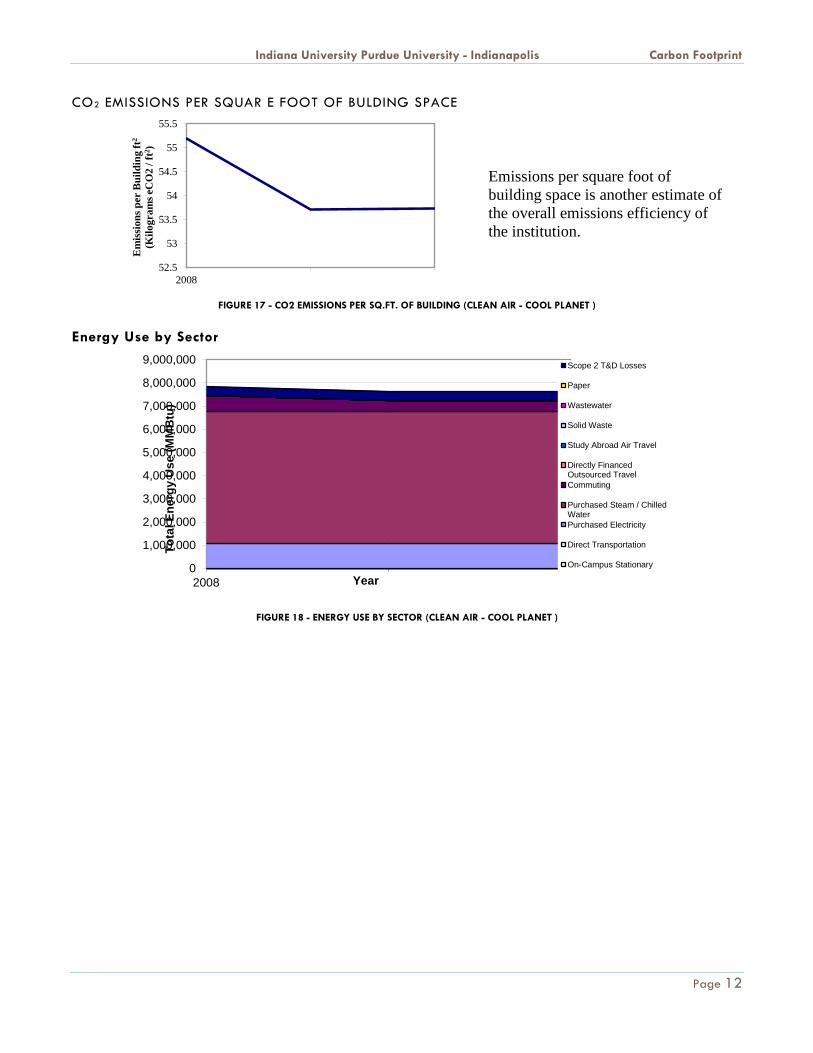
CO2 EMISSIONS PER SQUAR E FOOT OF BULDING SPACE
Emissions per square foot of building space is another estimate of the overall emissions efficiency of the institution.
FIGURE 17 - CO2 EMISSIONS PER SQ.FT. OF BUILDING (CLEAN AIR - COOL PLANET )
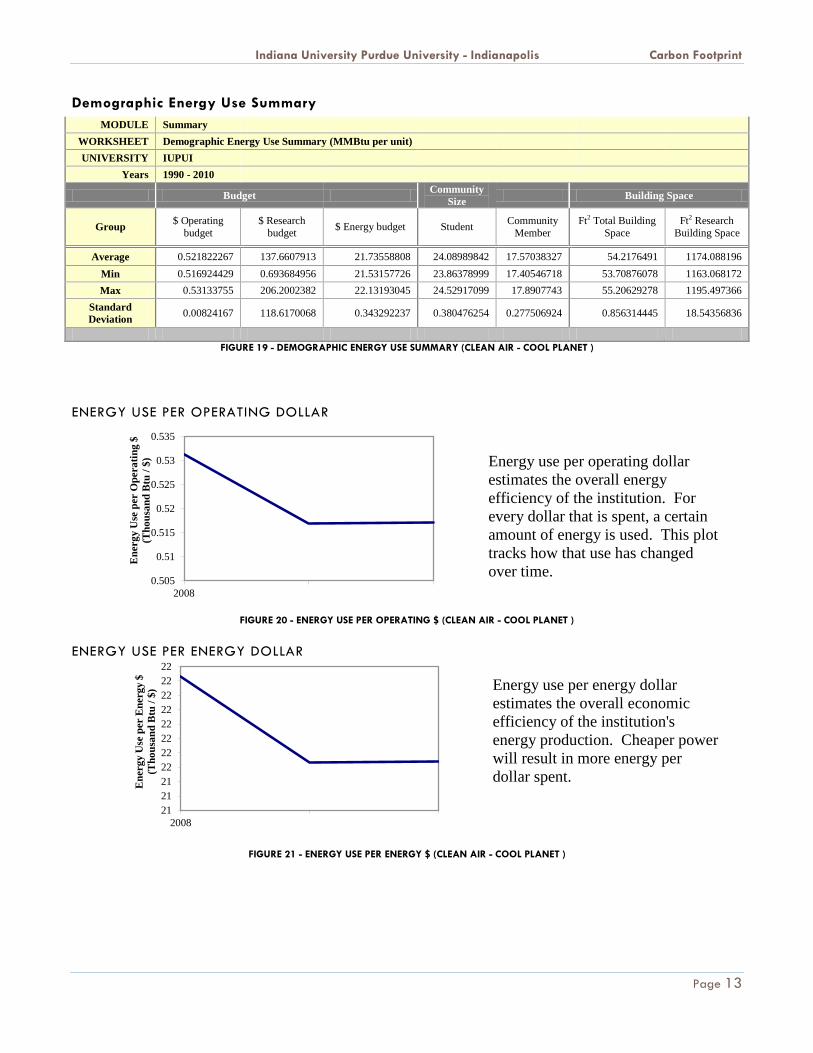
Energy Use by Sector
FIGURE 18 - ENERGY USE BY SECTOR (CLEAN AIR - COOL PLANET )
0
1,000,000
2,000,000
3,000,000
4,000,000
5,000,000
6,000,000
7,000,000
8,000,000
9,000,000
2008
Tota
l Ene
rgy
Use
(MM
Btu
)
Year
Scope 2 T&D Losses
Paper
Wastewater
Solid Waste
Study Abroad Air Travel
Directly FinancedOutsourced TravelCommuting
Purchased Steam / ChilledWaterPurchased Electricity
Direct Transportation
On-Campus Stationary
52.5
53
53.5
54
54.5
55
55.5
2008
Em
issi
ons p
er B
uild
ing
ft2
(Kilo
gram
s eC
O2
/ ft2 )
Indiana University Purdue University - Indianapolis Carbon Footprint
Page 13
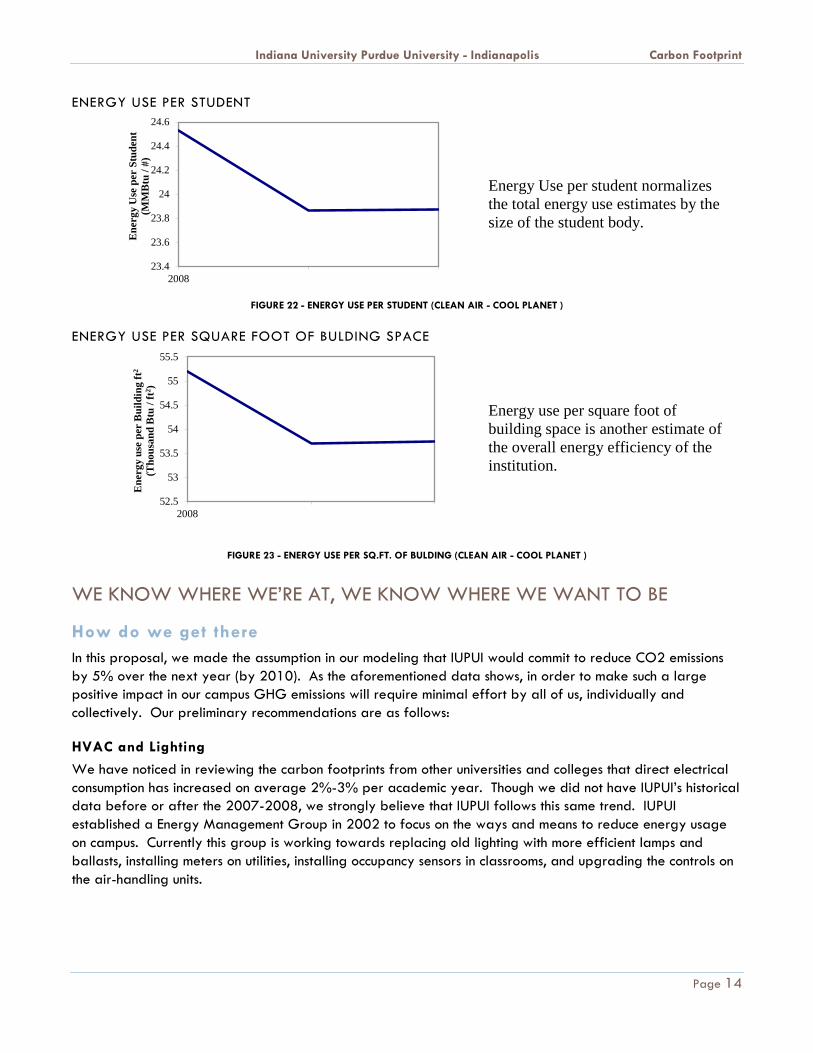
Demographic Energy Use Summary MODULE Summary
WORKSHEET Demographic Energy Use Summary (MMBtu per unit) UNIVERSITY IUPUI
Years 1990 - 2010
Budget Community Size Building Space
Group $ Operating budget
$ Research budget $ Energy budget Student Community
Member Ft2 Total Building
Space Ft2 Research
Building Space
Average 0.521822267 137.6607913 21.73558808 24.08989842 17.57038327 54.2176491 1174.088196 Min 0.516924429 0.693684956 21.53157726 23.86378999 17.40546718 53.70876078 1163.068172 Max 0.53133755 206.2002382 22.13193045 24.52917099 17.8907743 55.20629278 1195.497366
Standard Deviation 0.00824167 118.6170068 0.343292237 0.380476254 0.277506924 0.856314445 18.54356836
FIGURE 19 - DEMOGRAPHIC ENERGY USE SUMMARY (CLEAN AIR - COOL PLANET )
ENERGY USE PER OPERATING DOLLAR
Energy use per operating dollar estimates the overall energy efficiency of the institution. For every dollar that is spent, a certain amount of energy is used. This plot tracks how that use has changed over time.
FIGURE 20 - ENERGY USE PER OPERATING $ (CLEAN AIR - COOL PLANET )
ENERGY USE PER ENERGY DOLLAR
Energy use per energy dollar estimates the overall economic efficiency of the institution's energy production. Cheaper power will result in more energy per dollar spent.
FIGURE 21 - ENERGY USE PER ENERGY $ (CLEAN AIR - COOL PLANET )
0.505
0.51
0.515
0.52
0.525
0.53
0.535
2008
Ene
rgy
Use
per
Ope
ratin
g $
(Tho
usan
d B
tu /
$)
2121212222222222222222
2008
Ene
rgy
Use
per
Ene
rgy
$ (T
hous
and
Btu
/ $)
Indiana University Purdue University - Indianapolis Carbon Footprint
Page 14
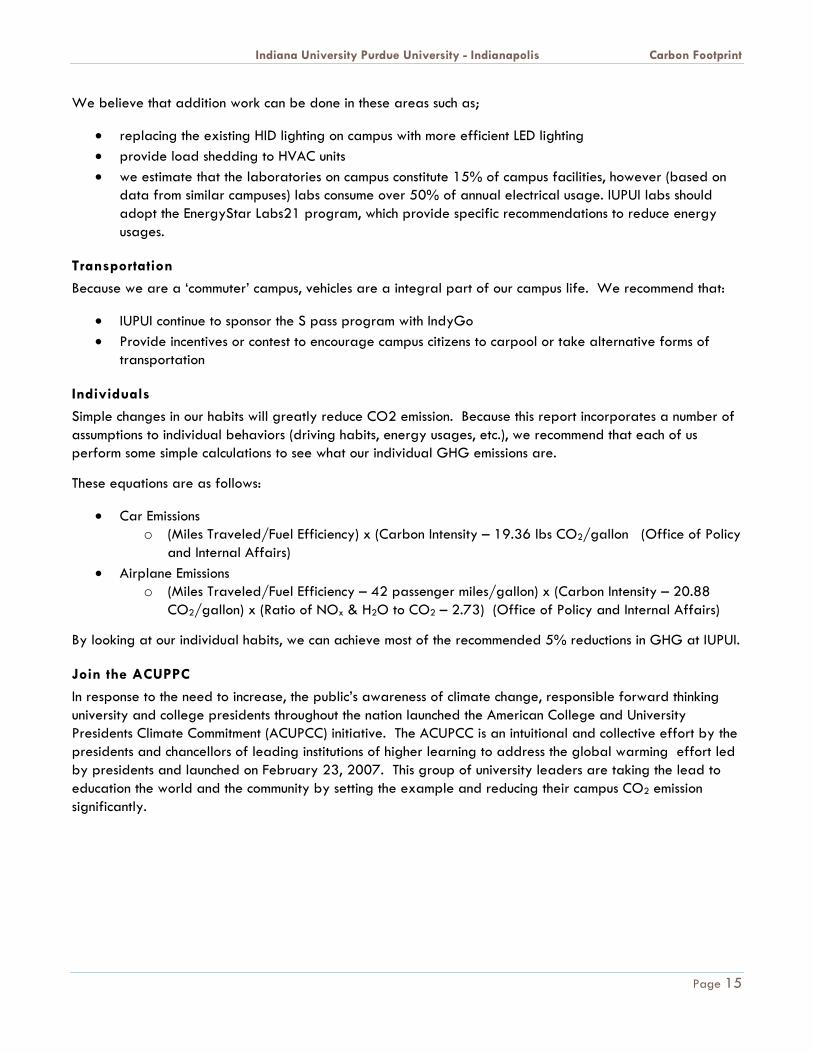
ENERGY USE PER STUDENT
Energy Use per student normalizes the total energy use estimates by the size of the student body.
FIGURE 22 - ENERGY USE PER STUDENT (CLEAN AIR - COOL PLANET )
ENERGY USE PER SQUARE FOOT OF BULDING SPACE
Energy use per square foot of building space is another estimate of the overall energy efficiency of the institution.
FIGURE 23 - ENERGY USE PER SQ.FT. OF BULDING (CLEAN AIR - COOL PLANET )
WE KNOW WHERE WE’RE AT, WE KNOW WHERE WE WANT TO BE
How do we get there In this proposal, we made the assumption in our modeling that IUPUI would commit to reduce CO2 emissions by 5% over the next year (by 2010). As the aforementioned data shows, in order to make such a large positive impact in our campus GHG emissions will require minimal effort by all of us, individually and collectively. Our preliminary recommendations are as follows:
HVAC and Lighting
We have noticed in reviewing the carbon footprints from other universities and colleges that direct electrical consumption has increased on average 2%-3% per academic year. Though we did not have IUPUI’s historical data before or after the 2007-2008, we strongly believe that IUPUI follows this same trend. IUPUI established a Energy Management Group in 2002 to focus on the ways and means to reduce energy usage on campus. Currently this group is working towards replacing old lighting with more efficient lamps and ballasts, installing meters on utilities, installing occupancy sensors in classrooms, and upgrading the controls on the air-handling units.
23.4
23.6
23.8
24
24.2
24.4
24.6
2008
Ene
rgy
Use
per
Stu
dent
(M
MB
tu /
#)
52.5
53
53.5
54
54.5
55
55.5
2008
Ene
rgy
use
per
Bui
ldin
g ft
2 (T
hous
and
Btu
/ ft
2 )
Indiana University Purdue University - Indianapolis Carbon Footprint
Page 15
We believe that addition work can be done in these areas such as;
• replacing the existing HID lighting on campus with more efficient LED lighting • provide load shedding to HVAC units • we estimate that the laboratories on campus constitute 15% of campus facilities, however (based on
data from similar campuses) labs consume over 50% of annual electrical usage. IUPUI labs should adopt the EnergyStar Labs21 program, which provide specific recommendations to reduce energy usages.
Transportation
Because we are a ‘commuter’ campus, vehicles are a integral part of our campus life. We recommend that:
• IUPUI continue to sponsor the S pass program with IndyGo • Provide incentives or contest to encourage campus citizens to carpool or take alternative forms of
transportation
Individuals
Simple changes in our habits will greatly reduce CO2 emission. Because this report incorporates a number of assumptions to individual behaviors (driving habits, energy usages, etc.), we recommend that each of us perform some simple calculations to see what our individual GHG emissions are.
These equations are as follows:
• Car Emissions o (Miles Traveled/Fuel Efficiency) x (Carbon Intensity – 19.36 lbs CO2/gallon (Office of Policy
and Internal Affairs) • Airplane Emissions
o (Miles Traveled/Fuel Efficiency – 42 passenger miles/gallon) x (Carbon Intensity – 20.88 CO2/gallon) x (Ratio of NOx & H2O to CO2 – 2.73) (Office of Policy and Internal Affairs)
By looking at our individual habits, we can achieve most of the recommended 5% reductions in GHG at IUPUI.
Join the ACUPPC
In response to the need to increase, the public’s awareness of climate change, responsible forward thinking university and college presidents throughout the nation launched the American College and University Presidents Climate Commitment (ACUPCC) initiative. The ACUPCC is an intuitional and collective effort by the presidents and chancellors of leading institutions of higher learning to address the global warming effort led by presidents and launched on February 23, 2007. This group of university leaders are taking the lead to education the world and the community by setting the example and reducing their campus CO2 emission significantly.
Indiana University Purdue University - Indianapolis Carbon Footprint
Page 16
CLOSING THOUGHTS From ice core samples taken s in Antarctica have been able to compute CO2 levels prior to the Industrial Revolution. While there is some disagreement as to the actual concentration levels, it has been proven conclusively that . 4form the Antarctic ice cores
Concurrently public opinion has began to prove that on This report sets out the contribution and impact that IUPUI has in the emission of greenhouse gases (GHG). We were able to obtain In researching data The team members of this report originally began as a simple research assignment in one of our graduate level electrical engineering classes (ECE 595 – Special Topics in Energy Systems), however in computing and analyzing our data , however in The research and analysis to compute the carbon footprint for the IUPUI campus grew from a simple class in a graduate level electrical engineering class (ECE 595 – Special Topics in Energy Systems) to find out the CO2 emission and turned into a much broader mission
We would strongly recommend that IUPUI use this report as a rough draft to build a more comprehensive report that would provide significantly more detail and stronger recommendations.
4 The record from the Taylor Dome ice core is considered the most reliable and precise to date; unfortunately, there are at least three overlapping data points. This suggests that there may have been some calibration or contamination issues
Indiana University Purdue University - Indianapolis Carbon Footprint
Page 17
WORKS CITED Braham, William, Ph.D, et al. "University of Pennsylvania: Carbon Footprint." Sustainability Plan and Campus Audit. University of Pennsylvania , 2007.
Carbon Footprint, Ltd. Carbon Footprint. 2009. 9 April 2009 <http://www.carbonfootprint.com/carbonfootprint.html>.
Clean Air - Cool Planet . Clean Air Cool Planet - Finding and Promoting Solutions to Global Warming. 2009. 9 April 2009 <http://www.cleanair-coolplanet.org/>.
IUPUI Quick Facts. 8 April 2009. 10 April 2009 <http://ocm.iupui.edu/factbook/>.
MyClimateChange.net. MyClimateChange.net - Your global warming blog. 2009. 9 April 2009 <http://www.myclimatechange.net/default.aspx?Page=Article&SubjectId=14&cat=1&sub=1>.
Office of Policy and Internal Affairs. "Technical Guidelines: Voluntary Reporting of Greenhouse Gases." 2006.
Wikipedia, the free encycolopedia. Carbon. 21 March 2009. 9 April 2009 <http://en.wikipedia.org/wiki/Carbon#Compounds>.
Top Related