


Languages
Pages
Legal


India – Time to Shine Again
20 August 2014
Mashreq Country Research
mashreq Economic Research 20 August 2014
Economic Research|2
India– Time to Shine Again
Table 1: Country Snapshot
Social
Region Asia-Pacific
Area Sq. Km. 3,287,590
Population Mn 1,237
Urban Population % 31.66
Urban Population Growth % 2.3
Capital Delhi
Largest City Mumbai
Official languages Hindi, English
Political
Set-up* Federal Union 29 states, 9 union territories
Constitution Parliamentary Democracy
Number of political parties 6 national parties
Political party in power Bharatiya Janata Party
Prime Minister Narendra Modi
President Pranab Mukherjee
Economic
Currency Indian Rupee (INR)
Implied PPP conversion rate 22.33
Current Conversion Rate INR/USD (Aug 11) 0.1634
GDP (2013) USD bn 1,870.65
GDP/Capita (2013) USD 1,504.54
Unemployment % 3.7%
Current inflation % 7.31%
Source: World Bank, Trading economics, IMF; Note: Urban population and growth thereof corresponds to 2012 and 2010, respectively.
Chart 1: Economic growth (%) The BJP-led NDA was voted into office on May 16 with a majority
of 336 (out of 543) seats. After a prolonged period of policy
inaction, the new government was expected to take swift
decisions. The NDA delivered on that. In its first month in office,
it streamlined the government and consolidated powers under
the PMO to fast-track governance. It unveiled anti-inflationary
measures and formed a special team to curtail the flow of black
money.
The UPA failed miserably in its second term. A large number of
corruption scams and delays in decision-making and policy
implementation marked the end of its decade-long run. The
economy stagnated and the industrial sector slowed, even as
inflation remained stubbornly high. GDP growth slipped to an
average of 6.9% over the five years from 2009 to 2014.
Markets welcomed the NDA government's maiden budget for
FY15 (ending March 31, 2015) as it set the tone for achieving a
higher growth trajectory, greater job creation and attracting
investments, while restoring fiscal discipline.
The prospect of a stable government after three decades pushed
equity markets to record highs. Benchmark Sensex registered
24% returns in 1H14, the highest among major emerging and
developed economies.
Chart 2: Inflation (%)
Source: IMF World Economic Outlook, April 2014
General Disclaimer:
This note has been prepared solely for information purposes. It does not constitute an investment advice, solicitation, offer or personal recommendation by Mashreqbank
or its affiliates to buy or sell any securities, product, service or investment or to engage in or refrain from engaging in any transaction, particularly, in any jurisdiction
where such an offer or solicitation would be illegal. Certain assumptions may have been made in the analysis that resulted in any information and results/returns detailed
therein. No representation is made that any returns/results indicated would be achieved or that all assumptions in achieving these returns/results have been considered.
Past performance is not necessarily indicative of future results. Mashreqbank does not warrant accuracy of the information provided herein and views expressed in this
research reflect personal views of the analyst(s) which does not take account of individual clients’ objectives, financial situations or needs. Investors are required to
undertake their own assessment and seek appropriate financial, legal, tax and regulatory advice to determine whether this investment is appropriate for them in light of
their experience, objectives, financial resources and other relevant circumstances.
Mashreqbank nor any of its related parties accept any liability whatsoever for any direct, indirect, consequential or other loss arising from any use of this memorandum
and/or further communication in relation thereto. Mashreqbank does not accept any obligation to correct or update the information or opinions in it; however, opinions
expressed are subject to change without notice. This note is disseminated primarily electronically, and, in some cases, in printed form.
The above terms are indicative and do not constitute solicitation or an offer to sell to the public. This document is not intended to identify, represent or notify the
conclusive terms and conditions of any transaction, other material considerations and any possible risks, direct or indirect, would be involved in undertaking such a
transaction. The interest of Mashreqbank may conflict with the interests of the investors in respect of any matter requiring its consent and Mashreqbank will not be
required to consider the interests of the investors in exercising such rights
0%
5%
10%
15%
20
07
20
08
20
09
20
10
20
11
20
12
20
13
20
14
E
20
15
E
20
16
E
20
17
E
20
18
E
20
19
E
0%
5%
10%
15%
20
07
20
08
20
09
20
10
20
11
20
12
20
13
20
14
E
20
15
E
20
16
E
20
17
E
20
18
E
20
19
E
Economic and Market Research
Economic Research | 3
India’s 2014 Elections – A Sweeping Mandate for Change
An Unprecedented victory for the Bharatiya Janata Party (BJP)
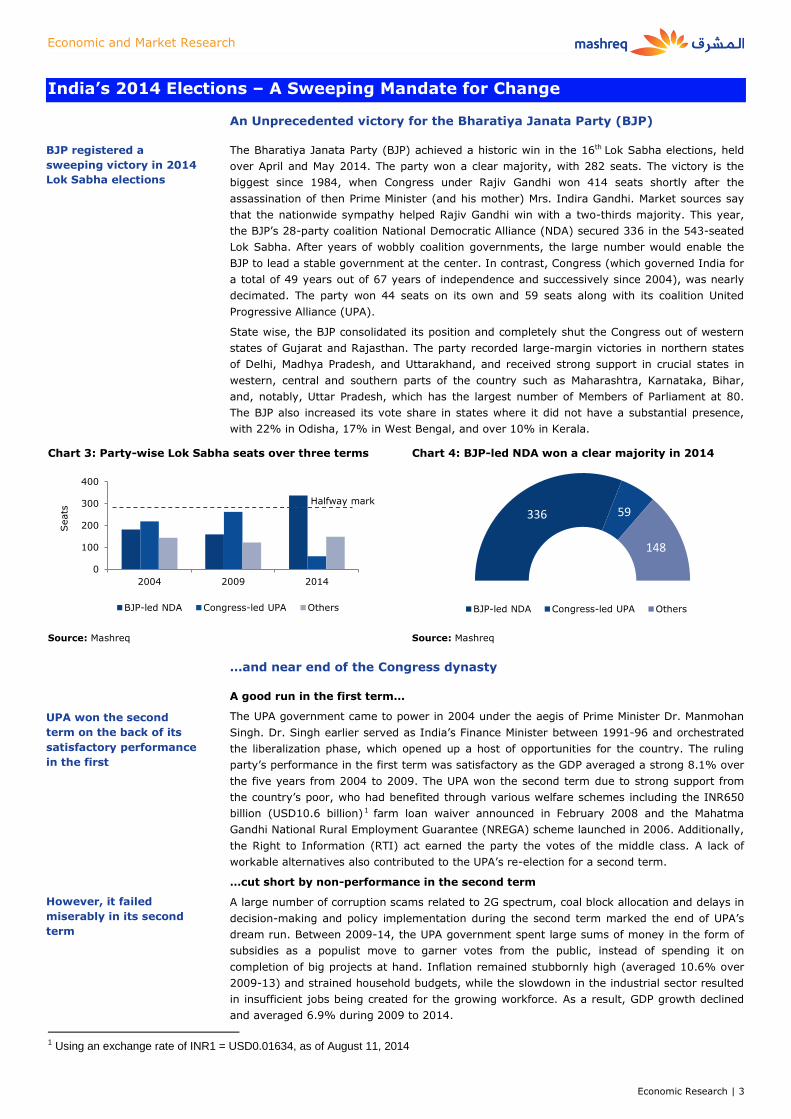
The Bharatiya Janata Party (BJP) achieved a historic win in the 16th Lok Sabha elections, held
over April and May 2014. The party won a clear majority, with 282 seats. The victory is the
biggest since 1984, when Congress under Rajiv Gandhi won 414 seats shortly after the
assassination of then Prime Minister (and his mother) Mrs. Indira Gandhi. Market sources say
that the nationwide sympathy helped Rajiv Gandhi win with a two-thirds majority. This year,
the BJP’s 28-party coalition National Democratic Alliance (NDA) secured 336 in the 543-seated
Lok Sabha. After years of wobbly coalition governments, the large number would enable the
BJP to lead a stable government at the center. In contrast, Congress (which governed India for
a total of 49 years out of 67 years of independence and successively since 2004), was nearly
decimated. The party won 44 seats on its own and 59 seats along with its coalition United
Progressive Alliance (UPA).
State wise, the BJP consolidated its position and completely shut the Congress out of western
states of Gujarat and Rajasthan. The party recorded large-margin victories in northern states
of Delhi, Madhya Pradesh, and Uttarakhand, and received strong support in crucial states in
western, central and southern parts of the country such as Maharashtra, Karnataka, Bihar,
and, notably, Uttar Pradesh, which has the largest number of Members of Parliament at 80.
The BJP also increased its vote share in states where it did not have a substantial presence,
with 22% in Odisha, 17% in West Bengal, and over 10% in Kerala.
Chart 3: Party-wise Lok Sabha seats over three terms Chart 4: BJP-led NDA won a clear majority in 2014
Source: Mashreq Source: Mashreq
…and near end of the Congress dynasty
A good run in the first term…
The UPA government came to power in 2004 under the aegis of Prime Minister Dr. Manmohan
Singh. Dr. Singh earlier served as India’s Finance Minister between 1991-96 and orchestrated
the liberalization phase, which opened up a host of opportunities for the country. The ruling
party’s performance in the first term was satisfactory as the GDP averaged a strong 8.1% over
the five years from 2004 to 2009. The UPA won the second term due to strong support from
the country’s poor, who had benefited through various welfare schemes including the INR650
billion (USD10.6 billion)1 farm loan waiver announced in February 2008 and the Mahatma
Gandhi National Rural Employment Guarantee (NREGA) scheme launched in 2006. Additionally,
the Right to Information (RTI) act earned the party the votes of the middle class. A lack of
workable alternatives also contributed to the UPA’s re-election for a second term.
…cut short by non-performance in the second term
A large number of corruption scams related to 2G spectrum, coal block allocation and delays in
decision-making and policy implementation during the second term marked the end of UPA’s
dream run. Between 2009-14, the UPA government spent large sums of money in the form of
subsidies as a populist move to garner votes from the public, instead of spending it on
completion of big projects at hand. Inflation remained stubbornly high (averaged 10.6% over
2009-13) and strained household budgets, while the slowdown in the industrial sector resulted
in insufficient jobs being created for the growing workforce. As a result, GDP growth declined
and averaged 6.9% during 2009 to 2014.
1 Using an exchange rate of INR1 = USD0.01634, as of August 11, 2014
0
100
200
300
400
2004 2009 2014
Seats
BJP-led NDA Congress-led UPA Others
Halfway mark
336 59
148
BJP-led NDA Congress-led UPA Others
BJP registered a
sweeping victory in 2014
Lok Sabha elections
UPA won the second
term on the back of its
satisfactory performance
in the first
However, it failed
miserably in its second
term

Economic and Market Research
Economic Research | 4
Chart 5: Major factors that contributed to the downfall of Congress in the second term
Source: Mashreq; *CAG− Comptroller and Auditor General of India
Given the UPA’s abysmal record of governance, the party’s loss in the general elections is not
surprising. However, the magnitude of the defeat is astounding. BJP’s landslide victory was
primarily driven by high voter expectations from the party’s prime ministerial candidate
Narendra Modi. Mr. Modi served as the Chief Minister of the western state of Gujarat for three
consecutive terms after taking office in 2001.
With elections over, BJP government seems to be standing at crossroads
The NDA government won this election on the promise of development. The ability to bring
about positive change, while achieving set targets for fiscal deficit and economic growth, will be
a key test for the NDA government. Investors have high hopes that the new government would
be more likely to promote economic reforms, particularly as Mr. Modi ran his campaign on the
basis of his reputation for being business-friendly. With the landslide victory, the party has the
mandate to enact long-needed reforms to do away with red tape, boost business investment
and revive economic growth, without unnecessary impediments by coalition partners.
Factors for
the fall of
UPA
PM Narendra Modi’s
party won the elections
on promises of good
times
Policy and bureaucratic paralysis
Environment of suspicion and a lack of political
consensus on major reforms
Environmental and other regulatory approvals, land
acquisition and funding issues led to delayed project
implementation and rising project costs
As per Ministry of Statistics and Programme
Implementation, around 301 central projects were
delayed, each at an investment of more than INR1.5
billion (USD25 million). This resulted in cost overruns
of ~INR1.74 trillion (USD28.4 billion).
High profile corruption and scams
Irregularities in the of 2G spectrum allocation, in which
CAG* estimated a notional loss to the exchequer of
INR1.76 trillion (USD28.8 billion)
Unlawful activity in the allotment of coal blocks, which
the CAG calculated at INR1.86 trillion (USD30.4 billion)
2010 Commonwealth Games funds misappropriation
worth about INR700 billion (USD11.5 billion)
Violation of rules in the allotment of Adarsh Housing
Society apartments in Mumbai
Waning economic indicators
The economy grew at 4.7% in the full year ended
March 2014, the lowest growth level in 10 years and
the second straight year of sub-5% expansion
Growth remained subdued largely due to a slowdown
in the manufacturing sector. Inflation remained in
near double-digit figures consistently for the past two
years, negatively impacting consumer spending as
well as savings. The fiscal and current account deficits
also tested multi-year highs.
Weakening federal structure
State governments expressed their displeasure at
excessive centralization of powers. Nine states refused
the proposal for setting up of a central National
Counter Terrorism Centre (NCTC), an anti-terrorism
unit , which provides real-time intelligence inputs for
responding to terrorism
The central government was also accused of raising
obstacles in the funding of states' development
schemes.
Economic and Market Research
Economic Research | 5
The track record is encouraging
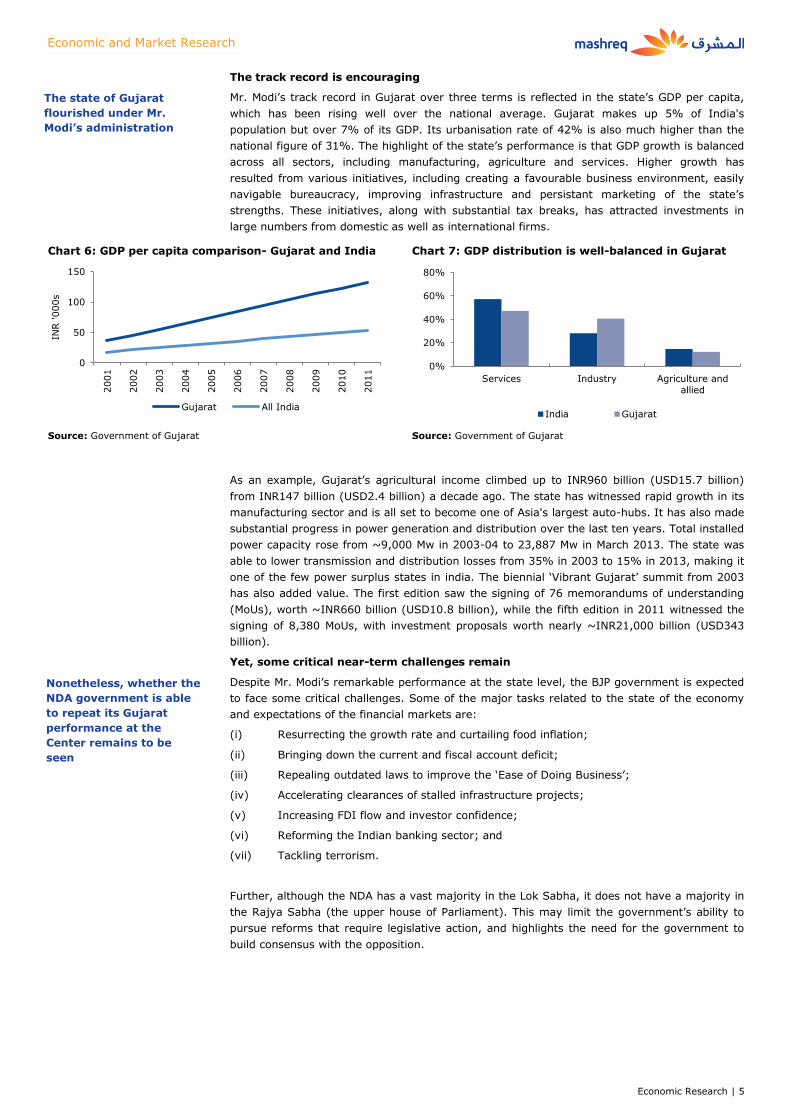
Mr. Modi’s track record in Gujarat over three terms is reflected in the state’s GDP per capita,
which has been rising well over the national average. Gujarat makes up 5% of India's
population but over 7% of its GDP. Its urbanisation rate of 42% is also much higher than the
national figure of 31%. The highlight of the state’s performance is that GDP growth is balanced
across all sectors, including manufacturing, agriculture and services. Higher growth has
resulted from various initiatives, including creating a favourable business environment, easily
navigable bureaucracy, improving infrastructure and persistant marketing of the state’s
strengths. These initiatives, along with substantial tax breaks, has attracted investments in
large numbers from domestic as well as international firms.
Chart 6: GDP per capita comparison- Gujarat and India Chart 7: GDP distribution is well-balanced in Gujarat
Source: Government of Gujarat Source: Government of Gujarat
As an example, Gujarat’s agricultural income climbed up to INR960 billion (USD15.7 billion)
from INR147 billion (USD2.4 billion) a decade ago. The state has witnessed rapid growth in its
manufacturing sector and is all set to become one of Asia's largest auto-hubs. It has also made
substantial progress in power generation and distribution over the last ten years. Total installed
power capacity rose from ~9,000 Mw in 2003-04 to 23,887 Mw in March 2013. The state was
able to lower transmission and distribution losses from 35% in 2003 to 15% in 2013, making it
one of the few power surplus states in india. The biennial ‘Vibrant Gujarat’ summit from 2003
has also added value. The first edition saw the signing of 76 memorandums of understanding
(MoUs), worth ~INR660 billion (USD10.8 billion), while the fifth edition in 2011 witnessed the
signing of 8,380 MoUs, with investment proposals worth nearly ~INR21,000 billion (USD343
billion).
Yet, some critical near-term challenges remain
Despite Mr. Modi’s remarkable performance at the state level, the BJP government is expected
to face some critical challenges. Some of the major tasks related to the state of the economy
and expectations of the financial markets are:
(i) Resurrecting the growth rate and curtailing food inflation;
(ii) Bringing down the current and fiscal account deficit;
(iii) Repealing outdated laws to improve the ‘Ease of Doing Business’;
(iv) Accelerating clearances of stalled infrastructure projects;
(v) Increasing FDI flow and investor confidence;
(vi) Reforming the Indian banking sector; and
(vii) Tackling terrorism.
Further, although the NDA has a vast majority in the Lok Sabha, it does not have a majority in
the Rajya Sabha (the upper house of Parliament). This may limit the government’s ability to
pursue reforms that require legislative action, and highlights the need for the government to
build consensus with the opposition.
0
50
100
150
2001
2002
2003
2004
2005
2006
2007
2008
2009
2010
2011
INR '000s
Gujarat All India
0%
20%
40%
60%
80%
Services Industry Agriculture and
allied
India Gujarat
The state of Gujarat
flourished under Mr.
Modi’s administration
Nonetheless, whether the
NDA government is able
to repeat its Gujarat
performance at the
Center remains to be
seen

Economic and Market Research
Economic Research | 6
A glimpse of the NDA government’s 30 days in power
It is still early days to judge the performance of the government. However, the larger trend
indicates that the Prime Minister’s Office (PMO) is showing an extremely hands-on approach to
governance. This approach is helping speed-up decision making by avoiding inter-ministerial
deadlock.
Table 2: NDA’s 30-day report card
IMPROVEMENT AREA STEP(S) TAKEN OUTCOME IMMEDIATE EFFECT
The new government has a
focused cabinet. The current
council of ministers has only
45 members, including 23
cabinet members. This is in
stark contrast with the UPA
government which had 78
ministers.
The government has
scrapped 19 Group of
Ministers (GoM) and eight
Empowered Group of
Ministers (EGoM). GoM and
EGoM were constituted in
order to resolve complex
issues through exchange of
ideas between inter-
ministerial groups. However,
the groups did not function
as expected and led to
unnecessary delays and
indecision on project
clearances.
The streamlining of
government and scrapping
of GoM and EGoM would
enable ministers and officers
to take decisions on pending
matters directly.
The government cleared
seven projects worth
INR210 billion (USD3.4
billion) in its first 30 days.
These projects were on hold
mainly due to environmental
and financial discrepancies.
Additionally, the ministry of
road transport approved
road projects worth INR400
billion (USD6.5 billion).
Flater decision-making
structures would eliminate
bureaucratic hassles and
fast track governance.
Faster approvals of projects
would accelerate
infrastructural development
in the country.
Large-scale project
implementation would, in
turn, help revive the private
investment cycle.
Streamlining
the government
and
consolidation of
power under
the PMO, in line
with the NDA's
slogan
"Minimum
government,
maximum
governance".
The new PM invited leaders
of all South Asian
Association Regional
Corporation (SAARC)
countries for his swearing-in
ceremony.
Mr. Modi discussed India’s
concerns over terrorism with
Pakistan's PM Nawaz Sharif,
and urged him to crack
down on militants and
expedite trial of 2008
Mumbai attack suspects.
Mr. Modi, in his first BRICS
summit, gave a major push
to the establishment of the
New Development Bank and
a USD100 billion
contingency reserve
arrangement to meet short-
term liquidity pressures.
The attendance of all seven
countries in the PM's
swearing-in ceremony was a
major step forward in
strengthening of India's
relations with SAARC
countries.
Leaders of India and
Pakistan decided that their
foreign secretaries would
discuss a way forward on
diplomatic talks, which have
been suspended since
January 2013.
Success of the proposed
BRICS development bank
and contingency reserve is
expected to elevate the
BRICS countries’ standing in
the world.
The PM’s invite to SAARC
leaders for his swearing-in
ceremony was a diplomatic
move that eased investor
concerns regarding the
secular stance of the BJP.
While potential diplomatic
talks between India and
Pakistan appear to be a step
in the right direction, a
definite outcome is unlikely
over the near- to medium-
term.
The New Development Bank
would act as an additional
source of funding for India’s
infrastructure requirements.
Enhancing
international
relations to
strengthen
regional
cooperation
The NDA’s first 30 days
demonstrate the PMO’s
hands-on approach to
governance

Economic and Market Research
Economic Research | 7
Table 3: Steps planned by the government
Source: Mashreq
IMPROVEMENT AREA STEP(S) PLANNED OUTCOME IMMEDIATE EFFECT
Several states have asked
the PMO to relax norms to
acquire land for projects.
The states want to remove a
requirement to get
landholders' consent in the
case of public private
partnership (PPP) projects,
and reduce the threshold to
50% of landowners from the
existing 80% for private
acquisition.
The step, if approved, would
make land acquisitions
easier. Corporates believe
the 80% consent clause
makes it impractical to win
acquisition approvals. As a
case in point, no major sale
of land has been recorded
after the law came into force
in January 2014.
The step would enhance
‘ease of doing business’ in
India. This would improve
investor confidence and
boost foreign investment in
the country.
Amending the Land
Reforms Act, blamed
for stalling the
process of land
acquisition and
industrialization
The ministry of labor is
proposing changes to four
major laws, namely, the
Factories Act, the Minimum
Wages Act, the Industrial
Disputes Act and the
Contract Labor Act.
The proposed changes
include improved safety of
workers, higher provision of
overtime and relaxing the
rules of female participation
in some sectors.
The proposals, if approved,
are likely to generate higher
employment opportunities
by attracting fresh
investments. Although the
changes would be aimed at
striking a balance between
growth and welfare of
workers, industrial and trade
bodies may show some
resistance at the outset.
Amendments in the labor
laws would be a positive for
attracting investments in
India’s manufacturing
sector. The move would not
only increase the number of
jobs, but also lift labor
productivity.
Modifying archaic
labor laws,
responsible for
thwarting job
creation
IMPROVEMENT AREA STEP(S) TAKEN OUTCOME IMMEDIATE EFFECT
The government has
announced the formation of
a Special Investigation Team
(SIT) to track black money
of Indians parked abroad.
The SIT has been formed
under retired Supreme Court
judge MB Shah.
The SIT plans to draw a
detailed action plan to
restrict generation of black
money and create an
institutional structure for it.
In a 2011 report, BJP had
estimated India's black
economy to range between
USD500 billion and USD1.4
trillion.
The Swiss government’s
cooperation in tracking black
money could provide
significant help to the Indian
government in its efforts to
eliminate corruption.
However, the success of the
SIT largely depends on the
government’s ability to
implement the plan.
Tracking black money
The government delisted
fruits and vegetables from
the ancient Agricultural
Produce Market Committee
(APMC) act.
The move would allow
farmers to sell their produce
in the open market and
reduces their dependence on
middlemen.
The delisting would allow the
government to limit price
increases in fresh
agricultural produce.
Unveiling anti-
inflationary measures

Economic and Market Research
Economic Research | 8
Beyond the 30 days: The Union Budget of 2014-15
Finance Minister (FM) Arun Jaitley unveiled his maiden budget on July 10, 2014. The
government had less than 45 days to prepare for it and hence, the FM chose to present a
working budget as an interim measure. The FM outlined his broad objectives of reducing the
nation’s fiscal deficit, lowering inflation, curtailing the current account deficit and reviving GDP
growth to 7-8% in the next 3-4 years. Mr. Jaitley indicated that the current budget is part of
the roadmap towards achieving these goals. The budget focuses on fiscal prudence to contain
deficit and provides incentives for infrastructure projects and capital investment.
Fiscal deficit: The budget has set the fiscal deficit target at 4.1% of GDP for FY15, down from
4.6% in FY14. The target appears steep, but the new government has decided to accept it as a
challenge. It aims to achieve this through a sharp increase in revenues, especially in indirect
taxes and disinvestment proceeds. The fiscal deficit is expected to reduce further to 3.6% in
FY16 and 3.0% in FY17. Much of the government’s ability to meet its aggressive fiscal deficit
targets will depend on growth in revenues during second half of the year. The targets appear
hard to achieve as India’s tax-to-GDP ratio has been on a downtrend and appears unlikely to
pick up soon. It has fallen from 12.5% in 2007-08 to 10.2% at present. In such a situation, the
government would have to resort to stringent cost cutting measures to achieve the set target.
GDP growth: The government targets real GDP growth of 5.4-5.9% in FY15. However,
downside risks exist due to the weak monsoon season. It pegged GDP growth at over 6% in
FY16 and 7-8% in the next 3-4 years.
Table 4: Union Budget 2014-15 – Key policy announcements
PARAMETER INITIATIVES RESULT
The budget proposed to overhaul the subsidy regime, including
food and petroleum subsidies.
Stimulating the
economy
Building public
infrastructure
It reiterated the government’s pledge to implement the goods
and services tax (GST) within this year. The GST would unify the
Indian market and is expected to boost GDP by up to 2
percentage points.
The government resolved to tackle elevated food prices by
setting up a Price Stabilization Fund and working with states in
re-orienting Agricultural Produce Market Committee (APMC) Act.
The budget aims to boost revenues by targeting divestment of
USD10.4 billion in FY15. The amount is ambitious relative to
divestment figures of ~USD4.2 billion in both FY13 and FY14.
↓ Lower expenditure
↑ Tax revenues
↓ Inflation
↑ Revenues from sale of
assets
The government proposed setting aside USD1.2 billion in FY15 to
develop 100 smart cities. The cities would be developed as
satellite towns of larger cities by modernizing the existing mid-
sized cities. They would help accommodate the growing number
of people wanting to migrate from the rural areas to the cities.
A new entity 3P India would be set up to strengthen the public-
private partnership (PPP) framework. Innovative funding
mechanisms like infra bonds for banks and Infrastructure
Investment Trusts will channelize funds for infrastructure.
Six asset reconstruction companies would be created, of which
two would be committed to cleaning up bad debt in the power
and roads sectors.
The budget proposed sixteen new port projects and a scheme for
development of new airports in Tier I and Tier II cities.
↓ Regional disparity
↑ Funding techniques;
PPPs
↓ Bad debts
↑ Improve regional
connectivity
It sought to address the unavailability of long-term infrastructure
financing by creating Infrastructure Investment Trusts and a
5:25 structure which allows a bank to loan money to a developer
for 25 years, with an option of rewriting the terms of the loan or
transferring it to another bank after five years. The 5:25
structure makes it viable for banks to fund infrastructure
projects.
↑ Bank funding to
infrastructural
projects
The FM presented a
roadmap for economic
recovery in the term’s
first budget

Economic and Market Research
Economic Research | 9
Source: Mashreq
Meanwhile, the budget discussion did not impact the country’s sovereign credit rating. Ratings
agency Standard & Poor’s stated the budget would be positive to the country’s credit
fundamentals as long as fiscal debt and interest ratios are expected to continue to improve.
However, any rating action would only occur when the measures are implemented and the
change becomes measurable, particularly with respect to meeting the fiscal deficit target.
Nonetheless, the extent to which various measures would be implemented and their impact on
deficit targets remains to be seen.
PARAMETER INITIATIVES RESULT
The finance minister assured corporates that no retrospective
amendment to the law would be made to create fresh demands.
Improving business
conditions and
encouraging
entrepreneurs
Attracting foreign
investors
The budget announced changes in the approach to transfer
pricing and advance rulings.
The budget unveiled an eBiz platform of all Central Government
Department and Ministries to create a business and investor
friendly ecosystem. The platform would make all business and
investment related clearances and compliances available on a
24x7 single portal, with an integrated payment gateway.
The finance minister set aside INR2 billion (USD32.7 million) to
establish a technology centre network that will promote
innovation and entrepreneurship in agri-businesses. Another
INR1 billion (USD16.3 million) was set aside for a rural
entrepreneurship scheme, while INR2 billion was reserved for
developing young entrepreneurs from underprivileged
backgrounds.
↑ Faith in tax framework
↓ Tax disputes
↓ Clearance times;
bureaucratic hassles
↑ Entrepreneurial
growth
The creation of a risk capital fund with INR100 billion (USD1.6
billion) corpus for equity, quasi-equity and other risk capital for
small companies was announced.
The composite cap of FDI in defense manufacturing and
insurance was raised from 26% to 49% with full Indian
management and control.
To encourage FDI participation in the development of smart
cities, the condition for built up area reduced from 50,000 square
meters to 20,000 square meters and minimum capitalization
norms reduced from USD10 million to USD5 million, with a lock-
in period of three years.
↑ SME growth
↑ Foreign investment;
funding to defence and
insurance sectors
↑ Foreign investment;
funding to
infrastructural
projects
Economic and Market Research
Economic Research | 10
Speedy Reforms are Critical for Economic Growth Revival
How India stumbled and what lies ahead for the NDA government
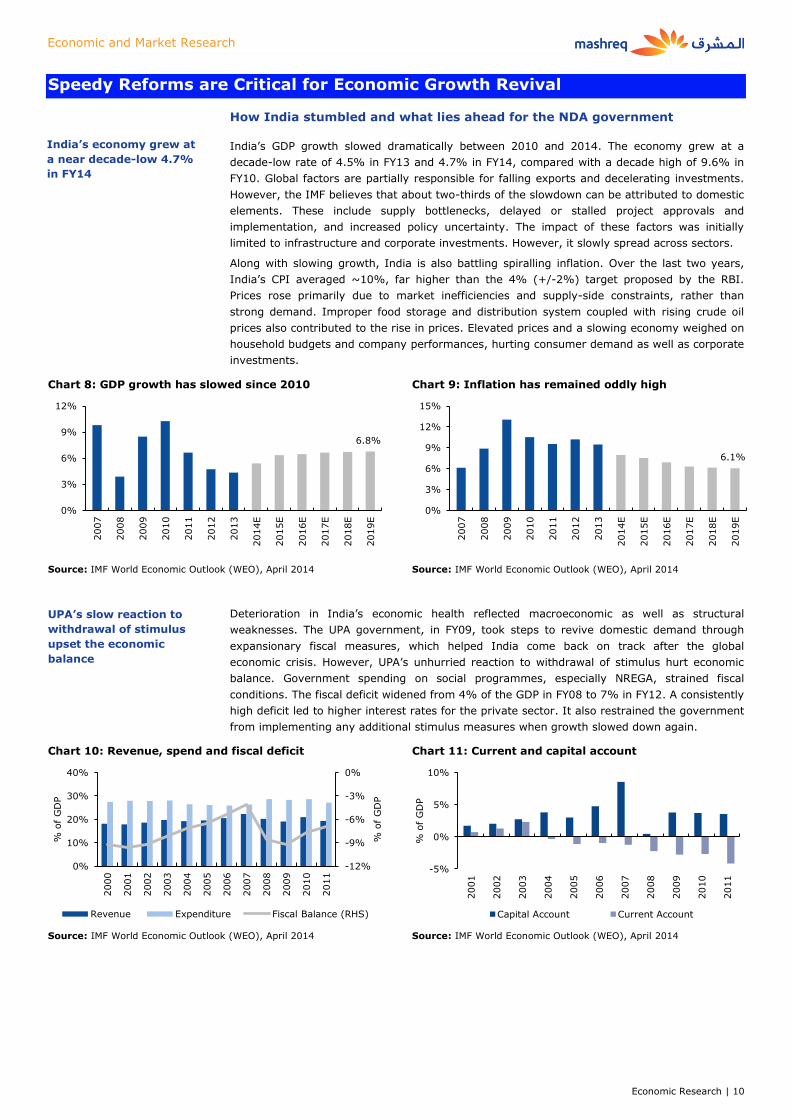
India’s GDP growth slowed dramatically between 2010 and 2014. The economy grew at a
decade-low rate of 4.5% in FY13 and 4.7% in FY14, compared with a decade high of 9.6% in
FY10. Global factors are partially responsible for falling exports and decelerating investments.
However, the IMF believes that about two-thirds of the slowdown can be attributed to domestic
elements. These include supply bottlenecks, delayed or stalled project approvals and
implementation, and increased policy uncertainty. The impact of these factors was initially
limited to infrastructure and corporate investments. However, it slowly spread across sectors.
Along with slowing growth, India is also battling spiralling inflation. Over the last two years,
India’s CPI averaged ~10%, far higher than the 4% (+/-2%) target proposed by the RBI.
Prices rose primarily due to market inefficiencies and supply-side constraints, rather than
strong demand. Improper food storage and distribution system coupled with rising crude oil
prices also contributed to the rise in prices. Elevated prices and a slowing economy weighed on
household budgets and company performances, hurting consumer demand as well as corporate
investments.
Chart 8: GDP growth has slowed since 2010 Chart 9: Inflation has remained oddly high
Source: IMF World Economic Outlook (WEO), April 2014 Source: IMF World Economic Outlook (WEO), April 2014
Deterioration in India’s economic health reflected macroeconomic as well as structural
weaknesses. The UPA government, in FY09, took steps to revive domestic demand through
expansionary fiscal measures, which helped India come back on track after the global
economic crisis. However, UPA’s unhurried reaction to withdrawal of stimulus hurt economic
balance. Government spending on social programmes, especially NREGA, strained fiscal
conditions. The fiscal deficit widened from 4% of the GDP in FY08 to 7% in FY12. A consistently
high deficit led to higher interest rates for the private sector. It also restrained the government
from implementing any additional stimulus measures when growth slowed down again.
Chart 10: Revenue, spend and fiscal deficit Chart 11: Current and capital account
Source: IMF World Economic Outlook (WEO), April 2014 Source: IMF World Economic Outlook (WEO), April 2014
6.8%
0%
3%
6%
9%
12%
2007
2008
2009
2010
2011
2012
2013
2014E
2015E
2016E
2017E
2018E
2019E
6.1%
0%
3%
6%
9%
12%
15%
2007
2008
2009
2010
2011
2012
2013
2014E
2015E
2016E
2017E
2018E
2019E
-12%
-9%
-6%
-3%
0%
0%
10%
20%
30%
40%
2000
2001
2002
2003
2004
2005
2006
2007
2008
2009
2010
2011
% o
f G
DP
% o
f G
DP
Revenue Expenditure Fiscal Balance (RHS)
-5%
0%
5%
10%
2001
2002
2003
2004
2005
2006
2007
2008
2009
2010
2011
% o
f G
DP
Capital Account Current Account
India’s economy grew at
a near decade-low 4.7%
in FY14
UPA’s slow reaction to
withdrawal of stimulus
upset the economic
balance

Economic and Market Research
Economic Research | 11
The delay in stimulus withdrawal also led to spiralling inflation, which prompted monetary
policy tightening and adversely impacted aggregate demand. It also dampened gross private
investment and savings. Total savings declined from 36.8% in FY08 to 32.3% in FY11. The 4.5
percentage point (of GDP) fall exceeded the 3 percentage point (of GDP) decline in gross
investment during the same period and resulted in sharp growth in India’s current account
deficit.
The high level of current account deficit slowed down capital inflows and resulted in currency
depreciation. The unfavourable external environment, led by a probable easing of stimulus in
the US and weak economic growth in Eurozone, exacerbated the situation. The possibility of a
pullback in stimulus in the US led to a capital flight from emerging nations to the US, while
fragile economic growth in the Eurozone bloc weighed on India’s exports, upsetting the
economic balance further.
Chart 12: Balance of payments Chart 13: INRUSD
Source: IMF World Economic Outlook (WEO), April 2014 Source: Bloomberg
Towards the end of its term, the Congress-led UPA government made some moves to improve
the deteriorating economic situation. However, the steps were too little and came too late.
Current account deficit was brought under control, foreign exchange reserves were rebuilt, the
rupee stabilized and the overall balance of payments improved. On the flip side, the economy
continued to register subdued growth and inflationary pressures persisted, driven by high
commodity prices and structural demand and supply imbalances.
BJP’s chance to bring the Indian economy back on track
The 2014 national elections were an important checkpoint along the path to restoring India’s
economic growth. The outcome of the elections has boosted investor sentiment. However, the
immediate situation remains fragile. IMF expects a gradual recovery in GDP growth to 6.7% by
2019, while CPI is expected to moderate to 6.1% over the next five years. Performance in the
current year may be hampered by the possibility of El-Nino, which would hurt agricultural
output and impact GDP growth and inflation. Nonetheless, the NDA’s victory has renewed
hopes for faster structural reforms and healthier investment climate. This is expected to
support growth over the coming years.
Twin deficits have been on the mend...
India’s current account deficit shrunk to USD32 billion (1.7% of GDP) in FY14 from USD88
billion (4.7% of GDP) in FY13. The drop was driven by administrative measures to constrict
gold imports, in addition to a significant improvement in exports and robust remittances flows.
Import duty on gold was incrementally raised from 4% to 10% and various restrictions were
imposed on agencies and trading houses. Non-oil non-gold imports also slipped as a result of
weak domestic demand. Additionally, India’s exports recovered despite a fall in growth of
global trade. Merchandise exports grew 6.3% to USD326 billion.
The government expects India's current account deficit to increase slightly to USD45 billion
(2.1% of GDP) in FY15. This is likely to be fully financed by stable sources of capital flows.
India has also been able to rebuild the reserves it spent on the rupee’s defence in July and
August 2013, primarily due to the attractive swap offered to banks for non-resident deposits.
-40
0
40
80
120
FY07
FY08
FY09
FY10
FY11
FY12
FY13
USD
bn
0.012
0.017
0.022
0.027
Jan/0
7
Jan/0
8
Jan/0
9
Jan/1
0
Jan/1
1
Jan/1
2
Jan/1
3
Jan/1
4
UPA took some steps in
the positive direction
The current account
deficit was brought
under control

Economic and Market Research
Economic Research | 12
Chart 14: India’s current account deficit Chart 15: Growth in trade volume of goods & services
Source: IMF World Economic Outlook (WEO), April 2014 Source: IMF World Economic Outlook (WEO), April 2014
On the fiscal account front, India achieved its deficit target of 4.6% of GDP in FY14. The target
was met primarily by way of reducing current expenditure, which is unsustainable over the
longer term. Revenues were raised through an increase of USD5 billion each in FII investment
limits in government securities and corporate bonds. Tax rate for foreign investors earned on
interest income on debt was also lowered to 5% for a two-year period.
For FY15, the preceding FM had set a target of limiting the fiscal deficit to 4.1% of GDP in an
interim budget before the elections. Economists reckon the goal is unrealistic, as the outgoing
government left large amounts of unpaid bills to state oil companies, that have reduced the
effective fiscal budget for FY15. However, the NDA government has decided to pursue the
challenge. Towards this end, the budget report recommended tackling subsidies to lower
spending, while broadening the tax base. Some of the proposals include:
(i) Raising overall revenue of INR11,900 billion (USD194.5 billion) in the current year, up
from the previous government’s estimate of Rs11,700 billion (USD191.2 billion);
(ii) Raising India’s tax collection, currently lower than 9% of GDP. This is about 25% of
the average tax collection in the OECD group of developed nations;
(iii) Raising INR634 billion (USD10.4 billion) from selling government stakes, compared
with INR569 billion (USD9.3 billion) in the interim budget;
(iv) Retaining the target for subsidy spending set by the previous government at about
INR2,600 billion (USD42.5 billion) for the current fiscal year;
(v) Raising plan expenditure, which includes funds for creating roads and ports, to
INR5,750 billion (USD94.0 billion) from INR5,550 billion (USD90.7 billion) projected in
the interim budget; and
(vi) Revamping food and fuel subsidies to make them more targeted while still providing
protection for the marginalized and poor. A commission would be set up to ensure
that the government spends its money efficiently.
Further, the FM Arun Jaitley also pledged to lower the fiscal deficit to 3.6% of GDP by FY16 and
3% by FY17 to meet the original target of 3% set by the Fiscal Responsibility and Budget
Management Act.
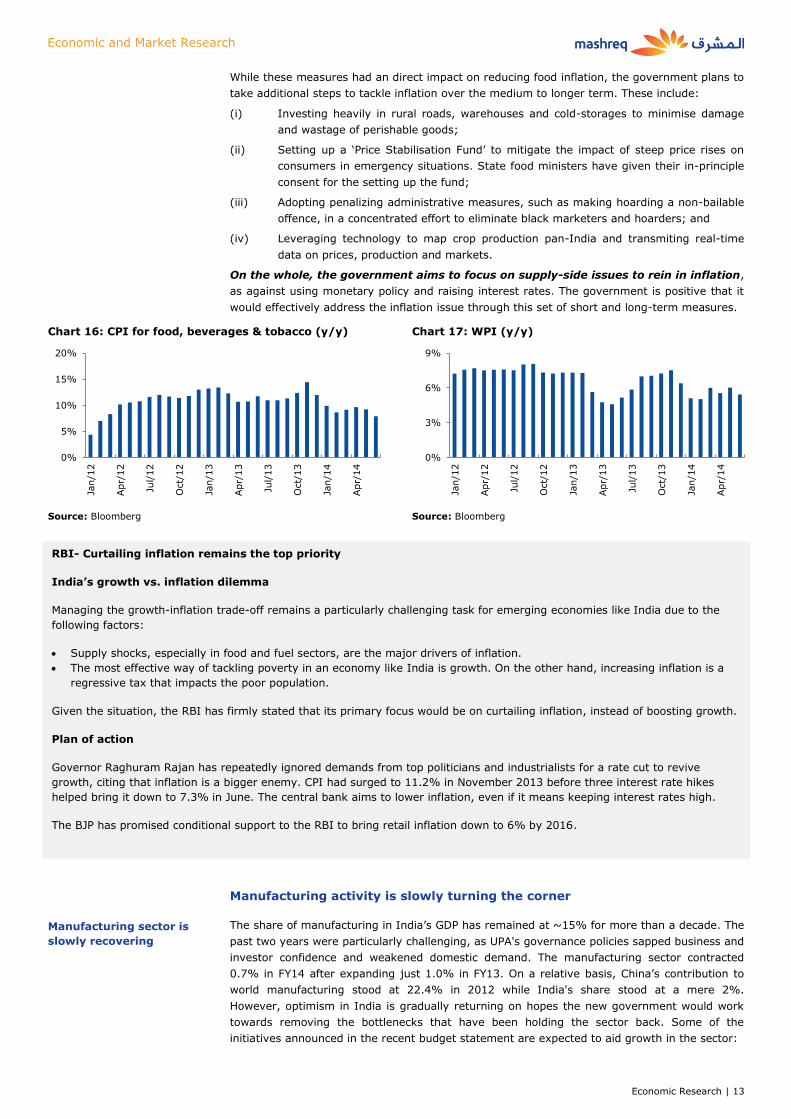
...and inflationary pressures are easing, yet risks remain
Lately, stubbornly high inflation has been showing signs of easing mainly on account of a
decline in prices of food items. However, it remains beyond the RBI’s comfort zone. The CPI
rose at a rate of 7.31% y/y in June, the slowest since the series started in January 2012, while
the WPI increased 5.43% y/y, slower than the 6.01% y/y rise recorded in May. However,
inflation in fuel and power items remained high due to the rationalization of electricity tariff in
many states and the revised policy of allowing greater pass-through in diesel prices. Food
prices fell due to some steps taken by the NDA:
(i) Cracking down on hoarders to maintain food prices;
(ii) Imposing minimum export price (MEP) on the export of staples in order to increase
domestic availability;
(iii) Delisting fruits and vegetables from APMC so that they are released into the open
market;
-81.73 -5%
-4%
-3%
-2%
-1%
0%
-100
-80
-60
-40
-20
0 2
00
7
20
08
20
09
20
10
20
11
20
12
20
13
20
14
E
20
15
E
20
16
E
20
17
E
20
18
E
20
19
E
USD
bn
Current account balance % of GDP
-10%
0%
10%
20%
30%
2007
2008
2009
2010
2011
2012
2013
2014E
2015E
2016E
2017E
2018E
2019E
Volume of exports Volume of imports
The government has a
tough fiscal deficit target
Inflation has edged
lower, but remains above
the central bank’s target
Economic and Market Research
Economic Research | 13
While these measures had an direct impact on reducing food inflation, the government plans to
take additional steps to tackle inflation over the medium to longer term. These include:
(i) Investing heavily in rural roads, warehouses and cold-storages to minimise damage
and wastage of perishable goods;
(ii) Setting up a ‘Price Stabilisation Fund’ to mitigate the impact of steep price rises on
consumers in emergency situations. State food ministers have given their in-principle
consent for the setting up the fund;
(iii) Adopting penalizing administrative measures, such as making hoarding a non-bailable
offence, in a concentrated effort to eliminate black marketers and hoarders; and
(iv) Leveraging technology to map crop production pan-India and transmiting real-time
data on prices, production and markets.
On the whole, the government aims to focus on supply-side issues to rein in inflation,
as against using monetary policy and raising interest rates. The government is positive that it
would effectively address the inflation issue through this set of short and long-term measures.
Chart 16: CPI for food, beverages & tobacco (y/y) Chart 17: WPI (y/y)
Source: Bloomberg Source: Bloomberg
Manufacturing activity is slowly turning the corner
The share of manufacturing in India’s GDP has remained at ~15% for more than a decade. The
past two years were particularly challenging, as UPA's governance policies sapped business and
investor confidence and weakened domestic demand. The manufacturing sector contracted
0.7% in FY14 after expanding just 1.0% in FY13. On a relative basis, China’s contribution to
world manufacturing stood at 22.4% in 2012 while India's share stood at a mere 2%.
However, optimism in India is gradually returning on hopes the new government would work
towards removing the bottlenecks that have been holding the sector back. Some of the
initiatives announced in the recent budget statement are expected to aid growth in the sector:
0%
5%
10%
15%
20%
Jan/1
2
Apr/
12
Jul/
12
Oct/
12
Jan/1
3
Apr/
13
Jul/
13
Oct/
13
Jan/1
4
Apr/
14 0%
3%
6%
9%
Jan/1
2
Apr/
12
Jul/
12
Oct/
12
Jan/1
3
Apr/
13
Jul/
13
Oct/
13
Jan/1
4
Apr/
14
Manufacturing sector is
slowly recovering
RBI- Curtailing inflation remains the top priority
India’s growth vs. inflation dilemma
Managing the growth-inflation trade-off remains a particularly challenging task for emerging economies like India due to the
following factors:
Supply shocks, especially in food and fuel sectors, are the major drivers of inflation.
The most effective way of tackling poverty in an economy like India is growth. On the other hand, increasing inflation is a
regressive tax that impacts the poor population.
Given the situation, the RBI has firmly stated that its primary focus would be on curtailing inflation, instead of boosting growth.
Plan of action
Governor Raghuram Rajan has repeatedly ignored demands from top politicians and industrialists for a rate cut to revive
growth, citing that inflation is a bigger enemy. CPI had surged to 11.2% in November 2013 before three interest rate hikes
helped bring it down to 7.3% in June. The central bank aims to lower inflation, even if it means keeping interest rates high.
The BJP has promised conditional support to the RBI to bring retail inflation down to 6% by 2016.

Economic and Market Research
Economic Research | 14
(i) Relaxation in foreign investment restrictions in insurance and defense sectors from
26% to 49%;
(ii) Tax breaks to the power sector; and
(iii) Overhaul in government subsidies and a better-than-expected fiscal deficit target
would restore investor confidence.
In recent months, a few economic indicators have registered improvement in manufacturing
activity and business confidence. HSBC’s manufacturing PMI showed activity levels rose in May
and June. Exports increased more than 10% for the first time in eight months in May while
output of infrastructure industries also showed expansion. Further, industrial production grew
4.7% in May. This is the highest rate of growth since October 2012 and significantly exceeds
estimates of a 3.8% rise.
Chart 18: HSBC manufacturing and services PMI Chart 19: Growth in industrial production
Source: Bloomberg Source: Bloomberg
Overall, India is poised to recover from sub-5% levels in FY15
According to the NDA government’s first economic survey, India is expected to grow 5.4-5.9%
in FY15. The economy is projected to take at least a couple of years to expand beyond
an annual rate of 7-8% as this would require restoration of domestic macroeconomic
stability and higher economic efficiency. To achieve this, the government would have to
persistently focus on fiscal consolidation and removal of structural constraints.
For the current year, institutional reforms (which would help speed up implementation of large
projects) and a stronger-than-expected recovery in advanced economies would support growth
in the Indian economy. However, the play out of certain factors would result in growth leaning
towards the lower side of the 5.4-5.9% range. These factors include:
(i) Initiatives to revive the investment cycle, including faster project clearances and
incentives provided to the industry, would take longer to show results;
(ii) High inflation levels may limit the RBI’s room to reduce policy rates;
(iii) Subdued growth outlook in some economies, especially top trading partner China; and
(iv) Expectation of a shortfall in monsoon rains.
Nonetheless, the improved post-election business sentiment is widely expected to offset some
of the negative impact of these factors.
The IMF’s World Economic Outlook (WEO) update in July downgraded its previously forecast
expansion for the global economy in 2014. The revision was driven by slower growth in the US,
Russia and some developing economies. However, IMF retained its GDP forecast for India at
5.4% for FY15 and 6.4% for FY16.
40
45
50
55
60
Jan/1
2
Apr/
12
Jul/
12
Oct/
12
Jan/1
3
Apr/
13
Jul/
13
Oct/
13
Jan/1
4
Apr/
14
Manufacturing PMI Services PMI
-5%
0%
5%
10%
Jan/1
2
Apr/
12
Jul/
12
Oct/
12
Jan/1
3
Apr/
13
Jul/
13
Oct/
13
Jan/1
4
Apr/
14
Economy is expected to
recover gradually as the
new government
addresses structural
constraints
Economic and Market Research
Economic Research | 15
Markets Rallied on Growing Optimism
Equity markets scale record highs
Indian stock markets have witnessed bumper returns over the past one year. The Sensex
posted the highest returns in 1H14 (+26.3%) among major developed and emerging market
indices worldwide. This compares with a 4.5% increase in the MSCI World index over the same
period. The fresh highs in the Sensex came amid optimism the country's newly elected
government would implement sweeping economic reforms and stimulate investments.
Continued inflows from FIIs and positive cues from global equity markets also supported gains.
FIIs pumped in more than USD20 billion into the Indian market in 1H14, with net equity
inflows totaling USD9.96 billion (INR598 billion). This compares with net inflows of USD10.2
billion (INR622.9 billion) over the full-year 2013.
The first spurt of positivity in Indian markets came with the appointment of former IMF chief
economist Raghuram Rajan as the governer of RBI in September 2013. He turned the central
bank’s focus towards bringing down inflation to improve investor confidence and raised interest
rates by a total of 75 bps after taking the RBI’s helm. While Mr. Rajan’s appointment marked
the beginning of the rally in Sensex, anticipation of BJP’s victory took over as the primary
reason since the beginning of 2014. Overall, the stock market performance reflected an
outstanding recovery after a long period of economic slowdown.
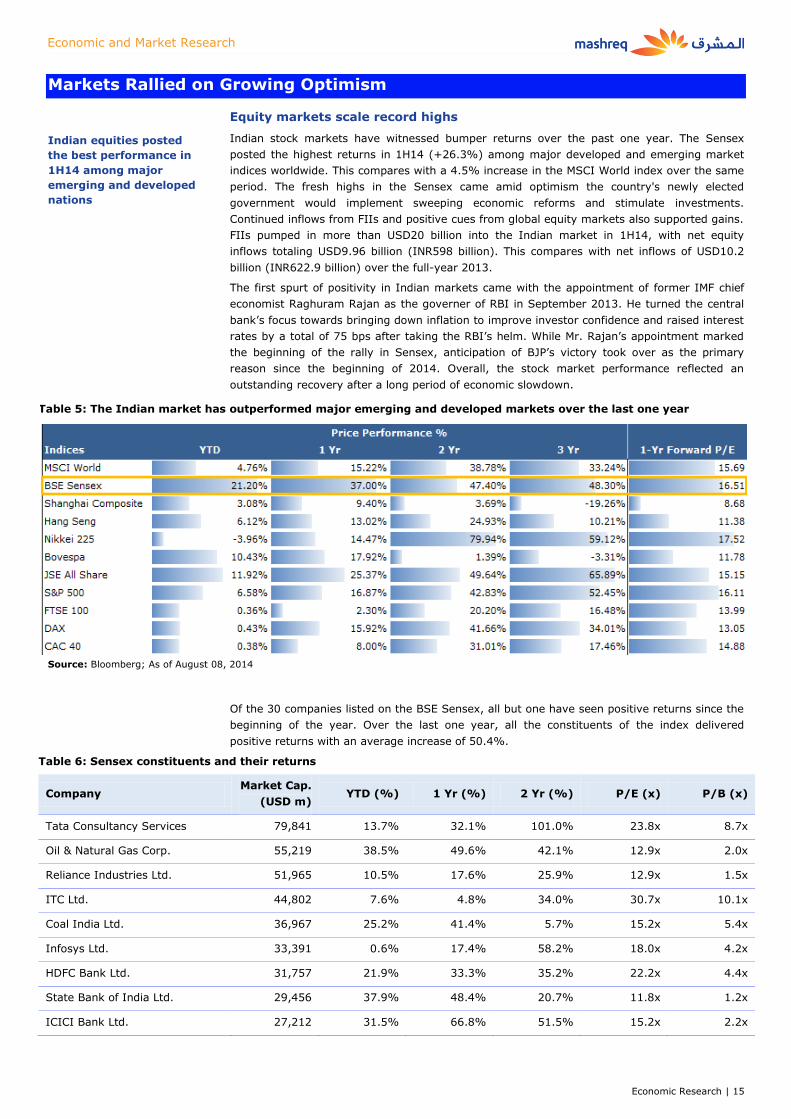
Table 5: The Indian market has outperformed major emerging and developed markets over the last one year
Source: Bloomberg; As of August 08, 2014
Of the 30 companies listed on the BSE Sensex, all but one have seen positive returns since the
beginning of the year. Over the last one year, all the constituents of the index delivered
positive returns with an average increase of 50.4%.
Table 6: Sensex constituents and their returns
Company Market Cap.
(USD m) YTD (%) 1 Yr (%) 2 Yr (%) P/E (x) P/B (x)
Tata Consultancy Services 79,841 13.7% 32.1% 101.0% 23.8x 8.7x
Oil & Natural Gas Corp. 55,219 38.5% 49.6% 42.1% 12.9x 2.0x
Reliance Industries Ltd. 51,965 10.5% 17.6% 25.9% 12.9x 1.5x
ITC Ltd. 44,802 7.6% 4.8% 34.0% 30.7x 10.1x
Coal India Ltd. 36,967 25.2% 41.4% 5.7% 15.2x 5.4x
Infosys Ltd. 33,391 0.6% 17.4% 58.2% 18.0x 4.2x
HDFC Bank Ltd. 31,757 21.9% 33.3% 35.2% 22.2x 4.4x
State Bank of India Ltd. 29,456 37.9% 48.4% 20.7% 11.8x 1.2x
ICICI Bank Ltd. 27,212 31.5% 66.8% 51.5% 15.2x 2.2x
Indian equities posted
the best performance in
1H14 among major
emerging and developed
nations
Economic and Market Research
Economic Research | 16
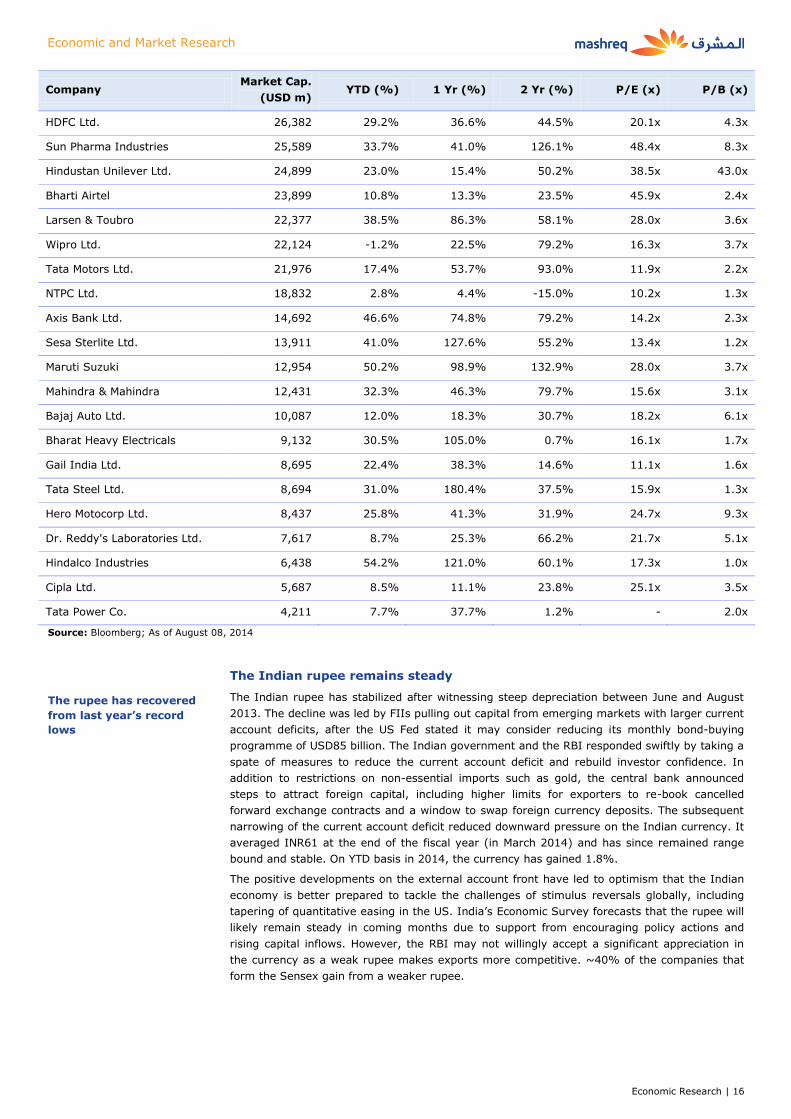
Company Market Cap.
(USD m) YTD (%) 1 Yr (%) 2 Yr (%) P/E (x) P/B (x)
HDFC Ltd. 26,382 29.2% 36.6% 44.5% 20.1x 4.3x
Sun Pharma Industries 25,589 33.7% 41.0% 126.1% 48.4x 8.3x
Hindustan Unilever Ltd. 24,899 23.0% 15.4% 50.2% 38.5x 43.0x
Bharti Airtel 23,899 10.8% 13.3% 23.5% 45.9x 2.4x
Larsen & Toubro 22,377 38.5% 86.3% 58.1% 28.0x 3.6x
Wipro Ltd. 22,124 -1.2% 22.5% 79.2% 16.3x 3.7x
Tata Motors Ltd. 21,976 17.4% 53.7% 93.0% 11.9x 2.2x
NTPC Ltd. 18,832 2.8% 4.4% -15.0% 10.2x 1.3x
Axis Bank Ltd. 14,692 46.6% 74.8% 79.2% 14.2x 2.3x
Sesa Sterlite Ltd. 13,911 41.0% 127.6% 55.2% 13.4x 1.2x
Maruti Suzuki 12,954 50.2% 98.9% 132.9% 28.0x 3.7x
Mahindra & Mahindra 12,431 32.3% 46.3% 79.7% 15.6x 3.1x
Bajaj Auto Ltd. 10,087 12.0% 18.3% 30.7% 18.2x 6.1x
Bharat Heavy Electricals 9,132 30.5% 105.0% 0.7% 16.1x 1.7x
Gail India Ltd. 8,695 22.4% 38.3% 14.6% 11.1x 1.6x
Tata Steel Ltd. 8,694 31.0% 180.4% 37.5% 15.9x 1.3x
Hero Motocorp Ltd. 8,437 25.8% 41.3% 31.9% 24.7x 9.3x
Dr. Reddy's Laboratories Ltd. 7,617 8.7% 25.3% 66.2% 21.7x 5.1x
Hindalco Industries 6,438 54.2% 121.0% 60.1% 17.3x 1.0x
Cipla Ltd. 5,687 8.5% 11.1% 23.8% 25.1x 3.5x
Tata Power Co. 4,211 7.7% 37.7% 1.2% - 2.0x
Source: Bloomberg; As of August 08, 2014
The Indian rupee remains steady
The Indian rupee has stabilized after witnessing steep depreciation between June and August
2013. The decline was led by FIIs pulling out capital from emerging markets with larger current
account deficits, after the US Fed stated it may consider reducing its monthly bond-buying
programme of USD85 billion. The Indian government and the RBI responded swiftly by taking a
spate of measures to reduce the current account deficit and rebuild investor confidence. In
addition to restrictions on non-essential imports such as gold, the central bank announced
steps to attract foreign capital, including higher limits for exporters to re-book cancelled
forward exchange contracts and a window to swap foreign currency deposits. The subsequent
narrowing of the current account deficit reduced downward pressure on the Indian currency. It
averaged INR61 at the end of the fiscal year (in March 2014) and has since remained range
bound and stable. On YTD basis in 2014, the currency has gained 1.8%.
The positive developments on the external account front have led to optimism that the Indian
economy is better prepared to tackle the challenges of stimulus reversals globally, including
tapering of quantitative easing in the US. India’s Economic Survey forecasts that the rupee will
likely remain steady in coming months due to support from encouraging policy actions and
rising capital inflows. However, the RBI may not willingly accept a significant appreciation in
the currency as a weak rupee makes exports more competitive. ~40% of the companies that
form the Sensex gain from a weaker rupee.
The rupee has recovered
from last year’s record
lows
Economic and Market Research
Economic Research | 17
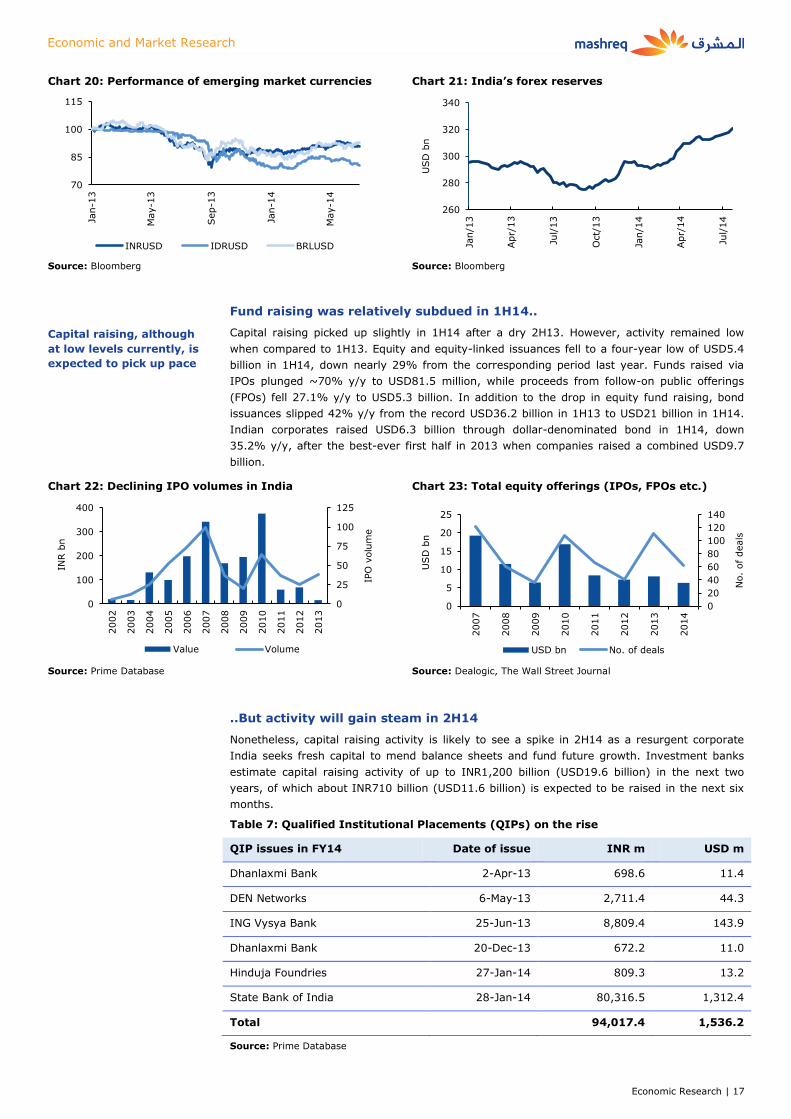
Chart 20: Performance of emerging market currencies Chart 21: India’s forex reserves
Source: Bloomberg Source: Bloomberg
Fund raising was relatively subdued in 1H14..
Capital raising picked up slightly in 1H14 after a dry 2H13. However, activity remained low
when compared to 1H13. Equity and equity-linked issuances fell to a four-year low of USD5.4
billion in 1H14, down nearly 29% from the corresponding period last year. Funds raised via
IPOs plunged ~70% y/y to USD81.5 million, while proceeds from follow-on public offerings
(FPOs) fell 27.1% y/y to USD5.3 billion. In addition to the drop in equity fund raising, bond
issuances slipped 42% y/y from the record USD36.2 billion in 1H13 to USD21 billion in 1H14.
Indian corporates raised USD6.3 billion through dollar-denominated bond in 1H14, down
35.2% y/y, after the best-ever first half in 2013 when companies raised a combined USD9.7
billion.
Chart 22: Declining IPO volumes in India Chart 23: Total equity offerings (IPOs, FPOs etc.)
Source: Prime Database Source: Dealogic, The Wall Street Journal
..But activity will gain steam in 2H14
Nonetheless, capital raising activity is likely to see a spike in 2H14 as a resurgent corporate
India seeks fresh capital to mend balance sheets and fund future growth. Investment banks
estimate capital raising activity of up to INR1,200 billion (USD19.6 billion) in the next two
years, of which about INR710 billion (USD11.6 billion) is expected to be raised in the next six
months.
Table 7: Qualified Institutional Placements (QIPs) on the rise
QIP issues in FY14 Date of issue INR m USD m
Dhanlaxmi Bank 2-Apr-13 698.6 11.4
DEN Networks 6-May-13 2,711.4 44.3
ING Vysya Bank 25-Jun-13 8,809.4 143.9
Dhanlaxmi Bank 20-Dec-13 672.2 11.0
Hinduja Foundries 27-Jan-14 809.3 13.2
State Bank of India 28-Jan-14 80,316.5 1,312.4
Total 94,017.4 1,536.2
Source: Prime Database
70
85
100
115
Jan-1
3
May-1
3
Sep-1
3
Jan-1
4
May-1
4
INRUSD IDRUSD BRLUSD
260
280
300
320
340
Jan/1
3
Apr/
13
Jul/
13
Oct/
13
Jan/1
4
Apr/
14
Jul/
14
USD
bn
0
25
50
75
100
125
0
100
200
300
400
2002
2003
2004
2005
2006
2007
2008
2009
2010
2011
2012
2013
IPO
volu
me
INR b
n
Value Volume
0
20
40
60
80
100
120
140
0
5
10
15
20
25
2007
2008
2009
2010
2011
2012
2013
2014
No.
of
deals
USD
bn
USD bn No. of deals
Capital raising, although
at low levels currently, is
expected to pick up pace

Economic and Market Research
Economic Research | 18
FY15 QIP issues (April onwards) Date of issue INR m USD m
SKS Microfinance 19-May-14 4,000.0 65.4
YES Bank 29-May-14 29,420.8 480.7
KSK Energy Ventures 2-Jun-14 400.0 6.5
Idea Cellular 5-Jun-14 30,000.0 490.2
Reliance Communications 25-Jun-14 48,000.0 784.3
Total 115,420.8 1,886.0
Source: Prime Database
While IPO volumes have remained passive, recent months have seen a rise in
popularity of QIPs. QIPs allow listed companies to sell shares directly to institutions without
making a public offer. An increasing number of companies attempting to mobilise capital in the
near future are expected to raise funds through QIPs in a bid to lower the high cost of capital
and strengthen balance sheets. In fact, total QIPs in the first three months of FY15, at INR125
billlion (USD2.0 billion), already exceeded those in the entire FY14, at INR94 billion (USD1.5
billion). Lower cost, fewer regulatory approvals and shorter time duration to obtain funds are
some of the reasons for corporates queueing up for QIPs.
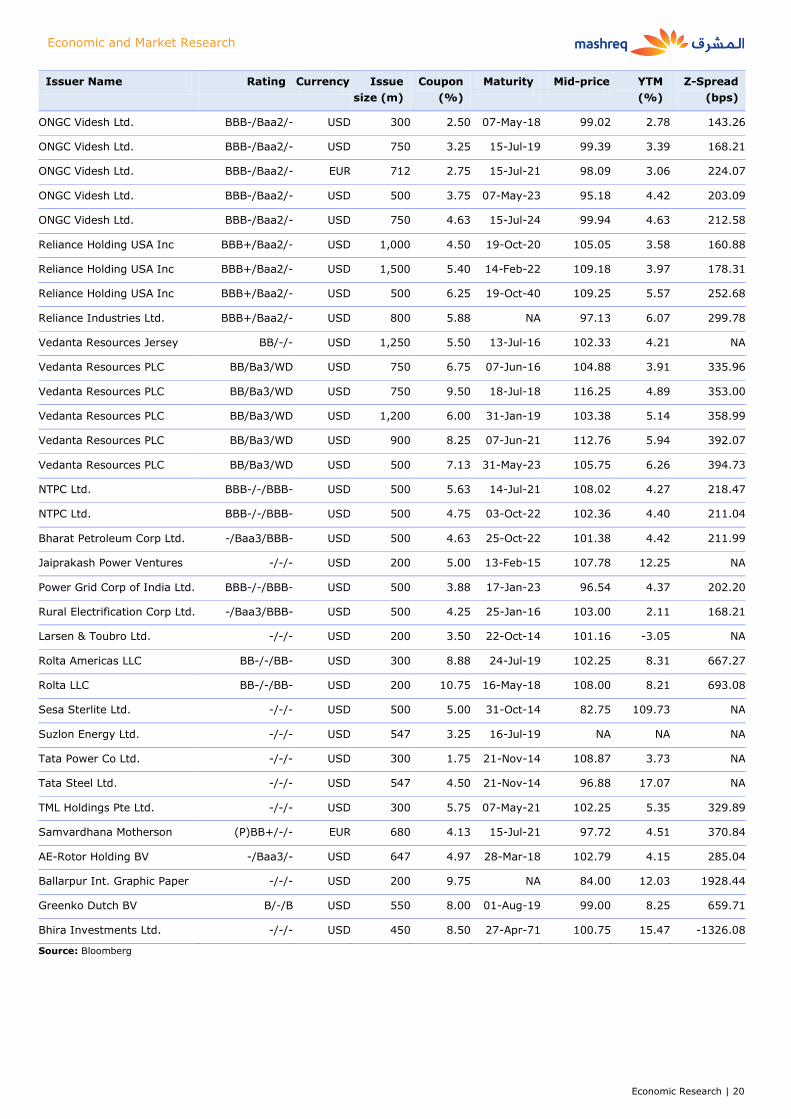
Further, Indian companies have been increasingly tapping international bond
markets for debt financing. Lower interest rates across developed markets, growing
investor appetite for Indian bonds and an attempt to spread exposures across different
currencies is boosting foreign currency denominated bond issuances in India.
Table 8: Foreign currency denominated debt issuances by Indian corporates/financials
Issuer Name Rating Currency Issue
size (m)
Coupon
(%)
Maturity Mid-price YTM
(%)
Z-Spread
(bps)
ABJA Investment BB/-/BB+ USD 500 4.85 31-Jan-20 102.15 4.40 258.85
ABJA Investment BB/-/BB+ USD 1,000 5.95 31-Jul-24 100.63 5.87 339.50
Axis Bank Ltd./Dubai BBB-/Baa2/BBB- USD 350 5.25 30-Sep-15 103.98 1.63 130.11
Axis Bank Ltd./Dubai BBB-/Baa2/BBB- USD 500 4.75 02-May-16 104.43 2.08 156.37
Axis Bank Ltd./Dubai BBB-/Baa2/BBB- USD 750 5.13 05-Sep-17 105.35 3.26 218.56
Bank of Baroda/London -/Baa3/BBB- USD 350 4.75 07-Oct-15 103.35 1.75 142.01
Bank of Baroda/London -/Baa3/BBB- USD 500 5.00 24-Aug-16 105.52 2.18 153.95
Bank of Baroda/London -/Baa3/BBB- USD 1,000 4.88 23-Jul-19 105.13 3.73 203.70
Bank of Baroda/London NR/Ba2/B+ USD 300 6.63 25-May-22 103.25 3.80 438.92
Bank of India/London BBB-/Baa3/- USD 750 4.75 30-Sep-15 103.35 1.70 137.54
Bank of India/London BBB-/Baa3/- USD 500 3.63 21-Sep-18 101.79 3.15 168.71
Bank of India/London BBB-/Baa3/- USD 500 6.25 16-Feb-21 111.11 4.27 226.70
Canara Bank/London -/Baa3/BBB- USD 500 5.25 18-Oct-18 106.93 3.45 197.72
Export-Import Bank of India BBB-/Baa3/- USD 500 4.00 07-Aug-17 104.73 2.34 128.72
Export-Import Bank of India BBB-/Baa3/- USD 500 3.88 02-Oct-19 102.40 3.36 160.85
Export-Import Bank of India BBB-/Baa3/- USD 750 4.00 14-Jan-23 100.01 4.00 165.11
HDFC Bank Ltd./Bahrain BBB-/Baa2/- USD 570 3.00 30-Nov-16 101.86 2.16 139.80
HDFC Bank Ltd./Bahrain BBB-/Baa2/- USD 500 3.00 06-Mar-18 100.47 2.86 157.99
ICICI Bank Ltd. BB/Ba2/B+ USD 750 6.38 30-Apr-22 103.88 3.46 389.51
A large number of
companies are opting for
QIPs to raise capital

Economic and Market Research
Economic Research | 19
Issuer Name Rating Currency Issue
size (m)
Coupon
(%)
Maturity Mid-price YTM
(%)
Z-Spread
(bps)
ICICI Bank Ltd. BB/Ba3/- USD 340 7.25 NA 99.75 3.71 665.16
ICICI Bank Ltd./Bahrain BBB-/Baa2/- USD 750 5.50 25-Mar-15 102.47 1.35 111.87
ICICI Bank Ltd./Dubai BBB-/Baa2/- USD 1,000 4.75 25-Nov-16 105.58 2.21 146.28
ICICI Bank Ltd./Dubai BBB-/Baa2/BBB- USD 1,000 4.70 21-Feb-18 105.62 3.00 174.36
ICICI Bank Ltd./Dubai BBB-/Baa2/BBB- USD 1,000 4.80 22-May-19 105.83 3.46 181.62
ICICI Bank Ltd./Hong Kong BBB-/Baa2/- USD 500 5.00 15-Jan-16 104.52 1.73 131.65
ICICI Bank Ltd./Hong Kong BBB-/Baa2/BBB- USD 1,000 5.75 16-Nov-20 109.58 4.00 203.35
IDBI Bank Ltd./DIFC Dubai BB+/Baa3/BBB- USD 350 4.75 05-Feb-16 103.42 2.36 191.73
IDBI Bank Ltd./DIFC Dubai BB+/Baa3/BBB- USD 500 4.38 26-Mar-18 102.67 3.58 229.11
IDBI Bank Ltd./DIFC Dubai BB+/Baa3/BBB- USD 500 3.75 25-Jan-19 99.47 3.88 231.34
IDBI Bank Ltd./DIFC Dubai BB+/Baa3/BBB- USD 300 5.00 25-Sep-19 104.08 4.10 237.37
Indian Overseas Bank/HK BBB-/(P)Baa3/- USD 500 5.00 19-Oct-16 105.49 2.38 167.72
Indian Overseas Bank/HK BBB-/Baa3/- USD 500 4.63 21-Feb-18 103.84 3.45 219.83
Indian Railway Finance BBB-/Baa3/BBB- USD 300 3.42 10-Oct-17 102.86 2.46 133.74
Indian Railway Finance BBB-/Baa3/BBB- USD 500 3.92 26-Feb-19 103.08 3.18 158.90
State Bank of India BB/B1/B USD 400 6.44 NA 98.50 3.08 610.22
SBI London BBB-/Baa3/BBB- USD 850 4.50 23-Oct-14 100.61 1.07 88.28
SBI London BBB-/Baa3/- USD 1,000 4.50 27-Jul-15 102.90 1.38 109.63
SBI London BBB-/Baa3/- EUR 978 4.50 30-Nov-15 104.99 0.58 NA
SBI London BBB-/Baa3/BBB- USD 1,250 4.13 01-Aug-17 103.05 3.03 199.01
SBI London BBB-/Baa3/BBB- USD 1,000 3.25 18-Apr-18 100.88 2.99 167.35
SBI London BBB-/Baa3/- USD 750 3.62 17-Apr-19 101.27 3.32 169.38
SBI London BBB-/Baa3/- USD 500 4.88 17-Apr-24 102.90 4.50 202.65
Syndicate Bank/London BBB-/Baa3/- USD 500 4.75 06-Nov-16 104.69 2.56 183.04
Syndicate Bank/London BBB-/Baa3/- USD 500 4.13 12-Apr-18 102.28 3.45 214.65
Syndicate Bank/London BBB-/Baa3/- USD 400 3.88 04-Dec-19 100.21 3.83 203.98
Union Bank of India/HK BBB-/Baa3/- USD 350 4.63 22-Aug-17 103.57 3.37 230.18
Union Bank of India/HK BBB-/Baa3/- USD 350 3.63 25-Oct-18 101.53 3.23 173.53
Union Bank of India/HK BBB-/Baa3/- USD 350 4.50 28-Oct-19 103.24 3.80 204.67
Bharti Airtel Netherlands BBB-/Baa3/BBB- EUR 1,377 4.00 10-Dec-18 107.29 2.21 171.46
Bharti Airtel Netherlands BBB-/Baa3/BBB- EUR 1,027 3.38 20-May-21 103.02 2.88 207.95
Bharti Airtel Netherlands BBB-/Baa3/BBB- USD 1,500 5.13 11-Mar-23 104.39 4.50 216.19
Bharti Airtel Netherlands BBB-/Baa3/BBB- USD 1,000 5.35 20-May-24 105.74 4.61 213.95
Indian Oil Corp Ltd. -/Baa3/BBB- USD 500 4.75 22-Jan-15 101.45 1.31 109.50
Indian Oil Corp Ltd. -/Baa3/BBB- USD 500 5.63 02-Aug-21 106.83 4.47 237.50
Indian Oil Corp Ltd. -/Baa3/BBB- USD 500 5.75 01-Aug-23 106.69 4.82 244.70
Oil India Ltd. -/Baa2/BBB- USD 500 3.88 17-Apr-19 102.44 3.30 167.65
Oil India Ltd. -/Baa2/BBB- USD 500 5.38 17-Apr-24 105.10 4.71 225.02
Economic and Market Research
Economic Research | 20
Issuer Name Rating Currency Issue
size (m)
Coupon
(%)
Maturity Mid-price YTM
(%)
Z-Spread
(bps)
ONGC Videsh Ltd. BBB-/Baa2/- USD 300 2.50 07-May-18 99.02 2.78 143.26
ONGC Videsh Ltd. BBB-/Baa2/- USD 750 3.25 15-Jul-19 99.39 3.39 168.21
ONGC Videsh Ltd. BBB-/Baa2/- EUR 712 2.75 15-Jul-21 98.09 3.06 224.07
ONGC Videsh Ltd. BBB-/Baa2/- USD 500 3.75 07-May-23 95.18 4.42 203.09
ONGC Videsh Ltd. BBB-/Baa2/- USD 750 4.63 15-Jul-24 99.94 4.63 212.58
Reliance Holding USA Inc BBB+/Baa2/- USD 1,000 4.50 19-Oct-20 105.05 3.58 160.88
Reliance Holding USA Inc BBB+/Baa2/- USD 1,500 5.40 14-Feb-22 109.18 3.97 178.31
Reliance Holding USA Inc BBB+/Baa2/- USD 500 6.25 19-Oct-40 109.25 5.57 252.68
Reliance Industries Ltd. BBB+/Baa2/- USD 800 5.88 NA 97.13 6.07 299.78
Vedanta Resources Jersey BB/-/- USD 1,250 5.50 13-Jul-16 102.33 4.21 NA
Vedanta Resources PLC BB/Ba3/WD USD 750 6.75 07-Jun-16 104.88 3.91 335.96
Vedanta Resources PLC BB/Ba3/WD USD 750 9.50 18-Jul-18 116.25 4.89 353.00
Vedanta Resources PLC BB/Ba3/WD USD 1,200 6.00 31-Jan-19 103.38 5.14 358.99
Vedanta Resources PLC BB/Ba3/WD USD 900 8.25 07-Jun-21 112.76 5.94 392.07
Vedanta Resources PLC BB/Ba3/WD USD 500 7.13 31-May-23 105.75 6.26 394.73
NTPC Ltd. BBB-/-/BBB- USD 500 5.63 14-Jul-21 108.02 4.27 218.47
NTPC Ltd. BBB-/-/BBB- USD 500 4.75 03-Oct-22 102.36 4.40 211.04
Bharat Petroleum Corp Ltd. -/Baa3/BBB- USD 500 4.63 25-Oct-22 101.38 4.42 211.99
Jaiprakash Power Ventures -/-/- USD 200 5.00 13-Feb-15 107.78 12.25 NA
Power Grid Corp of India Ltd. BBB-/-/BBB- USD 500 3.88 17-Jan-23 96.54 4.37 202.20
Rural Electrification Corp Ltd. -/Baa3/BBB- USD 500 4.25 25-Jan-16 103.00 2.11 168.21
Larsen & Toubro Ltd. -/-/- USD 200 3.50 22-Oct-14 101.16 -3.05 NA
Rolta Americas LLC BB-/-/BB- USD 300 8.88 24-Jul-19 102.25 8.31 667.27
Rolta LLC BB-/-/BB- USD 200 10.75 16-May-18 108.00 8.21 693.08
Sesa Sterlite Ltd. -/-/- USD 500 5.00 31-Oct-14 82.75 109.73 NA
Suzlon Energy Ltd. -/-/- USD 547 3.25 16-Jul-19 NA NA NA
Tata Power Co Ltd. -/-/- USD 300 1.75 21-Nov-14 108.87 3.73 NA
Tata Steel Ltd. -/-/- USD 547 4.50 21-Nov-14 96.88 17.07 NA
TML Holdings Pte Ltd. -/-/- USD 300 5.75 07-May-21 102.25 5.35 329.89
Samvardhana Motherson (P)BB+/-/- EUR 680 4.13 15-Jul-21 97.72 4.51 370.84
AE-Rotor Holding BV -/Baa3/- USD 647 4.97 28-Mar-18 102.79 4.15 285.04
Ballarpur Int. Graphic Paper -/-/- USD 200 9.75 NA 84.00 12.03 1928.44
Greenko Dutch BV B/-/B USD 550 8.00 01-Aug-19 99.00 8.25 659.71
Bhira Investments Ltd. -/-/- USD 450 8.50 27-Apr-71 100.75 15.47 -1326.08
Source: Bloomberg

Economic and Market Research
Economic Research | 21
Key Sectors Driving Economic Growth
Services and Industry to remain key growth drivers
Although initially an agrarian economy, India has undergone radical changes in the last two
decades. Growth over the past two decades is primarily attributed to development in the
service and industry sectors. As of FY13, the agricultural, industry and services sector of the
economy accounted for 14%, 26% and 60% of GDP, respectively.
Chart 24: Sector-wise contribution to GDP Chart 25: Sector-wise contribution to employment
Source: RBI Source: RBI
Agriculture plays an important, although decreasing, role in the Indian economy. Its
contribution to GDP has steadily dropped from 30% in early 1990s to 14% in FY13 due to
diversification and growth of the overall economy. However, the sector continues to be the
largest employment source and a key driver of socio-economic development. It provides
employment to ~51% of India’s total workforce. The five-year plans also continue to lay
special emphasis on agriculture and aim at steady improvements in application of modern
agricultural practices and provision of agricultural credit and subsidies in order to sustain the
growth in crop yield per unit area.
The industry sector’s share of GDP has remained steady over the past two decades. The
economic liberalisation in 1991 changed the sector’s landscape. It brought in foreign players,
eased trade restrictions and relaxed the rules governing FDI. The post-liberalisation era
witnessed greater demand and production of consumer goods, even as the Indian private
sector faced increasing domestic and foreign competition. The sector contributed 26% to GDP
in FY13. This is lower that the industry sector’s share in Thailand (36%), South Korea (31%)
and China (30%). However, employment in the sector has increased from 16% of the overall
workforce in 1990s to 22% in 2012.
India’s services sector has made swift strides in the last few years and emerged as the biggest
and fastest-growing sector of the economy. It contributes around 60% to India’s GDP. The
CAGR of services sector GDP at 8.5% for the period FY01-14 has also been higher than the
7.1% CAGR of overall GDP during the same period. In addition to GDP, the sector has also
contributed substantially to foreign investment flows, trade flows and employment. It covers a
wide array of activities, such as trading, transportation and communication, banking and
finance, real estate and housing and healthcare and education, among others.
0%
20%
40%
60%
80%
Agriculture &
Allied
Industry Services
FY00 FY06 FY13
0%
20%
40%
60%
80%
Agriculture &
Allied
Industry Services
FY00 FY06 FY12
The contribution of
agriculture to Indian GDP
is decreasing
Industry sector’s
contribution to GDP in
India is lower than that
in other comparable
developing countries
The services sector has
witnessed rapid growth
in the last few years

Economic and Market Research
Economic Research | 22
Growth Accelerators
With over 900 million telephone connections,
India is the world's second-largest telecom
market. The government has devised policies
to encourage further growth of the telecom
industry and use it as an effective channel to
increase inclusive growth.
Market dynamics are undergoing a change as
telecom operators devise innovative business
models (such as sharing infrastructure) to
boost margins.
India is also one of the world’s fastest-
growing IT services markets. Its rise has been
helped by its cost competitiveness and a
growing talent pool.
India’s Planning Commission has allocated
USD55 billion to health and family welfare in
the 12th Five-year Plan, about three times the
expenditure under the 11th Five-year Plan.
Healthcare spending is estimated to grow
14% annually driven by rising incomes,
government healthcare outlays and longer life
expectancy.
India is gaining popularity as a global
destination for medical tourism due to
substantially lower treatment costs.
Currently, India receives more than 230,000
foreign patients a year.
The RBI is carrying out reforms to strengthen
the Indian banking system by encouraging
increased competition in both the private and
public sectors.
Financial inclusion is a key priority of the Indian
government. The authorities are aiming at
ensuring access to banking and financial services
at affordable costs to India’s vast unbanked,
disadvantaged and low-income groups.
The banking sector is expected to create 2
million new jobs over the coming decade, helped
by issuance of new bank licences and efforts
towards expansion of financial services into rural
areas.
The infrastructure sector, which includes
electricity, telecom infrastructure, roads and
bridges, railways, water supply and sanitation,
ports, airports, and oil & gas, has been
accorded priority status by the government of
India. The central and state governments are
working towards building infrastructural
facilities that meet international norms.
The government estimated that USD1 trillion
would be spent on development of
infrastructure over 2012 to 2017. Of this, the
private sector’s contribution is expected to be
roughly 40%.
High infrastructure spending is expected to
provide counter-cyclical stimulus and revive
economic growth.
Infrastructure
Banking
Healthcare Telecom/IT Services H
e
a
l
t
h
c
a
r
e
T
e
l
e
c
o
m

Economic and Market Research
Economic Research | 23
Infrastructure – Helping Economic Revival
Sector Overview
Table 9: Key sector Statistics
India is going through a challenging period as GDP growth has slowed
to a decade low. In this backdrop, high infrastructure expenditure,
totaling about 10% of GDP, is expected to have a positive spiral effect
on GDP growth. The government of India has announced plans to
double infrastructure investments to USD1 trillion during the 12th Five-
year Plan (FY12-17). Close to half of this is targeted to be achieved
through private sector investment.
Growth Drivers
• Ambitious infrastructure growth plans: The Government of India
has set a massive target for infrastructure development in India to
boost the country's slowing economy. It plans to double investment
in infrastructure from INR20.5 trillion (USD335 billion) to INR40.9
trillion (USD668 billion) at FY07 prices during the 12th Five-year Plan
that stretches from 2012 to 2017.
• Innovative funding techniques: The government introduced
several initiatives to increase funding in the latest Union Budget:
o Banks would be allowed to raise long term funds for infra
projects with minimum regulatory requirements. These funds
will not attract standard rules like cash reserve ratio and
statutory liquidity ratio.
o India has emerged as the largest PPP market in the world with
over 900 projects in various stages of development. The FM
proposed setting up of an institution, called 3P India, with a
corpus of INR5 billion (USD81.7 million) to provide support to
mainstreaming PPPs. The 3P will work towards overhauling the
way PPP projects are conceived, bid and executed in India.
o The Union Budget proposed tax incentives for two new
investment instruments — Real Estate Investment Trusts
(REITs) and Infrastructure Investment Trusts (InvITs) — to help
attract long term funds from foreign and domestic investors.
The new investment products would be listed on stock
exchanges like shares of any company and allow retail and
institutional investors to buy or sell those securities.
Key Challenges
• Project delays: The government, in the past, has failed to meet set
targets due to various issues, including:
o Lengthy process of land acquisition
o Receiving regulatory approvals and environmental clearances
o Funding of projects
The delay caused due by these factors typically leads to cost overruns
and results in heavy project backlogs. For instance, the Centre for
Monitoring Indian Economy (CMIE) estimated that more than INR6
trillion (USD98 billion) worth of projects in India had been stalled as
of March 31, 2014. At least INR1.8 trillion (USD29.4 billion) of these
projects were road projects awaiting land and environmental
clearances. In this backdrop, achieving the targets set in the 12th Plan
appears to be a challenging task.
• Investment funding gap: Based on estimated funding flows from
various sources and the incremental investment required, the
Planning Commission stated that the 12th Plan would have a huge
funding gap. It would need to channelize an additional private sector
investment of about INR6.1 trillion (USD99.7 billion) over the Five-
year Plan.
Contribution to GDP (FY12-17E) 10%
Projected investment FY12-17 (USD) 1tn
Est. Private Sector Contribution 40%
Growth in value of roads and bridges 17.4%
Growth in capacity of ports 12.3%
Source: IBEF
* Price as of Feb 04, 2013
Chart 26: Infrastructure investment
Source: Planning Commission
Chart 27: Investments in 12th Plan
Source: Planning Commission
Chart 28: Private and public investment
Source: Planning Commission
5.20%
7.50%
10.00%
0%
2%
4%
6%
8%
10%
12%
10th Plan
(2003-07)
11th Plan
(2007-12)
12th Plan
(2012-17)
% o
f G
DP
Power,
31%
Telecom,
25%
Roads &
Bridges,
12%
Irrigation
, 10%
Railways,
7%
Oil &
Gas, 6%
0%
25%
50%
75%
100%
10th
Pla
n
FY07
FY08
FY09
FY10
FY11
FY12
11th
Pla
n
Private Investment Public Investment

Economic and Market Research
Economic Research | 24
Chart 29: Sector outperformers
• The CNX Infrastructure index posted one-year return of
45.4% and YTD return of 25.4% as on August 14, 2014.
• The top three companies in the index, namely, IRB
Infrastructure, Adani Ports and SEZ, and Reliance
Infrastructure, beat the sector index.
• IRB Infrastructure, Adani Ports and SEZ, and Reliance
Infrastructure posted one-year returns of 246.9%, 88.0%
and 100.0%, respectively, over the last one year.
Meanwhile, the YTD returns for the three companies
stood at 175.2%, 71.6% and 64.4%, respectively.
Source: Bloomberg
Table 10: Du Pont Analysis (FY13)
Net Profit Margin (%)
Total Asset Turnover
Leverage Ratio
ROE (%) Adjusted ROE (%)
Payout Ratio
IRB Infrastructure 15.10 0.31 3.94 18.21 17.63 23.88
Adani Ports and SEZ 45.38 0.15 4.19 27.45 22.62 13.03
Reliance Infrastructure 14.49 0.24 2.54 7.54 7.48 8.68
Source: Bloomberg
30
70
110
150
190
230
Jan 13 Jul 13 Jan 14 Aug 14
Rebased t
o 1
00
CNX Infra IRB Infrastructure
Adani Ports & SEZ Reliance Infrastructure

Economic and Market Research
Economic Research | 25
Banking – Undergoing a Tectonic Change
Sector Overview
Table 11: Key sector Statistics
India’s banking assets account for 63% of the nation's financial assets.
The banking sector plays a key role in economic and financial growth of
the country. The RBI is working on expanding the industry through
financial inclusion and priority sector lending. With focus on improving
the operational performance of banks through various reforms, the
sector appears to be on an upward growth trajectory.
Growth Drivers
• Healthy asset growth: Over the six years from FY07 to FY13, total
assets of commercial banks grew at a CAGR of 18.4%. Total credit
disbursed by scheduled commercial banks grew at a CAGR of 23%
during FY07-13 while total deposits of scheduled commercial banks
grew at a CAGR of 21% during FY07-13.
• Rise in NPAs on subdued economic activity: The asset quality of
commercial banks, particularly public sector banks, worsened over
the last two years due to significantly higher interest rates coupled
with an industrial contraction. Net NPA ratio of commercial banks
grew from 0.97% in FY11 to 1.68% in FY13. Public banks bear 90%
of India’s NPAs due to pressure to lend to priority sectors.
• Banking Reforms: The recent budget session drove expectations of
anticipated reforms in public sector banks.
o The FM estimated that public sector banks would need INR2.4
trillion (USD39.2 billion) of capital by 2018 to comply with Basel
III international regulatory norms. In order to raise additional
resources, the government would lower its stake in public sector
banks by selling shares to retail investors in a phased manner.
o The government also announced plans to give greater
independence to public sector banks, which form a major
portion (~73%) of the Indian banking industry’s assets.
o Further, it announced plans to set up six new debt recovery
tribunals in Chandigarh, Bangalore, Ernakulam, Dehradun,
Siliguri and Hyderabad in order to tackle rising non-performing
assets in public sector banks.
• Financial inclusion to play a key role in the near future: As per
the latest census, the percentage of households availing banking
services in India stood at 59% in 2011. The unbanked population
mainly belongs to rural areas or low income groups. Thus, in recent
years, the RBI, along with the government, have increased their
focus on providing formal banking services to this set of households.
• Capital injection: The government allocated INR112 billion (USD1.8
billion) for capital injection into public sector banks in its interim
budget in February 2014. The infusion is expected to help banks
boost lending amid a rise in NPAs.
Key Challenges
• Asset quality to remain weak in FY15: The weakness in banks'
asset quality is likely to persist in FY15 as economic recovery is still
tepid. However, regulatory measures are driving banks to increase
loan loss reserves on restructured loans. This is expected to boost
the total loan loss reserves of the system to nearly 70% of gross
NPAs (from the current level of 63%), according to Fitch’s India
Ratings & Research.
• Competition set to intensify: In August 2011, the RBI prepared
guidelines for licensing of new banks in the private sector. The
central bank processed applications after an almost decade-long
break, and granted banking licenses to IDFC (an infrastructure
finance group) and Bandhan Financial Services (a microfinance
group). RBI is also considering introducing separate licenses to
restrict bank operations in particular geographies and product
ranges. This is expected to allow banks to adapt to local needs.
Deposits to GDP (FY13) 67%
Credit to GDP (FY13) 53%
Total assets to GDP 100.2%
Unbanked population 41%
No. of scheduled commercial banks 157
Banking assets (USD tn) 1.8tn
Banking deposits (USD tn) 1.4tn
Source: RBI
* Price as of Feb 04, 2013
Chart 30: Growth in credit off-take
Source: IBEF
Chart 31: Growth in deposits
Source: IBEF
Chart 32: Gross NPAs and net NPA ratio
Source: RBI
300
600
900
1,200
1,500
FY07 FY08 FY09 FY10 FY11 FY12 FY13 FY14 U
SD
bn
CAGR: 22.8%
600
900
1,200
1,500
1,800
FY07 FY08 FY09 FY10 FY11 FY12 FY13 FY14
USD
bn
CAGR: 21.2%
0%
1%
2%
0
10
20
30
40
FY09 FY10 FY11 FY12 FY13
USD
bn
Gross NPAs Net NPA ratio
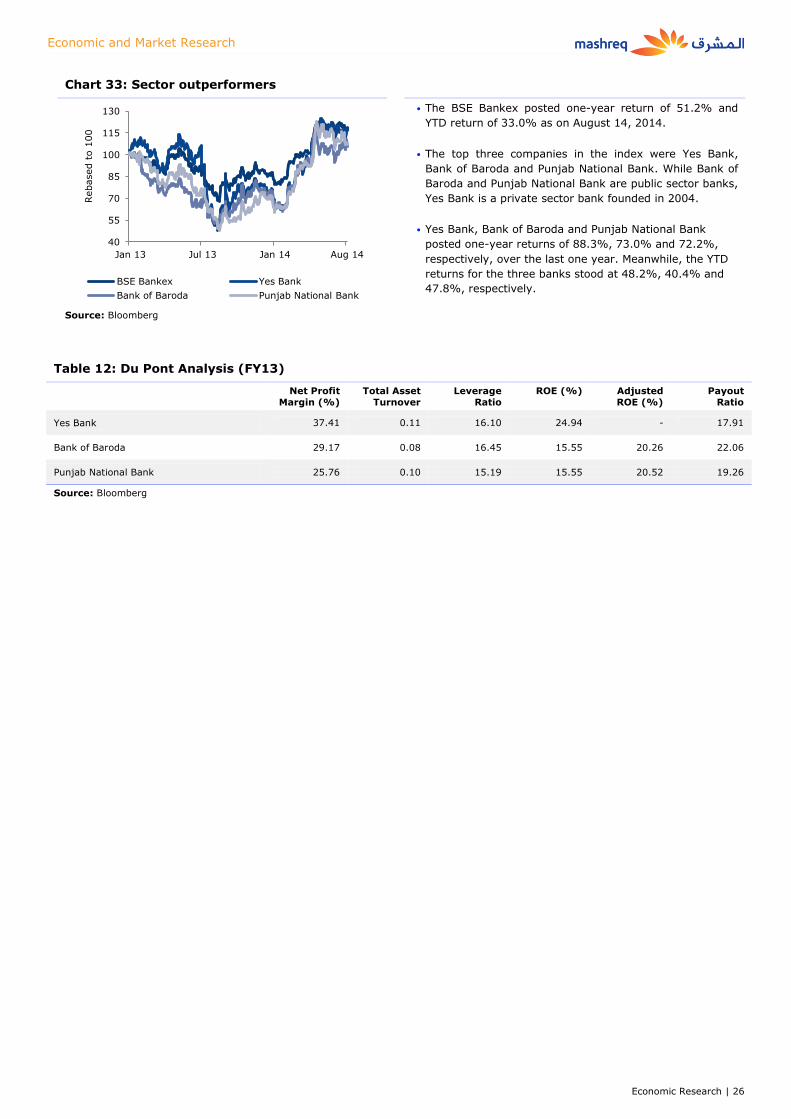
Economic and Market Research
Economic Research | 26
Chart 33: Sector outperformers
• The BSE Bankex posted one-year return of 51.2% and
YTD return of 33.0% as on August 14, 2014.
• The top three companies in the index were Yes Bank,
Bank of Baroda and Punjab National Bank. While Bank of
Baroda and Punjab National Bank are public sector banks,
Yes Bank is a private sector bank founded in 2004.
• Yes Bank, Bank of Baroda and Punjab National Bank
posted one-year returns of 88.3%, 73.0% and 72.2%,
respectively, over the last one year. Meanwhile, the YTD
returns for the three banks stood at 48.2%, 40.4% and
47.8%, respectively.
Source: Bloomberg
Table 12: Du Pont Analysis (FY13)
Net Profit
Margin (%)
Total Asset
Turnover
Leverage
Ratio
ROE (%) Adjusted
ROE (%)
Payout
Ratio
Yes Bank 37.41 0.11 16.10 24.94 - 17.91
Bank of Baroda 29.17 0.08 16.45 15.55 20.26 22.06
Punjab National Bank 25.76 0.10 15.19 15.55 20.52 19.26
Source: Bloomberg
40
55
70
85
100
115
130
Jan 13 Jul 13 Jan 14 Aug 14
Rebased t
o 1
00
BSE Bankex Yes Bank
Bank of Baroda Punjab National Bank
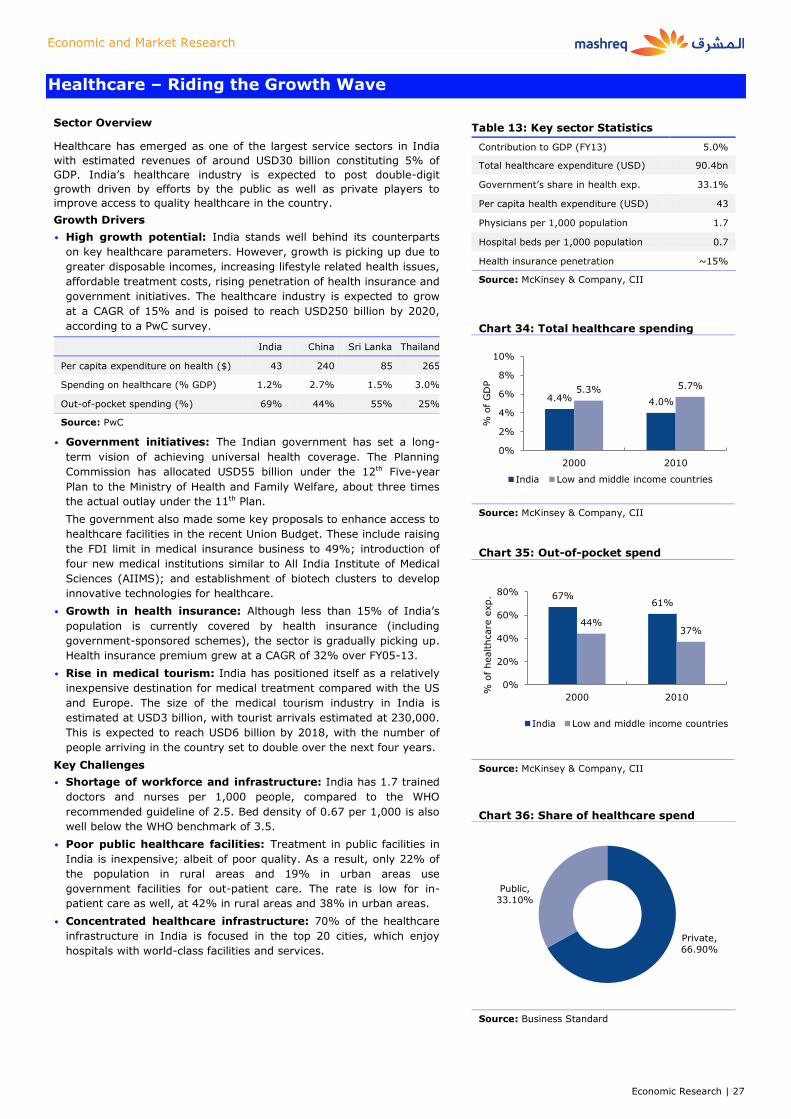
Economic and Market Research
Economic Research | 27
Healthcare – Riding the Growth Wave
Sector Overview
Table 13: Key sector Statistics
Healthcare has emerged as one of the largest service sectors in India
with estimated revenues of around USD30 billion constituting 5% of
GDP. India’s healthcare industry is expected to post double-digit
growth driven by efforts by the public as well as private players to
improve access to quality healthcare in the country.
Growth Drivers
• High growth potential: India stands well behind its counterparts
on key healthcare parameters. However, growth is picking up due to
greater disposable incomes, increasing lifestyle related health issues,
affordable treatment costs, rising penetration of health insurance and
government initiatives. The healthcare industry is expected to grow
at a CAGR of 15% and is poised to reach USD250 billion by 2020,
according to a PwC survey.
India China Sri Lanka Thailand
Per capita expenditure on health ($) 43 240 85 265
Spending on healthcare (% GDP) 1.2% 2.7% 1.5% 3.0%
Out-of-pocket spending (%) 69% 44% 55% 25%
Source: PwC
* Price as of Feb 04, 2013
* Price as of Feb 04, 2013
• Government initiatives: The Indian government has set a long-
term vision of achieving universal health coverage. The Planning
Commission has allocated USD55 billion under the 12th Five-year
Plan to the Ministry of Health and Family Welfare, about three times
the actual outlay under the 11th Plan.
The government also made some key proposals to enhance access to
healthcare facilities in the recent Union Budget. These include raising
the FDI limit in medical insurance business to 49%; introduction of
four new medical institutions similar to All India Institute of Medical
Sciences (AIIMS); and establishment of biotech clusters to develop
innovative technologies for healthcare.
• Growth in health insurance: Although less than 15% of India’s
population is currently covered by health insurance (including
government-sponsored schemes), the sector is gradually picking up.
Health insurance premium grew at a CAGR of 32% over FY05-13.
• Rise in medical tourism: India has positioned itself as a relatively
inexpensive destination for medical treatment compared with the US
and Europe. The size of the medical tourism industry in India is
estimated at USD3 billion, with tourist arrivals estimated at 230,000.
This is expected to reach USD6 billion by 2018, with the number of
people arriving in the country set to double over the next four years.
Key Challenges
• Shortage of workforce and infrastructure: India has 1.7 trained
doctors and nurses per 1,000 people, compared to the WHO
recommended guideline of 2.5. Bed density of 0.67 per 1,000 is also
well below the WHO benchmark of 3.5.
• Poor public healthcare facilities: Treatment in public facilities in
India is inexpensive; albeit of poor quality. As a result, only 22% of
the population in rural areas and 19% in urban areas use
government facilities for out-patient care. The rate is low for in-
patient care as well, at 42% in rural areas and 38% in urban areas.
• Concentrated healthcare infrastructure: 70% of the healthcare
infrastructure in India is focused in the top 20 cities, which enjoy
hospitals with world-class facilities and services.
Contribution to GDP (FY13) 5.0%
Total healthcare expenditure (USD) 90.4bn
Government’s share in health exp. 33.1%
Per capita health expenditure (USD) 43
Physicians per 1,000 population 1.7
Hospital beds per 1,000 population 0.7
Health insurance penetration ~15%
Source: McKinsey & Company, CII
Chart 34: Total healthcare spending
Source: McKinsey & Company, CII
Chart 35: Out-of-pocket spend
Source: McKinsey & Company, CII
Chart 36: Share of healthcare spend
Source: Business Standard
4.4% 4.0%
5.3% 5.7%
0%
2%
4%
6%
8%
10%
2000 2010
% o
f G
DP
India Low and middle income countries
67% 61%
44% 37%
0%
20%
40%
60%
80%
2000 2010 % o
f healthcare
exp.
India Low and middle income countries
Private,
66.90%
Public,
33.10%
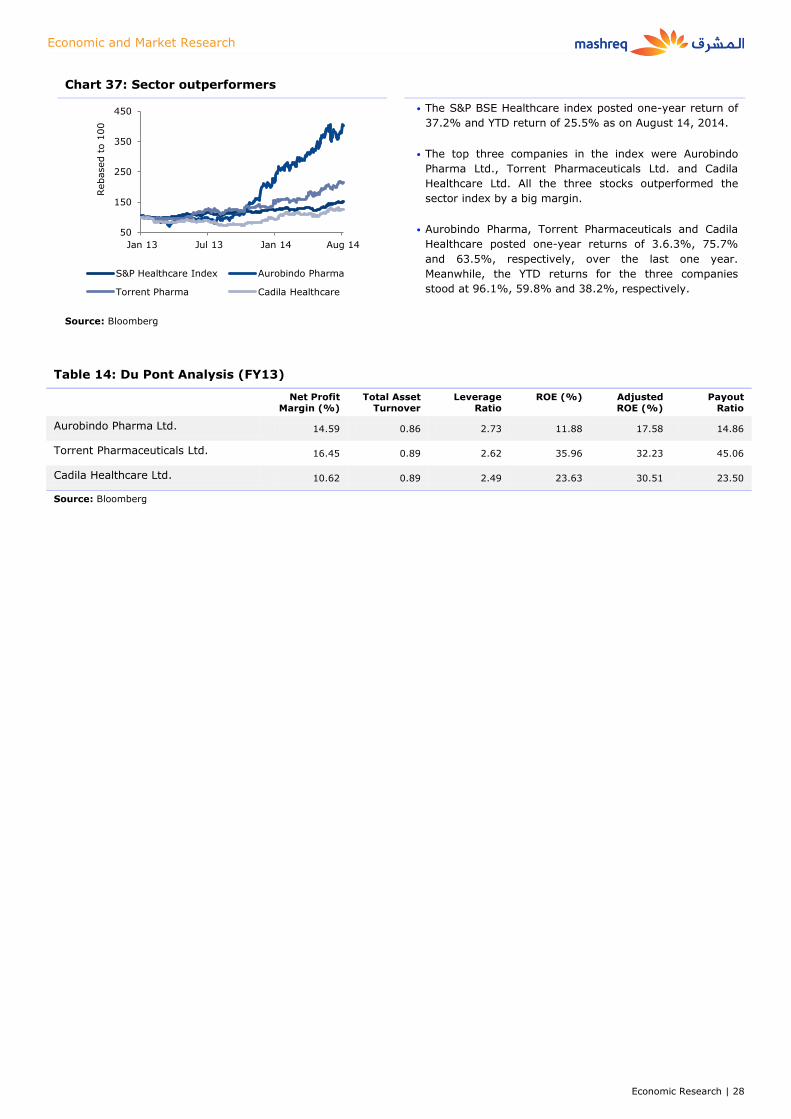
Economic and Market Research
Economic Research | 28
Chart 37: Sector outperformers
• The S&P BSE Healthcare index posted one-year return of
37.2% and YTD return of 25.5% as on August 14, 2014.
• The top three companies in the index were Aurobindo
Pharma Ltd., Torrent Pharmaceuticals Ltd. and Cadila
Healthcare Ltd. All the three stocks outperformed the
sector index by a big margin.
• Aurobindo Pharma, Torrent Pharmaceuticals and Cadila
Healthcare posted one-year returns of 3.6.3%, 75.7%
and 63.5%, respectively, over the last one year.
Meanwhile, the YTD returns for the three companies
stood at 96.1%, 59.8% and 38.2%, respectively.
Source: Bloomberg
Table 14: Du Pont Analysis (FY13)
Net Profit Margin (%)
Total Asset Turnover
Leverage Ratio
ROE (%) Adjusted ROE (%)
Payout Ratio
Aurobindo Pharma Ltd. 14.59 0.86 2.73 11.88 17.58 14.86
Torrent Pharmaceuticals Ltd. 16.45 0.89 2.62 35.96 32.23 45.06
Cadila Healthcare Ltd. 10.62 0.89 2.49 23.63 30.51 23.50
Source: Bloomberg
50
150
250
350
450
Jan 13 Jul 13 Jan 14 Aug 14
Rebased t
o 1
00
S&P Healthcare Index Aurobindo Pharma
Torrent Pharma Cadila Healthcare

Economic and Market Research
Economic Research | 29
IT & ITeS – Driven By a Fast Growing Digital Economy
Sector Overview
Table 15: Key sector Statistics
India’s IT & ITeS industry is primarily made up of four sub-
components: IT services, business process management (BPM),
software products & engineering services, and hardware. The industry
has a total market size of USD118 billion as of FY14 and grew at a
GAGR of 13.3% between FY08-14, as per National Association of
Software and Services Companies (NASSCOM). It is one of the largest
employment generators in the organized sector, directly employing
almost 3.1 million persons and indirectly employing around 8.9 million
as of FY14.
Growth Drivers
• Cloud computing/software-as-a-service (SaaS): SaaS is an
inexpensive yet sophisticated data analyzing tool, wherein
data/software is hosted centrally on a cloud and can be accessed
through a web browser. It is being used by firms to manage large
volumes of data in an inexpensive manner. As per NASSCOM,
growing popularity of cloud computing and SaaS will increase India’s
IT–BPO exports by 12-14% to USD84-87 billion in FY14.
• Mobile internet gives rise to multi-channel commerce: With
increasing penetration of smartphones (about 10% in FY13) and
tablets, companies are focusing on multi-channel commerce
strategies to reach out to its customers. This is expected to increase
domestic demand for IT & ITes services from Indian corporates to
tap the growing market. As per Internet and Mobile Association of
India (IAMAI), 17 million out of 121 million internet users in India
have shopped online. This number is expected to grow three-fold by
2015 due to increasing internet penetration and rising affordability of
PCs and smartphones.
• Increasing foreign investments: India’s IT & ITeS sector has
been able to attract significant foreign investments. Between April
2000 and February 2014, the sector attracted foreign investments to
the tune of USD9.89 billion.
• Increasing technology adoption: Rising technology adoption in
India’s domestic market, particularly within the government and the
small and medium business (SMB) sectors, is expected to drive
growth in the IT services sector within India in the coming years.
• Government initiatives: The 12th Five-year Plan aims to increase
the IT & ITeS sector’s contribution to development and growth,
particularly in terms of investment, exports, employment, and
contribution to GDP. The plan also targets retaining India’s
leadership position as a global IT-BPO destination as well as
consolidating and growing in mature as well as emerging markets.
Key Challenges
• Skill gap: The shortage of suitably skilled labor is emerging as a
challenge to growth in the IT & ITeS sector. According to NASSCOM,
over 3 million students are added to the Indian workforce annually.
However, only 25% of technical graduates and 10-15% of other
graduates are considered employable.
• Growing competition from developing countries: India’s IT &
ITeS sector is facing competition from several developing countries.
Although the EU, India, and the US hold the largest share in exports
of information services, new competitors such as China, Israel, and
the Philippines have recently emerged. Between 2005 and 2011,
information services grew at an average annual rate of 69% in the
Philippines, 28% in Sri Lanka, 59% in Ukraine, 27% in the Russian
Federation, 37% in Argentina, and 35% in Costa Rica. Actual export
revenues for these countries are relatively low. However, average
annual growth significantly exceeds average growth in the sector in
India and may increase competitive pressure over the long term.
Contribution to GDP 8.1%
Contribution to India’s exports 23-25%
Contribution to services exports 38%
Contribution to FDI 7%
Revenue by segments (USD bn):
IT services 63.7
BPM 23.6
Software products and services 17.7
Hardware 13.0
Source: NASSCOM
* Price as of Feb 04, 2013
Chart 38: IT & ITeS Sector revenues
Source: NASSCOM
Chart 39: Segment revenues (FY14)
Source: NASSCOM
Chart 40: Direct employment
Source: NASSCOM
0
50
100
FY10 FY11 FY12 FY13 FY14 U
SD
bn
Domestic Exports
IT
Services,
54%
BPM, 20%
Software
products/
services, 15%
Hardware,
11%
400
900
1400
1900
FY12 FY13 FY14
in '000s
IT Exports BPM Exports IT Domestic

Economic and Market Research
Economic Research | 30
Chart 41: Sector outperformers
• The S&P BSE IT index posted one-year return of 29.7%
and YTD return of 8.8% as on August 14, 2014.
• The top three companies in the index, namely, Persistent
Systems Ltd., Mindtree Ltd. and HCL Technologies Ltd.
outperformed the sector index significantly.
• Persistent Systems, Mindtree and HCL posted one-year
returns of 123.2%, 103.9% and 69.9%, respectively,
over the last one year. Meanwhile, the YTD returns for
the three companies stood at 24.8%, 33.8% and 22.9%,
respectively.
Source: Bloomberg
Table 16: Du Pont Analysis (FY13)
Net Profit
Margin (%)
Total Asset
Turnover
Leverage
Ratio
Adjusted
ROE (%)
5 Yr. Adj.
ROE (%)
Payout
Ratio
Persistent Systems Ltd. 14.49 1.13 1.23 20.19 20.29 19.19
Mindtree Ltd. 13.67 1.55 1.30 27.53 22.26 15.45
HCL Technologies Ltd. 15.79 1.26 1.77 35.13 27.56 20.68
Source: Bloomberg
90
130
170
210
250
290
330
Jan 13 Jul 13 Jan 14 Aug 14
Rebased t
o 1
00
S&P BSE IT Index Persistent Systems
Mindtree HCL Technologies

Economic and Market Research
Economic Research | 31
Telecom – At an Inflection Point
Sector Overview
Table 17: Key sector Statistics
The Indian telecom sector is the second largest in the world after
China, with a subscriber base of over 900 million as of FY13. It ranks
fifth in terms of the number of smartphone users with an estimated
base of 67 million users in 2013. Further, the number of subscribers
accessing internet through mobile devices touched 176.50 million in
2013 as a result of growing smartphone penetration.
Growth Drivers
• Data services gaining pace: Demand for data services is growing
rapidly in India. According to Nokia Siemens Networks' MBit index
study, total mobile data usage rose 87% y/y in 2013. Data traffic
generated by 2G and 3G services grew 66% and 196%, respectively.
As a result, 3G’s share in mobile data rose from 33% in 2012 to 43%
in 2013.
• Rising smartphone adoption: Smartphone penetration in India
stood at just 10% in 2013. However, penetration is witnessing
significant growth in the country’s urban parts. According to Nielsen
Mobile Insights, the share of smartphones in the mobile market of
urban India doubled from 9% in 2012 to 17% in 2013. Further,
Ericsson estimates that overall penetration would rise to 45% by
2020, driven by availability of affordable smartphones as well as low-
cost data connectivity options.
• Technological upgrades: Telecom operators are increasingly
looking at ramping up existing technologies. Leading telecom
operator Bharti Airtel has already launched 4G services in select
cities, while Reliance Jio Infocomm is planning to launch it
commercially in 2015.
• Lowering costs through innovative business models: A growing
trend in the sector is sharing of passive infrastructure (such as
antennas and mast) by network operators. This is helping companies
lower operating as well as capital expenditure. Companies are now
exploring opportunities to share active electronic infrastructure.
• Government initiatives: India’s National Telecom Policy (NTP)
targets 100% tele-density and 600 million broadband connections by
2020. This is expected to translate into demand for an additional
400,000 base stations and 50,000 towers at an investment of
INR500 billion (USD8.2 billion). The NTP is visualizing doubling the
current telecom capacity and increasing its reach to 95+% of India
while providing broadband level of internet capability.
Key Challenges
• Spectrum availability and high capital requirements: One of
the telecom industry’s major challenges is the availability of new
spectrum to meet the rising demand for data usage. India is a
largely wireless economy and the launch and adoption of broadband
would largely be driven through mobile broadband. The rising use of
m-governance, m-banking, and m-entertainment is expected to
increase traffic. To address this issue, the government needs to
clearly identify and allocate new spectrum bands. The roadmap
would also help companies plan for heavy investments in
infrastructure.
• Considerable financial and operational pressure: The telecom
industry is impeded by substantial financial and operational pressure.
Taxes and levies in the sector amount to 30% of telecom companies’
revenues vis-à-vis about 5% in other Asia-Pacific countries.
Moreover, in terms of telecom infrastructure investments, India
accounted for just 11% of total investments in Asia-Pacific relative to
China which received almost 50% of investments in FY13.
Contribution to GDP (FY13) 3.0%
Contribution to FDI (FY13) 1.35%
Telecom subscriber base (June ‘13) 903m
Mobile subscribers (% of total) 96.7%
Smartphone user base 40m
Wire-line broadband subscriber base 22m
Tele-density 73.3%
Source: TRAI
* Price as of Feb 04, 2013
Chart 42: Telecom sector revenues
Source: IBEF
Chart 43: Wireless market share in India
Source: IBEF
Chart 44: India’s tele-density
Source: IBEF
0
15
30
45
FY06 FY07 FY08 FY09 FY10 FY11 FY12 FY13
USD
bn
Bharti
Airtel,
21.7%
Vodafone,
17.6%
Reliance,
14.2%
Idea,
14.0%
BSNL,
11.7%
Tata,
7.7%
Aircel,
6.9%
0
25
50
75
100
FY07 FY08 FY09 FY10 FY11 FY12 FY13

Economic and Market Research
Economic Research | 32
Chart 45: Sector outperformers
• The S&P BSE Communication Technologies index
registered one-year return of 25.6% and YTD return of
8.8% as on August 14, 2014.
• The top three companies in the index were Tata
Communications, Bharti Airtel and Idea Cellular.
• Tata Communications and Bharti Airtel posted one-year
returns of 113.0% and 6.4%, respectively. Idea Cellular
declined 9.6% in the last one year. However, the stock
generated returns of 51.6% as compared to its January
2013 level.
Source: Bloomberg
Table 18: Du Pont Analysis (FY13)
Net Profit
Margin (%)
Total Asset
Turnover
Leverage
Ratio
ROE (%) Adjusted
ROE (%)
Payout
Ratio
Tata Communications -3.62 0.75 12.46 -39.25 -18.57 -
Bharti Airtel 2.96 0.49 3.13 4.51 16.50 16.69
Idea Cellular 4.51 0.65 2.52 7.39 7.79 9.84
Source: Bloomberg
40
70
100
130
160
190
Jan 13 Jul 13 Jan 14 Aug 14
Rebased t
o 1
00
S&P Comm. Tech. Index Tata Communications
Bharti Airtel Idea Cellular
Economic and Market Research
Economic Research | 33
Mashreq Treasury & Capital Markets – Contact Details
Rates & Structured Solutions Desk Equities and Derivatives Desk
04 212 8822 04 210 6422
Zeeshan Ali, CFA Aamir Peracha
[email protected] [email protected]
04 212 8856 04 210 6464
Khizer Usmani, CFA Zeeshan Saleem
[email protected] [email protected]
04 212 8758 04 210 6411
Usman Khan, CFA Ali Ibrahim
[email protected] [email protected]
04 212 8799 04 210 6414
Shakoor Ahmed, FRM Eli Abo Deeb
[email protected] [email protected]
04 212 8804 04 210 6413
Jean Francois Bargiarelli Dexter Andrade
[email protected] [email protected]
04 212 8843 04 210 6403
Khurram Hussain Moiz Khawaja, CFA
[email protected] [email protected]
04 212 8741 04 210 6405
Sali Maher Al Khateeb Nicolas Verez, CAIA
[email protected] [email protected]
04 212 8822 04 210 6402
Mohammad Ahsan, CFA, FRM Sinda Paulraj
[email protected] [email protected]
04 212 8852 04 210 6416
Top Related