


Languages
Pages
Legal


General rights Copyright and moral rights for the publications made accessible in the public portal are retained by the authors and/or other copyright owners and it is a condition of accessing publications that users recognise and abide by the legal requirements associated with these rights.
• Users may download and print one copy of any publication from the public portal for the purpose of private study or research. • You may not further distribute the material or use it for any profit-making activity or commercial gain • You may freely distribute the URL identifying the publication in the public portal
If you believe that this document breaches copyright please contact us providing details, and we will remove access to the work immediately and investigate your claim.
Downloaded from orbit.dtu.dk on: Dec 20, 2017
Incremental design of control system of SHARON-Anammox process for autotrophicnitrogen removal
Mauricio Iglesias, Miguel; Valverde Pérez, Borja; Sin, Gürkan
Publication date:2012
Document VersionPublisher's PDF, also known as Version of record
Link back to DTU Orbit
Citation (APA):Mauricio Iglesias, M., Valverde Perez, B., & Sin, G. (2012). Incremental design of control system of SHARON-Anammox process for autotrophic nitrogen removal Technical University of Denmark (DTU). [Sound/Visualproduction (digital)]. 10th European Workshop on Advanced Control and Diagnosis, Kgs. Lyngby, Denmark,08/11/2012
Incremental design of control system of SHARON-Anammox process for autotrophic
nitrogen removal
Miguel Mauricio-Iglesias Borja Valverde-Pérez Gürkan Sin

08/11/2012 2
Introduction and motivation
The design of the control structure of a bioreactor is challenging due to:
- Plant and model complexity with different time scales and large interactions
- Lack of actuators/control degrees of freedom to act upon the process
- Narrow operation window (in particular pH, temperature and concentration of substrate/product)
- Model mismatch due to lack of knowledge about the microorganism metabolism
- Adaptation of the microorganisms during operation
We illustrate all these challenges in the design of a control structure for a process of nitrogen removal in wastewater treatment

08/11/2012 3
Overview of the presentation
1) Why autotrophic nitrogen removal?
2) Modelling of the plant
3) Control design. Top-down analysis
4) Control design. Bottom-up design
i. Closed loops disturbance gain
ii. H∞ controller
5) Evaluation
6) Conclusions
08/11/2012 4
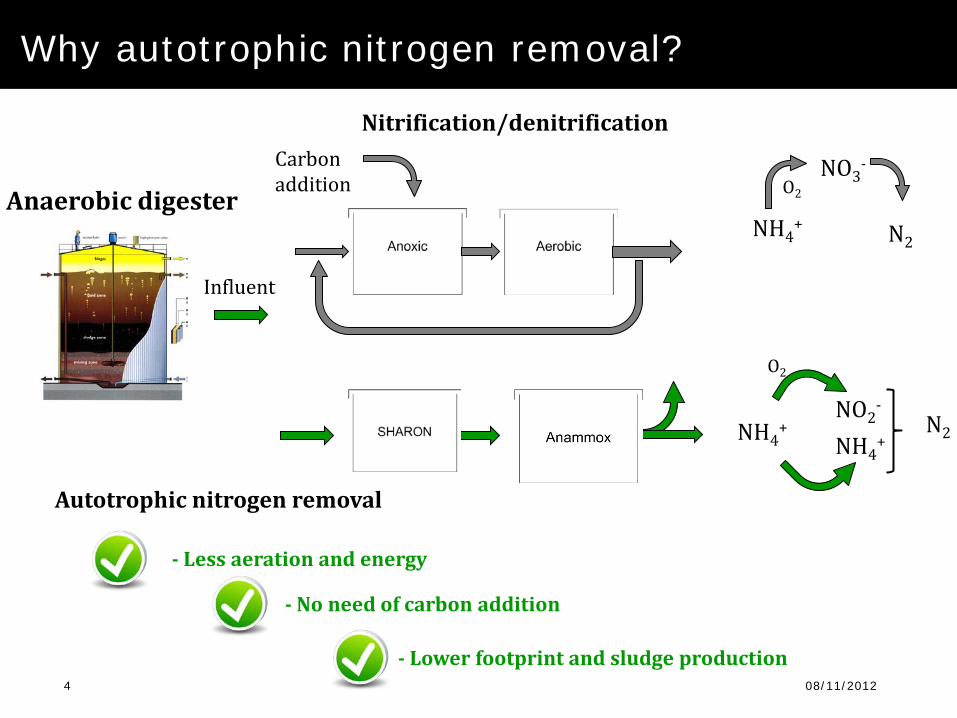
Why autotrophic nitrogen removal?
Influent
Anaerobic digester
Carbon addition
Nitrification/denitrification
Autotrophic nitrogen removal
- Less aeration and energy
- Lower footprint and sludge production
- No need of carbon addition
NH4+
NO3-
O2
N2
NH4+
NO2-
O2
N2
NH4+
08/11/2012 5
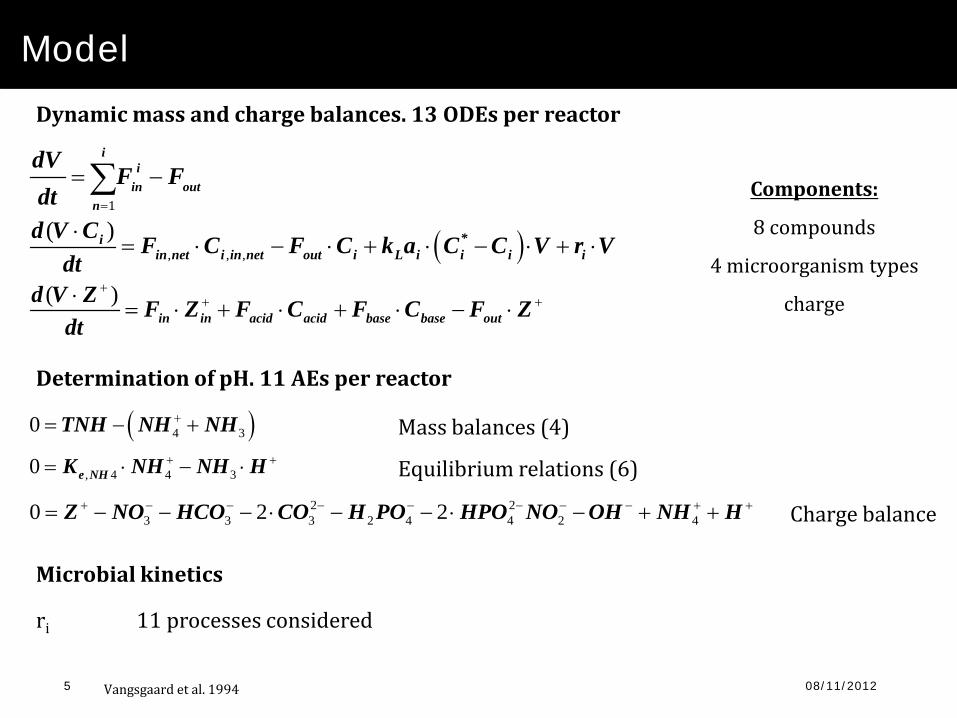
Model
=
= −∑i
iin out
n
dVF F
dt 1
( ), , ,( )⋅
= ⋅ − ⋅ + ⋅ − ⋅ + ⋅*iin net i in net out i L i i i i
d V C F C F C k a C C V r Vdt
( )++ +⋅
= ⋅ + ⋅ + ⋅ − ⋅in in acid acid base base outd V Z F Z F C F C F Z
dt
( )4 30 += − +TNH NH NH
, 4 4 30 + += ⋅ − ⋅e NHK NH NH H
2 23 3 3 2 4 4 2 40 2 2+ − − − − − − − + += − − − ⋅ − − ⋅ − + +Z NO HCO CO H PO HPO NO OH NH H
Components:
8 compounds
4 microorganism types
charge
Dynamic mass and charge balances. 13 ODEs per reactor
Determination of pH. 11 AEs per reactor
Mass balances (4)
Equilibrium relations (6)
Charge balance
Microbial kinetics
ri 11 processes considered
Vangsgaard et al. 1994

08/11/2012 6
Control design. Top-down analysis
Control objectives
removal of >80 % of N load
Influent
TNH = 700 gN/m3
TNO2/TNH = 1.3
Slow growth ~11 d Faster growth ~1 d
Use the SHARON reactor to dampen the disturbances
Control degrees of freedom (3)
How to link the controlled variables with the control objectives?

08/11/2012 7
Control design. Top-down analysis
Potential controlled variables in SHARON
TNO2
pH
TNO2/TNH DO
TNH
Conflict between regulation and the control objectives

08/11/2012 8
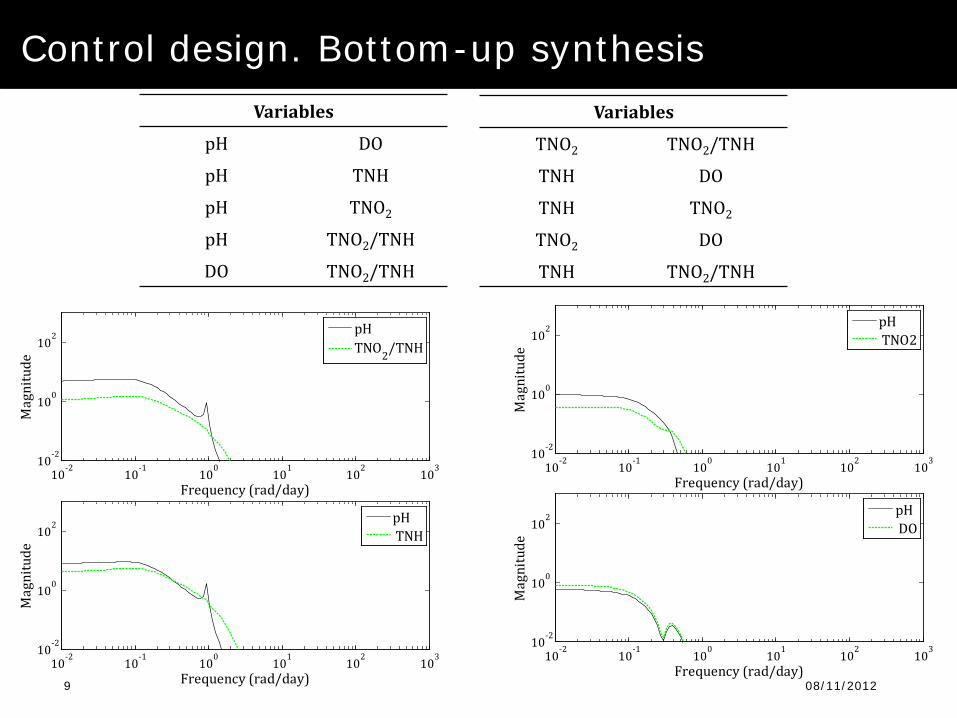
Control design. Bottom-up synthesis
Selection of controlled variables
Closed Loop Disturbance Gain (CLDG)
Hovd and Skogestad 1994
1( ) ( ) ( )s s sdCDLG G G G−=
CLDG = |δi |< 1
The disturbance effect is lower than ∆ymax
CLDG = |δi |>1
The disturbance effect is higher than ∆ymax Need of control action!
0 1 2 3 4 5 6 750
100
150
200
250
300
Time (days)
Flow
rate
(m3 /d
)
0 1 2 3 4 5 6 71445
1450
1455
1460
1465
1470
Amm
oniu
m co
ncen
trat
ion
(g/m
3 )
FlowrateTotal ammonium
0 1 2 3 4 5 6 70
5 x 10⁴
Time (days)
Flow
rate
(m3 /d
)
0 1 2 3 4 5 6 70
50
Amm
oniu
m co
ncen
trat
ion
(g/m
3 )FlowrateTotal ammonium
08/11/2012 9
Control design. Bottom-up synthesis
10-2 10-1 100 101 102 10310-2
100
102
Frequency (rad/day)
Mag
nitu
de
pHTNO2/TNH
10-2 10-1 100 101 102 10310-2
100
102
Frequency (rad/day)
Mag
nitu
de
pH DO
10-2 10-1 100 101 102 10310-2
100
102
Frequency (rad/day)
Mag
nitu
de
pH TNO2
10-2 10-1 100 101 102 10310-2
100
102
Frequency (rad/day)
Mag
nitu
de
pH TNH
Variables
pH DO
pH TNH
pH TNO2
pH TNO2/TNH
DO TNO2/TNH
Variables
TNO2 TNO2/TNH
TNH DO
TNH TNO2
TNO2 DO
TNH TNO2/TNH

08/11/2012 10
Control design. Bottom-up synthesis
Selection of controlled variables
Other requirements
(s) (s)IS=
I+G C
(s) (s)(s) (s)
G CT=I+G C
has to be bounded for performance
has to be bounded for robustness and to avoid sensitivity to noise
(s)(s) (s)CC S=
I+G C has to be bounded to penalize large inputs
Cmin N(C) N
U
T
P
W C S
W T
W S∞
Skogestad, S. and Postlethwaite, I. (2005)
Jahanshahi, E. and Skogestad, S. (2012)
stacked optimal H∞ problem
( )( ) ( )( )1σ CS jω γ σ jω uW −≤
( )( ) ( )( )1σ T jω γ σ jω TW −≤
( )( ) ( )( )1σ S jω γ σ jω PW −≤
γ must be small to ensure good controllability

08/11/2012 11
Control design. Bottom-up synthesis
Selection of controlled variables
Variables γ
pH DO 13.1
pH TNH 48.8
pH TNO2 58.6
pH TNO2/TNH 94.3
DO TNO2/TNH 100
TNO2 TNO2/TNH 100
TNH DO 101
TNH TNO2 101
TNO2 DO inf
TNH TNO2/TNH inf
Ranking
10-2 10-1 100 101 102 10310-2
100
102
Frequency (rad/day)
Mag
nitu
de
pH DO
10-2 10-1 100 101 102 10310-2
100
102
Frequency (rad/day)M
agni
tude
TNO2 DO
10-2 100 102
100
1010
Frequency (rad/day)
Mag
nitu
de
TNHTNO2/TNH
08/11/2012 12
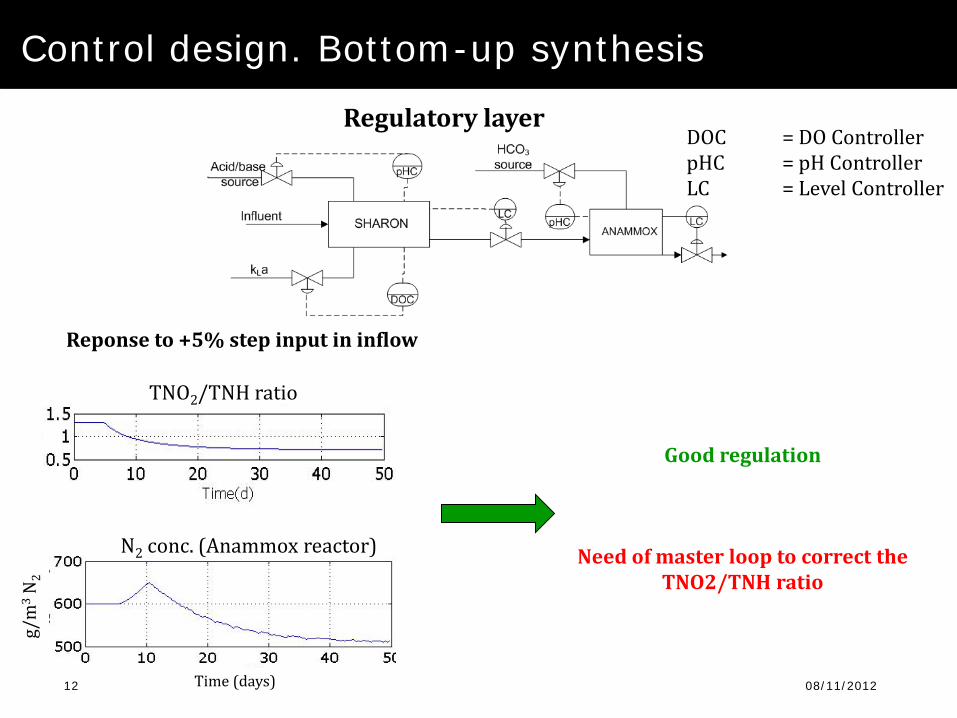
Control design. Bottom-up synthesis
DOC = DO Controller pHC = pH Controller LC = Level Controller
Regulatory layer
TNO2/TNH ratio
N2 conc. (Anammox reactor)
g/m
3 N2
Time (days)
Reponse to +5% step input in inflow
Good regulation
Need of master loop to correct the TNO2/TNH ratio

08/11/2012 13
Control design. Bottom-up synthesis
DOC = DO Controller pHC = pH Controller LC = Level Controller RC = TNO2/TNH Controller
Supervisory layer
TNO2/TNH ratio
N2 conc. (Anammox reactor)
g/m
3 N2
Time (days)
Reponse to +5% step input in inflow
The TNO2/TNH ratio is kept at the optimal value
Need of feedback from Anammox reactor
Model mismatch
Ammonium oxidation due to washed bacteria
0 10 20 30 40 50
600
620
640
660

08/11/2012 14
Control design. Bottom-up synthesis
DOC = DO Controller pHC = pH Controller LC = Level Controller RC = TNO2/TNH Controller NO2C = NO2 Controller
Supervisory layer
TNO2/TNH ratio
N2 conc. (Anammox reactor)
g/m
3 N2
Time (days)
Reponse to +5% step input in TNH input
The amount of N2 produced is maximized
More complex structure
The cascade takes advantage of the time-scale separation of the reactors
0 10 20 30 40 50550
600
650
700
CascadeNested cascade
0 10 20 30 40 501.1
1.12
1.14
1.16
Adaptation of microorganisms can be tackled

08/11/2012 15
Evaluation. Dynamic simulation
Benchmark simulation model 2 effluent
0 2 4 6 8 10 1250
100
150
200
250
300
350
Time (days)
Flow
rate
(m3 /d
)
0 2 4 6 8 10 121420
1430
1440
1450
1460
1470
1480
Amm
oniu
m co
ncen
trat
ion
(g/m
3 )
FlowrateTotal ammonium
0 2 4 6 8 10 12500
550
600
650
Time (days)
N2 c
once
ntra
tion
(g m
-3)
RegulatoryCascadeNested cascade)
0 2 4 6 8 10 127.5
8
8.5
9
Time (days)
pH
RegulatoryCascadeNested cascade)
Nitrogen production (Anammox) pH regulation (Anammox)
08/11/2012 16
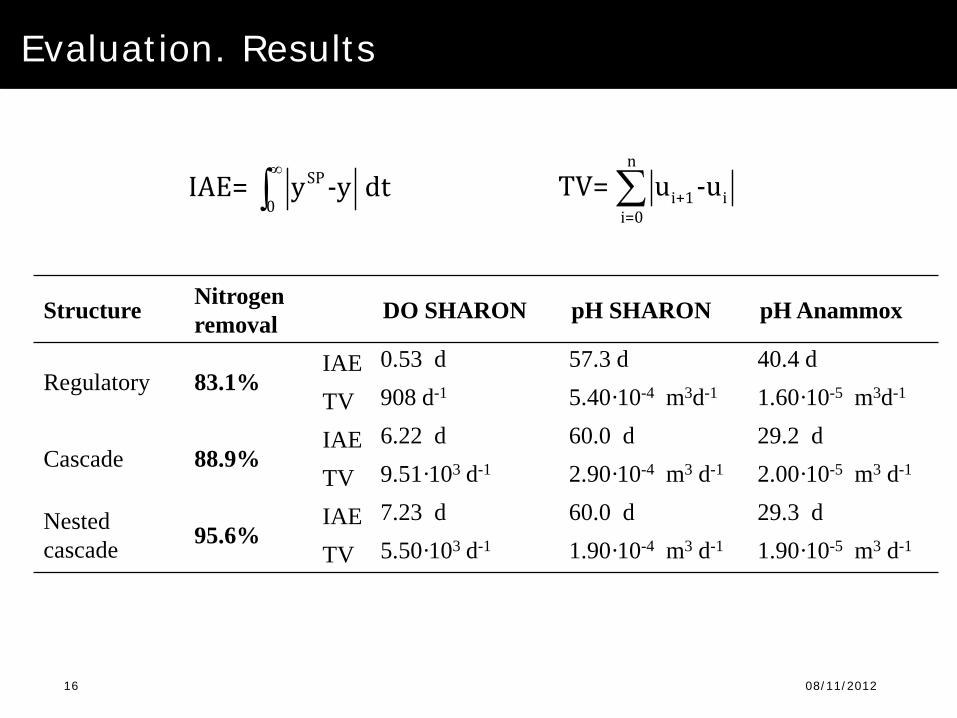
Evaluation. Results
Structure Nitrogen removal DO SHARON pH SHARON pH Anammox
Regulatory 83.1% IAE 0.53 d 57.3 d 40.4 d
TV 908 d-1 5.40·10-4 m3d-1 1.60·10-5 m3d-1
Cascade 88.9% IAE 6.22 d 60.0 d 29.2 d
TV 9.51·103 d-1 2.90·10-4 m3 d-1 2.00·10-5 m3 d-1
Nested cascade 95.6%
IAE 7.23 d 60.0 d 29.3 d
TV 5.50·103 d-1 1.90·10-4 m3 d-1 1.90·10-5 m3 d-1
SP
0IAE= y -y dt
∞
∫n
i+1 ii=0
TV= u -u∑

08/11/2012 17
Conclusions
Due to the lack of actuators, selection of controlled variables is challenging in bioreactors
We used two methods to select the controlled variables:
- the Closed Loop Disturbance Gain, emphasizing the effect of disturbance rejection
- a trade-off between performance and robustness, through the synthesis of a H∞ controller
The regulatory layer was improved in order to address the process objectives, thereby producing designs of increasing complexity which can be adapted to the user’s needs

Incremental design of control system of SHARON-Anammox process for autotrophic
nitrogen removal
Funded by Danish Agency for Science, Technology and Innovation through the
Research Centre for Design of Microbial Communities in Membrane Bioreactors
(09-067230) for funding of the project
Miguel Mauricio-Iglesias Borja Valverde-Pérez Gürkan Sin
Top Related