


Languages
Pages
Legal


This paper should be cited as:
Bandara, W. K. S. J. 2014. Increasing stability and operational performance of multi day fishing boats in Sri
Lanka. United Nations University Fisheries Training Programme, Iceland [final project].
http://www.unuftp.is/static/fellows/document/sunil13prf.pdf
Final Project 2013
INCREASING STABILITY AND OPERATIONAL PERFORMANCE OF
MULTI DAY FISHING BOATS IN SRI LANKA
W.K. Sunil Jayaratne Bandara
Department of Fisheries and Aquatic Resources
New Secretariat, Maligawatta, Colombo 10, Sri Lanka.
Supervisor
Sigurdur Jonsson
Laganes ehf
Hlidarvegur 38, 400 Isafjordur, Iceland
ABSTRACT
The deep sea fleet of Sri Lanka has been expanding rapidly. The vessels are manufactured in 48
boat yards which make fibreglass boats according to plans approved by the Ministry of Fisheries
and Aquatic Resources Development. The design of the boats shows little variation, except in
length. Common length is 12-15 m. A template was made to analyse existing deep sea fishing
boats in Sri Lanka. It addresses basic issues regarding vessel design, construction and operation.
A general hydrostatic software (GHS) was used to calculate hydrostatic data and to analyse
vessel stability under various operating conditions. A power prediction software (HydroComp
NavCad 2013) was used to analyse both hull resistance and propulsion parameters which help to
establish an efficient trim and corresponding optimum speed for better fuel economy and
performance. The template an analytical tool for vessel modifications and design. In this way, a
boat can be modelled and analysed for stability, resistance and propulsion by governmental
institutions, boat yards and designers. It will help to ensure safety at sea, establish better
operation and service life of single vessels, and improve the general condition of the national
fleet.

Sunil
UNU–Fisheries Training Programme ii
TABLE OF CONTENT
LIST OF FIGURES .................................................................................................................... iii
LIST OF TABLES ...................................................................................................................... iii
1 Introduction .......................................................................................................................... 1
2 Applied theory and formulas ............................................................................................... 2
Resistance and power .................................................................................................... 2
Model tests, analysis and trials ...................................................................................... 5
Stability ......................................................................................................................... 5
3 Boat safety regulations ......................................................................................................... 6
4 Methodology ........................................................................................................................ 7
Collection of technical and operational data ................................................................. 7
Design tools ................................................................................................................... 7
Pre- estimating some parameters................................................................................... 8
Estimating and analyzing stability ................................................................................ 8
Estimating resistance and propulsion ............................................................................ 8
The selected reference boat ........................................................................................... 9
Intermediate results ..................................................................................................... 10
4.7.1 Hull form .............................................................................................................. 10 4.7.2 Light ship data...................................................................................................... 11 4.7.3 Operating conditions and stability criteria ........................................................... 11
5 results ................................................................................................................................. 12
Stability analysis ......................................................................................................... 12
Influence of modifications on stability........................................................................ 15
Resistance and propulsion ........................................................................................... 17
5.3.1 Resistance and effective power ............................................................................ 17 5.3.2 Propeller efficiency .............................................................................................. 17 5.3.3 Vessel propulsion parameters .............................................................................. 18 Propeller failure and optimum power utilisation ........................................................ 18
6 DISCUSSION .................................................................................................................... 19
Stability analysis with modification ............................................................................ 19
Total effective power, propeller efficiency and propulsion parameter ....................... 20
The evaluating process ................................................................................................ 20
7 CONCLUSION .................................................................................................................. 21
AKNOWLEDGEMENTS.......................................................................................................... 22
LIST OF REFERENCES ........................................................................................................... 23
Annex 1: lines plan .................................................................................................................... 24
Annex 2: General Arrangement Plan ......................................................................................... 25
Annex 3: Hydrostatic particulars ............................................................................................... 26
Annex 4: Vessel data collected by author in interviews of Sri Lanka skippers on Aug 2013 ... 27

Sunil
UNU–Fisheries Training Programme iii
LIST OF FIGURES
Figure 1. Sri Lanka and the EEZ (MFARD 2013)....................................................................... 1 Figure 2. Propeller diagram from open water test showing the changes in: Torque coefficient
(K_Q=Q⁄(ρn^2 D^5 )), Thrust coefficient (K_T=T⁄(ρn^2 D^4 )) and Propeller efficiency
(ᶯ_0=(JK_T)⁄(2πK_Q )) with changes in the advance coefficient J (Ragnarsson, 2003)............. 4 Figure 3. Hull propeller interrelation (Tupper and Rawson, 2001). ............................................ 4
Figure 4. Selected hull form for reference boat. .......................................................................... 9 Figure 5. Geometrical boat model of the reference boat created by GHS software. ................. 10 Figure 6. Stability criteria 1-6, modification increased deck height (operating condition 1). ... 15 Figure 7. Stability criteria 1-6 modification use of chill bath (operating condition 1). ............. 16 Figure 8. Stability criteria 1-6, modification fish hold flooded with water (operating condition
1). ............................................................................................................................................... 16
Figure 9. Reference boat propeller cavitation as predicted by the HydroComp NavCad software.
(Plotted from Table 15). ............................................................................................................. 19
Figure 10. Reference boat, power utilisation (Plotted from Table 16). ..................................... 19
LIST OF TABLES
Table 1. Number of fishing vessels with inboard engines in Sri Lanka. Vessels are classified
according to how long they can stay at sea (MFARD 2013). ...................................................... 1
Table 2. Berthing capacity of fisheries harbours in Sri Lanka (Ceylon fisheries Harbours
Cooperation). ............................................................................................................................... 2
Table 3. Engine performance and propulsion data obtained from manufacturers leaflets. ....... 10 Table 4. Calculated hull particulars of the reference boat. ........................................................ 11 Table 5. Calculated parameters for different operating conditions all weights are in tonnes. ... 12
Table 6. Stability criteria for evaluating the 6 conditions. ......................................................... 12
Table 7. Modifications/emergency situations tested .................................................................. 12 Table 8. Results of stability analysis for vessel departing for the fishing grounds with full fuel,
stores, ice, fishing gear etc. (operating condition 01). ............................................................... 13 Table 9. Results of stability analysis for arrival of fishing ground with 60% remaining of fuel,
stores, etc. (operating condition 02). .......................................................................................... 13
Table 10. Results of stability analysis for departure from fishing grounds with full catch, 30%
remaining of stores, fuel etc. (operating condition 03). ............................................................. 14
Table 11. Results of stability analysis for departure from fishing ground without catch, 30%
remaining of stores, fuel etc. (Operating condition 04). ............................................................ 14 Table 12. Results of stability analysis for arrival at home port with full catch, 10% remaining of
stores, fuel etc. (Operating condition 05)................................................................................... 14 Table 13. Results of stability analysis for arrival at home port without catch, 10% remaining of
stores, fuel etc. (operating condition 06). .................................................................................. 15
Table 14. Main components of total resistance and effective power (reference boat). ............. 17
Table 15. Propeller parameters for the reference boat for five selected speeds. ....................... 17 Table 16. Propulsion parameters for the reference boat. ........................................................... 18

Sunil
UNU–Fisheries Training Programme 1
1 INTRODUCTION
Sri Lanka is an island in the Indian Ocean with an EEZ of 517,000 km2, a coastline of 1585 km
and access to international waters (Figure 1). There has been a rapid increase in the number of
vessels operating in the offshore waters, called multi-day boats in Sri Lanka. In 2013 there were
about 4400 such boats in operation, an increase of about 50% since 2009 (Table 1).
Figure 1. Sri Lanka and the EEZ (MFARD 2013)
Table 1. Number of fishing vessels with inboard engines in Sri Lanka. Vessels are classified
according to how long they can stay at sea (MFARD 2013).
Vessel type 2009 2011 2012 2013 (estimated)
Multi-day boats (offshore
vessels) 2,934 3,872 4,080 4,430
Single day boats 958 1,120 890 570
There are twenty fisheries harbors located around the island. Those have the capacity to berth
fishing boats which have maximum draught of up to 6 m (Table 2). In 2013 there were 48 boat
yards in Sri Lanka (MFARD). The boats are made of fibre reinforced plastic and the method of
hand layup is used for construction. Engines are imported from Japan, Korea and China. The
boats are of relatively uniform design. There is a trend towards larger vessels with time, but the
same moulds are used and the boats are becoming longer and higher. Therefore there are
increasing concerns about the stability of these vessels and operational performance.

Sunil
UNU–Fisheries Training Programme 2
Table 2. Berthing capacity of fisheries harbours in Sri Lanka (Ceylon fisheries Harbours
Cooperation).
Dredging Depth (m) Active
harbours
Berthing capacity
(No. of vessels)
2.5 1 250
2.5 – 3.0 4 375
2.5-5.0 3 530
3.0 7 1892
3.5 2 275
4.0 -6.0 3 1050
Total 20 4372
Local boat yards are regulated and supervised to comply with local boat building standards. In
addition, boat designs are to be registered and approved under the competent authority, the
Department of Fisheries and Aquatic Resources. There is an established procedure for approving
the mould. Specifications and set of drawings that describe a design should be submitted in order
to get approval for construction. Lines plan, general arrangement plan, construction details with
sectional views, and auxiliary system drawings such as electrical, bilge system are included.
Based on the drawings, the department considers hydrostatic particulars for hull geometry. Once
the boat has been completed, an inclining experiment is carried out in order to evaluate light ship
details such as its weight, centre of gravity as well as metacentre to ensure that the boat has a
sufficient intact stability at a small angle. A rolling test is also carried out when evaluation of
stability is needed. Running trials are carried out for new and existing vessels to check
manoeuvrability as well as seaworthiness of boats before they are registered or their registration
renewed.
In this project the stability and operational performance of a standard boat are analysed using
General Hydrostatic Software (General Hydrostatic, 2014) and HydroComp NavCad softwares
(HydroComp, 2014) respectively. Operational performance is also calculated based on different
scenarios, catch, storage and weight of nets and water, amount of fuel on board and so on. A
template is created for these calculations which should help the department in fulfilling its
functions. It can also be used to give advice on how to improve the safety and operational
performance of individual vessels. This should reduce costs and improve safety.
2 APPLIED THEORY AND FORMULAS
Resistance and power
In general estimates of resistance and propulsion are based on calculations in four different
stages. These four basic components of resistance and propulsion, are effective power/hull
resistance, the propeller, hull/propeller interaction, and ship/model correlation (Tupper and
Rawson, 2001). When applying related theories, and in model tests and other calculations the
technique of dimensional analysis is commonly used. To present test data and to compare

Sunil
UNU–Fisheries Training Programme 3
performances, following non dimensional coefficients are commonly used (Tupper and Rawson,
2001).
R ρV2L2⁄ is called the resistant coefficient
𝑇 𝜌𝑛2𝐷4⁄ is called the thrust coefficient is represented by 𝐾𝑇
𝑄 𝜌𝑛2𝐷5⁄ is termed the torque coefficient and represented by 𝐾𝑄
𝑉𝐿𝜌/𝜇 or 𝑉𝐷𝜌/𝜇 are referred to as the Reynolds’ number
𝑉 √𝑔𝐿⁄ or 𝑉 √𝑔𝐷⁄ are referred as Froude number
𝑃 𝜌𝑉2⁄ is termed the cavitation number
𝑉 𝑛𝐷⁄ is the advance coefficient and is represented by the letter J
The ratio 𝜇 𝜌⁄ is termed the kinematic viscosity and is represented by v
Where R is resistance, 𝜌 is density of water. V is velocity, L is waterline length, T is thrust, n is
revolution per minute. D is diameter, Q is torque, 𝜇 is coefficient of kinematic viscosity, g is
acceleration due to gravity and. P is pressure (Tupper and Rawson, 2001).
The followings are definitions used when resistance estimates are calculated:
Bare hull resistance: The resistance of a ship at a given speed is the force required to tow the
ship at that speed in smooth water, assuming no interference from the towing ship. Without
appendages, it is called the bare-hull resistance.
Total resistance: Total resistance is made up of three main components. Frictional resistance is
due to the motion of the hull through a viscous fluid, the wave making resistance due to the
energy that must be supplied by the ship to the wave system created on the surface of the water
and eddy resistance, due to the energy carried away by eddies shed from the hull or appendages.
These are explained in more detail below.
Frictional resistance: When boat moves in water, it generates a boundary layer. This layer
moves with the boat. Energy is absorbed by the layer to create its momentum. The resistance due
to this effect is called frictional resistance. It can be calculated by using non-dimensional
coefficient𝐶𝐹, and is calculated on 𝐶𝐹 = 0.075/(log10 𝐿𝑛 − 2)2 (Ragnarsson, 2003).
Wave making resistance: When a boat moves in water it generates wave patterns. A pressure
field around the hull and water surface creates the wave patterns. There are two different wave
patterns generated, at the bow and at the stern. The boat must provide the energy to create these
waves and to break waves. This effect will create resistance for the boat and it is called wave
making resistance (Fyson, 1985).
Eddy making resistance: There are structural components which are connected to the hull
below the waterline. These are termed appendages which create eddies and separation resistance
to the streamlined flow. The resistance thus created is called Eddy making resistance (Fyson,
1985). Here it is referred to as an appendage drag considering above resistance components and
roughness allowance, total resistance can be estimated (Fyson, 1985).
Propeller and Hull propeller interaction: The following definitions used in power estimations
(Ragnarsson, 2003). Effective power is the power needed to tow a boat without self-propulsion.
Indicated power is the power generated inside the cylinders of an engine. Brake horse power is
the power taken out from the flywheel of the engine Power supplied to the propeller at the aft
end of the propeller shaft is called delivered horse power. The propeller creates a thrust and it
creates movement of the boat. This power is called thrust horse power.
The propeller is the primary device which produces the thrust to move the boat. Suitably matched
propeller gives maximum possible thrust without overloading the engine and must have the

Sunil
UNU–Fisheries Training Programme 4
correct diameter and pitch (Gerr, 2001). Propeller characteristics are studied in a testing tank
without a hull. This is called an open water test (Ragnarsson, 2003). Results of open water tests
are presented by non-dimensional coefficient forms (Figure 2).
Figure 2. Propeller diagram from open water test showing the changes in: Torque coefficient
(K_Q=Q⁄(ρn^2 D^5 )), Thrust coefficient (K_T=T⁄(ρn^2 D^4 )) and Propeller efficiency
(ᶯ_0=(JK_T)⁄(2πK_Q )) with changes in the advance coefficient J (Ragnarsson, 2003).
When hull and propeller act together a new physical system comes into play. The propeller
increases resistance but also generates thrust. The point where the thrust generated exceeds the
added resistance is called the augment of resistance (Figure 3) (Tupper and Rawson, 2001).
Figure 3. Hull propeller interrelation (Tupper and Rawson, 2001).
Thrust deduction factor (t), wake fraction (w), relative rotative efficiency (𝜂𝑅) are three
parameters that solve the real physical system of hull- propeller combination. The effective thrust
on hull is a bit smaller than the generated thrust by propeller due to self propulsion arrangement
(augment resistance). The thrust deduction factor is calculated to include this difference for the
analysis. When a ship moves at a certain speed, its propeller does not move with the same speed
relative to the water.The wake fraction is calculated to consider this physical effect that is due to

Sunil
UNU–Fisheries Training Programme 5
the boundary layer generated by the hull. There are variations in water velocities over the
propeller disc due to flow pattern infuenced by the hull. These variations are considerable
compaired to open water conditions in which the propeller efficiency was determined. Hence,
the relative rotative efficiency, (𝜂𝑅) is calculated and used to give more accuracy in the
propulsion analysis (Ragnarsson, 2003).
Model tests, analysis and trials
There is a procedure to calculate total resistance of a boat through a model experiment. Total
resistance is measured in a towing tank for a model that is scaled to a boat. Residual resistance
of the model is calculated by subtracting its calculated frictional resistance. The residual
resistance for boat is scaled according to the Froude number. Total resistance of the boat is then
estimated by adding frictional resistance calculated to the derived residual resistance of the boat.
Speed can then be predicted for given engine power. It is recommended that the propeller be
“under-pitched” so there is a margin to increased load of a vessel. In modern approach, the RPM
is set at the full rated value and based on that, propeller is sized for reduced (95%) rated power
(MPTE, 2006).
When a boat has been built, a trial is carried out to ensure that boat meets its design parameters
by determining speed, shaft power, propeller RPM, pitch and drafts relevant to load conditioned.
It helps to establish the relationship of these parameters and to obtain performance data for use
in future design (Ragnarsson, 2003).
Stability
Stability is the most important factor regarding overall safety of the boat. It describes the ability
of a boat to return to its upright position after being heeled (Gudmundsson, 2009). Commonly,
transverse stability is evaluated to ensure the safety of a boat. A boat’s stability is evaluated for
small angles of inclination based on metacentric height (GM). When GM is positive, zero or
negative it is called stable, neutral and unstable equilibrium respectively. The metacentric height
GM can be determined by an inclining experiment (Ragnarsson, 2003).
A righting arm diagram (GZ curve) is used to evaluate the stability at large angles of inclination.
Weight stability and form stability are investigated by interpreting this curve. Maximum value
of GZ, angle at which the maximum value is reached, initial gradient of the curve, area under
the curve at different ranges of angle and range of stability are some of characteristics that are
examined to evaluate dynamic stability. The shape of the curve depends on freeboard and ratio
of length to breadth. The centre of gravity of the boat also determines the shape of this curve
(Gudmundsson, 2009).
An inclining experiment is carried out to determine the centre of gravity and displacement of the
completed vessel in lightship condition with some accuracy. The draught readings for forward,
amidships and aft are to be taken during the test. While weights are being moved transversely
on the deck in a standard manner, the corresponding angles of heel are calculated through
pendulum readings. The pendulum is suspended on board at any suitable location (Fyson, 1985).
Using the following equation, metacentric height, GM can be calculated:
GM=qd⁄ (∆ tan∅),
where q=moving weight,
d=moving distance,

Sunil
UNU–Fisheries Training Programme 6
∆ = displacement, and
∅=angle of pendulum.
If draught has been seen in the displacement sheet, the displacement and metacentric height
above keel can be determined. Finally vertical centre of gravity can be determined (Ragnarsson,
2003).
3 BOAT SAFETY REGULATIONS
Under the fishing boat safety regulation 2009 of Sri Lanka, it is compulsory that new fishing
boat designs should comply with criteria for basic stability as well as stability under defined
operating conditions. The Department of Fisheries and Aquatic Resources is the competent
authority that must analyse new designs and make sure they conform with the regulations.
The followings are the criteria and the operating conditions stated in the regulations in Sri Lanka.
“The following minimum stability criteria shall be satisfied by all deck boats, unless the
Competent Authority is satisfied that operating experience justifies a departure there from:
(a) The area under the righting lever curve (GZ curve) shall not be less than 0.55m-rad
up 30 to angle of heel and not less than 0.090m-rad up to 40 or the angle of flooding θF,, if the angle is less than 40. Additionally, the area under the righting lever curve (GZ
Curve) between the angles of heel of 30 and 40 or between 30 and θF, if the angle is less
than 40, shall not be less than 0.030 m-rad. 0f is the angle of heel at which openings in
the hull, superstructures or deckhouses which cannot rapidly be closed watertight
commence to immerse. In applying this criterion small openings through which
progressive flooding cannot take place, need not be considered as open.
(b) The righting lever GZ shall be at least 200 mm at an angle of heel equal to or greater
than 30, however the righting lever GZ may be reduced to the satisfaction of the
competent authority, but in no case by more than 2(24-LOA) %, where length overall
(LOA), in meters, is as defined in paragraph (1) of regulation 179.
(c) The maximum righting lever GZ max shall occur at an angle of heel, preferably
exceeding 30 but not less than 25.
(d) The initial metacentric height GM0 shall not be less than 350 mm.
The number and type of operating conditions to be considered shall be to the satisfaction of the
competent authority and where appropriate, shall include the following:-
(a) Departure for the fishing grounds with full fuel, stores, ice, fishing gear etc.
(b) Departure from the fishing grounds with full catch, 30% stores, fuel etc.
(c) Arrival at home port with full catch and 10% stores, fuel etc.
(d) Arrival at home port with 10% stores, fuel etc. and minimum catch, which shall
normally be 20% of full catch but may be up 40%, provided the competent authority is
satisfied that operating patterns justify such a value” (MFARD, 2009).

Sunil
UNU–Fisheries Training Programme 7
4 METHODOLOGY
Collection of technical and operational data
The most common hull shape of existing boats of the national off shore fishing fleet of Sri Lanka
(multiday boats) was selected as reference boat for evaluation purposes. Complete data set for
such a boat was obtained from lines plan, general arrangement plan, specification booklet and a
result sheet from an inclining experiment for the selected boat or a sister boat. General
hydrostatic software (GHS) was also used to prepare initial data and carry out final propulsion
analysis.
Lines plan (Annex 1) is the basic technical drawing that gives the dimensions of a boat at each
and every stations along the longitudinal axis of the vessel. Profile with buttock lines, waterlines,
body plan and offset tables provide many details of a boat’s geometry. Fairness (smoothness) of
outer surface of the hull and flow patterns of water around under water portion of the hull can be
visualized and considered in to a design throught a lines plan.The lines plan is prepaired by
dimensions that can be easilly measured by the radial method called offsets, and can be taken
from an exsisting boat, mould or plug (Traung et al., 1955).
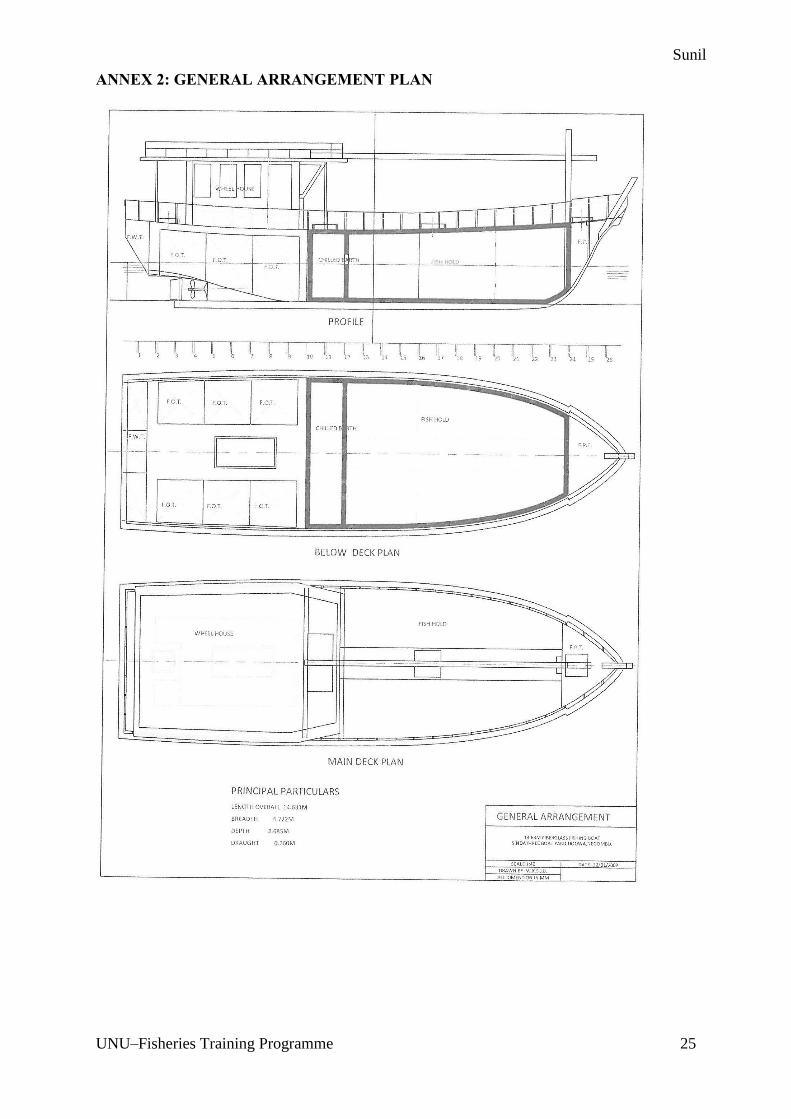
Utilization of space onboard is mainly described in a general arrangement plan (Annex 2). It
gives details on such aspects as load distribution, efficient access of every space, and capacity to
hold fuel, water, ice etc. It also gives details by which cost estimation will be possible. It explains
how accommodation is arranged, navigational lights are set, propulsion machinery is installed
and fishing gear and equipment are arranged in an efficient manner. Specification sheets for a
vessel provides general technical information such as designed speed, construction and stability
standards identifying criteria under which the boat should be built.
Accurate lightship data (i.e. vertical center of gravity, longitudinal center of gravity and light
ship weight) are needed and should be obtained from inclining experiments done after
completion of the construction of the boat, or obtained from previous experiments done for a
sister ship. Engine performance data can be obtained from manufactures’ leaflets. Engine
manufactures should give engine test data according to international standards such as ISO 8665
(Gulbrandsen, 2012).
The three basic documents; the lines plan, the general arrangement plan and the specification
sheets, light ship data and engine performance data play the vital role in analyzing a boat. If used
in combination with modern design software tools, one can have a simple method or template to
analyze load distribution on general arrangement plan, buoyancy distribution in lines plan,
establish better strength, stability and performance, and evaluate trim and draught for optimum
speed. Standard criteria given by specification booklets ensures the quality of such a template.
Design tools
Two modern software tools were used to estimate resistance, propulsion and stability of the
vessel. General hydro static software (GHS) can be used to calculate hydrodynamic properties
of the vessel such as hydrostatic particulars of hull form, righting arm, form coefficients,
compliance of stability criteria, strength and damage stabilities. The documents of lines plan,
GA plan, specifications and inclining test data are needed for calculations using this software.

Sunil
UNU–Fisheries Training Programme 8
The HydroCompNavCad software was used to estimate resistance of boat including an
appendages drag. Then propulsion parameters were estimated with the selected propulsion
machinery. Some results that had been obtained from GHS software were also used for final
calculations. In this study, Holtrop and Mennen power prediction method is applied. This
software can be used with new technical features of sizing and performance assessment for
marine propellers, engines and transmissions.
Pre- estimating some parameters
GHS software can be used to quickly analyze many design parameters of the vessel. It was used
to estimate the following parameters which are needed to carry out estimates of final resistance
and propulsion analysis of the boat. Length, breadth, height and volumes are estimated for all
geometrical components of the boat, the hull, water tanks, fuel tanks, chilled bath, fish hold sub
divisions, stores, wheel houses, rudders, and kegs. It can be used to analyze the internal volume
of a vessel make general arrangement plan in efficient manner.
Using coefficients that are commonly used in architectural calculations, volume of hull, block
coefficient, ratio of displacement and length, water plane area coefficient, maximum sectional
area coefficient, longitudinal and vertical prismatic area coefficients were calculated with
draught intervals of 0.1 m at an angle for both trim and heel of zero. These results are needed for
calculation of resistance of the boat at each draft condition, to established design water line and
free board under the standard criteria. Hydrostatic properties (Annex 3) were calculated to use
for final evaluation of resistance. These are displacement of boat, longitudinal center of
buoyancy, vertical center of buoyancy, tons per one centimeter immersion, longitudinal center
of flotation, moment for one degree of trim, and longitudinal and vertical metacentric height.
These were estimated for draught intervals of 0.1 m with trim and heel angles r both set to zero.
Estimating and analyzing stability
GHS software was used to estimate the stability parameters of the boat for comparison with the
stability criteria. The six loading conditions of the boat were defined according to the regulation
and stability margins were calculated for each. Stability parameters for few modifications of the
boat were also calculated for each loading condition.
The stability of the reference boat with modifications and flooding situation for fish hold were
analyzed individually with the stability criteria. Comparisons of shape of GZ curves with the
reference boat were also carried out. The modifications include increased deck level, chilled bath
used for storing fishing nets and fish hold filled with water in case of emergency. These
modifications are known to be commonly carried out by boat builders and boat owners.
Estimating resistance and propulsion
The HydroCompNavCad software was used to estimate parameters of both resistance and
propulsion. Data from different sources such as curves of forms, volume of components, line
plans, and general arrangement plans were used to evaluate resistance of the boat. When dealing
with propulsion, parameters for the engine, gear box and propeller were obtained according to
general arrangement plan and specification booklet provided with drawings.

Sunil
UNU–Fisheries Training Programme 9
The selected reference boat
Based on interviews and pre-studies in Sri Lanka a certain boat has been chosen as a reference
boat for this project. This particular boat is representative for a large fleet and any findings for it
can easily be extrapolated or used for a wider range of vessels (Figure 4).
Figure 4. Selected hull form for reference boat.
The lines plan (Annex 1) and general arrangement plan (Annex 2) for the reference boat were
collected from Sindathri Boat yard in Negombo, a registered boat builder under the Department
of Fisheries and Aquatic Resources (DFAR) in Sri Lanka. Figure 4 shows a boat which has the
same hull dimensions. This hull shape has been commonly used in Sri Lanka for the last two
decades (Annex 04). Engine performance curves were selected for the Doosan, L136T/TL
marine engine which is widely used in Sri Lanka.
The vessel is built from fibreglass reinforced plastic (FRP) and is designed for operation in Sri
Lankan waters. It was built as a combination vessel, and fitted to carry out gillnetting and long-
lining. The propulsion machinery is a four cycle diesel engine, medium speed, connected to a
reduction gear with a fixed pitch propeller. The engine room is in the aft of the vessel. The
accommodation and wheel house is located above the engine room. The vessel has a one main
deck, storage in the forepeak, fuel tanks and water tanks aft, fish hold and chilled bath between
the engine room and stores. The main dimensions of the vessel are; overall length 14.63m,
breadth 4.72m, depth 2.68m, design draft 1.1m and intended speed of 3.825 m/s (7.5 knots). It
has a carrying capacity of; fish hold 8.3m3, chilled bath of 3.5m3, fresh water of 4m3, and diesel
oil of 8 m3.
The fish hold is sub divided by means of wooden stanchions and pen boards. Sides, deck heads
and bulkheads are insulated according to official standards. The rudder is of semi balance type
with aerofoil cross section. The rudder is made from steel and covered by layers of FRP. The
bottom pintle is stainless steel running in a water lubricated bearing. Propeller is to be fitted of
fixed pitch type which has a diameter within the range of 0.711m-1.016m (28”-40” ) and pitch
within the range of 0.508m-0.762m (20”-30”).
The hull is constructed in accordance with the fishing boat safety regulation 2009 of Sri Lanka
and was inspected during construction by the Department of Fisheries and Aquatic Resources,
and surveyed before registration for each year prior to renewal of the operational licence for

Sunil
UNU–Fisheries Training Programme 10
fishing in Sri Lankan and international waters. The hull was built from fiberglass and wood with
scantling given by regulations. Internal tank bulkheads and tanks are made of fibre reinforced
plastic.
The operational pattern of the vessel can be described using service information. Engine
performance data, gear ratio and propeller diameter are used for the reference boat (Table 3).
Table 3. Engine performance and propulsion data obtained from manufacturers leaflets.
Intermediate results
4.7.1 Hull form
GHS software was used to make a geometric model of the reference boat (Figure 5) and to carry
out further calculations.
Figure 5. Geometrical boat model of the reference boat created by GHS software.
Hull particulars needed for resistance calculations were obtained from lines plan and other
particulars were estimated from the geometric model made by using GHS software (Table 4).
RPM Power/ps Load/ps
1000 105 20
1200 130 32
1400 152 51
1600 172 80
1800 185 110
2000 192 150
2200 200 200
gear ratio 2,45
Propeller diameter 900 mm

Sunil
UNU–Fisheries Training Programme 11
Table 4. Calculated hull particulars of the reference boat.
Particulars Value
Length on water line 12,923 m
Max beam on water line 3,461 m
Max moulded draught 1,1 m
Displacement 25 t
Weted surface area 46,8 m2
Lcb fwd TR 5,905 m
Lcf fwd TR 5,615 m
Max sectional area 2,6m2
Water plane area 35,3m2
Transom beam 2,216 m
Half entrance angle 21 deg
Block coefficient 0,397
Water plane area coefficient 0,789
Maximum sectional area coefficient 0,69
Longitudinal prismatic coefficient 0,647
Vertical prismatic coefficient 0,504
4.7.2 Light ship data
Light weight, longitudinal centre of gravity and vertical centre of gravity for the boat is assumed
to be 8 tons, 4.5 m from aft end and 1.0 m above the keel respectively. Therefore findings may
only show trends but not necessarily the exact values for the behaviour of the reference boat.
4.7.3 Operating conditions and stability criteria
Operating/loading conditions and stability criteria are selected according to the safety regulations
2009 in Sri Lanka and IMO voluntary guidelines for fishing vessel less than 24m. Six
operating/loading conditions were defined to be analysed. Of these conditions of 01, 03, 05, and
06 are according to the regulations and conditions 02 and 04 were included as they reflect
common operational patterns in deep sea fishing in Sri Lanka today.
Condition 01 - departure for fishing grounds with full fuel, stores, ice, fishing gear etc.
Condition 02 - arrival at fishing grounds with 60% fuel, stores, fuel etc.
Condition 03 - departure from fishing grounds with full catch, 30% stores, fuel etc.
Condition 04 - departure from fishing ground without catch, 30% stores, fuel etc.
Condition 05 - arrival at home port with full catch, 10% stores, fuel etc.
Condition 06 - arrival at home port without catch, 10% stores, fuel etc.
Parameters for each operating condition were calculated using GHS software (Table 5)

Sunil
UNU–Fisheries Training Programme 12
Table 5. Calculated parameters for different operating conditions all weights are in tonnes.
Stability criteria considered for evaluation are listed in Table 6. All indicators are obtained from
righting arm diagrams relevant for each operating condition. GHS software was used to draw
righting arm diagram and calculate parameters which are included in the criteria.
Table 6. Stability criteria for evaluating the 6 conditions.
Criteria 1 Area under GZ curve 0 to 30 should be greater than 0.55 m-rad
Criteria 2 Area under GZ curve 0 to 40 or flooding angle should be greater than 0.90 m-rad
Criteria 3 Area under GZ curve 30 to 40 or flooding angle should be greater than 0.30 m-rad
Criteria 4 Upright GM should be greater than 350mm
Criteria 5 Righting arm at 30 deg or max should be greater than 0.2m
Criteria 6 Absolute angle at maximum righting arm greater than 25 deg
Table 7. Modifications/emergency situations tested
Modification Reason for selection
With an increased deck height Popular practice
Chilled bath filled with water Common practice
Chilled bath filled with net Common practice
Fish hold flooded with water Emergency situation
Fish hold with longitudinal compartments flooded with water Emergency situation
5 RESULTS
Stability analysis
Six various loading conditions that cover operational patterns of the fishing boat were analysed
and safety margins for six stability criteria were calculated. The reference boat was analysed for
stability and fulfilled every stability criteria with positive margins for every loading conditions
(1st row in following Tables 8-13). When the boat was analysed for modifications, it failed

Sunil
UNU–Fisheries Training Programme 13
stability criteria in some cases under all loading conditions (highlighted red boxes in tables 8-
13).
Table 8. Results of stability analysis for vessel departing for the fishing grounds with full fuel,
stores, ice, fishing gear etc. (operating condition 01).
Table 9. Results of stability analysis for arrival of fishing ground with 60% remaining of fuel,
stores, etc. (operating condition 02).

Sunil
UNU–Fisheries Training Programme 14
Table 10. Results of stability analysis for departure from fishing grounds with full catch, 30%
remaining of stores, fuel etc. (operating condition 03).
Table 11. Results of stability analysis for departure from fishing ground without catch, 30%
remaining of stores, fuel etc. (Operating condition 04).
Table 12. Results of stability analysis for arrival at home port with full catch, 10% remaining
of stores, fuel etc. (Operating condition 05).

Sunil
UNU–Fisheries Training Programme 15
Table 13. Results of stability analysis for arrival at home port without catch, 10% remaining of
stores, fuel etc. (operating condition 06).
Influence of modifications on stability
In each results table above, the figures of stability margins for the modifications (see Table 7)
show stability failures for the every loading conditions. To find out the main cause of these
changes, the righting arm curves for the operating condition 1 and each modification were drawn
and compared with reference boat. Following graphs illustrate the influence of the five
modifications on the stability for operating condition 1.
When the deck is increased, free board will be increased then range of stability (form stability)
is better. But the initial metacentric height is lower because vertical centre of gravity is raised.
The initial stability is slightly lower (Figure 6).
Figure 6. Stability criteria 1-6, modification increased deck height (operating condition 1).

Sunil
UNU–Fisheries Training Programme 16
When the chilled bath is filled with water metacentric height is decreased because of higher VCG
and the effect of free surface (weight stability). Maximum value of GZ is decreased (form
stability). When chilled bath is used for nets form stability as well as weight stability will be
increased (Figure 7).
Figure 7. Stability criteria 1-6 modification use of chill bath (operating condition 1).
When fish hold is flooded with water by 70%, stability of the boat will be decreased because of
the free surface effect. When the hold is fitted with partitions stability is bit better than without
partitions. In both cases the graph shows that stability is significantly reduced (Figure 8).
Figure 8. Stability criteria 1-6, modification fish hold flooded with water (operating condition
1).

Sunil
UNU–Fisheries Training Programme 17
Resistance and propulsion
5.3.1 Resistance and effective power
The HydroCompNavCad software was used to analyse resistance and propulsion of the reference
boat designing conditions (maximum load). After the required dimensions, form coefficients,
and speed limit are fed to the software, the program predicts the total effective power and
resistance components through a regression analysis of random model experiments and full-scale
data (Table 14).
Table 14. Main components of total resistance and effective power (reference boat).
5.3.2 Propeller efficiency
Input of maximum propeller diameter and basic propeller data, to the HydroComp NavCad
software, provides parameters for monitoring a propellers open water efficiency (Table 15).
Table 15. Propeller parameters for the reference boat for five selected speeds.

Sunil
UNU–Fisheries Training Programme 18
5.3.3 Vessel propulsion parameters
The HydroComp NavCad software was used to evaluate the combination of hull, engine and
propeller. The outcome gives sense of performance of the propulsion system as well as the boat,
and performance variations with design parameters can be identified. Table 16 shows the
propulsion parameters for the reference boat at five selected speeds.
Table 16. Propulsion parameters for the reference boat.
Propeller failure and optimum power utilisation
Figure 9 shows that cavitation percentage increases at higher speed. High cavitation indicates
poor propeller efficiency and in the case of the reference boat the propeller efficiency is
drastically reduced above eight knots.

Sunil
UNU–Fisheries Training Programme 19
Figure 9. Reference boat propeller cavitation as predicted by the HydroComp NavCad
software. (Plotted from Table 15).
In Figure 10 the maximum available power at each selected speed and the power transmission
factor are plotted against speed, showing engine overload at approx. 9.5 knots and that the power
transmission factor becomes drastically low.
Figure 10. Reference boat, power utilisation (Plotted from Table 16).
6 DISCUSSION
Stability analysis with modification
Stability analysis under six operating conditions shows that the reference boat has a good
stability. When the fish hold is flooded the stability fails. These failure is due to free surface

Sunil
UNU–Fisheries Training Programme 20
effect of water in the fish hold. But if the fish hold with three longitudinal compartments, the
results show these compartments can increase stability of the boat by reducing free surface effect.
For many stability criteria, the marginal values increase when the fish hold has compartments,
as can be seen by comparing last two rows in Tables 8-13.
The modifications related with chilled bath show some changes of their marginal values. By
putting nets in the storage the stability will improve as the nets basically act like additional ballast
by lowering centre of gravity. But by filling with chilled water the free surface effect will have
negative influence on the stability in the same way as raising the centre of gravity.
When the deck is lifted, the freeboard and hull shape of the boat are changed. The stability was
investigated for these changes and results are given in 1st row under modifications for every
loading conditions. Some stability criteria margins increase due to higher freeboard and others
decrease due to lift of the centre of gravity.
Total effective power, propeller efficiency and propulsion parameter
Total effective power can be determined (Table 14) without tank test for the reference boat. The
main advantage of using HydroComp NavCad software that a tank test is not needed and big
amount of money may be saved. The same goes for the estimation of propeller parameters (Table
15). Many propeller design parameters can be determined and investigated. Open water tests and
cavitation tunnel tests are not required.
Hydrocomp NavCad programme has given enough details to match the suitable propeller for the
reference boat. Then the propulsion system of the reference boat can be completed by assembling
the required propeller having diameter of 900 mm and pitch of 580 mm to establish 8 knots of
service speed (Table 3 and Table 15).
The engine delivers 28% of its total engine power used at 8 knots and the engine is overloaded
at 10 knots (Table 16). It make sense that there might be better configuration of propulsion
system than have been evaluated in this study.
In addition, the performance of a propulsion system can be monitored and evaluated according
to the calculated results (Table 16). Performance variations with design parameters can be
identified. This data is useful for new design to develop an efficient propulsion system and to
evaluate running trail results.
Sea trial data are valuable and once analysed can be used to improve performance. The best
answers can be found for such basic questions as:
is the engine generating full power,
what is the efficiency of the propulsion system,
is there loss of thrust through excessive cavitation,
does the vessel reach designed speed and if not how much more power is needed,
how does this boat compare with other boats, and
are the test numbers reliable (Macpherson, 2003).
The evaluating process
By using template it was found that the reference boat with a displacement of 25 tons can reach
a speed of 8 knot using 28% of the available power of a 147kw engine and is unable to reach 10
knots because overloading the engine for the 4 bladed propeller having a diameter of 900 mm

Sunil
UNU–Fisheries Training Programme 21
and pitch of 580 mm. The reference boat has a sound stability during the entire voyage and the
intended operation.
Based on my experience of boat building and sea trails for existing fishing vessels in Sri Lanka
over the last decade, it is my conclusion that results in this project give an accurate picture of the
real world conditions. The theoretical models fit to the real operational parameters of existing
boats using this hull form (Annex 4) as well as commonly available main engines and propulsion
equipment in Sri Lanka.
There are some advantages using my template for these studies. No replacement of engine or
other machinery component or hull modification are need for these evaluations. It will save time
and labour.
7 CONCLUSION
Stability analysis (GHS)
Generally the reference boat has good stability, but stability margins for some operating
conditions fluctuate and that needs to be considered in the design and operation of the vessels.
Resistance and propulsion prediction (HydroComp NavCad)
Two working templates have been prepared. One is for selecting the best propeller for an
optimum design speed. The other is for evaluating sea trails for new vessels and how to use the
results to fix problems and to improve vessel performance.
Using GHS and HydroComp NavCad together
General weight distribution that is suitable for design trim can be found by GHS. Optimum
propulsion parameter can be analysed and selected by using HydroComp NavCad software in
order to make a better fuel saving.
It has been beneficial to learn how to use the software and gain practical experience with a model
that proved to be realistic and reliable for the selected vessel regarding its operational
characteristics.
One can use these programs with confidence to recommend modifications to an existing boat
regarding stability, propulsion performance and operation. The same applies for new designs
except more detailed data is needed on intended fishing operation and existing parent boats.
In this way, a boat can be modelled and analysed for stability, resistance and propulsion by
governmental institutions, boat yards and designers. It will help to ensure safety at sea, establish
better operation and endurance of single vessels, and improve the general condition of the
national fleet.

Sunil
UNU–Fisheries Training Programme 22
AKNOWLEDGEMENTS
I would like to thank the United Nations University for granting me a fellowship to participate
in the fisheries training programme in Iceland. My sincere gratitude goes especially to Dr Tumi
Tomasson, program director of the UNU-FTP, Mr Thor H. Asgeirsson, deputy director of the
programme, and staff of UNU-FTP Sigridur Ingvardottir and Mary Frances for their valuable
support and encouragement.
My sincere thanks to my supervisor Sigurdur Jonsson and Einar Hreinsson for their lectures,
guidance, and unforgettable support to complete my final project.
I also would like to thank the staff of MRI, Isafjordur, and Mr Peter Weises, Director, University
Centre of the Westfjords for kind cooperation during my studies.
My further thanks are extended to Mr Nimal Hettiarrachchi, Director General, Department of
Fisheries and Aquatic Resources, Sri Lanka. Finally my special thanks to my wife Imali and son
Sanila for bearing my absence.

Sunil
UNU–Fisheries Training Programme 23
LIST OF REFERENCES
Fyson, J. (1985). Design of Small Fishing Vessels. England: Fishing News (Books) Limited.
Gerr, D. (2001). Propeller hand book. Camden: International Marine.
General Hydrostatic. (2014). GHS PMT reference center: accessed on 21st January 2014 on
www.ghsporn.com
Gudmundsson, A. (2009). Safety practices related to small fishing vessel stability. Rome: FAO.
Gulbrandsen, O. (2012). Fuel Saving for Small Fishing Vessel. Rome: FAO.
Hydrocomp (2014). Hydrocomp, Inc. accessed on 21st January 2014 on hydrocompinc.com.
Macpherson, D. M. (2003). Sea trail analysis: the value in the data . Hydrocomp, Inc: accessed
on 21st January 2014 on www.hydrocompinc.com
MPTE. (2006). MPTE newsletter: Design power and rpm for propeller sizing. Marine
performance technology exchange. Hydrocomp,Inc. accessed on 21st January 2014 on
www.hydrocompinc.com
MFARD. (2009). Fishing boat Safety Regulations,2009: the Gazette of the Democratic Socialist
Republic of Sri Lanka.Colombo :Sri Lanka
MFARD. (2013). Fisheries statistics: unpublished; Ministry of Fisheries and Aquatic Resources
Development. Colombo:Sri Lanka.
Qureshi, M. R., Magnusson, H., and Traung, J. O. (1955). Fishing boats of the world. In J. O.
Traung (pp. 25-50). England: Fishing News (Books) Limited.
Ragnarsson, E. (2003). Naval architecture. A booklet produced by United Nations University
Fisheries Trainning Program.
Rawson, k. J., and Tupper, E. C. (2001). Basic ship theory. 5th edition. London: Longman Group
Limited.

Sunil
UNU–Fisheries Training Programme 24
ANNEX 1: LINES PLAN
Sunil
UNU–Fisheries Training Programme 25
ANNEX 2: GENERAL ARRANGEMENT PLAN

Sunil
UNU–Fisheries Training Programme 26
ANNEX 3: HYDROSTATIC PARTICULARS
Hydrostatic properties (No Trim , No Heel, VCG = 0,00)
Draft
(m)
Displaceme
nt
weight(MT)
LCB
(m)
VCB
(m)
Weight
(MT)/cm LCF
moment(m.MT)
trim(deg)
KML
(m)
KMT
(m)
0,1 0,23 4,988f -0,032 0,01 5,478f 0,12 30,54 -0,028
0,2 0,3 5,032f 0,009 0,01 4,696f 0,07 13,62 0,013
0,3 0,77 5,874f 0,166 0,08 6,534f 0,62 46,29 1,269
0,4 1,85 6,301f 0,275 0,13 6,665f 1,11 34,34 1,988
0,5 3,44 6,451f 0,358 0,19 6,628f 1,68 27,89 2,642
0,6 5,5 6,493f 0,43 0,23 6,459f 2,46 25,63 2,657
0,7 8,05 6,435f 0,501 0,28 6,161f 3,65 26,01 3,015
0,8 11,25 6,264f 0,572 0,35 5,603f 5,89 30,02 3,171
0,9 14,88 6,086f 0,64 0,38 5,507f 6,84 26,33 2,824
1 18,71 5,972f 0,704 0,39 5,556f 7,4 22,66 2,619
1,1 22,68 5,905f 0,764 0,4 5,615f 7,87 19,87 2,453
1,2 26,77 5,865f 0,823 0,41 5,669f 8,33 17,82 2,35
1,3 30,97 5,842f 0,881 0,43 5,713f 8,77 16,22 2,286
1,4 35,28 5,829f 0,939 0,44 5,749f 9,19 14,93 2,248
1,5 39,69 5,822f 0,995 0,45 5,775f 9,57 13,82 2,229
1,6 44,21 5,820f 1,052 0,46 5,825f 10,08 13,06 2,229
1,7 48,84 5,823f 1,109 0,47 5,873f 10,59 12,42 2,241
1,8 53,6 5,830f 1,166 0,48 5,940f 11,21 11,98 2,268
1,9 58,48 5,844f 1,223 0,48 6,105f 11,73 11,5 2,167
2 62,88 5,876f 1,274 0,39 6,575f 10,94 9,96 1,744
2,1 65,88 5,938f 1,309 0,19 8,632f 5,97 5,19 1,434
2,2 67,03 6,012f 1,323 0,06 11,890f 1,64 1,4 1,353
2,3 67,46 6,052f 1,329 0,03 12,857f 1,58 1,34 1,337
2,4 67,6 6,067f 1,331 0 13,552f 1,57 1,33 1,332
Specific gravity = 1,025 Draft is from Base Line

Sunil
UNU–Fisheries Training Programme 27
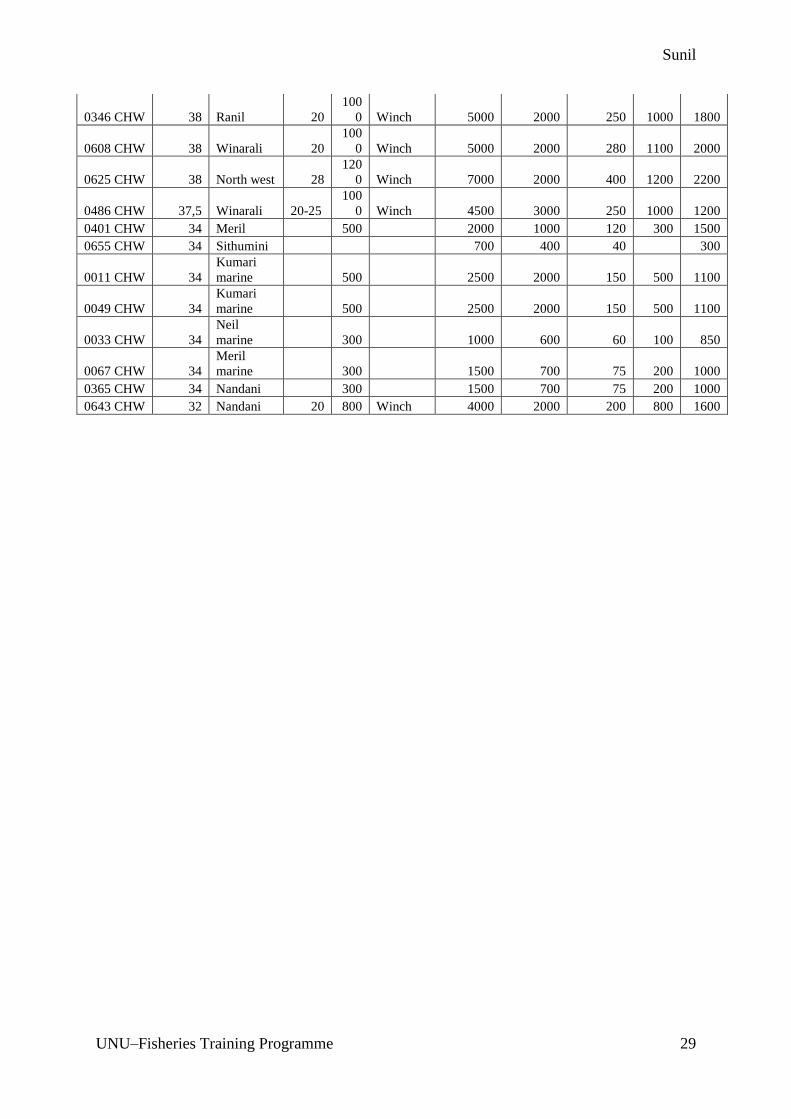
ANNEX 4: VESSEL DATA COLLECTED BY AUTHOR IN INTERVIEWS OF SRI
LANKA SKIPPERS ON AUG 2013
Registratio
n No
Length
(foot) Boat Yard
Perio
d at
sea
(days)
No
of
hoo
ks
Hauling
method
Fuel
Capacity
( Litres)
Water
Capacity
(litres)
Ice
capacity
(*45 Kg)
Bait
(kg)
Catch
(Kg)
0217CHW 47 Lawrance 30 800 Winch 8000 3000 320 1500 2000
0356 CHW 46 Sindathri 30 750 Winch 6000 2000 210 1100 7000
0405 CHW 46 Ranil 15-20
100
0 Winch 4000 2000 200 1000 2200
0461 NBO 45 Neil maine 20
100
0 Winch 4500 2500 225 1200 1800
0493 CHW 45 Sindathri 20-25
100
0 Winch 5000 2500 225 1000 2000
0507 CHW 45 Sindathri 20-25
100
0 Winch 5000 2500 225 1000 2200
0543 CHW 45 Winarali 22-30
100
0 Winch 7000 2500 280 1000 1900
0596 CHW 45 Winarali 30 750 Winch 6000 2000 240 1300 1800
1015 NBO 45
Neil
marine 15-20
100
0 Winch 4500 2000 235 1200 1900
0578 TLE 45 Blue star 15-20
100
0 Winch 4500 2500 260 1200 1800
0289 CHW 45 Sindathri 15 750 Winch 6500 2500 350 1000 1500
0267 CHW 45 Sindathri 22 750 Winch 5000 3500 240 1000 1800
0178 CHW 45 Sealani 800 Winch 3000 2000 200 1000 1800
0119CHW 45 Sindathri
100
0 Winch 3000 2000 200 1000 1800
0195 NBO 45 Sindathri
100
0 Winch 4000 2000 250 1000 2000
0196 NBO 45 Ranil
100
0 Winch 3000 2000 200 1000 1800
0510 CHW 45 Sindathri
100
0 Winch 4000 2000 250 1000 2000
0609 CHW 45 Winarali
120
0 Winch 4500 3000 270 1000 2200
0610 CHW 43 Winarali
120
0 Winch 4500 3000 270 1000 2200
0633 CHW 43 Sindathri
120
0 Winch 4500 3000 270 1000 2200
0341 CHW 42 VJ 21 450 Winch 6000 3000 250 FISH 2000
0224 CHW 42 VJ 21 750 Winch 6000 3000 250 1000 2000
0195 CHW 42 Sindathri 25
100
0 Winch 5000 2000 180 1000 2000
0196 CHW 42 Sindathri 25
100
0 Winch 5000 2500 200 1000 2000
0358 CHW 42 VJ 20-25
100
0 Winch 6000 2800 250 1000 1500
0532 CHW 42 VJ 20-25
100
0 Winch 6000 2800 250 1000 1500
0488 CHW 42 Winarali 25 700 Winch 5000 2000 300 1000 2000
0469 NBO 42 Sea horse 20-22 950 Winch 5000 3000 250 1000 2500
0405 CHW 42
Ranil
marine 15 900 Winch 4000 2500 200 1000 2500
0513 CHW 40,6 KSLF 22 750 Winch 6000 3000 200 1200 2000

Sunil
UNU–Fisheries Training Programme 28
0627 CHW 40,5 Sindathri 21-25
120
0 Winch 6000 3000 350 1200 2000
0646 CHW 40,5 Sindathri 21-25
120
0 Winch 6000 3000 350 1200 2000
0599 CHW 40 Sindathri 21-25
120
0 Winch 6000 3000 250 1200 2000
0522 CHW 40 Sindathri 22
100
0 Winch 6000 2000 240 1000 1750
0110 CHW 40
Meril
marine 20-25 4000 2500 250 2000
0292 CHW 40 Sealani 20
100
0 Winch 5700 2600 240 1200 2500
0012 CHW 40 Blue star 20-22
120
0 Winch 4000 2000 250 1200 2500
0556 CHW 40 Sindathri 20-22
120
0 Winch 5000 2000 200 1200 2500
0090 CHW 40 Ranil 15-20
100
0 Winch 4000 2000 220 900 2000
0236 CHW 40 Sindathri 20 900 Winch 4700 2000 220 1000 2000
0443 CHW 40 Sindathri 30 750 Winch 5000 2000 280 1000 2000
0391 CHW 40 Sindathri 25
100
0 Winch 7000 3000 220 1200 2000
0134 CHW 40 Lawrance 22 Winch 7000 4000 275 1200 2200
0451 CHW 40 VJ 22
100
0 Winch 5000 2000 230 1000 2500
0131 CHW 40 Sindathri 22
120
0 Winch 5000 2000 240 1200 2400
0549 CHW 40 Sindathri 20-25
100
0 Winch 6000 2000 240 1300 2500
0558 CHW 40 VJ 25 750 Winch 4000 2500 230 1000 2200
0621 CHW 40 Winarali 25 Winch 4000 2800 250 1000 2300
0512 CHW 40 Sindathri 30 Winch 8000 2000 400 1400 2300
0392 CHW 40 JMC 30 Winch 6000 2500 250 1000 1500
0652 CHW 40 Lawrance 30 Winch 7000 3000 300 1300 2000
0208 CHW 40 Sindathri 20-25
100
0 Winch 5000 2000 250 1000 2500
0469 NBO 40 Sea horse 20 950 Winch 5000 3000 250 1000 2000
0562 CHW 40 Back horse 20 750 Winch 3000 2500 180 900 2200
0514 CHW 40
Kumari
marine 20-25
100
0 Winch 10000 4000 350 1100 2750
0420 CHW 40 VJ 20-25
100
0 Winch 7000 3000 250 1000 2500
0447 CHW 40 VJ 20-25
100
0 Winch 7000 3000 250 1000 2500
0173 CHW 40 Ranil 20-25
100
0 Winch 4500 2000 200 1000 2200
0525 CHW 40 VJ 21
100
0 Winch 6000 3000 250 1000 1500
0526 CHW 40 VJ 21
100
0 Winch 6000 3000 250 1000 1250
0583 CHW 40 Winarali 20 800 Winch 5000 2000 220 1000 2000
0632 CHW 40 Sealani 25 800 Winch 5000 2000 240 1000 1500
0406 CHW 38 Ranil 15-25 850 Winch 5000 2000 250 1000 1500
0424 CHW 38 VJ 15-20 900 Winch 5000 3000 250 1000 1500
0010 CHW 38 Sindathri 20-25 900 Winch 6500 3000 250 1100 1500
0419 CHW 38 Blue star 20-25
100
0 Winch 6000 3000 250 1000 1500
Sunil
UNU–Fisheries Training Programme 29
0346 CHW 38 Ranil 20
100
0 Winch 5000 2000 250 1000 1800
0608 CHW 38 Winarali 20
100
0 Winch 5000 2000 280 1100 2000
0625 CHW 38 North west 28
120
0 Winch 7000 2000 400 1200 2200
0486 CHW 37,5 Winarali 20-25
100
0 Winch 4500 3000 250 1000 1200
0401 CHW 34 Meril 500 2000 1000 120 300 1500
0655 CHW 34 Sithumini 700 400 40 300
0011 CHW 34
Kumari
marine 500 2500 2000 150 500 1100
0049 CHW 34
Kumari
marine 500 2500 2000 150 500 1100
0033 CHW 34
Neil
marine 300 1000 600 60 100 850
0067 CHW 34
Meril
marine 300 1500 700 75 200 1000
0365 CHW 34 Nandani 300 1500 700 75 200 1000
0643 CHW 32 Nandani 20 800 Winch 4000 2000 200 800 1600
Top Related