


Languages
Pages
Legal

Population genetic structure and life history variability
in Oncorhynchus nerka from the Snake River Basin
Final Report of Research
Robin S. Waples Paul B. Aebersold Gary A. Winans
Funded by
Division of Fish and Wildlife Bonneville Power Administration
Department of Energy Project BPA 93-066
Contract DE-A179-93BP05326
and
Coastal Zone and Estuarine Studies Division Northwest Fisheries Science Center National Marine Fisheries Service
National Oceanic and Atmospheric Administration 2725 Montlake Boulevard East
Seattle, Washington 98112-2097
May 1997

... 111
CONTENTS Page
EXECUTIVESUMMARY . . . . . . . . . . . . . . . . . . . . . . . . . . . . . . . . . . . . . . . . . . v . . . . . . . . . . . . . . . . . . . . . . . . . . . . . . . . . . . . . . . . . . . . . . . . INTRODUCTION 1
METHODS . . . . . . . . . . . . . . . . . . . . . . . . . . . . . . . . . . . . . . . . . . . . . . . . . . . . . . 3 . . . . . . . . . . . . . . . . . . . . . . . . . . . . . Study Areas and Experimental Design 3
. . . . . . . . . . . . . . . . . . . . . . . . . . . . . . . . . . . . . . . . . . . . . . RedfishLake 4 AlturasLake . . . . . . . . . . . . . . . . . . . . . . . . . . . . . . . . . . . . . . . . . . . . . 8 OtherSnakeRiverlakes . . . . . . . . . . . . . . . . . . . . . . . . . . . . . . . . . . . . 8
. . . . . . . . . . . . . . . . . . . . . . . . . . . . . . . . . . . . . . . . . . . . Idahokokanee 9 . . . . . . . . . . . . . . . . . . . . . . . . . . . . . Columbia River sockeye salmon 10 . . . . . . . . . . . . . . . . . . . . . . . . . . . . . Deschutes River basin 0 . nerka 10
. . . . . . . . . . . . . . . . . . . . . . . . . . . . . . . . . . . . . . . . . . . . Other samples 10
. . . . . . . . . . . . . . . . . . . . . . . . . . . . . . . . . . . . . . . . . . . Sampling Methods 11 . . . . . . . . . . . . . . . . . . . . . . . . . . . . . . . . . . . . . . . . . . . . . . Data Analysis 12
. . . . . . . . . . . . . . . . . . . . . . . . . . . . . . . . . . . . . . . . . . . . . . . . . . . . . . RESULTS 15 . . . . . . . . . . . . . . . . . . . . . . . . . . . . . . . . . . . . . . . . Preliminary Analyses 15
. . . . . . . . . . . . . . . . . . . . . Tests of Genotypic and Phenotypic Proportions 17 . . . . . . . . . . . . . . . . . . . . . . . . . . . . . . . . . . . . . . . Temporal Comparisons 19
. . . . . . . . . . . . . . . . . . . . . . . . . . . . . . . . . . . Levels of Genetic Variability 20 . . . . . . . . . . . Variation Between Life-history Forms and Collection Types 22
. . . . . . . . . . . . . . . . . . . . . . . . . . . . . . . . . . . . . . . . . Geographic Variation 23 . . . . . . . . . . . . . . . . . . . . . . . . . . . . . . . . . . . . . . . . . . Sawtooth Valley 32
Idahokokanee . . . . . . . . . . . . . . . . . . . . . . . . . . . . . . . . . . . . . . . . . . . . 34 DISCUSSION . . . . . . . . . . . . . . . . . . . . . . . . . . . . . . . . . . . . . . . . . . . . . . . . . . 36
. . . . . . . . . . . . . . . . . . . . . . . . . . . . . . . . . . . . . . . . . Redfish Lake 0 nerka 36 . . . . . . . . . . . . . . . . . . . . . . . . . . . . . . . . . . . . . Effects of Stock Transfers 40
. . . . . . . . . . . . . . . . . . . . . . . . Amount and Pattern of Genetic Variability 47 . . . . . . . . . . . . . . . . . . . . . . . . . . . . . . . . . . . Captive Broodstock Program 50
. . . . . . . . . . . . . . . . . . . . . . . . . Comparison with Results of DNA Studies 51 . . . . . . . . . . . . . . . . . . . . . . . . . . . . . . . . . . . . . . . . . ACKNOWLEDGMENTS 52
REFERENCES . . . . . . . . . . . . . . . . . . . . . . . . . . . . . . . . . . . . . . . . . . . . . . . . 53 . . . . . . . . . . . . . . . . . . . . . . . . . . . . . . . . . . . . . . . . . . . . APPENDIX TABLES 57

v
EXECUTIVE S-Y
We used protein electrophoresis to examine genetic relationships among
samples of sockeye salmon and kokanee (Oncorhynchus nerka) from the Snake River
basin. A few collections from elsewhere in the Pacific Northwest were also included to
add perspective to the analysis. After combining temporal samples that did not differ
statistically within and between years, 32 different populations were examined for
variation at 64 gene loci scored in all populations. Thirty-five (55%) of these gene loci
surveyed were polymorphic in at least one population. Average heterozygosities were
relatively low (0.006-0.041), but genetic differentiation among populations was
pronounced: the value of Wright's FsT of 0.244 is higher than has been reported in any
other study of Pacific salmon.
A detailed examination of 0. nerka from lakes in the Sawtooth Valley of Idaho
was undertaken to help guide recovery planning for the endangered Redfish Lake
population and to help resolve relationships between resident and anadromous forms.
In Redfish Lake, sockeye salmon that returned in 1991-93 were genetically distinct
from Fishhook Creek kokanee but were similar to juvenile outmigrants and a small
group of "residual" sockeye salmon discovered in the lake in 1992. l 'h is result is
consistent-with the hypothesis that the original sockeye salmon population was not
extirpated by Sunbeam Dam early in this century. Populations of 0. nerka that
appear to be native were also found in Alturas and Stanley Lakes. Collectively, the
native 0. nerka from the Sawtooth Valley lakes form a coherent group that is well-
separated genetically from all other populations of 0. nerka in the Pacific Northwest.
In contrast, the kokanee population sampled from Pettit Lake appears to be the result
of an introduction of late-spawning kokanee from northern ldaho (Lake Pend Oreille).
vi
In addition t o a population of presumably native 0. nerka, Stanley Lake also supports
a population of kokanee that appears to be the result of an introduction from Wizard
Falls Hatchery in Oregon. We found no evidence of permanent genetic effects from the
1980s releases into Stanley and Alturas Lakes of several million sockeye salmon eggs
from the Babine Lake area in British Columbia.
It is not clear whether native populations of 0. nerka still exist in other lakes in
the Snake River basin. Samples examined from Payette and Wallowa Lakes appear to
be the result of introductions of one or more exogenous gene pools. A 1990 sample
from Warm Lake was quite distinctive genetically, but the lake was stocked with
non-native fish in that year, and a subsequent (1992) sample from Warm Lake was
genetically indistinguishable from several widely used kokanee stocks from Idaho.
INTRODUCTION
In November 1991 (Federal Register 56:58619; 20 November 1991), the National
Marine Fisheries Service (NMFS) announced its final listing determination that Snake
River sockeye salmon, Oncorhynchus nerka, was an endangered species under the U.S.
Endangered Species Act (ESA). This action followed a status review by NMFS (Waples
et al. 1991a) that led to a proposed listing in April 1991. The only remaining
population of Snake River sockeye salmon occurs in Re&sh Lake in the Sawtooth
Valley1 area near Stanley, Idaho. In 1990, no sockeye salmon were observed entering
the lake to spawn, and in 1991 just four adults returned. Adult returns in subsequent
years numbered 1, 8, 2, 0, and 1 in 1992, 1993, 1994, 1995, and 1996, respectively.
In addition to the anadromous sockeye population, Redfish Lake supports a
native population of kokanee, or non-anadromous 0. nerka. Whereas all recent
observations of sockeye salmon spawning have been on the lake shore in October and
November, the known kokanee population spawns in August and September in
Fishhook Creek, the major inlet stream to Redfish Lake. Kokanee, which spend their
entire life cycle in fresh water, mature at a much smaller size than anadromous
sockeye salmon (about 6-8 inches vs. about 20-24 inches). In 1992, a third group of
0 . nerka, tentatively termed "residual" sockeye salmon, was identified in Re&sh Lake.
Residuals spawn at approximately the same time and place as the sockeye salmon but
are the same size as the kokanee.
Although only Redfish Lake has supported an anadromous Snake River run in
recent years, historical records indicate that sockeye salmon were also native to
'Some previous reports have referred to this area as the "Stanley Basin," but that place name does not appear on USGS maps and is not in general use by local residents.
2
several other lakes in the Sawtooth Valley area (Alturas, Stanley, Pettit, and perhaps
Yellowbelly Lakes). Currently, Alturas, Stanley, and Pettit Lakes all have kokanee
populations, but the origins of these populations are uncertain because of past efforts
to eradicate native populations and subsequent planting of exogenous 0. nerka (Bjornn
et al. 1968, Hall-Griswold 1990, Welsh 1991). Outside the Sawtooth Valley area,
Snake River populations of sockeye salmon were also present historically in Payette
Lake, Warm Lake (in the South Fork Salmon River drainage), and Wallowa Lake (in
the Grande Ronde River drainage in northeast Oregon). Anadromous populations
disappeared long ago from these lakes as well, and current populations of 0. nerka
consist entirely of resident forms.
This brief historical review suggests a number of interesting questions relevant
to the status and recovery of Redfish Lake sockeye salmon. For example, What is the
relationship between sockeye salmon and kokanee in Redfish Lake? Between
anadromous and residual forms of sockeye salmon? Can either of the resident forms in
Redfish Lake be used to help recover the anadromous population? What have been the
effects of stock transfers of anadromous and resident 0. nerka into Sawtooth Valley
populations? What genetic lineages are represented by existing populations of
0. nerka in Snake River lakes that originally supported sockeye salmon? If recovery
efforts extend beyond Redfish Lake, which lakes and stocks would be most appropriate
to use?
Each of these questions is complex and can best be addressed through a
multidisciplinary approach. Genetic information can be particularly useful in making
informed decisions about listing and recovery. Toward this end, NMFS conducted an
extensive genetic analysis of 0. nerka from the Pacific Northwest during the course of
3
its status review (summarized by Monan 1991). Unfortunately, no anadromous adults
returned to Redfish Lake in 1990, so a comparison of sockeye salmon and kokanee in
Redfish Lake was .not possible at that tlme. Winans et al. (1996) summarized
information that was available for Redfish Lake 0. nerka at the time of listing and
placed it in the context of genetic variability in sockeye salmon and kokanee from the
Pacific Northwest as a whole.
Since completion of the 1991 status review, NMFS has analyzed a number of
additional samples from Snake River 0. nerka populations, including both anadromous
and residual sockeye salmon in Redfish Lake. During the period 1 October 1993 to
30 September 1994, NMFS genetic analyses of sockeye salmon were supported in part
by a grant from Bonneville Power Administration. This report summarizes results of
research conducted during that period, as well as other relevant analyses conducted by
NMFS both before and after the contract period. This report includes more recent
information for Sawtooth Valley 0. nerka than is contained in Winans et al. (1996),
and it also includes a more comprehensive evaluation of other populations of 0. nerka
from the Snake River basin.
METHODS
Study Areas and Experimental Design
Although this study focused on populations of 0. nerka in Redfish Lake and
other nearby lakes in Idaho, a few samples from a more extensive geographic region
(including British Columbia and Alaska) were included to address specific issues (such
as the effects of stock transfers) or to provide a broader geographic context for
interpreting the results. A total of 53 collections, differing in geographic or temporal
coverage or life history type involved, were considered (Table 1). Both resident and
4
anadromous forms were included, as well as some collections of uncertain parental
origin. In most of the analyses, temporal samples were combined to form either a
46- or 32-population dataset. Locations of the 32 population samples are identified on
the map in Figure 1. A brief description of the types of collections made and their
rationale follows.
Redfish Lake
At the start of this study, the most important question to resolve was the
relationship between sockeye salmon and kokanee in Redfish Lake. The 13 adult
sockeye salmon that returned to Redfish Lake in 1991-93 provided an opportunity for
comparison with samples of spawning kokanee collected in 1990, 1991, and 1992. In
the latter 2 years, both "early" and "late" spawning kokanee were collected to test
whether there is evidence of genetic differentiation within the run (as life history data
reported by Brannon et al. (1994) suggested might be the case).
Three other types of collections of 0. nerka were also made in Redfish Lake. In
1990, 1992, 1993, and 1994, midwater trawls were used to collect samples of mixed-age
0. nerka. In 1991-93, juvenile 0. nerka outmigrating from Redfish Lake in the spring
were trapped alive, and some were retained for use in a captive broodstock program
(Johnson 1993, Flagg 1993). Mortalities that resulted from these trapping and rearing
programs were used for genetic analysis in this study. Finally, small collections of
"residual" 0. nerka were made in 1992 and 1993.
These latter collections were prompted by two observations. First, preliminary
results from this study indicated that outmigrant 0. nerka were genetically similar to
Redfish Lake sockeye salmon but had substantial allele frequency differences
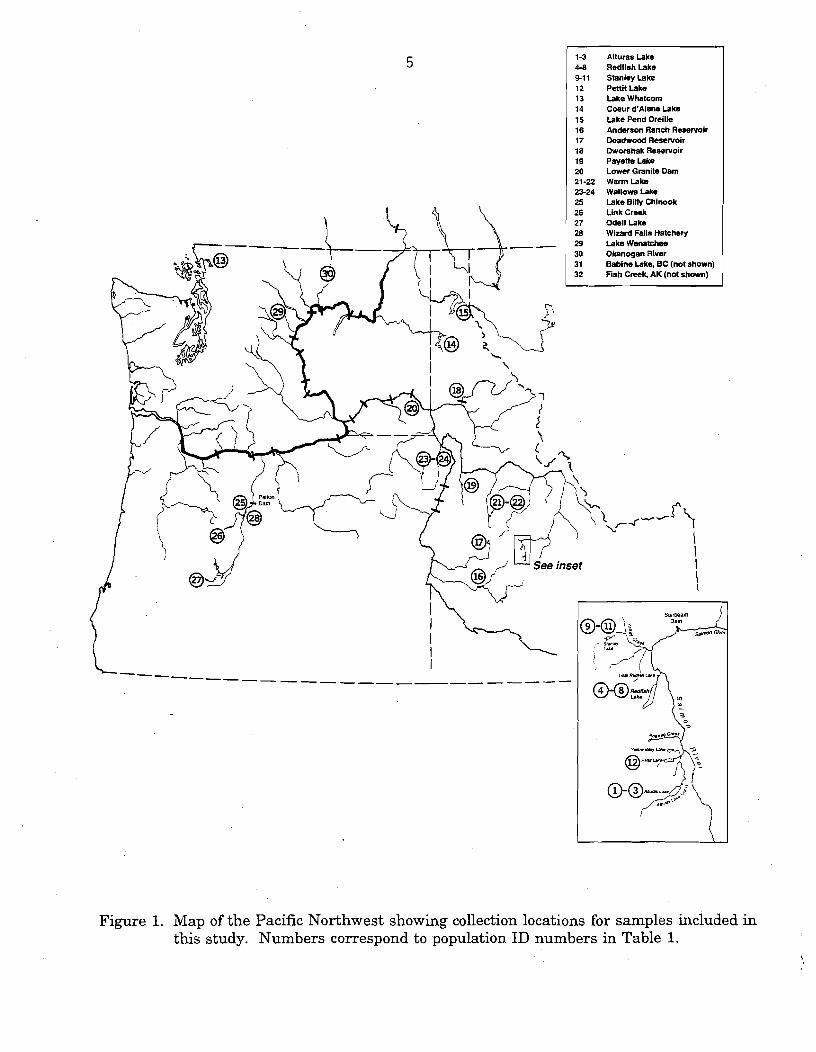
1-3 Alturas Lake 4-8 Redfish Lake 9-11 Stanley Lake 12 Pettitlake 13 Lake Whatcorn 14 Coeur d'Alene Lake 15 Lake Pend Oreille 16 Anderson Ranch Reservoir 17 Deadwood Reservoir 18 Dworshak Reservoir 19 Payetto Lake 20 Lower Granite Dam 21-22 Warm Lake 23-24 Wallown Lake 25 Lake Billy Chinook 26 LinkCrwk 27 Odell Lake 28 Wizard Falls Hatchery 29 Lake Wenatchee 30 Okanogan River 31 Babine Lake. BC (not shown) 32 Fish Creek, AK (not shown)
I
Figure 1. Map of the Pacific Northwest showing collection locations for samples included in this study. Numbers correspond to population ID numbers in Table 1.
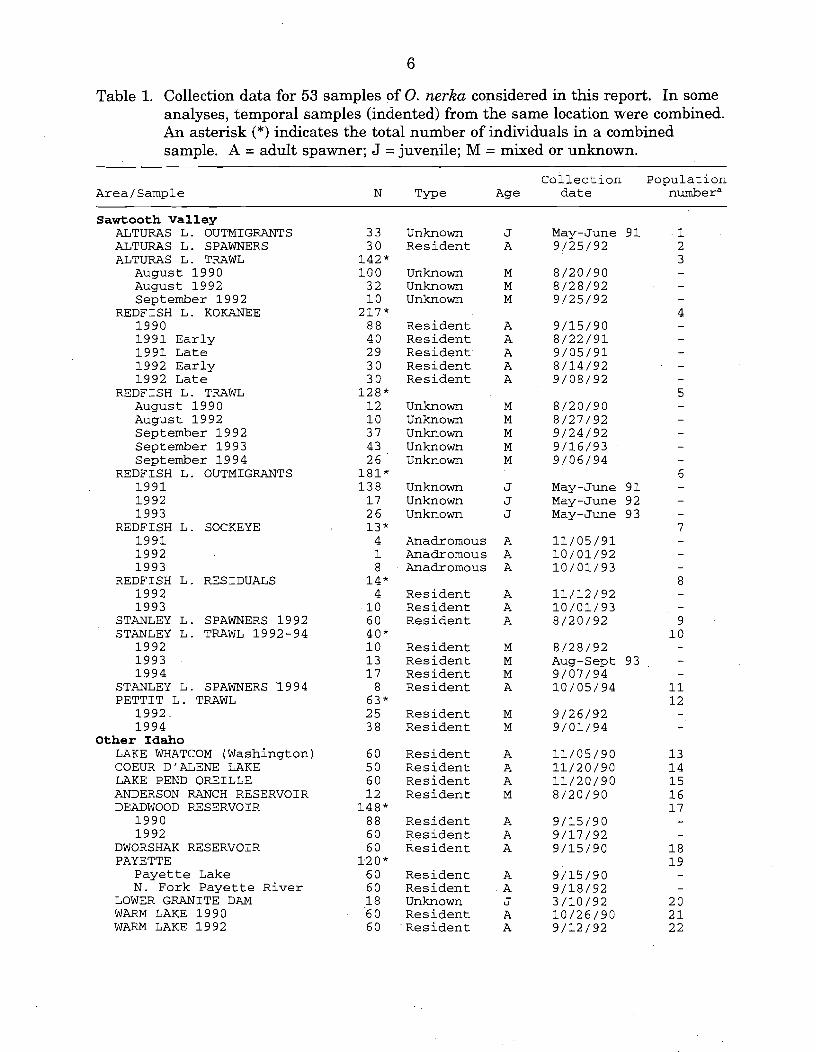
Table 1. Collection data for 53 samples of 0. nerka considered in this report. In some analyses, temporal samples (indented) from the same location were combined. An asterisk (*) indicates the total number of individuals in a combined sample. A = adult spawner; J =juvenile; M = mixed or unknown.
Collection Popula~ion N Type Age date n h e r a
- - - -
Sawtooth Valley ALTURAS L. OUTMIGRANTS ALTURAS L. SPAWNERS ALTURAS L. TRAWL
August 1 9 9 0 August 1 9 9 2 September 1 9 9 2
REDFISH L. KOKANEE 1 9 9 0 1 9 9 1 Early 1 9 9 1 Late 1 9 9 2 Early 1 9 9 2 Late
REDFISH L. TRAWL August 1 9 9 0 August 1 9 9 2 September 1 9 9 2 September 1 9 9 3 September 1 9 9 4
REDFISH L. OUTMIGRANTS 1 9 9 1 1 9 9 2 1993
REDFISH L. SOCKEYE 1 9 9 1 1 9 9 2 1 9 9 3
REDFISH L. RESIDUALS 1 9 9 2 1 9 9 3
STANLEY L. SPAWNERS 1 9 9 2 STANLEY L. TRAWL 1 9 9 2 - 9 4
1 9 9 2 1 9 9 3 1 9 9 4
STANLEY L. SPAWNERS '1994 PETTIT L. TRAWL
1 9 9 2 . 1 9 9 4
Other Idaho LAKE WHATCOM (Washington) COEUR D'ALENE LAKE LAKE PEND OREILLE ANDERSON RANCH RESERVOIR DEADWOOD RESERVOIR
1 9 9 0 1 9 9 2
DWORSHAK RESERVOIR PAYETTE
Payette Lake N. Fork Payette River
LOWER GRANITE DAM WARM LAKE 1 9 9 0 WARM LAKE 1 9 9 2
Unknown J Resident A
Unknown M Unknown M Unknown M
Resident A Resident A Resident A Resident A Resident A
Unknown M Unknown M Unknown M Unknown M Unknown M
Unknown J Unknown J Unknown J
Anadromous A Anadromous A Anadromous A
Resident A Resident A Resident A
Resident M Resident M Resident M Resident A
Resident M Resident M
Resident A Resident A Resident A Resident M
Resident A Resident A Resident A
Resident A Resident . A Unknown J Resident A Resident A
May-June 9 1 1 9 / 2 5 / 9 2 2
3 8 / 2 0 / 9 0 - 8 / 2 8 / 9 2 - 9 / 2 5 / 9 2 -
4 9 / 1 5 / 9 0 - 8 / 2 2 / 9 1 - 9 / 0 5 / 9 1 - 8 / 1 4 / 9 2 - 9 / 0 8 / 9 2 -
5 8 / 2 0 / 9 0 - 8 / 2 7 / 9 2 - 9 / 2 4 / 9 2 - 9 / 1 6 / 9 3 - 9 / 0 6 / 9 4 -
6 May-June 9 1 - May-June 92 - May-June 93 -
7 1 1 / 0 5 / 9 1 - 1 0 / 0 1 / 9 2 - 1 0 / 0 1 / 9 3 -
8 1 1 / 1 2 / 9 2 - 1 0 / 0 1 / 9 3 - 8 / 2 0 / 9 2 9
1 0 8 / 2 8 / 9 2 - Aug-Sept 93 - 9 / 0 7 / 9 4 - 1 0 / 0 5 / 9 4 11
1 2 9 / 2 6 / 9 2 - 9 / 0 1 / 9 4 -
Table 1, continued
Area/Sample Collection Population
N Type Age date number - -
Oregon WALLOWA RIVER WALLOWA LAKE LAKE BILLY CHINOOK LINK CREEK ODELL LAKE WIZARD FALLS HATCHERY
Washington LAKE WENATCHEE
Brood Year 1987 Brood Year 1988
British Columbia OKANOGAN RIVER BABINE LAKE
Alaska FISH CREEK
Resident Resident Resident Resident Resident Resident
Anadromous Anadromous
Anadromous Anadromous
Anadromous
9/29/92 11/04/93 9/15/92 9/29/92 9/24/92 Spring 93
"Corresponds to population numbers in Figure 1.
compared to Fishhook Creek kokanee. This result suggested that most (perhaps all) of
the outmigrants came from a different gene pool than the kokanee. However, otolith
microchemistry data (Kline 1994, Rieman et al. 1994) indicated that a sizeable fraction
of the outmigrants had a resident female parent. This conclusion was based on a low
strontium/calcium ratio in the primordium of the otoliths from many of the
ourngrants, a finding that indicates the female parent had not spent time in
strontium-enriched sea water (Kalish 1990, Rieman et al. 1994).
Waples (1992) hypothesized that both these results could be explained by the
presence of a third group of 0. nerka in the lake--resident fish that were genetically
distinct from the kokanee. In fall 1992, as a result of concerted efforts by personnel
from Idaho Department of Fish and Game, the University of Idaho, and the Shoshone-
Bannock Tribes, these fish were located: individuals that are similar in size to
Fishhook Creek kokanee but spawn at the same location and approximately at the
same time as the sockeye salmon (Brannon et al. 1994). These fish have tentatively
been termed "residual" sockeye salmon in this report.
Alturas Lake
As in Redfish Lake, collections in Alturas Lake included samples of kokanee
spawners, juvenile outmigrants, and trawled mixed-age 0. nerka. No anadromous fish
have returned to Alturas Lake in recent decades, and no population comparable to the
Redfish Lake "residuals" has been identified.
Other Snake River lakes
The status of extant populations of 0. nerka in the Snake River is important to
resolve before a comprehensive recovery plan can be developed for recovery of Snake
9
River sockeye salmon. Stanley and Pettit Lakes are both within about 20 river miles
of Redfish Lake in the Sawtooth Valley area. Historical records indicate that both
lakes a t one time supported sockeye salmon populations, but anadromous runs
disappeared long ago following erection of barriers to migration and lake poisonings to
enhance opportunities for game fish. Both lakes currently support populations of
resident 0. nerka, but their origin is uncertain because both lakes have been stocked
with non-native sockeye salmon andlor kokanee. Warm Lake, Payette Lake, and
Wallowa Lake are other Snake River sites that a t one time supported runs of sockeye
salmon, but now have only resident forms of 0. nerka of uncertain origin.
Two years of trawl samples from Pettit Lake and 3 years of trawl and spawner
samples from Stanley Lake were examined in this study. In Warm Lake and Wallowa
Lake, spawning fish were sampled in 2 different years.
Idaho kokanee
Kokanee have been widely planted in Idaho as well as elsewhere in. the western
United States. Two major stock groups occur in the state: a late-spawning group from
northern Idaho, including Lake Pend Oreille and Coeur d'Alene Lake, and an early,
stream-spawning group from central Idaho, including populations from Deadwood,
Dworshak; and Anderson Ranch Reservoirs and Payette Lake. These stocks were
included because they, or their derivatives, have been transplanted into many Snake
River populations, including all of the Sawtooth Valley lakes. We also included a
sample of kokanee from Lake Whatcom (near Bellingham, WA) because this stock has
been widely planted throughout the Pacific Northwest, and it has been suggested
(Waples 1995) that this was the original source of the northern Idaho kokanee
populations. According to Bowler (1990), Kootenay Lake in British Columbia may
18
have been the original source for many early spawning kokanee populations in Idaho
and elsewhere in the Pacific Northwest.
Columbia River sockeye salmon
Apart from those in Redfish Lake, the only remaining sockeye salmon
populations in the Columbia River basin are from Lake Wenatchee and Lake Osoyoos
on the Okanogan River. Samples from these populations were included to provide a
more complete picture of genetic variability within the Columbia River basin.
Deschutes River basin 0. nerka
Historically, a run of sockeye salmon spawned in Link Creek and reared in
Suttle Lake in the Deschutes River basin of Oregon. This run was dramatically
affected by construction of a dam at the mouth of Suttle Lake in 1930 and construction
of Pelton Dam on the Deschutes River in 1959. Although a few anadromous fish have
returned to Pelton Dam in most recent years, there is no provision for fish passage.
We obtained three samples of resident 0. nerka from this river system, as well as from
a hatchery stock (Wizard Falls) that has been the source for numerous stock transfers
within the region.
Other samples
Three other samples of 0. nerka were included in this study. In the 1980s,
sockeye salmon eggs from the Babine Lake system in British Columbia were
outplanted in Alturas and Stanley Lakes, and a sample from Babine Lake provided an
opportunity to evaluate effects of these stock transfers. An Alaskan sample (from a
hatchery on Fish Creek in Cook Inlet) served as an outlier to provide a sense of
geographic perspective to the genetic data for other U.S. populations. Finally, during a
11
test in March 1992 of the feasibility of drawing down Columbia River reservoirs to
speed migration of juvenile salmon (USACE 1993), a number of 0. nerka were
unexpectedly found in the vicinity of Lower Granite Dam. We examined a sample of
18 individuals t o determine whether there was evidence that these fish were from the
listed Redfish Lake population.
Sampling Methods
A variety of collection methods were employed to sample natural populations.
In most localities, post-spawning adults were collected by net or beach seine. Because
of the large adult size difference between resident and anadromous forms, this method
provided the most reliable means of discriminating between the two forms in areas
where they co-occur. In the Sawtooth Valley lakes (Redfish, Alturas, Pettit, and
Stanley), midwater trawls were also used to collect 0. nerka from a mixture of age
classes. Resident adult 0. nerka (referred to as "residuals" in this report) were
collected in Redfish Lake using a floating Lake Merwin trap net. Finally, traps were
used in the outlet streams of Redfish and Alturas Lakes to collect 0. nerka migrating
out of the lake in the spring. Adult Redfish Lake sockeye salmon that returned to
spawn in 1991-93 were trapped for use in a captive broodstock program (Johnson
1993), and tissue samples for genetic analysis were obtained from the carcasses after
the fish had spawned.
Whole fish or tissues were frozen in the field and transported on dry ice to the
National Marine Fisheries Service (NMFS) laboratory in Seattle, where they were
transferred to an ultracold (-80°C) freezer for storage prior to electrophoretic analysis.
Procedures for starch gel electrophoresis followed descriptions in Aebersold et al.
(1987). Four tissues (skeletal muscle, liver, heart, and retinal tissue) were sampled
from each fish, and extracts were loaded onto starch gels utilizing seven different
buffer systems. Most of these buffers are described by Aebersold et al. (1987), with
modifications described by Waples et al. (1991b).
The 7 electrophoretic buffers used in combination with the 4 tissues resulted in
a screening protocol involving 16 gels for each 40 fish analyzed. Appendix Table 1 lists
the enzymes used, the loci scored, the tissue(s) and buffer(s) used to resolve each locus,
and the number of stocks that were polymorphic for each marker.
Locus names and abbreviations used the American Fisheries Society
nomenclature guidelines established by Shaklee et al. (1990). In general, when
multiple gene loci occur for a single enzyme, higher numbers correspond to gene
products that migrate farther from the origin on an electrophoretic gel. At each gene
locus, one allele (generally the most common) was designated the "100" allele and
additional alleles (if any) were designated by numbers reflecting the electrophoretic
mobility of their homomer relative to the "100" allele. Positive numbers represent
anodal mobility and negative numbers represent cathodal mobility.
Data Analysis
Electrophoretic phenotypes visualized on starch gels were interpreted as
genotypes according to guidelines discussed by Utter et al. (1987). Allelic frequencies,
genetic distance values, and tests of Hardy-Weinberg genotypic proportions were
obtained using the BIOSYS program (Swofford and Selander 1981). Standard chi-
square tests are problematical for Hardy-Weinberg tests in many salmon studies, such
as this one, that include some small sample sizes and have a substantial number of
loci with low levels of variability in some samples. To avoid difficulties with departure
13
of the test statistic from the chi-square distribution, we used Fisher's exact probability
test for all Hardy-Weinberg tests. At loci with more than two alleles expressed in a
sample, all alleles but the most common were pooled to yield a test involving two
alleles and three genotypic classes.
The unweighted pair-group method with arithmetic averages (UPGMA) was
used with Cavalli Sforza and Edwards' (1967) chord distance and Nei's (1978) unbiased
genetic distance values to generate dendrograms depicting genetic affinities among the
samples. The program Numerical Taxonomy and Multivariate Analysis System
(NTSYS; Rohlf 1993) was used to generate multidimensional scaling (MDS) plots of
genetic distance values. Multidimensional scaling plots allow one to view in two or
more dimensions the pattern of relationships among populations; in contrast, a
dendrogram is essentially a one-dimensional representation of the data. In general,
two-dimensional MDS plots result in less distortion of the relationships among
populations than do dendrograms, and the fit becomes increasingly better as more
dimensions are added. However, the degree of improvement in fit with each new
dimension added typically drops quickly, and in any case it is problematical to
illustrate more than three dimensions in a single plot. NTSYS was also used to
generate minimum-length spanning trees (MSTs) that can be superimposed on MDS
plots. An MST helps to identify pairs or groups of populations that appear to be
similar (because of the limitations in presenting multidimensional data) but actually
are not if other dimensions are taken into consideration.
Another approach used to evaluate the pattern of genetic relationships was
principal component analysis (PCA), using a variance-covariance matrix constructed
from allele frequency data using NTSYS (Rohlf 1993). In the PCA, rare alleles
14
(frequency < 0.01) were pooled with other allele classes, and "K - 1" allele classes were
analyzed per locus, where K is the number of alleles at that locus.
In 0. nerka, as in other salmonids, several pairs of duplicated gene loci occur
that form allelic products with identical electrophoretic mobility. These loci are termed
"isoloci" (Allendorf and Thorgaard 1984). Isoloci present special problems for
interpretation and data analysis because genotypes of individual fish cannot be
determined unambiguously. Waples (1988) developed a maximum likelihood method to
estimate the allele frequencies at the individual loci of an isolocus pair, and the chi-
square test he described was used to test for agreement of observed and expected
phenotypic proportions at isoloci that were polymorphic. This test is the two-locus
equivalent of the Hardy-Weinberg test for individual gene loci; it is particularly useful
in evaluating whether the observed data are consistent with the presumed genetic
model. However, for reasons discussed by Waples (1988), allele frequency estimates
for the individual loci of an isolocus pair may not be suitable for comparison among
populations. Therefore, the allele frequencies for isoloci presented in Appendix Table 2
are mean frequencies computed over both loci of an isolocus pair.
There is another class of gene loci that requires special consideration:
individual gene loci for which not all genotypes can be resolved. Typically, gene loci
detected by protein electrophoresis show codominant expression, meaning that both
alleles in an individual contribute equally to the observed phenotype. For example, a
heterozygote for a codominant locus will exhibit bands corresponding to both alleles,
whereas a homozygote will show only a single band. In practice, however, some loci do
not consistently exhibit codominant phenotypes. In sockeye salmon, overlapping bands
from other gene loci make it difficult to score all phenotypes at LDH-AI* and PGM-I*.
For these loci, only two phenotypic classes are scored:' one class that includes only the
individuals that are homozygous for the variant allele (genotype denoted by "22'7, and
another class that includes both heterozygotes (genotype " 12") and homozygotes for the
common allele (genotype " 11"). Allele frequency of the variant "2" allele can be
estimated as the square root of the frequency of the "22" phenotype, with frequency of
the common "1"allele estimated as 1.0 minus the estimated frequency of the "2" allele.
Under the assumption of random mating, this procedure produces the "best" estimate
of allele frequencies, but the variance of this estimate is much higher than the
variance for a locus where all genotypes can be identified. In particular, if the "22"
genotypes are rare, estimated allele frequencies are very sensitive to small changes in
the number of "22" genotypes observed (see Waples et al. 1991b for discussion). In this
study, as in Winans et al. (1996), we recorded observed frequencies of the two
phenotypes at these loci and used those observed frequencies in temporal and
geographic comparisons among populations.
RESULTS
Preliminary Analyses
A total of 76 presumptive gene loci were scored in at least 75% (i.e., 40 or more)
of the 53 samples analyzed. Of these, 41 loci were polymorphic (two or more alleles
segregating in at least one sample) and 35 were monomorphic (fixed for the same allele
in all samples). Allele frequencies for the polymorphic loci appear in Appendix
Table 2.
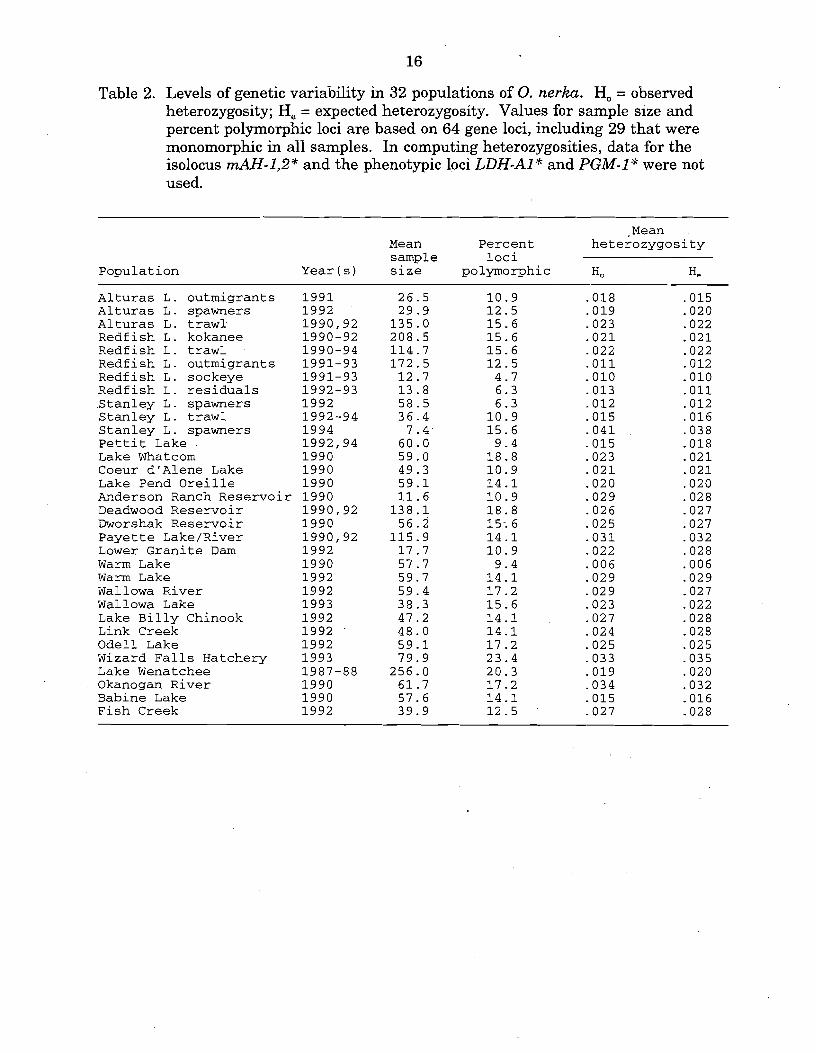
Table 2. Levels of genetic variability in 32 populations of 0. nerka. H, = observed heterozygosity; He = expected heterozygosity. Values for sample size and percent polymorphic loci are based on 64 gene loci, including 29 that were monomorphic in all samples. In computing heterozygosities, data for the isolocus mAH-1,2* and the phenotypic loci LDH-Al* and PGM-I* were not used.
Population
Mean .
Mean Percent heterozygosity sample loci
Year ( s ) size polymorphic H0 He - -
Alturas L. outmigrants Alturas L. spawners Alturas L. trawL Redfish L. kokanee Redfish L. trawl Redfish L. outmigrants Redfish L. sockeye Redfish L. residuals Stanley L. spawners Stanley L. trawl Stanley L. spawners Pettit Lake Lake Whatcom Coeur drAlene Lake Lake Pend Oreille Azderson Ranch Reservoir Deadwood Reservoir Dworshak Reservoir Payette Lake/River Lower Granite Dam Warm Lake Warm Lake Wallowa River Wallowa Lake Lake Billy Chinook Link Creek Odell Lake Wizard Falls Hatchery Lake Wenatchee Okanogan River Babine Lake Fish Creek
17
Five of the polymorphic loci (mAH-1,2> G3PDH-1,2*; GPI-B1,2*; sMDH-A1,2*;
and SMDH-B1,2*) are generally considered to be isoloci in sockeye salmon. However,
only mAH-1,2* was strongly variable in this study, and this was the only isolocus for
which any individuals had three or more doses of variant alleles (indicating that both
loci must be variable in that population). Because variation at the remaining four
isoloci was consistent with patterns expected from variation at a single locus (see also
Hardy-Weinberg results, below), we treated each of these pairs of loci as one variable
locus and one monomorphic locus.
Four of the collections shown in Table 1 included more than one sample in the
same year (August and September trawl samples from Alturas Lake and Redfish Lake
in 1992; and early and late kokanee samples from Redfish Lake in 1991 and 1992). In
each case, contingency chi-square tests indicated that overall allele frequencies did not
differ between pairs of samples; therefore, these samples were combined in future
analyses. Because of the small number of individuals involved, we also combined
3 years of samples of adult sockeye salmon from Redfish Lake (total N = 13) and 2
years of samples of "residual" sockeye salmon from Redfish Lake (total N = 14). These
combinations resulted in 46 samples that were considered in the following two types of
analyses.
Tests of Genotypic and Phenotypic Proportions
The number of polymorphic gene loci in the 46 samples ranged from 3 (Redfish
Lake sockeye and 1993 Redfish lake outmigrants) to 16 (Wizard Falls Hatchery
kokanee). A total of 272 exact probability tests were performed to compare expected
and observed genotypic frequencies at the polymorphic gene loci in these 46 samples; of
these, 11 (4.0%) had probabilities less than 0.05, and 2 of these (0.74%) had
18
probabilities less than 0.01. The I1 significant tests occurred at 7 different gene loci,
and no population had more than a single locus that failed to conform to expected
Hardy-Weinberg genotypic frequencies. We concluded that the genotypic data were
consistent with expectations from simple Mendelian inheritance of genetic traits.
These results are also consistent with the hypotheses that the gene loci considered
here are not strongly affected by selection, and that the samples analyzed represented
approximately random samples from single populations. It should be noted, however,
that the power to detect selection, population admixture, andlor non-random mating
using this test often will not be very high.
Non-significant results were found for all but one of the 29 tests involving
isoloci that were treated here as individual gene loci. The exception was for a test at
sMDH-B2" in the 1990 sample of Redfish Lake kokanee, which showed a significant
deficiency of heterozygotes (exact probability = 0.034) We concluded that the decision
to treat this and the other four isoloci as individual gene loci was reasonable and was
not likely to lead to any serious bias in the results.
Of the 46 samples examined, 43 were polymorphic at the isolocus
mAH-1,2". In each of the 43 polymorphic samples, observed phenotypic distributions
agreed with two-locus Hardy Weinberg expectations, based on the test developed by
Waples (1988). This result supports the hypothesis that allelic dosages can reliably be
scored at this locus in sockeye salmon.
Temporal Comparisons
At nine different locations (Alturas Lake, Reash Lake, Pettit Lake, Stanley
Lake, Warm Lake, Wallowa Lake, Deadwood Reservoir, Payette Lake, and Lake
Wenatchee), samples from multiple years were available for comparison. For the
19
following groups of collections, allele frequency differences between years were .not
statistically significant (P > 0.05, combined test): 1990 and 1992 trawl samples from
Alturas Lake; 1990, 1991, and 1992 samples of kokanee from Redfish Lake; 1992 and
1994 trawl samples from Pettit Lake; 1992, 1993, and 1994 trawl samples from
Stanley Lake; 1990 and 1992 spawner samples from Deadwood Reservoir; and a 1990
sample from Payette Lake and a 1992 sample from the North Fork Payette River.
Although none of the overall tests comparing different years of Redfish Lake
kokanee were significant, the 1990 sample was distinctive in having a much higher
frequency (0.103) of the "-49" allele at ADH* than was found in any other sample in
this study. The differences in allele frequency at this locus between the 1990 kokanee
sample and the 1991 and 1992 samples was highly significant (P c 0.01). Because
ADH is not expressed in adult salmon, data for this locus are missing from many
populations, and this locus was not used in most of the subsequent analyses.
In two locations, allele frequency differences between some temporal samples
were statistically significant but can probably be explained by normal interannual
variability. In Lake Wenatchee, allele frequencies at one locus (ALAT*) out of 15
differed significantly (P c 0.01) between the 1987 and 1988 brood-year samples, and
the overall test for all loci was also significant at the 0.05 level (see Winans et al. 1996
for discussion). In Redfish Lake, no significant differences were observed between
trawl samples from 1990, 1992, and 1993, but the 1994 trawl sample differed
significantly (P < 0.05, combined test) from the 1990 and 1992 samples. Also in
Redfish Lake, the 1991 and 1992 samples of outmigrants were statistically
homogeneous, but the 1993 sample differed significantly from each of the earlier
collections (P c 0.01 and P c 0.05, respectively, for the overall chi-square test).
20
Significant differences in the overall tests involving outmigrants can be attributed to
the unusually high frequency of the "75" allele a t the isolocus mAH-1,2* in the 1993
sample.
At the remaining two localities, differences between samples were large enough
to suggest the existence of multiple populations. The 1990 and 1992 Warm Lake
samples were so dramatically different (combined chi square over 9 loci = 285, 14 df)
that it is not plausible they were drawn from the same gene pool. Highly significant
(P < 0.01, combined test over 11 loci) differences were also found between a 1992
sample from the Wallowa River and a 1993 sample from Wallowa Lake.
Guided by results of these temporal comparisons, in some of the subsequent
analyses we combined samples from different years as follows: trawl samples in
Alturas, Redfish, Stanley, and Pettit Lakes; collections of kokanee and outmigrants in
Redfish Lake; collections of sockeye salmon from Lake Wenatchee; and collections of
spawners from Deadwood Reservoir and Payette Lake/River. Temporal samples from
Warm and Wallowa Lakes were not pooled in any analyses.
Levels of Genetic Variability
Pooling temporal samples as described above yielded a dataset with 32 different
localities andlor types of collections (see Table 1). A total of 64 gene loci were scored in
all 32 collections (these loci can be identified in Appendix Table 1). Of these 64 loci, 35
(55%) were polymorphic in a t least one collection, and the remaining 29 (44%) were
monomorphic in all collections.
Table 2 summarizes information on patterns of genetic variability found in this
analysis. Average observed heterozygosities were low, as is typical for sockeye salmon,
ranging from 0.006 in the 1990 Warm Lake sample to 0.041 in the 1994 Stanley Lake
2 1
spawners. This latter value should be interpreted with caution, since the 1994 sample
of Stanley Lake spawners included only 8 individuals. In general, low values were
found for collections of Redfish Lake sockeye salmon/outmigrants/residuals, and
relatively high values were found in many of the kokanee collections as well as in
sockeye salmon from the Okanogan River. As also has been previously reported for
sockeye salmon, the polymorphic gene loci differed considerably in the overall level of
variability. A few loci (for example, mAH-1,2*, mAAT-1 *, ALATY;, MPI*, PGM-1 Y;, and
PGM-2*) were polymorphic in most or all samples and often had high frequencies of
variant alleles. Many other loci were variable in only one or a few populations, with
variant alleles being rare even in populations in which they did occur.
The heterozygosity values reported in Table 2 are biased downward somewhat
because they do not include data for three polymorphic loci (the isolocus mAH-1,2* and
the phenotypic loci LDH-AI* and PGM-I*). Genotypes cannot be unambiguously
assigned to individual loci at isolocus pairs, and heterozygotes cannot be distinguished
from alternate homozygotes at the other two loci. Both mAH-1,2* and PGM-I* are
highly variable, being polymorphic in most or all of the collections. Although we
cannot provide a quantitative estimate of heterozygosity that would include these three
loci, there is no doubt that the overall values would be higher for most populations if
the actual heterozygosities could be measured at these loci.
The percentage of loci that were polymorphic within each collection was also
relatively low, ranging from 4-6% in some Redfish and Stanley Lake collections to over
23% at Wizard Falls Hatchery. This result contrasts with the relatively high
percentage (over 50%) of loci that were polymorphic over the entire dataset. As
2 2
discussed below, this indicates that in many cases, different popula1;ions were
polymorphic for different gene loci
Variation Between Life-history Forms and Collection Types
Multiple types of collections from Redfish, Alturas, and Stanley Lakes provided
the opportunity to compare data for what represent (or may represent) different life
history forms within a geographic location. In Alturas Lake, no significant differences
were found between samples of outmigrants, spawners, and trawled fish.
In Redfish Lake, pooled kokanee samples did not differ significantly from pooled
trawl samples (chi square = 24.86, 17 df, P > 0.05). The pooled sockeye salmon, pooled
outmigrant, and pooled residual samples were also statistically homogenous. However,
the latter three forms had highly significant (P < 0.01) differences compared to the
kokanee and trawled samples. Samples of sockeyeloutmigrantslresiduals were
characterized by a higher mean frequency (over both loci) of the "75" allele at
mAH-1,2* (about 0.28 for the sockeyeloutmigran~residual vs. about 0.08 for the
kokaneeltrawl), a lower frequency of the "-100" allele at mAAT-I* (about 0.1 vs. about
0.5), a lower frequency of the "91" allele at ALAT* (rare or missing vs. about 0.15), the
presence of the "88" allele a t PEPLT*, and absence of (or very low levels of) variation
at ADH*> ADA-1 *> sMDH-B2*> MPI*, and PGM-Z*.
In Stanley Lake, no individual loci showed significant frequency differences in
the comparison of 1992 spawners with the combined 1992-94 trawl samples, but the
overall test was marginally significant (chi square 18.57, 9 df, P < 0.05). The 1994
sample (N = 8) of spawners was very divergent from the other two collections (chi-
square values 145 with 12 df and 76 with 11 df for comparisons with 1992 spawners
and combined trawl samples, respectively). The 1994 spawner sample was
23
distinguished by unusually high frequencies of variant alleles at mIDHP-2*, LDH-Al*,
PGM-1*, and PGM-2*.
Geographic Variation
We also used the 32-population dataset to examine patterns of differentiation
among populations. Genetic distances, F-statistics, PCA, and heterogeneity chi-square
tests were used in these analyses. A n average (over both loci) allele frequency was
used for the isolocus mAH-1,2*, and phenotypic frequencies were used for the loci
LDH-AI* and PGM-I*.
Considerable genetic diversity among populations was found, as evident from an
examination of Table 3. FsT values at nine loci O A - 1 q mAAT-15 ALAT-Y: G3PDH-2*,
mIDHP-I*, mIDHP-2*, PEPLTT MPIT and PGM-2*) were greater than 0.1, and the
overall value (0.244) is larger than has been reported in any study of anadromous
Pacific salmonids. At three loci (mAAT-I*, ALAT*, and PGM-I*), alleles that were
rare or absent in some populations were common or fixed in other populations.
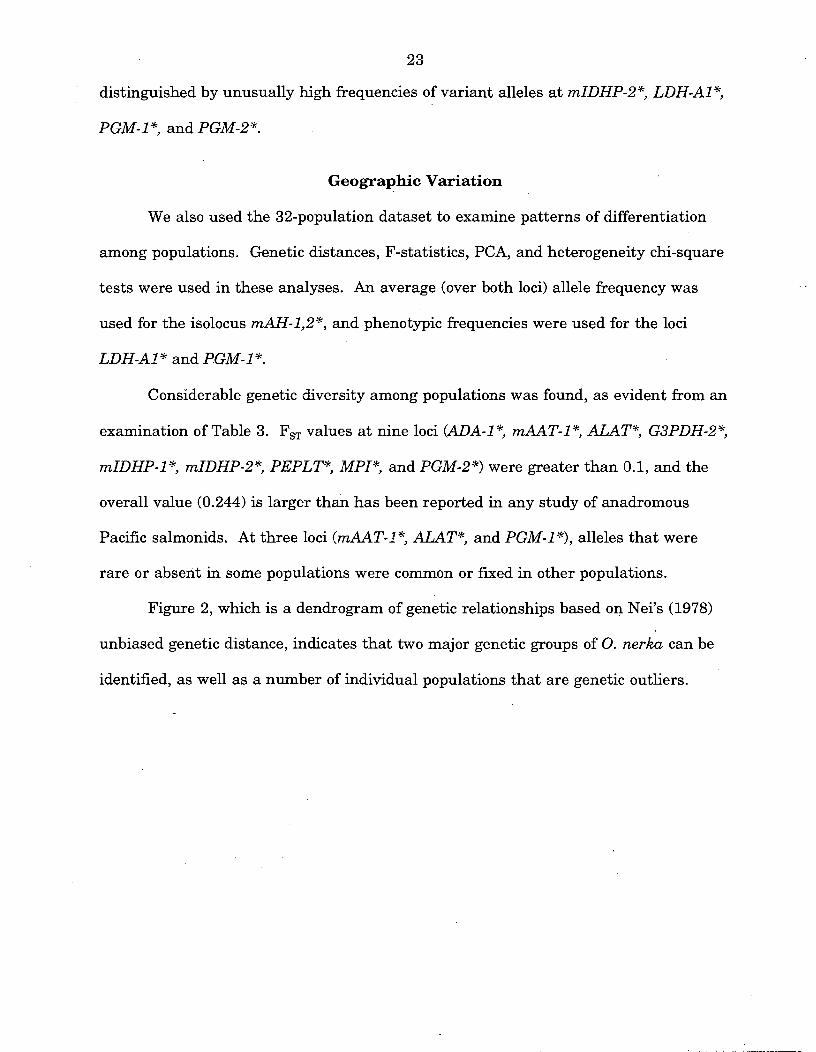
Figure 2, which is a dendrogram of genetic relationships based on Nei's (1978)
unbiased genetic distance, indicates that two major genetic groups of 0. nerka can be
identified, as well as a number of individual populations that are genetic outliers.
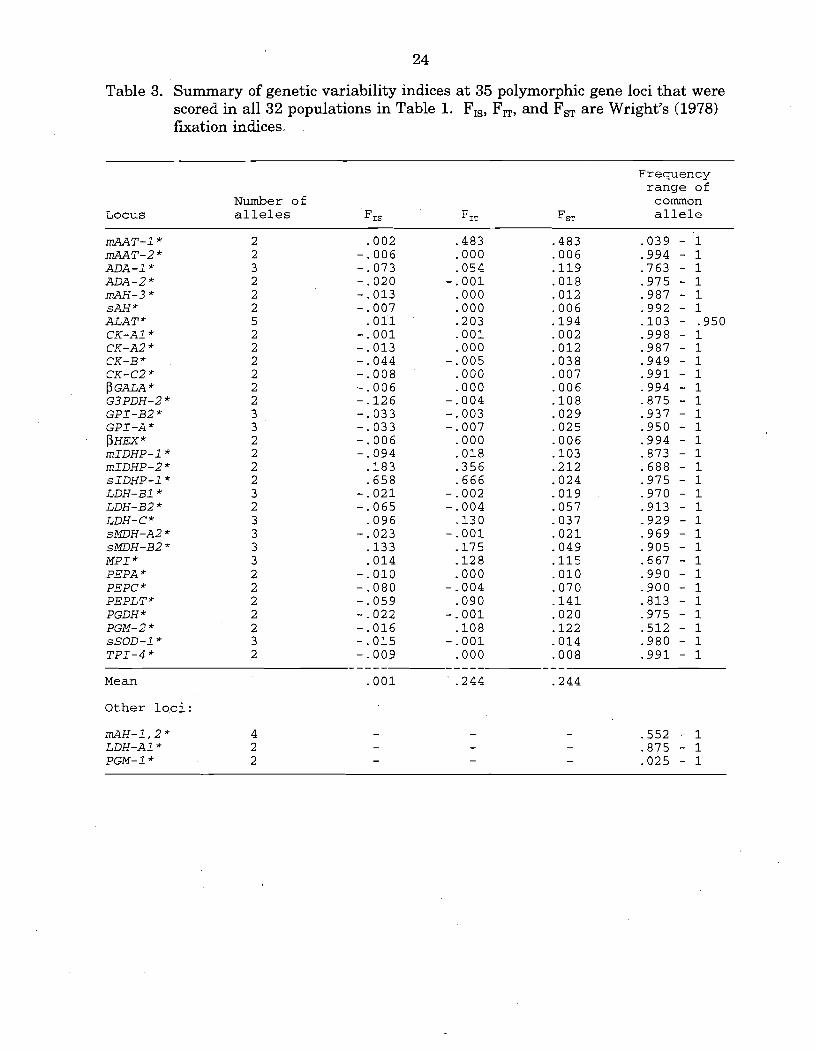
Table 3. Summary of genetic variability indices at 35 polymorphic gene loci that were scored in all 32 populations in Table 1. FIs, FIT, and FsT are Wright's (1978) furation indices.
Locus
Frequency range of
Number of common a l l e l e s FIS FIT FST a l l e l e
M T - I * 2 .002 M T - 2 * 2 -. 006 A D A - I * 3 -. 073 A D A - 2 * 2 - . 020 mAH-3 * 2 - . 013 sAH * 2 - .007 A L A T * 5 .011 CK-A1 * 2 - . 001 CK-A2 * 2 - . 013 CK-B * 2 - . 044 CK-C2 * 2 - . 008 p GALA * 2 - . 006 G 3 PDH-2 * 2 -. 126 G P I - B 2 * 3 -. 033 G P I - A * 3 -. 033 p HEX * 2 -. 006 m I D H P - I * 2 - .094 m I D H P - 2 * 2 .I83 s I D H P - I * 2 -658 LDH-BI * 3 -. 021 LDH-B2 * 2 -. 065 LDH-C* 3 -096 sMDH-A2 * 3 - -023 sMDH-B2 * 3 .I33 M P I * 3 .014 P E P A * 2 - .010 PEPC * 2 - .080 P E P L T * 2 - .059 PGDH * 2 - . 022 PGM-2 * 2 - . 016 sSOD-1 * 3 - .015 T P I - 4 * 2 -. 009
Mean -001
Other l o c i :
m A H - I , 2 * 4 LDH-A1 * 2 PGM- I * 2
r Alturas L. outmigrant
I I I I , Alaska I I I I
.018 .015 .012 .009 .006 .003 0
Alturas L. spawners
Alturas L. trawl
Redfish L. kokanee Redfish L. trawl
Redfish L. outmigrant
Redfish L. sockeye
Redfish L. residual Stanley L. spawners '92 Stanley L. trawl
C Stanley L. spawners '94
Wizard Falls
L. Billy Chinook
1: Link Creek
Okanogan Lake
Warm Lake '90
Lake Wenatchee
- Pettit Lake 7 Lake Whatcorn
Wallowa Lake
Coeur D'Alene Pend Oreille
Anderson Ranch Dworshak
Payette
Genetic distance
-
Figure 2. Dendrogram of genetic relationships among 32 populations of 0. nerka from the Pacific Northwest, based on variation at 64 gene loci. Clustering used the UPGMA method based on a matrix of Nei's (1978) unbiased estimates of genetic distance between each pair of samples. Numbers correspond to population ID numbers in Table 1. See text for discussion of major genetic groups I and 11.
Lower Granite
Wallowa River
Deadwood
Warm Lake '92
- Ode11 Lake
I Babine Lake
26
Group I includes all of the 0. nerka samples from Redfish, Alturas, and Stanley Lakes,
wlth the exception of the 1994 sample of spawners from Stanley Lake. Three
subgroups can be identified within this area: Redfish and Alturas Lakes kokanee and
trawl samples and Alturas Lake outmigrants (IA); Redfish Lake sockeye salmon,
outmigrants, and residuals (IB); and Stanley Lake trawl samples and 1992 spawners
(IC).
Group I1 includes all the samples of Idaho kokanee from outside the Sawtooth
Valley area. Two subgroups can be identified: a northern-Idaho (Columbia River
drainage) kokanee group (IIA); and a Deadwood Reservoir (Snake River drainage)
kokanee group (IIB). In addition to the Lake Pend Oreille and Coeur d'Alene Lake
populations, group IIA also includes samples from Lake Whatcom and Pettit Lake and
the 1993 sample from Wallowa Lake. Group IIB includes samples from the Deadwood,
Dworshak, Anderson Ranch, and Lower Granite Dam Reservoirs, Payette Lakemiver,
the 1992 samples from Warm Lake and the Wallowa River, and the sample from Ode11
Lake.
Also apparent in Figure 2 is a third, loosely affiliated group that includes Lake
Wenatchee and Okanogan River sockeye salmon, the 1994 Stanley Lake spawners, the
1990 Warm Lake sample, and three samples of kokanee from the Deschutes River
drainage in Oregon. The samples from the British Columbia coast (Babine Lake) and
Alaska (Fish Creek) were genetic outliers in this analysis. A cluster analysis of
Cavalli-Sforza and Edwards' (1967) chord genetic distance (not shown) revealed most of
the same major features, including 2 major genetic groups and 2-3 subgroups each
within each of the major groups.
27
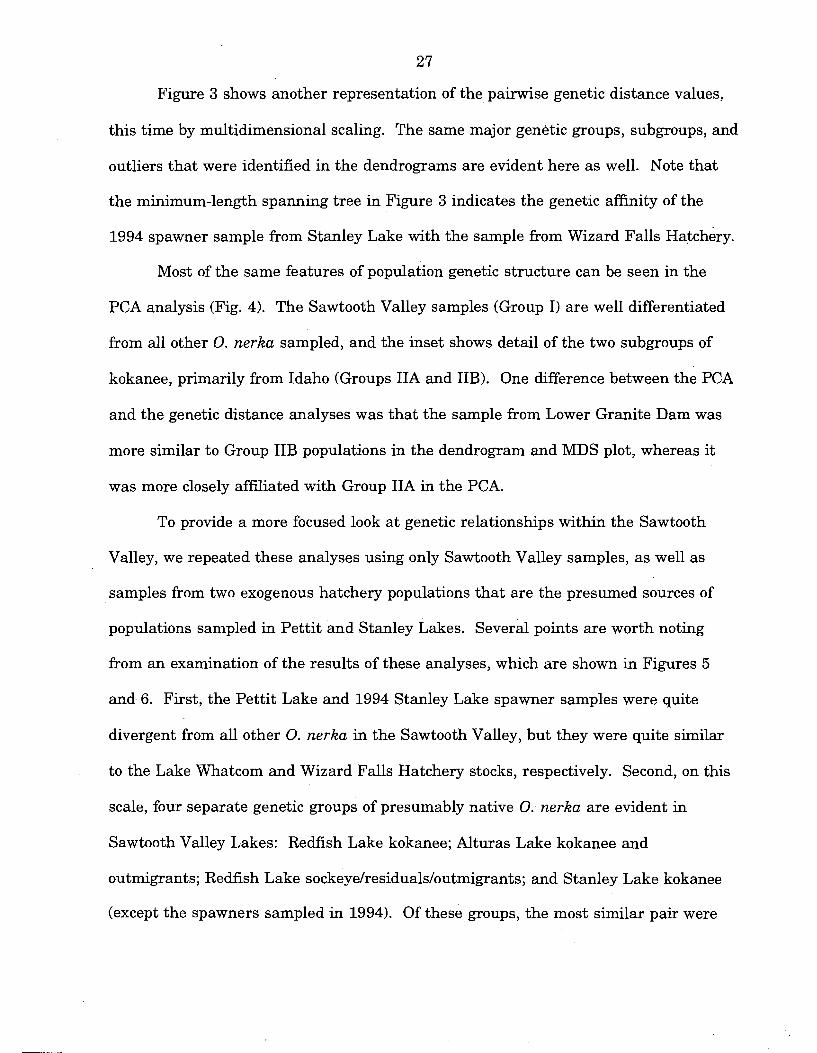
Figure 3 shows another representation of the pairwise genetic distance values,
this time by multidimensional scaling. The same major genetic groups, subgroups, and
outliers that were identified in the dendrograms are evident here as well. Note that
the minimum-length spanning tree in Figure 3 indicates the genetic affinity of the
1994 spawner sample from Stanley Lake with the sample from Wizard Falls ~ a t c h e r ~ .
Most of the same features of population genetic structure can be seen in the
PCA analysis (Fig. 4). The Sawtooth Valley samples (Group I) are well differentiated
from all other 0. nerka sampled, and the inset shows detail of the two subgroups of
kokanee, primarily from Idaho (Groups IIA and IIB). One difference between the PCA
and the genetic distance analyses was that the sample from Lower Granite Dam was
more similar to Group IIB populations in the dendrogram and MDS plot, whereas it
was more closely affiliated with Group IIA in the PCA.
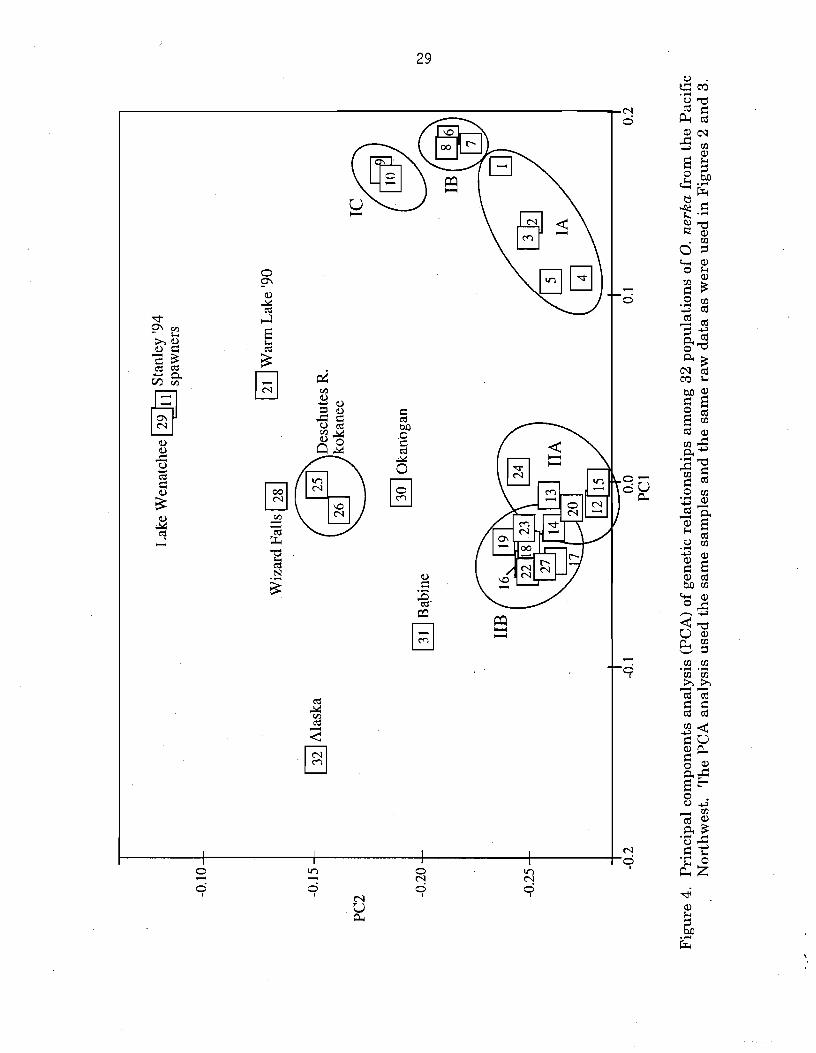
To provide a more focused look a t genetic relationships within the Sawtooth
Valley, we repeated these analyses using only Sawtooth Valley samples, as well as
samples from two exogenous hatchery populations that are the presumed sources of
populations sampled in Pettit and Stanley Lakes. Several points are worth noting
from an examination of the results of these analyses, which are shown in Figures 5
and 6. First, the Pettit Lake and 1994 Stanley Lake spawner samples were quite
divergent from all other 0. nerka in the Sawtooth Valley, but they were quite similar
to the Lake Whatcom and Wizard Falls Hatchery stocks, respectively. Second, on this
scale, four separate genetic groups of presumably native 0. nerka are evident in
Sawtooth Valley Lakes: Redfish Lake kokanee; Alturas Lake kokanee and
outmigrants; Redfish Lake sockeye/residuals/outmigrants; and Stanley Lake kokanee
(except the spawners sampled in 1994). Of these groups, the most similar pair were
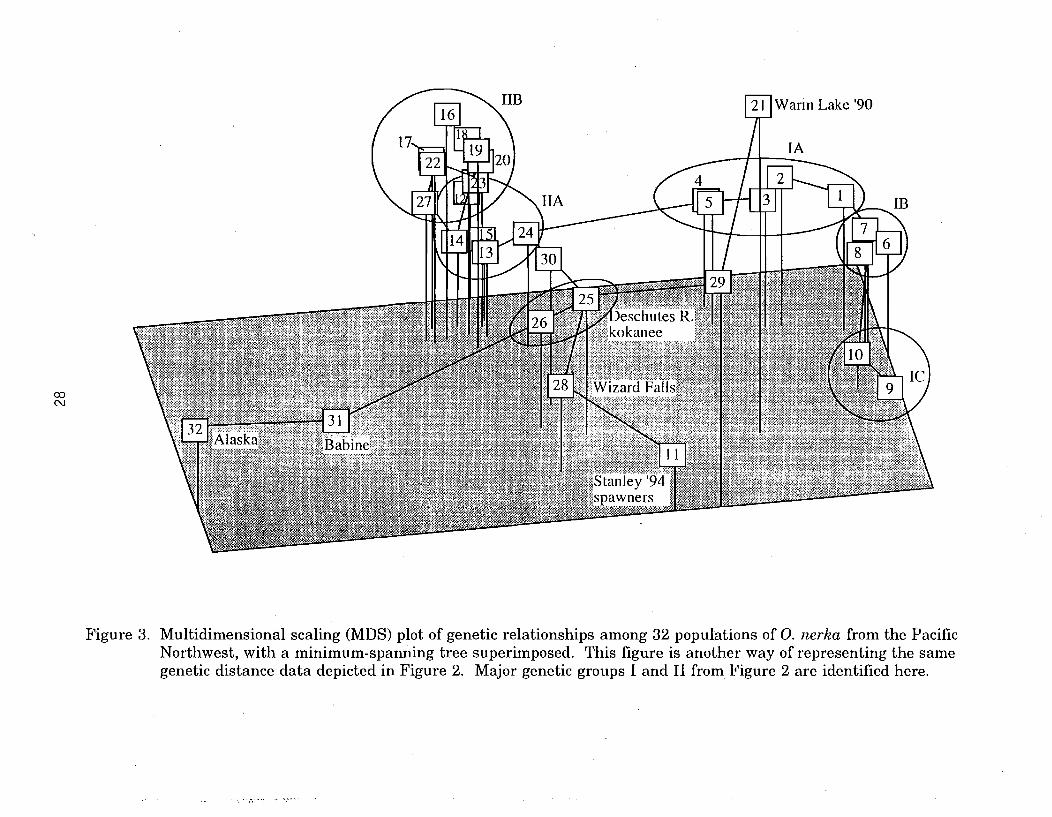
Figure 3. Multidimensional scaling (MDS) plot of genetic relationships among 32 populations of 0. nerka from the Pacific Northwest, with a minimum-spanning tree superimposed. This figure is another way of representing the same genetic distance data depicted in Figure 2. Major genetic groups I and I1 from Figure 2 are identified here.
A- Alturas L. outmigrant ll
1 4 Redfish L. kokanee Redfish L. trawl 5
Alturas L. spawners 2
Alturas L. trawl 3
4 Redfish L. outmigrant
Redfish L. sockeye 7
I A
I Redfish L. residual 8 1
Stanley L. spawners '92 9
Stanley L. trawl 10 I IC
Pettit Lake 12
Lake Whatcom 13
I Stanley L. spawners '94 11
1 Wizard Falls 28
Genetic dis tame
Figure 5. As in Figure 2, but using only 12 populations from the Sawtooth Valley in Idaho and two exogenous populations.
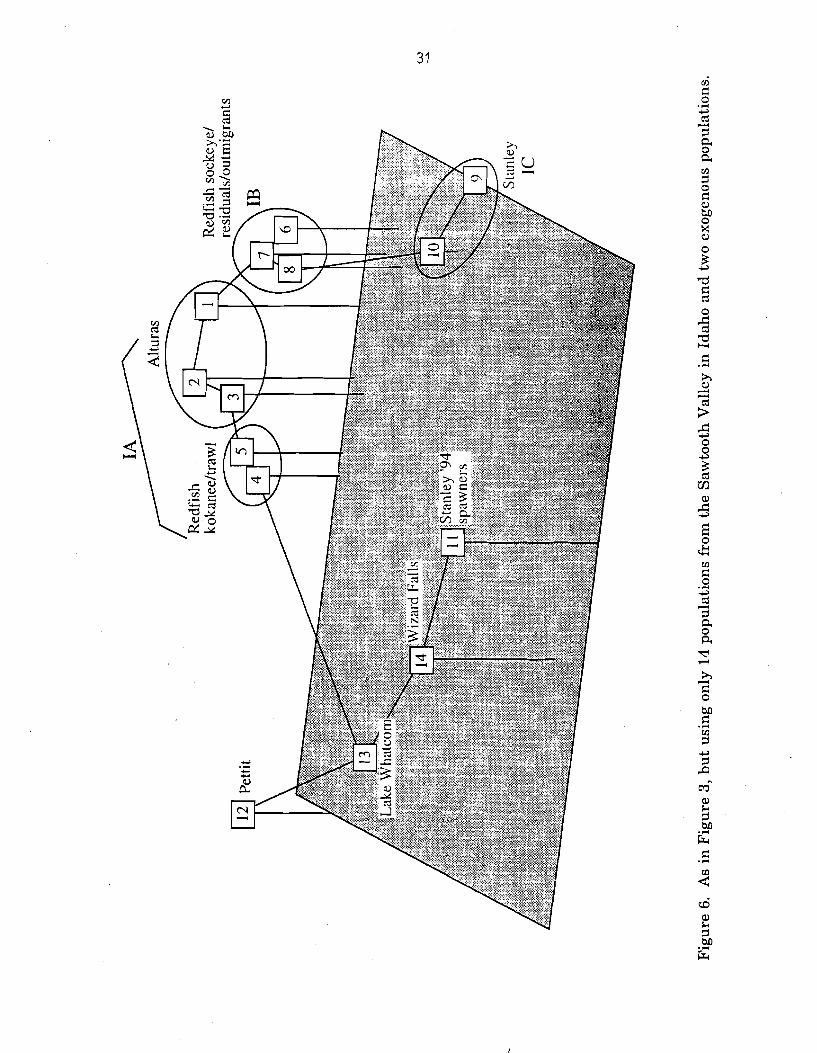
3 2
Redfish Lake kokanee and Alturas Lake 0. nerka, and the most divergent are Stanley
Lake kokanee. This figure also shows the intermediate position of the 1991
outmigrant sample from Alturas Lake, which exhibited some genetic affinity to the
Redfish Lake sockeye salmon group as well as to the other samples of 0. nerka from
Alturas Lake.
The heterogeneity chi-square tests provided an opportunity to evaluate more
fine scale patterns of genetic differentiation within several geographic regions and
genetic clusters.
Sawtooth Valley
As described above, we have seen evidence for one genetic group of 0. nerka in
Alturas Lake, two groups (kokaneeltrawl and sockeyeloutmigrant/residual) in Redfish
Lake, and two groups in Stanley Lake. We also found evidence for a significant degree
of differentiation among the lakes. All of the Alturas Lake samples considered
together differed significantly from all other samples in the Sawtooth Valley lakes.
Uncommon alleles at GPI-A* and LDH-C* that occurred in multiple samples from
Alturas Lake were not found in other Sawtooth Valley collections. Although
statistically significant, the allele frequency differences between Redfish Lake kokanee
and Alturas Lake 0. nerka were not large. Relatively modest allele frequency
differences between the groups at ADH*? mAAT-1 *, ALATY;, GPI-A*? and LDH-C*
resulted in a highly significant (P c 0.001) overall test because of the large combined
sample sizes involved. All of the Redfish Lake 0. nerka samples also differed
significantly from the Stanley Lake samples.
Because the genetic distance analyses suggested that the 1991 outmigrant
sample from Alturas Lake was genetically intermediate between the Alturas
3 3
Lakemedfish Lake kokanee and the Redfish Lake sockeye/outmigrants/residuals, we
examined these samples in more detail. Based on the overall chi-square test, the
Alturas Lake outmigrants had statistically significant allele frequency differences
compared to combined Redfish Lake kokanee (chi-square = 30.5, 14 df, P < 0.01; 1 of
11 loci significant), combined Redfish Lake trawl samples (chi-square = 24.0, 14 df,
P < 0.05; 1 of 12 loci significant), and combined Redfish Lake outmigrants (chi-square
= 56.6, 14 df, P < 0.001; 2 of 10 loci with significant differences). The Alturas Lake
outmigrants also differed statistically from the combined Redfish Lake residuals (chi-
square = 15.7, 7 df, P < 0.05; 1 of 6 loci with significant differences) but not from the
combined Redfish Lake sockeye salmon (chi-square = 13.74, 8 df, P > 0.05). However,
these latter two comparisons had limited power because of the small sample sizes of
the Redfish Lake sockeye salmon and residuals.
Because allele frequencies in the Redfish Lake sockeye salmon and residual
samples were similar to those in the Redfish Lake outmigrants, we believe that very
different sample sizes were responsible for the different results in the heterogeneity
chi-square tests comparing these samples with the Alturas Lake outmigrants. For
example, the Redfish Lake outmigrants, sockeye salmon, and residual samples were
similar in having a very low frequency (0-0.008) of the "94" allele at ADA-I ", whereas
the Alturas Lake outmigrant sample had a relatively high frequency (0.107).
Nevertheless, because of the large size of the combined Redfish Lake outmigrant
sample (N = 181) compared to the other two samples (N = 13 for sockeye salmon and
N = 14 for residuals), the ADA-I" comparison with Alturas Lake outmigrants was
significant for the Redfish Lake outmigrants but not for the sockeye salmon or
residuals.
34
Examination of the allele frequencies shown in Appendix Table 2 suggests that
the intermehate genetic affinities of the Alturas Lake outmigrant sample were due
primarily to frequencies a t mAAT-I*. At this locus, the Redfish Lake kokanee and
trawl samples (frequency for the "-82" allele about 0.4-0.5) were well differentiated
from the Redfish Lake outmigrant, sockeye salmon, and residual samples (allele
frequency about 0.8-0.9). Frequencies in the Alturas Lake spawner and trawl samples
(about 0.6) were similar to those in Redfish Lake kokanee. The Alturas Lake
outmigrant sample, however, had a frequency (0.8) that was closer to the Redfish Lake
sockeye/outmigrant/residual profile. At the other key loci (ADA-1 * and mAH-1,2*),
frequencies in the Alturas Lake outmigrants were closer to those in the other Alturas
Lake samples.
Idaho kokanee
Waples (1995) and Winans e t al. (1996) previously noted a close genetic affinity
between samples from the Lake Whatcom stock and from late-spawning kokanee
populations in the Columbia River basin in northern Idaho (Lake Pend Oreille and
Coeur d'Alene Lake). None of the pairwise comparisons of these three samples were
statistically significant in the overall test. At the CK-B* locus, these three samples
had an allele ("102") a t a frequency of about 0.05 that was missing in all other samples
of 0. nerka except Lake Wenatchee and Wizard Falls Hatchery, where it was rare
(frequency less than 0.01). I t is possible that the presence of this allele in Lake
Wenatchee sockeye salmon is due to the release of over 20 million kokanee from Lake
Whatcom into Lake Wenatchee over a 30-year period (Mullan 1986). It is also possible
3 5
that its presence in the Wizard Falls Hatchery population is due to incorporation of
Lake Wenatchee 0. nerka into Wizard Falls broodstock several decades ago (Kostow2).
The combined Pettit Lake samples differed significantly from the Lake
Whatcom, Coeur d'Alene, and Pend Oreille samples (P < 0.01 for overall test; 3
individual loci with significant differences in each comparison). However, the allele
frequency differences at these loci were not large, and the Pettit Lake samples shared
some of the genetic traits that characterize the late-spawning kokanee populations
from Lake Whatcom and northern Idaho: low frequency of the "-100" allele at
mAAT-I*, absence of va~iation a t MPI*; relatively high frequencies of the "136" allele
at PGM-2*, and approximately equal frequencies of three different alleles ("100," "91,"
and "95") a t ALAT*. The 1993 Wallowa Lake sample also shared this genetic profile,
except that it had slightly higher frequencies of the "-100" allele at mAAT-I*. This
was the only locus at which the Wallowa Lake sample differed significantly from the
Lake Whatcom, Coeur d'Alene, and Pend Oreille samples.
The second genetic group of Idaho kokanee also showed a high degree of
homogeneity among populations. Of all the pairwise comparisons among samples from
Anderson Ranch, Deadwood, and Dworshak Reservoirs and Payette Riverbake, only
that for DeadwoodRayette was statistically significant. Three other samples (Lower
Granite Dam, Warm Lake 1992, and Wallowa River 1992) also showed a close genetic
affinity to this group. Of the pairwise comparisons involving those samples, only those
for Wallowa/Payette, Wallowa/Deadwood, and WarmlPayette were statistically
significant. The sample from Ode11 Lake was more loosely affiliated with this group; it
'K. Kostow, Oregon Department of Fish and Wildlife, 2501 SW First Ave., Portland, OR 97207. Pers. commun., March 1997.
3 6
had allele frequencies characteristic of the group at several loci (e.g., ALAT*, ADA-I Y;,
GPI-AY;, MPIY;, and PGM-I *) but differed somewhat at several other loci.
Two other pairs of samples showed a relatively high genetic affinity. The
samples of kokanee from Link Creek and Lake Billy Chinook, both from the Deschutes
River in Oregon, did not differ significantly. The Wizard Falls Hatchery population
shared with the 1994 sample of Stanley Lake spawners unusual allele frequencies at a
number of loci, including ALATY', mIDHP-2: LDH-AI*, LDH-CY;, PGM-I Y;, and
PGM-2 *.
The remaining samples considered in this study were all genetically distinct
from one another. Even the closest populations geographically had highly significant
allele frequency differences at some loci. For example, the two closest sockeye salmon
populations in the Columbia River basin, in Lake Wenatchee and the Okanogan River,
differed substantially in frequencies of the "-100" allele at rnAAT-I* (near zero to
0.583, respectively). Lake Wenatchee sockeye salmon were further distinguished by
the presence of an allele ("77" at mIDHP-I*) at a frequency of about 0.13 that is rare
or absent in all other populations. The 1990 Warm Lake sample was a genetic outlier,
and the samples from the Babine River and Alaska were quite distinct from each other
as well as from all other U.S. populations.
DISCUSSION
Redfish Lake 0. nerka
At the time a listing determination had to be made for Redfish Lake sockeye
salmon (April 1991), there remained substantial uncertainty about the relationship
between anadromous and resident forms in the lake (Waples et al. 1991). An
important historical factor complicating the situation was Sunbeam Dam, which was
37
built on the Salmon River downstream from Redfish Lake in 1910 and remained in
place until at least 1934 (Jones 1991). By all accounts Sunbeam Dam was a major
impediment to upstream migration of anadromous fish, and it may have been a
complete block, at least in some years.
According to one hypothesis (Chapman et al. 1990), the original sockeye salmon
population was extirpated by Sunbeam Dam, and anadromous fish returning in recent
years were simply the progeny of seaward-drift of kokanee from the relatively
abundant Fishhook Creek population. An alternative hypothesis is that the original
sockeye salmon population survived Sunbeam Dam, elther by achieving limited
passage, by spawning in downstream areas and recolonizing Redfish Lake after the
dam was partially breached in 1934, or by residualizing in the lake and later restoring
anadromy. Information available at the time of the 1991 status review was not
sufficient to determine with any certainty which of these hypotheses was correct
(Waples et al. 1991). In spite of this uncertainty, NMFS proposed that Snake River
sockeye salmon be listed as endangered in April 1991, and the listing was finalized
later that year.
Information reported here strongly supports the second hypothesis (as well as
the decision to list the species under the ESA)--that the original sockeye salmon gene
pool persisted in spite of the effects of Sunbeam Dam. There are clearly two distinct
gene pools of 0. nerka in Redfish Lake: one consisting of Redfish Lake kokanee, the
other of anadromous and "residual" fish from the lake. Outmigrants collected in
1991-93 appear to be mostly (if not entirely) from the anadromous/residual gene pool,
while the 1992-94 trawls appear to have taken almost entirely fish from the kokanee
gene pool. The genetic similarity of the trawl and kokanee spawner samples is
38
reasonable, given that no anadromous fish have spawned in the lake since 1989, and
that the Fishhook Creek kokanee population is believed to be many times larger than
any other resident population in the lake.
As a result, in part, of information provided by this study, NMFS has refined
the definition of the Evolutionarily Significant Unit (ESU) for Snake River sockeye
salmon. The Fishhook Creek kokanee population, which appears to have been strongly
isolated from the anadromous population for a substantial period of time, is not
included in the ESU and not protected under the ESA. The residual population, on the
other hand, appears to be closely linked genetically to the anadromous population and
is considered part of the listed ESU. With the small samples of anadromous and
residual fish available (N = 13 and 12, respectively), it is not possible to draw
definitive conclusions about their relationship, except to say that no significant genetic
differences were observed between the two forms. One possible scenario is that there
is some regular or intermittent exchange between the life history forms, with
anadromous fish occasionally producing offspring that remain in the lake until
maturity, andlor resident fish occasionally producing offspring that migrate to sea and
back. This hypothesis is consistent with preliminary microchemistry analysis of
otoliths from residuals and returning adults (mine3).
We have used the term "residual" to describe resident 0. nerka in Redfish Lake
that are genetically similar to the sockeye salmon. These resident fish have many of
the features typically associated with "residual" sockeye salmon: they spawn at the
same place and approximately the same time (October-November) as all recent
3P. Kline, Idaho Department of Fish and Game, Eagle Fish Health Laboratory, 1800 Trout Road, Eagle, ID 83616. Pers. commun., May 1997.
3 9
observations of anadromous 0. nerka spawning in Redfish Lake, and they are similar
in size to kokanee but have a much more drab (greenish) spawning coloration than the
Fishhook Creek kokanee. However, the Redfish Lake "residuals" differ in one
important respect from the profile of "residual" sockeye salmon as originally defined by
Ricker (1940): whereas residual sockeye salmon are almost exclusively male, the
limited information available for the Redfish Lake population indicates that females
are present (for example, some were included among the fish we analyzed), and the sex
ratio may be approximately equal. It is not clear, therefore, what is the best term to
use in referring to these fish. It is possible that they represent another kokanee
population, albeit one that is much more closely linked to the anadromous population
than are the Fishhook Creek kokanee. In this report, we prefer not to use the term
kokanee for these resident fish to avoid confusion with the Fishhook Creek kokanee.
We have used instead the term "residuals," recognizing that it may not be literally
correct, at least as the term is usually understood.
In any case, it appears that the situation involving life history forms of 0. nerka
in Redfish Lake is unusually complex for the species. Although a number of lakelriver
systems support both sockeye salmon and kokanee, and others have both sockeye
salmon and residuals, there has apparently never been a report of a system that
supports all three forms (Foote4).
4C. Foote, School of Fisheries, WH-10, University of Washington, Seattle, WA 98195. Pers. commun., May 1997.
40
Effects of Stock Transfers
Because the ESA focusses on conserving native populations in their natural
ecosystems, it is important to consider the effects on population genetic structure of
the numerous stock transfers recorded into or between key populations in the Snake
River basin (summarized in Table 4). Although efforts have been made to include all
known stock transfers into historic sockeye-bearing lakes in the Snake River basin, the
list in Table 4 is not necessarily comprehensive. Some stock transfers are poorly
documented or never recorded at all, and when records were kept they may now be
missing or incomplete. For example, according to Bowler (1990), Idaho stocking
records for 1946-50 have been lost. In other cases, the hatchery that reared the
transplanted fish is known but the original source of the stock is difficult to determine.
Of particular interest is evidence regarding the effects of recent (1980-83)
releases of sockeye salmon fry from Babine Lake into Alturas and Stanley Lakes.
Although a rigorous evaluation of this stocking program was never conducted, no adult
returns were observed, and it is generally believed to have been a failure (Hall-
Griswold 1990). Genetic data collected in this study support that conclusion. For
example, the "-100" allele at mAAT-I* was nearly fuzed (frequency 0.942) in the Babine
Lake sample but was rare or uncommon in all the samples from Stanley Lake (range
0.05-0.192). Similarly, at ALAT*, the "91" allele occurred at high frequency (0.650) in
Babine Lake but was rare in each of the samples from Alturas Lake (range
0.033-0.069). In fact, excluding the sample from Alaska, the genetic distances between
the samples from Alturas and Stanley Lakes and the sample from Rabine Lake were
larger than those found between the Sawtooth Valley populations and any other
4 1
populations we examined in this study. (This was not true for the 1994 sample of
spawners from Stanley Lake, which is discussed below.)
We also found no evidence that stock transfers of kokanee into Redfish and
Alturas Lakes have had a substantial genetic impact on extant populations. However,
the strength of this conclusion is limited somewhat by two factors. First, power to
detect genetic effects of stock transfers is greatest if the donor population is known and
has been characterized. Unfortunately, some of the introductions were from unknown
sources, and others were from stocks that may have changed in composition over time.
For example, although our recent sample from Anderson Ranch Reservoir was
genetically similar to samples from Deadwood Reservoir, Payette Lakemiver, and
Dworshak Reservoir, there are indications that at one time Anderson Ranch was
stocked with late-spawning kokanee from northern Idaho (Hall-Griswold 1990).
Second, we lack historical data on the genetic composition of 0. nerka in Alturas or
Redfish Lake, so we do not know whether or how much those characteristics have
changed over time. Although relatively large and highly significant allele frequency
differences were found between the Redfish and Alturas Lake samples and both the
early-spawning Anderson Ranch/Payette/Deadwood/Dworshak kokanee complex and
the late-spawning northern Idaho kokanee complex, it is possible that 0. nerka in
Redfish and Alturas Lakes were even more distinctive prior to those introductions.
In contrast, data for the Pettit Lake trawl samples from 1992 and 1994 showed
a strong genetic affinity with the late-spawning kokanee populations from northern
Idaho. Presumably, the current population in Pettit Lake is derived from northern
Idaho kokanee obtained from Anderson Ranch Reservoir that were planted in the lake
in 1968 (Table 4). If any 0. nerka native to Pettit Lake survived overharvests, the
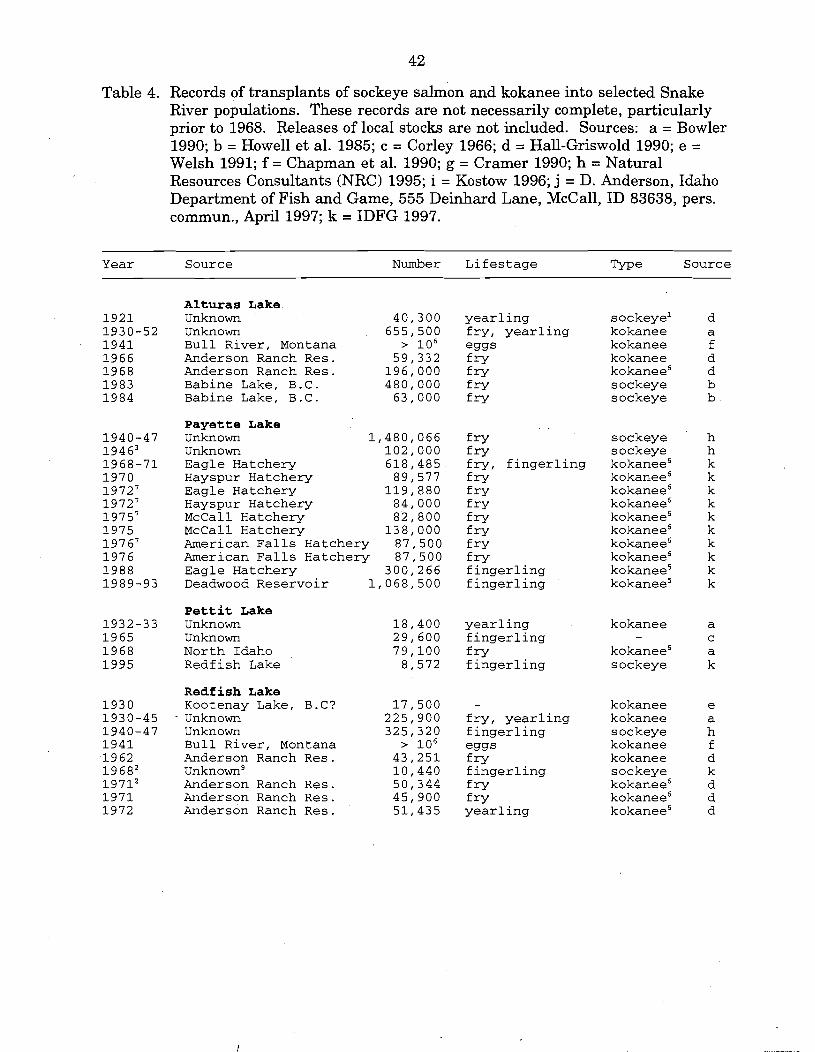
Table 4. Records of transplants of sockeye salmon and kokanee into selected Snake River populations. These records are not necessarily complete, particularly prior to 1968. Releases of local stocks are not included. Sources: a = Bowler 1990; b = Howell et al. 1985; c = Corley 1966; d = Hall-Griswold 1990; e = Welsh 1991; f = Chapman et al. 1990; g = Cramer 1990; h = Natural Resources Consultants (NRC) 1995; i = Kostow 1996; j = D. Anderson, Idaho Department of Fish and Game, 555 Deinhard Lane, McCall, ID 83638, pers. commun., April 1997; k = IDFG 1997.
Year Source Number Lifestage Type Source
Alturas Lake Unknown 40,300 Unknown 655,500 Bull River, Montana > lo6 Anderson Ranch Res. 59,332 Anderson Ranch Res. 196,000 Babine Lake, B.C. 480,000 Babine Lake, B. C. 63,000
Payette Lake Unknown 1,480,066 Unknown 102,000 Eagle Hatchery 618,485 Hayspur Hatchery 89,577 Eagle Hatchery 119,880 Hayspur Hatchery 84,000 McCall Hatchery 82,800 McCall Hatchery 138,000 American Falls Hatchery 87,500 American Falls Hatchery 87,500 Eagle Hatchery 300,266 Deadwood Reservoir 1,068,500
Pettit Lake Unknown Unknown North Idaho Redfish Lake
Redfish Lake Kootenay Lake, B.C? Unknown Unknown Bull River, Montana Anderson Ranch Res. unknowng Anderson Ranch Res. Anderson Ranch Res. Anderson Ranch Res.
yearling fry, yearling eggs fry fry fry fry
fry fry fry, fingerling f r~ fry fry fry fry fry fry fingerling fingerling
yearling fingerling fry fingerling
-
fry, yearling fingerling eggs fry fingerling fry fry year1 ing
sockeye1 ko kanee kokanee kokanee kokanee6 sockeye sockeye
sockeye sockeye kokanee6 kokanee6 kokanee6 kokanee6 kokanee6 kokanee6 kokanee6 kokanee6 kokanee5 kokanee5
kokanee -
kokanee6 sockeye
kokanee kokanee sockeye kokanee kokanee sockeye kokanee6 kokanee6 kokanee6
43
Table 4, continued
Year Source Number Lifestage Type Source
Stanley Lake Unknown 1,000 Unknown numerous Unknown 379,000 Babine Lake, B.C. 173,880 Babine Lake, B.C. 260,393 Babine Lake, B.C. 150,015 Babine Lake, B.C. 147,000 Deadwood Reservoir 49,926 Deadwood Reservoir 60,000 Deadwood Reservoir 52,800 Roaring Judy H., CO 56,250 Deadwood Reservoir 34,500
Streams of Sawtooth Mountains Hayspur Hatchery 15,000
Wallowa Lake Alaska, 380,500 Unknown 5,144,300 Unknown 21,784,521 Unknown 2,443,600 Unknown 1,041,200 Unknown 147,910 Montana 2,588,513 Washington 304,269 British Columbia 615,550 Wizard Falls Hatchery 136,000
Warm Lake Evergreen Hatchery 25,000 McCall Hatchery 248,490 McCall Hatchery 118,000 North Idaho 20,000 McCall Hatchery 831,000 Deadwood Reservoir 49,980
fry fry fry fry yearling1' yearling1' fingerling fingerling fingerling
yearling
-
fry, fingerling fry, fingerling -
fry, fingerling fry, fingerling fry, fingerling fry, fingerling
fry fry, fingerling fry fry fingerling
Recorded as kokanee by Bowler 1990 Released into Fishhook Creek, a tributary of Redfish Lake Released into Payette River Released into the Wallowa River Recorded as "early spawner" by IDFG (1997) Recorded as "October spawner" by IDFG (1997) Released into Little Payette Lake Recorded as "blueback salmon" Source may have been Redfish Lake stock Recorded as fingerling by IDFG (1997)
kokanee? kokanee sockeye sockeye sockeye sockeye sockeye kokanee5 kokanee5 kokanee5 kokanee6 kokanee5
kokanee d
sockeye sockeye sockeye kokanee kokanee kokanee kokanee kokanee kokanee kokanee
sockeye d k~kanee?~ k sockeye k k~kanee?~ k kokanee j kokanee5 j
44
effects of Sunbeam Dam and other barriers to migration, and poisoiling of the lake in
1960 (Hall-Griswold 1990), they have yet to be found.
The situation regarding stock transfers and extant populations of 0. nerka in
Stanley Lake is more complex, as this lake apparently supports both indigenous and
introduced populations. Four of the five samples from Stanley Lake (1992 spawners
and 1992, 1993, and 1994 trawled fish) appear to be from a common gene pool that is
more similar to 0. nerka from Redfish and Alturas Lakes than it is to any other
populations we examined. We believe that the most likely explanation is that this
gene pool is native to Stanley Lake. Again, we cannot rule out some effects on this
gene pool from stock transfers, but it appears that at least substantial native
components remain. In contrast, the gene pool represented by the eight spawners
collected in 1994 is radically different from other Stanley Basin 0. nerka. These fish
spawn somewhat later than the spawners sampled in 1992, and the most plausible
explanation is that they are the result of an introduction, either directly or indirectly,
from the Wizard Falls Hatchery stock. The close similarities in allele frequencies to
the Wizard Falls population at several key gene loci are too striking to be explained by
chance. Table 4 shows a release into Stanley Lake of 56,250 October-spawning
kokanee fingerlings from Roaring Judy Hatchery in Colorado, and it is possible that
this was the source of the spawners sampled in 1994. However, the Roaring Judy
Hatchery stock was initiated with an egg take in 1950 from Flathead Lake in
Montana, and there is no record of use of Wizard Falls stock at the hatchery (Weiler5).
5B. Weiler, Colorado Division of Wildlife, 6060 Broadway, Denver, CO 80216. Pers. commun., May 1997.
45
Historically, Payette Lake may have supported the largest run of sockeye
salmon in the Snake River basin, but access for anadromous fish was blocked by
impassable dams early in this century (Chapman et al. 1990). The recent samples
from Payette Lake and River were genetically similar to samples of introduced
kokanee from reservoirs throughout Idaho. This close genetic similarity suggests that
all these populations share a common heritage, but it is not clear whether this has
resulted from 1) planting of Payette Lake with the same stock used in the reservoirs,
or 2) use of native Payette Lake stock in forming the early-spawning kokanee stock
that has been widely spread throughout Idaho. A late December, beach-spawning
population of kokanee has recently been observed in Payette Lake (Anderson6). This
may be a remnant, native population of 0. nerka, but it has not been sampled or
genetically characterized.
The genetic data also provided considerable insight into the effects of stock
transfers into two other Snake River lakes that historically supported populations of
sockeye salmon: Warm Lake and Wallowa Lake. The 1990 sample from Warm Lake
was quite distinctive, bearing little genetic similarity to any of the stocks known or
likely to have been planted there. The distinctiveness and the low level of genetic
variability found in this sample are consistent with the hypothesis that it represents a
native gene pool that has been isolated and has experienced severe andlor prolonged
bottlenecks in the past. In contrast, the spawners sampled in Warm Lake in 1992
appear to be derived from the stocking in 1990 of fingerlings from Deadwood Reservoir
(Table 4). Survivors from that release would have been 3 years old in 1992, a typical
6D. Anderson, Idaho Department of Fish and Game, 555 Deinhard Lane, McCall, ID 83638. Pers. commun., May 1997.
46
age for maturity in kokanee. It is not clear, however, whether these spawners will
have a permanent genetic impact on the population. The presumably native fish
sampled in 1990 are part of a beach spawning population, whereas the Deadwood
Reservoir stock spawns in tributaries. There is little suitable habitat in Warm Lake
tributaries for stream spawning kokanee (Anderson7), which may help explain why we
found no genetic evidence for transfers into the lake that occurred prior to 1990.
The situation is also complex in Wallowa Lake, where we found evidence for two
separate gene pools--one spawning in the river and one in the lake. The stream
spawners were genetically similar to the Deadwood/Dworshak/Anderson RanchPayette
group of stream-spawning kokanee, and the lake spawners were genetically similar to
late-spawning kokanee from northern Idaho. These genetic affinities suggest that
neither of these populations is native to Wallowa Lake. However, these results do not
prove that a native gene pool does not persist in the lake; results for Stanley Lake
indicate that native and introduced gene pools of 0. nerka can coexist in Snake River
lakes, at least in the short term. Furthermore, the failure of either of the samples
from Wallowa Lake to show an affinity to the Wizard Falls stock that has been planted
there in recent years is interesting and suggests that the population genetic structure
in Wallowa Lake may be complex, and additional sampling might yield more
information.
The population in Odell Lake, which is isolated from access by anadromous fish
by a lava dam 5-6 thousand years old (USDA 1994), appears to be the result of an
'D. Anderson, Idaho Department of Fish and Game, 555 Deinhard Lane, McCall, ID 83638. Pers. commun., April 1997.
47
introduction of kokanee from the Deadwood/DworshaWAnderson RanchPayette
complex, perhaps with some influence from other stocks as well.
It is notable that all the genetic evidence for successful stock transfers of
0. nerka found in this study involve kokanee. We found no evidence for genetic effects
of transfers of anadromous fish, including several million sockeye salmon from British
Columbia that were released into Sawtooth Valley lakes in the 1980s. This result is
consistent with Wood's (1995) report of finding many records of successful transplants
of kokanee but very few for sockeye salmon. Presumably this reflects the more
complicated life history of anadromous 0. nerka and much greater opportunity for local
adaptations to develop.
Amount and Patterns of Genetic Variability
We found relatively low levels of heterozygosity within populations of 0. nerka
considered in this study (range 0.006 to 0.041), a result that is consistent with findings
of previous studies (e.g., Utter et al. 1984, Wood 1995). Winans et al. (1996) reviewed
available data and concluded that levels of allozyme variability in 0. nerka are the
lowest among the species of Pacific salmon. Any of a variety of factors might be
responsible for this result, but the latter authors speculated that the strong association
of sockeye-salmon with discrete freshwater habitats may have led to isolation and
repeated bottlenecks of local populations, which in turn could have eroded levels of
genetic variation.
We found no consistent pattern in the levels of genetic variability between
resident and anadromous forms. Both of the extreme heterozygosity values noted
above were for kokanee populations, but the range of values for the five anadromous
populations (Redfish Lake, Lake Wenatchee, Okanogan River, Babine Lake, and Fish
48
Creek, Alaska) was also fairly large (0.011-0.032), and mean values were similar for
the two forms (0.022 for sockeye salmon vs. 0.025 for kokanee).
In Redfish Lake, the samples of kokanee and trawled 0. nerka had higher
heterozygosities (0.021-0.022) than did the samples of sockeye salmon, outmigrants,
and residuals (0.010-0.013). This result could be due to any (or a combination) of
several factors, the most likely of which are 1) one or more bottlenecks in the
anadromous population, which would reduce genetic variability in the
sockeye/outmigrants/residuals, and 2) partially successful stock transfers of kokanee,
which could inflate levels of genetic variability in the Fishhook Creek population. The
effects of a bottleneck(s) can be evaluated quantitatively, based on the relationship
that in a single generation bottleneck, heterozygosity declines by approximately the
fraction 1/(2Ne), where N, is the effective size of the population. For longer time
periods, the following formula is useful (Crow and Kimura 1970):
H, = Ho (1 - 1/(2Ne))t.
Here, H, and H, are heterozygosities a t times 0 and t, respectively, and t is time in
generations. In the present case, we have an observed reduction in heterozygosity of
the sockeye/outmigrant/residual gene pool of almost 50% compared to the Fishhook
Creek kokanee. A bottleneck of N, = 2 for 2 generations could cause a loss almost this
large, as could a longer but less severe bottleneck (e.g., N, = 10 for 13-14 generations)
or any of a number of more complex scenarios. For example, it is possible that the
sockeye salmon gene pool went through a bottleneck during the period that Sunbeam
Dam was in operation, and there is good evidence for a recent bottleneck in the
population.
49
Nevertheless, some caution must be used in invoking the bottleneck hypothesis
for two reasons. First, a generation for Redfish Lake sockeye salmon is 4-5 years
(based on age at maturity data reported by Bjornn et al. 1968), so even with adult
returns in single digits every year since at least 1990, the total number over a whole
generation is larger (e.g., N = 15 for 1991-95). This is not a number that lends great
comfort to conservation biologists, and the effective size is almost certainly somewhat
lower, but it still would require a number of generations at this bottleneck size to
reduce heterozygosity by 50%. Second, the population size of N = 15 applies only to
returning anadromous fish. Although the residual population is poorly understood and
believed to be relatively small, it still may number in the hundreds of spawners per
year. If the anadromous and resident populations are in fact closely linked genetically,
then it is much more difficult to explain the lower heterozygosity levels by severe
bottlenecks in recent times.
In contrast to the low levels of within-population genetic variability, the
0. nerka samples we examined were characterized by unusually large differences
between populations. At several loci (mAAT-14 ALATT and PGM-I*), nearly fixed
allelic differences were found between some populations. These differences were
reflected in Wright's FsT, which is a measure of the proportion of total genetic diversity
that is found between (as opposed to within) populations. The mean value in this
study (0.244) is larger than has been reported for any study of anadromous Pacific
salmonids. This result can be attributed at least in part to the unusually broad
geographic coverage of the samples (inland Snake and Columbia River basins to
Alaska). Nevertheless, it emphasizes the tendency of sockeye salmon to form discrete,
isolated populations that, apparently, only rarely experience gene flow from other
populations.
Captive Broodstock Program
As noted above, a captive broodstock program was initiated in 1991 due to the
high risk of extinction faced by Redfish Lake sockeye salmon (Flagg 1993, Johnson
1993). This program was started with collection of juveniles in spring 1991 as they
outmigrated from Redfish Lake, and later was supplemented by anadromous adults
that returned in fall 1991 and subsequent years. Initially, a major concern regarding
the outmigrants was whether they were progeny of sockeye salmon, kokanee, or a
mixture of the two. The program wanted to avoid artificially mixing these gene pools
in captivity if in fact they were isolated in their natural habitat.
Results from this study have been useful in resolving the origin of 1991 and 1
subsequent outmigrant samples from Redfish Lake. Analysis of early mortalities
associated with 1991 trapping operations showed large frequency differences in
comparison to Fishhook Creek kokanee, and analysis of the four adults that returned
later that year showed a close similarity between outmigrants and anadromous
sockeye. As discussed above, this result (in conjunction with the observation based on
otolith mierochemistry that a large fraction of the outmigrants had a resident female
parent) suggested that a third population of 0. nerka might exist ill the lake--resident
fish that were genetically distinct from Fishhook Creek kokanee. A concerted effort to
search for these fish in 1992 led to the discovery of the "residual" population at the
sockeye salmon spawning grounds in the lake. Subsequent sampling and analyses
supported the conclusion that, at most, a small fraction of the outmigrants could have
come from the Fishhook Creek kokanee population. Based on these results and other
51
lines of information, outmigrants that matured in captivity have been spawned and
their progeny incorporated into the restoration program for Redfish Lake sockeye
salmon.
Comparison with Results of DNA Studies
Results of DNA analyses of Snake River 0. nerka have been reported by
Brannon et al. (1994) and Thorgaard et al. (1995). Thorgaard et al. used five
multilocus nuclear DNA probes to examine population structure in 14 samples of
0. nerka from the Pacific Northwest. All but two of these samples were included in
the present study. They pooled individuals within populations and computed a
distance matrix between populations based on the number of shared bands. On a
regional basis, they found that kokanee and sockeye salmon from the same area
tended to show some genetic affinity--a pattern consistent with that previously
reported for allozyrnes (Foote et al. 1989, Winans et al. 1996). Thorgaard et al. (1995)
also found a relatively close genetic similarity among several Snake River kokanee
samples from the Deadwood Reservoir group.
Brannon et al. (1994) used both nuclear and mitochondria1 (mtDNA) markers to
examine collections from all four Sawtooth Valley lakes discussed in this report. Their
results agree with the allozyme data in showing similarity between Redfish Lake
sockeye salmon, residuals, and outmigrants, but significant differences between these
groups and Fishhook Creek kokanee. Brannon et al. (1994) suggested that the high
mtDNA variability they observed in Fishhook Creek kokanee can be attributed in part
to stock transfers into Redfish Lake. As discussed above, we found substantial allele
frequency differences between Fishhook Creek kokanee and all known sources of stock
transfers, but we cannot rule out some effects of past stocking efforts.
52
ACKNOWLEDGMENTS
This study would not have been possible without the cooperation and assistance
of many people involved in field collections, including Ernie Brannon and Anne Setter
(University of Idaho), Bruce Rieman, Keith Johnson, and Paul mine (Idaho
Department of Fish and Game), Scott Spaulding, Dave Teuscher, and Doug Taki
(Shoshone-Bannock Tribes), Kathryn Kostow and Bill Knox (Oregon Department of
Fish and Wildlife), and Chuck Guthrie (NMFS Auke Bay Laboratory, Alaska). The
discovery of the "residual" sockeye salmon in Redfish Lake was due in no small part to
the efforts of Bruce Rieman (currently with the U.S. Forest Service). Bud Welch,
Cindy Shiflett, Stephanie Woods, Eric Iwamoto, and Delia Patterson assisted with the
electrophoretic analyses. Don Anderson, Sharon Clark, Rick Gustafson, Kathryn
Kostow, and Matt Powell provided information on histories of stock transfers.
REFERENCES
Aebersold, P. B., G. A. Winans, D. J. Teel, G. B. Milner, and F. M. TJtter. 1987. Manual for starch gel electrophoresis: a method for the detection of genetic variation. U.S. Dep. Commer., NOAA Tech. Rep. NMFS 61, 19 p.
Allendorf, F. W., and G. H. Thorgaard. 1984. Tetraploidy and the evolution of salmonid fishes. In: B. Turner (editor). Evolutionary genetics of fishes, p. 1-53. Plenum Press, New York.
Bjornn, T. C., D. R. Craddock, and D. R. Corley. 1,968. Migration and survival of Redfish Lake, Idaho, sockeye salmon, Oncorhynchus nerka. Trans. Am. Fish. SOC. 97:360-373.
Bowler, B. 1990. Additional information on the status of Snake River sockeye salmon. Report submitted to ESA Administrative Record for sockeye salmon, December 1990, 23 p. (Available from Idaho Department of Fish and Game, 600 S. Walnut St., Boise, ID 83707.)
Brannon, E., A. Setter, T. Welsh, R. Danner, K. Collins, and M. Casten. 1994. Genetic analysis of Oncorhynchus nerka: Life history and genetic analysis of Redfish Lake Oncorhynchus nerka. Completion Report of Research, 48 p. (Available from Bonneville Power Administration, P.O. Box 3621, Portland, OR 97208.)
Cavalli-Sforza, L. L., and A. W. F. Edwards. 1967. Phylogenetic analysis: models and estimation procedures. Evolution 21:550-570.
Chapman, D. W., W. S. Platts, D. Park, and M. Hill. 1990. Status of Snake River sockeye salmon. Final report, 90 p. (Available from Pacific Northwest Utilities Conference Committee, 101 SW Main Street, Suite 810, Portland, OR 97204.)
Corley, D. C. 1966. Redfish, Stanley, Yellow Belly, Pettit, Perkins and Little Redfish Lake fisheries investigations, May 15 to September 30, 1966. Idaho Department of Fish and Game report. (Available from Idaho Department of Fish and Game, 600 S. Walnut St., Boise, ID 83707.)
Cramer, S. P. 1990. The feasibility for reintroducing sockeye and coho salmon in the Grand Ronde River and coho and chum salmon in the Walla Walla River. Progress Report under contract to the Nez Perce Tribal Executive Committee and Nez Perce Fisheries Resource Management, 131 p. (Available from S. P. Cramer & Associates, Inc., 300 S.E. Arrow Creek Lane, Gresham, OR 97080.)
Crow, J. F., and M. Kimura. 1970. An introduction to population genetics theory. Harper and Row, New York. 591 p.

Flagg, T. A. 1993. Redfish Lake sockeye salmon captive broodstock rearing and research. Annual report of research, 16 p. (Available from Bonneville Power Administration, P.O. Box 3621, Portland, OR 97208.)
Foote, C. J., C. C. Wood, and R. E. Withler. 1989. Biochemical genetic comparison of sockeye salmon and kokanee, the anadromous and nonanadromous forms of Oncorhynchus nerka. Can. J. Fish. Aquat. Sci. 46:149-158.
Hall-Griswold, J. A. 1990. Sockeye of Stanley Basin--Summary. Report submitted to the ESA Administrative Record for sockeye salmon, July 1990, 29 p. (Available from Idaho Department of Fish and Game, 600 S. Walnut St., Boise, ID 83707.)
Howell, P., K. Jones, D. Scarnecchia, L. Lavoy, W. Kendra, and D. Ortmann. 1985. Stock assessment of Columbia River anadromous salmonids. Vol. I: Chinook, coho, chum, and sockeye salmon stock summaries. Final Report, Project No. 83-335, 558 p. (Available from Bonneville Power Administration, P.O. Box 3621, Portland, OR 97208.)
Idaho Department of Fish and Game (IDFG). 1997. Computer database of historic stocking records, 1968-present. (Available from Idaho Department of Fish and Game, 600 S. Walnut St., Boise, ID 83707.)
Johnson, K. A. 1993. Research and recovery of Snake River sockeye salmon. Annual report of research, 38 p. (Available from Bonneville Power Administration, P.O. Box 3621, Portland, OR 97208.)
Jones, R. 1991. The effect of Sunbeam Dam on sockeye salmon in the Salmon River, Idaho. Memo to ESA Administrative Record for sockeye salmon, March 1991, 6 p. (Available from Environmental and Technical Services Division, NMFS, 525 N.E. Oregon St., Portland, OR 97232.)
Kalish, J. M. 1990. Use of otolith microchemistry to distinguish the progeny of syrnpatric anadromous and non-anadromous salmonids. Fish. Bull., U.S., 88:657-666.
Kline, P. -1994. Research and recovery of Snake River sockeye salmon. Annual report of research, 52 p. (Available from Bonneville Power Administration, P.O. Box 3621, Portland, OR 97208.)
Kostow, K. 1996. ODFW 0. nerka hatchery records in Wallowa and Metolius subbasins. Memorandum to R. Gustafson (NMFS), 19 March 1996, 18p. (Available from Northwest Fisheries Science Center, 2725 Montlake Boulevard E., Seattle, WA 98112.)
Monan, G. 1991. Genetic analysis of 0. nerka. Memo to Merritt Tuttle for inclusion in ESA Administrative Record for sockeye salmon, February 1991, 8 p. (Available from Environmental and Technical Services Division, NMFS, 525 N.E. Oregon St., Portland, OR 97232.)
Mullan, J. W. 1986. Determinants of sockeye salmon abundance in the Columbia River, 1880's-1982: A review and synthesis. U.S. Fish Wildl. Serv. Biol. Rep. 86(12), 135 p.
Natural Resources Consultants, Inc. (NRC). 1995. Artificial propagation of anadromous Pacific salmonids: west coast sockeye salmon. Electronic database submitted to Coastal Zone and Estuarine Studies Division, Northwest Fisheries Science Center, Natl. Mar. Fish. Serv. Contract No. 50ABNF400128. 1.8MB. (Available online through anonymous FTP a t ftp.streamnet.org/pub/streamnet/nmfs_data.)
Nei, M. 1978. Estimation of average heterozygosity and genetic distance from a small number of individuals. Genetics 89:583-590.
Ricker, W. E. 1940. On the origin of kokanee, a fresh-water type of sockeye salmon. Trans. R. Soc. Can. 34:121-135.
Rieman, B. E., D. L. Myers, and R. L. Nielsen. 1994. Use of otolith microchemistry to discriminate Oncorhynchus nerka of resident and anadromous origin. Can. J. Fish. Aquat. Sci. 51:68-77.
Rohlf, F. J. 1993. NTSYS-pc: Numerical Taxonomy and Multivariate Analysis System, version 1.80. Exeter Software, Setauket, New York.
Shaklee, J. B., F. W. Allendorf, D. C. Morizot, and G. S. Whitt. 1990. Gene nomenclature for protein-coding loci in fish. Trans. Am. Fish. Soc. 119:2-15.
Swofford, D. L., and R. B. Selander. 1981. BIOSYS-1: a F O R T W program for the comprehensive analysis of electrophoretic data in population genetics and systematics. J. Hered. 72:281-283.
Thorgaard, G. H., P. Spruell, S. A. Cummings, A. S. Peek, and E. L. Brannon. 1995. Mixed DNA fingerprint analysis differentiates sockeye salmon populations. Am. Fish. Soc. Symp. 17:295-303.
U.S. Army Corps of Engineers (USACE). 1993. 1992 Reservoir drawdown test: Lower Granite and Little Goose Dams. Final Report, 141 p. (Available from U.S. Army Corps of Engineers, Walla Walla District, 201 N. 3rd St., Walla Walla, WA 99362.)
U.S. Department of Agriculture, Forest Service (USDA). 1994. Ode11 Pilot Watershed Analysis, 176 p. (Available from Deschutes National Forest, Crescent Ranger District, 1645 Highway 20, Bend, OR 97701.)
Utter, F. M., P. B. Aebersold, J. Helle, and G. A. Winans. 1984. Genetic characteristics of populations on the southeastern range of sockeye salmon. In J. M. Walton and D. B. Houston (editors). Proceedings of the Olympic Wild Fish Conference, Peninsula College, 23-25 March 1983, Port Angeles, Washington, p 17-32.
Utter, F., P. Aebersold, and G. Winans. 1987. Interpreting genetic variation detected by electrophoresis. In N. Ryman and F. Utter (editors). Poplllation Genetics and Fishery Management, p. 21-45. University of Washington Press, Seattle.
Waples, R. S. 1988. Estimation of allele frequencies at isoloci. Genetics 118:371-384.
Waples, R. S. 1992. Summary of possible ways t o characterize juvenile Oncorhynchus nerka outmigrants from Redfish Lake, Idaho. Unpublished report, April 1992. 11 p. (Available from Northwest Fisheries Science Center, 2:725 Montlake Boulevard E., Seattle, WA 98112.)
Waples, R. S. 1995. Genetic effects of stock transfers of fish. In D. Philipp et al. (editors). Protection of aquatic biodiversity. Proceedings of the World Fisheries Congress, Theme 3, p 51-69. Oxford and IBH Publishing Co. Pvt. Ltd., New Delhi.
Waples, R. S., 0 . W. Johnson, and R. P. Jones, Jr. 1991a. Status review for Snake River sockeye salmon. U.S. Dep. Commer., NOAA Tech. Memo. NMFS F/NWC-195, 23 p.
Waples, R. S., D. J. Teel, and P. B. Aebersold. 1991b. A genetic monitoring and evaluation program for supplemented populations of salmon and steelhead in the Snake River Basin. Annual report of research, 50 p. (Available from Bonneville Power Administration, P.O. Box 3621, Portland, OR 97208.)
Welsh, T. L. 1991. Stanley Bas,in sockeye salmon lakes, upper Salmon River drainage, Idaho: fish stocking history; fish eradication projects; present status of the kokanee salmon stocks. Unpublished report. (Available from Aquaculture Institute, University of Idaho, Moscow, ID. 83843.)
Winans, G. A., P. B. Aebersold, and R. S. Waples. 1996. Allozyme variability of Oncorhynchus nerka in the Pacific Northwest, with special consideration to populations of Redfish Lake, Idaho. Trans. Am. Fish. Soc. 125:645-663.
Wood, C. C. 1995. Life history variation and population structure of sockeye salmon. Am-. Fish. Soc. Symposium 17:195-216.
Wright, S. 1978. Evolution and the Genetics of Populations, vol. 4. Variability Within and Among Natural Populations. Univ. of Chicago Press, Chicago. 580 p.
APPENDIX TABLES

Appendix Table 1. List of enzymes surveyed, enzyme numbers, neur and old abbreviations for each presumptive gene locus, tissues sampled (M = muscle, L = liver, H = heart; E = eye), and buffers used. All loci scored in a t least 40 (75%) of the 53 total samples are included. The numbers of samples shown (with data and polymorphic) are based on the 32 population dataset obtained by pooling of temporal samples (see Table 1). Locus names and abbreviations follow the nomenclature guidelines provided by Shaklee et al. (1990a). Descriptions of the buffer systems are found in Aebersold et al. (1987), with modifications described by Waples et al. (1991).
Number of samples Previous
Enzyme name Number Locus Abbrev. Tissue Buffer With data Polymorphic -
Aspartate aminotransferase - -
sAA T-2' sAAT-3'
sAA T-4' mAAT-1' mAA T-2
ACP-1'
ADA-1' ADA-2"
ADH*
sAH' mAH-1,2' mA H-3' mAH-4'
A K'
ALAT'
CK-A 1 CK-AZ' CK-6' CK-C1 CK-C2'
ESTD*
FBALD-3' FBALD-4*
FDHG*
FH '
PGALA*
GAPDH-1 GAPDH-2' GAPDH-3' GAPDH-4' GA PDH-5'
- - -
GOT-2 MH GOT-3 E AAT-3 AAT-4 L
HME HME
TBCLE TBE
TBE AC E7 ACE7
Acid phosphatase
Adenosine deaminase TBE TEE
Alcohol dehydrogenase
Aconitate hydratase ACON-2,AH L HME HME HME
Adenylate kinase
Alanine aminotransferase
Creatine kinase TBCLE TBCLE TBCLE TBCLE TBCLE
TBCLE
Fructose-bisphosphate aldolase
Formaldehyde dehydrogenase (glutathione)
HAGH L TBE
Fumarate hydratase FUM M
Glyceraldehyde-3-phosphate dehydrogenase
Appendix Table 1, continued
Number of samples Previous
Enzyme name Number Locus Abbrev. Tissue Buffer With data Polymorphic
Glycerol-3-phosphate 1.1.1.8 G3PDH-I* AGP-1 MH ACEN7 32 0 dehydrogenase G3PDH-2' AGP-2 MH ACEN7 32 2
G3PDH-3' AGP9 H ACEN7 30 0 G3PDH-4' AGP-4 H ACEN7 32 0
Glucose-6-phosphate 5.3.1.9 GPI-BI* GPI-1 M TBCLE 32 0 isomerase GPI-B2' GPI-2 M TBCLE 32 7
G PI-A GPI-3 M TBCLE 32 9
Glutathione reductase 1.6.4.2 GR* E TBCLE 32 0
L-lditol 2-dehydrogenase 1.1.1.1 4 IDDH-1 SDH-1 L TBCL 32 0 IDDH-2' SDH-2 L TBCL 32 0
lsocitrate dehydrogenase 1.1.1.42 mlDHP-1 IDH-1 MH ACE7 32 3 (NADP') mlDHP-2' IDH-2 M H ACE7 32 6
sIDHP-I* IDH-3 LE ACE7 32 1 sIDHP-2' IDH-4 LE ACE7 32 0
L-Lactate dehydrogenase
Lactoylglutathione lyase
a-Mannosidase
Malate dehydrogenase
Mannose-6-phosphate isomerase
Nucleoside-triphosphate pyrophosptiatase
Cytosol non-specific dipeptidase
Tripeptide aminopeptidase
X-Pro dipeptidase
1.1.1.27 LDH-A I * LDH-1 M TBCLE 32 2 LDH-A2' LDH-2 M TBCLE 32 0 LDH-BI* LDH-3 MEH TBCLE 32 4 LDH-82' LDH-4 LMEH TBCLE 32 4 LDH-C* LDHd E TC4 32 8
4.4.1.5 LGL* GLO-I M TBCLE 30 0
5.3.1.8 MPI* EHL TB E 32 18
3.6.1.19 NTP* ITP M TBC1.E 32 0
3.4.1 3.18 PEPA* DPEP-1 ME TB E 32 1 GL-1
3.4.1 1.4 PEPB-I* PEP-3 ME TBCLE 32 0 PEP-LGG TAPEP-1 TC4
3.4.-.- PEPC* DPEP-2 E TBE 32 6 GL-2
Leucyl-tyrosine peptidase 3.4.-.- PEPLT* ML TBE 32 5
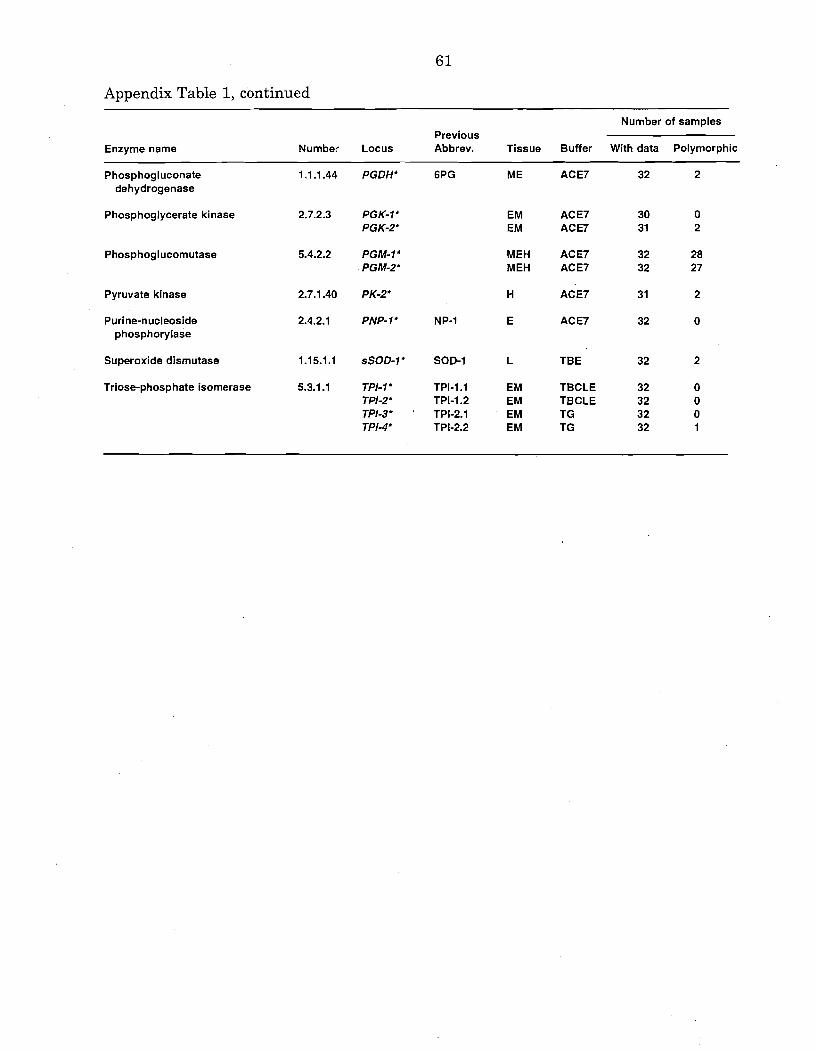
Appendix Table 1, continued
Number of samples Previous
Enzyme name Number Locus Abbrev. Tissue Buffer With data Polymorphic
Phosphogluconate 1.1.1.44 PGDH* 6PG ME ACE7 32 2 dehydrogenase
Phosphoglycerate kinase 2.7.2.3 PGK-1' PGK-2'
Phosphoglucomutase 5.4.2.2 PGM-I* PGM-2'
MEH ACE7 32 28 MEH ACE7 32 27
Pyruvate kinase 2.7.1.40 PK-2* H ACE7 31 2
Purine-nucleoside phosphorylase
Superoxide dismutase 1.15.1.1 sSOD-I* SOD-1 L TBE 32 2
Triose-phosphate isomerase 5.3.1.1 TPI- 1 ' TPI-1.1 EM TBCLE 32 0 TPI-2' TPI-1.2 EM TBCLE 32 0 TPI-3' ' TPI-2.1 ' EM TG 32 0 TPI-4' TPI-2.2 EM TG 32 1

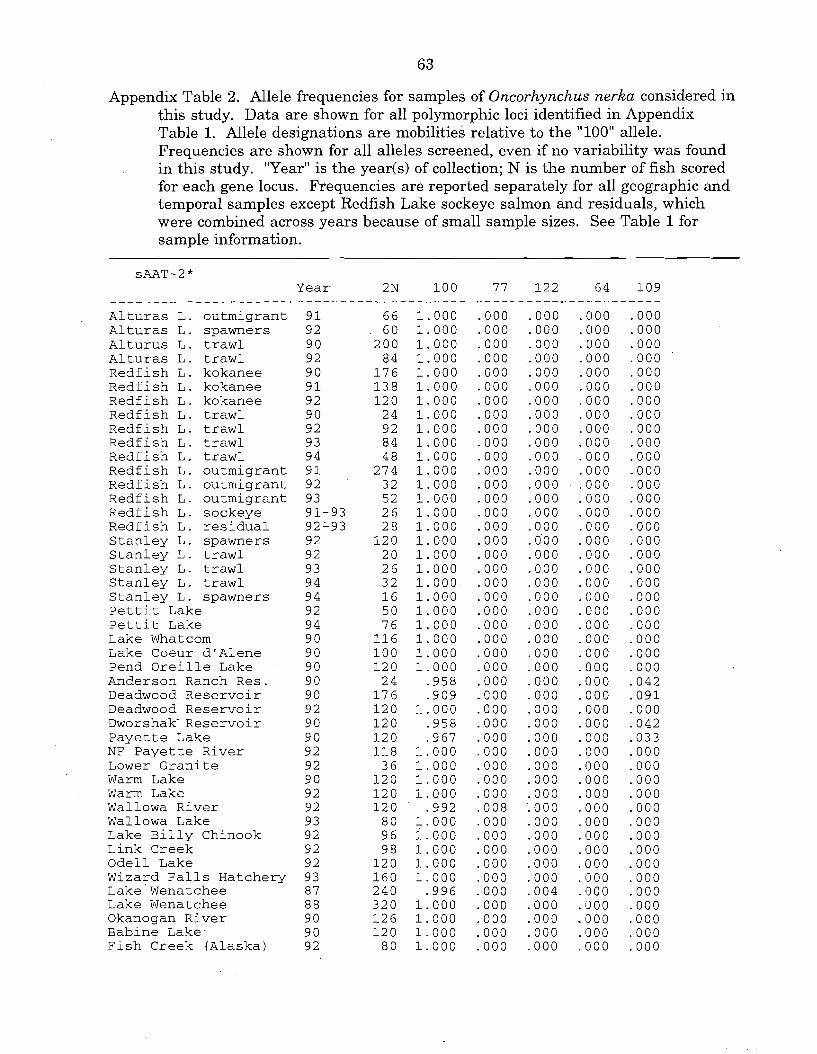
Appendix Table 2. Allele frequencies for samples of Oncorhynchus nerka considered in this study. Data are shown for all polymorphic loci identified in Appendix Table 1. Allele designations are mobilities relative to the "100" allele. Frequencies are shown for all alleles screened, even if no variability was found in this study. "Year" is the yearb) of collection; N is the number of fish scored for each gene locus. Frequencies are reported separately for all geographic and temporal samples except Redfish Lake sockeye salmon and residuals, which were combined across years because of small sample sizes. See Table 1 for sample information..
---------------------- Alturas L. outmigrant Alturas L. spawners Alturus L. trawl Alturas L. trawl Redfish L. kokanee Redfish L. kokanee Redfish L. kokanee Redfish L. trawl Redfish L. trawl Redfish L. trawl Redfish L. trawl Redfish L. outmigrant Redfish L. outmigrant Redfish L. outmigrant Redfish L. sockeye Redfish L. residual Stanley L. spawners Stanley L . trawl Stanley L. trawl Stanley L. trawl Stanley L. spawners Pettit Lake Pettit Lake Lake Whatcom Lake Coeur dlAlene Pend Oreille Lake Anderson Ranch Res. Deadwood Reservoir Deadwood Reservoir Dworshak- Reservoir Payette Lake NF Payette River Lower Granite Warm Lake Warm Lake Wallowa River Wallowa Lake Lake Billy Chinook Link Creek Odell Lake Wizard Falls Hatchery Lake Wenatchee Lake Wenatchee Okanogan River Babine Lake Fish Creek (Alaska)
Year 2N 1 0 0 7 7 1 2 2
9 1 6 6 1 . 0 0 0 . O O O . O O O 9 2 6 0 1 . 0 0 0 . O O O . O O O 9 0 2 0 0 1 . 0 0 0 . o o o . o o o 9 2 8 4 1 . 0 0 0 . O O O . O O O 9 0 1 7 6 1 . 0 0 0 . O O O . O O O 9 1 1 3 8 1 . 0 0 0 . O O O . O O O 9 2 1 2 0 1 . 0 0 0 . o o o - 0 0 0 9 0 2 4 1 . 0 0 0 . O O O - 0 0 0 9 2 9 2 1 . 0 0 0 . O O O . O O O 9 3 8 4 1 . 0 0 0 . O O O . O O O 9 4 4 8 1 . 0 0 0 . O O O - 0 0 0 9 1 2 7 4 1 . 0 0 0 - 0 0 0 . O O O 9 2 3 2 1 . 0 0 0 . O O O . O O O 9 3 5 2 1 . 0 0 0 . O O O . O O O 9 1 - 9 3 2 6 1 . 0 0 0 . O O O . O O O 92'93 2 8 1 . 0 0 0 . O O O . O O O 9 2 1 2 0 1 . 0 0 0 . o o o . o o o 9 2 2 0 1 . 0 0 0 - 0 0 0 . o o o 9 3 2 6 1 . 0 0 0 . O O O . O O O 9 4 3 2 1 . 0 0 0 . O O O . O O O 9 4 1 6 1 . 0 0 0 . O O O . O O O 9 2 5 0 1 . 0 0 0 - 0 0 0 . O O O 9 4 7 6 1 . 0 0 0 . O O O . O O O 9 0 1 1 6 1 . 0 0 0 . O O O . O O O 9 0 1 0 0 1 . 0 0 0 . o o o . o o o 9 0 1 2 0 1 . 0 0 0 - 0 0 0 - 0 0 0 9 0 2 4 - 9 5 8 . O O O - 0 0 0 9 0 1 7 6 . 9 0 9 - 0 0 0 - 0 0 0 9 2 1 2 0 1 . 0 0 0 . o o o . o o o 9 0 1 2 0 . 9 5 8 . O O O . O O O 9 0 1 2 0 . 9 6 7 . O O O . O O O 9 2 1 1 8 1 . 0 0 0 . O O O . O O O 9 2 3 6 1 . 0 0 0 . O O O . O O O 9 0 1 2 0 1 . 0 0 0 . o o o . o o o 9 2 1 2 0 1 . 0 0 0 . o o o . o o o 9 2 1 2 0 . 9 9 2 . 0 0 8 . O O O 9 3 8 0 1 . 0 0 0 . O O O . O O O 9 2 9 6 1 . 0 0 0 . O O O . O O O 9 2 9 8 1 . 0 0 0 . O O O . O O O 9 2 1 2 0 1 . 0 0 0 . o o o . o o o 9 3 1 6 0 1 . 0 0 0 . O O O . O O O 8 7 2 4 0 . 9 9 6 . O O O . 0 0 4 8 8 3 2 0 1 . 0 0 0 . O O O - 0 0 0 9 0 1 2 6 1 . 0 0 0 . O O O . O O O 9 0 1 2 0 1 . 0 0 0 . o o o . o o o 9 2 8 0 1 . 0 0 0 . O O O . O O O
6 4 - - -. - - - . CIOO . CIOO . o o o . o o o . o o o . o o o . o o o - 0 0 0 . C)OO . C)OO . o o o . o o o . o o o . o o o . o o o . o o o . o o o 0 0 0 0 0 0 0 0 0 0 0 0 . o o o . o o o . o o o . o o o . o o o . o o o . o o o . o o o - 0 0 0 . o o o . o o o . o o o . o o o . o o o . o o o . o o o
. o o o . (300 . o o o . o o o 0 0 0 0 0 0 - 1300 0 0 0 .1300
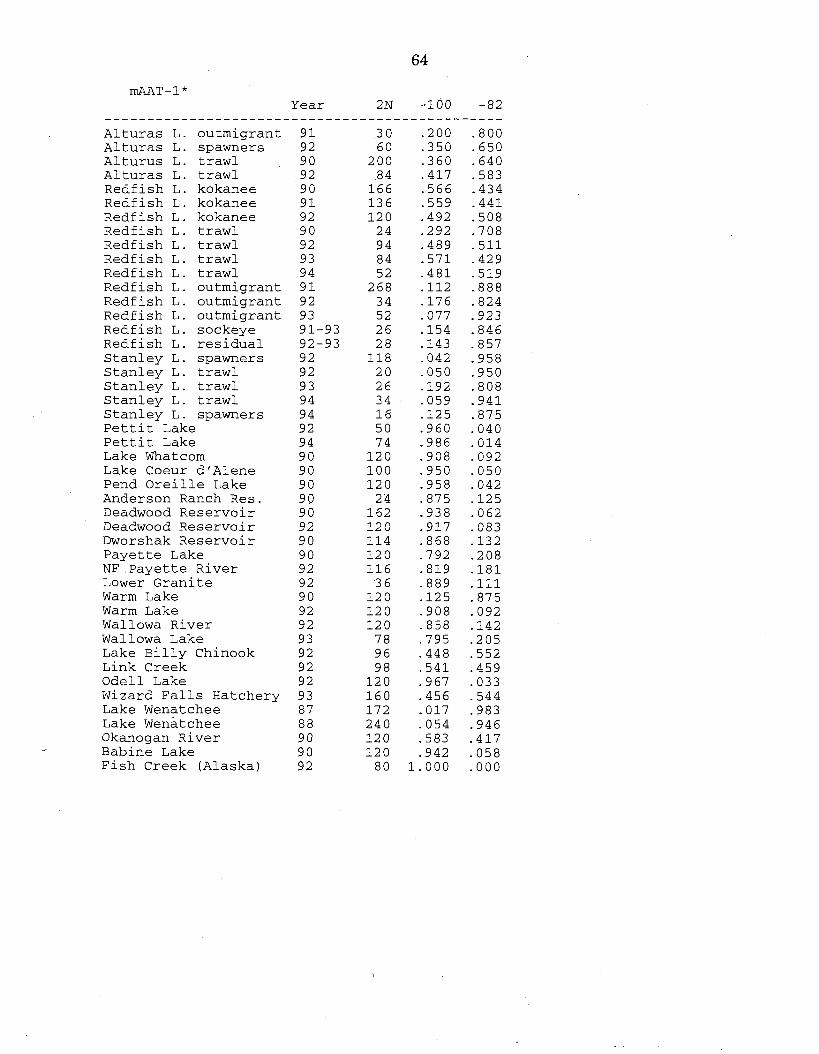
mAAT - 1 * Year 2N
.................................... Alturas L. outmigrant 91 3 0 Alturas L. spawners 9 2 6 0 Alturus L . trawl 9 0 200 Alturas L. trawl 9 2 8 4 Redfish L. kokanee 9 0 166 Redfish L. kokanee 9 1 13 6 Redfish L. kokanee 9 2 12 0 Redf ish L . trawl 90 2 4 Redfish L. trawl 9 2 9 4 Redfish L. trawl 9 3 8 4 Redfish L. trawl 9 4 5 2 Redfish L. outmigrant 91 268 Redfish L. outmigrant 92 3 4 ~edfish L. outmigrant Redfish L. sockeye Redfish L. residual Stanley L. spawners Stanley L. trawl Stanley L. trawl Stanley L. trawl Stanley L. spawners Pettit Lake Pettit Lake Lake Whatcom Lake Coeur dlAlene Pend Oreille Lake Anderson Ranch Res. Deadwood Reservoir Deadwood Reservoir Dworshak Reservoir Payette Lake NF Payette River Lower Granite Warm Lake Warm Lake Wallowa River Wallowa Lake Lake Billy Chinook Link Creek Odell Lake Wizard Falls Hatchery Lake Wenatchee Lake ~enatchee Okanogan River
/ Babine Lake Fish Creek (Alaska)
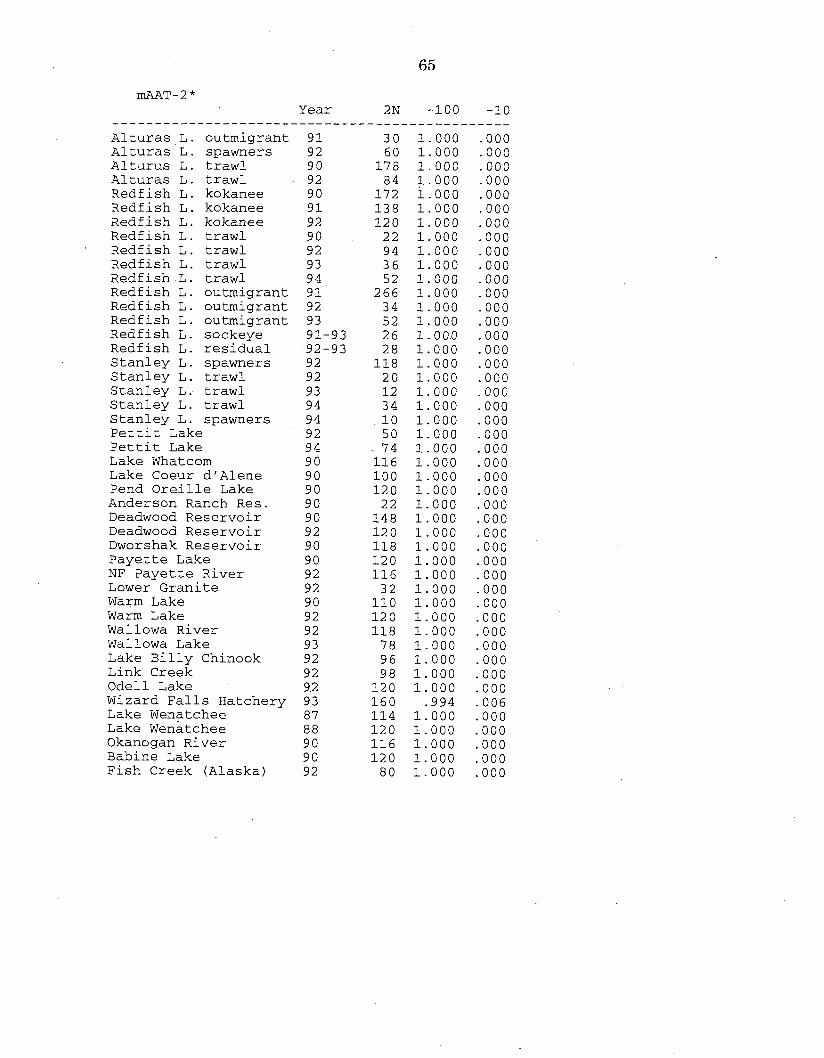
mAAT - 2 * Year 2N -100
.......................................... Alturas L. outmigrant 91 30 1.000 Alturas L. spawners 9 2 60 1.000 Alturus L. trawl 90 178 1.000 Alturas L. trawl 9 2 84 1.000 Redfish L. kokanee 9 0 172 1.000 Redfish L. kokanee 9 1 138 1.000 Redfish L. kokanee 92 120 1.000 Redfish L. trawl 9 0 22 1.000 Redfish L. trawl 9 2 94 1.000 Redfish L. trawl 9 3 36 1.000 Redf ish L. trawl 9 4 52 1.000 Redfish L. outmigrant 91 266 1.000 Redfish L. outmigrant 92 34 1.000 Redfish L. outmigrant 93 52 1.000 Redfish L. sockeye 91-93 26 1.000 Redfish L. residual 92-93 28 1.000 Stanley L. spawners 9 2 118 1.000 Stanley L. trawl 9 2 20 1.000 Stanley L. trawl 9 3 12 1.000 Stanley L. trawl 9 4 34 1.000 Stanley L. spawners 9 4 10 1.000 Pettit Lake 9 2 50 1.000 Pettit Lake 9 4 . 74 1.000 Lake Whatcom 9 0 116 1.000 Lake Coeur dlAlene 9 0 100 1.000 Pend Oreille Lake 9 0 120 1.000 Anderson Ranch Res. 9 0 22 1.000 Deadwood Reservoir 9 0 148 1.000 Deadwood Reservoir 9 2 120 1.000 Dworshak Reservoir 9 0 118 1.000 Payette Lake 9 0 120 1.000 NF Payette River 9 2 116 1.000 Lower Granite 9 2 32 1.000 Warm Lake 9 0 110 1.000 Warm Lake 9 2 120 1.000 Wallowa River 9 2 118 1.000 Wallowa Lake 9 3 78 1.000 Lake Billy Chinook 9 2 96 1.000 Link Creek 9 2 98 1.000 Odell Lake 9 2 120 1.000 Wizard Falls Hatchery 93 160 -994 Lake Wenatchee 8 7 114 1.000 Lake Wenatchee 8 8 120 1.000 Okanogan River 9 0 116 1.000 Babine Lake 9 0 120 1.000 Fish Creek (Alaska) 9 2 80 1.000

ADA- 1 * Year 2 N 10 0 9 4 9 0
..................................................... Alturas L. outmigrant 91 28 .893 .lo7 .OO O Alturas L. spawners 9 2 60 ..983 .017 .OOO Alturus L. trawl 9 0 200 .930 .070 .OOO Alturas L. trawl 9 2 84 .929 .071 .ooo ~edfish L. kokanee 9 0 168 .940 -060 .OOO Redfish L. kokanee 9 1 138 .942 .058 .OOO Redfish L. kokanee 9 2 120 .933 .067 .OOO Redfish L. trawl 9 0 24 1.000 .OOO .OOO Redfish L. trawl 9 2 94 .894 -096 .011 Redfish L. trawl 9 3 78 .962 .038 .OOO Redfish L. trawl 9 4 52 1.000 -000 .OOO ~edfish L. outmigrant 91 274 .993 .007 .OOO ~edfish L. outmigrant 92 34 ,971 .029 .OOO Redfish L. outmigrant 93 52 1.000 .OOO .OOO ~edfish L. sockeye 91-93 26 1.000 .OOO .OOO Redfish L. residual 92 -9 3 28 1.000 .O O O . O O O Stanley L. spawners 9 2 118 1.000 .OOO .OOO Stanley L. trawl 9 2 20 1.000 .OOO .O O O Stanley L. trawl 9 3 24 .917 .083 .OOO Stanley L. trawl 9 4 34 .971 .029 .OOO Stanley L. spawners 9 4 16 .938 .063 .OOO Pettit Lake 9 2 50 .960 .040 .O O O Pettit Lake 9 4 64 1.000 .OOO .O O O Lake Whatcom 9 0 120 l.OOCl .O O O .OOO Lake Coeur d'Alene 9 0 100 1.000 .O O O .OOO Pend Oreille Lake 9 0 120 1.000 .OOO .O O O Anderson Ranch Res. 9 0 24 .792 .208 .OOO Deadwood Reservoir 9 0 176 -739 .261 .O O O Deadwood Reservoir 9 2 120 .858 .I42 .O O O Dworshak ~eservoir 9 0 116 -784 .216 .OOO Payette Lake 9 0 118 .746 .254 .O O O NF Payette River 9 2 118 .780 .220 -000 Lower Granite 9 2 36 -778 .222 .OOO Warm Lake 9 0 120 1.000 .OOO .O O O Warm Lake 9 2 120 ,767 .233 .O O O Wal lowa River 9 2 120 .800 .200 .O O O Wallowa Lake 9 3 78 1.000 .O O O . O O O Lake Billy Chinook 9 2 96 1.000 .OOO .O O O Link Creek 9 2 98 .980 .020 .OOO Odell Lake 9 2 120 .883 .I17 .OOO Wizard Falls Hatchery 93 160 .981 .019 .OOO Lake Wenatchee 8 7 240 1.000 .O O O . O O O Lake Wenatchee 8 8 320 1.000 .O O O .OOO Okanogan River 9 0 126 .984 .016 .OOO Babine Lake 9 0 120 1.000 .OOO .O O O Fish Creek (Alaska) 9 2 80 1.000 .OOO .OOO

ADA- 2 * Year 2N 100 107 9 4
..................................................... Alturas L. outmigrant 91 66 1,000 -000 .000 Alturas L. spawners 9 2 60 1.000 -000 .OOO Alturus L. trawl 9 0 186 1.000 .OOO .OOO Alturas L. trawl 9 2 84 1.000 .OOO .OOO Redfish L. kokanee 9 0 174 1.000 .OOO .OOO ~edfish L. kokanee 9 1 138 1.000 .OOO .OOO Redfish L. kokanee 9 2 120 1.000 .OOO .OOO ~edfish L. trawl 9 0 22 1.000 .OOO .OOO ~edfish L. trawl 9 2 94 1.000 .OOO .OOO Redfish L. trawl 9 3 0 .OOO .OOO .OOO Redfish L. trawl 9 4 48 1.000 .OOO .OOO ~edfish L. outmigrant 91 266 1.000 .OOO .OOO ~edfish L. outmigrant 92 22 1.000 .OOO .000 Redfish L. outmigrant 93 52 1.000 .OOO .OOO Redfish L. sockeye 91-93 24 1.000 .OOO .OOO Redfish L. residual 92-93 28 1.000 .OOO .OOO Stanley L. spawners 9 2 118 1.000 -000 .OOO Stanley L. trawl 9 2 20 1.000 .OOO .OOO Stanley L. trawl 9 3 26 1.000 .OOO .OOO Stanley L. trawl 9 4 26 1.000 .OOO .OOO Stanley L. spawners 9 4 16 1.000 .OOO .OOO Pettit Lake 9 2 50 1.000 .OOO .OOO Pettit Lake 9 4 0 .OOO .OOO .OOO Lake Whatcom 9 0 120 1.000 .OOO -000 Lake Coeur dlAlene 9 0 100 1.000 -000 .OOO Pend Oreille Lake 9 0 120 1.000 -000 .OOO Anderson Ranch Res. 9 0 22 1.000 .OOO .OOO Deadwood Reservoir 9 0 176 -994 -006 .OOO Deadwood Reservoir 9 2 120 1.000 .OOO .OOO Dworshak Reservoir 9 0 116 1.000 -000 .OOO Payette Lake 9 0 120 1.000 .OOO .OOO NF Payette River 9 2 118 1.000 .OOO .OOO Lower Granite 9 2 36 1.000 -000 -000 Warm Lake 9 0 120 -992 -008 -000 Warm Lake 9 2 120 1.000 .OOO .OOO Wallowa River 9 2 120 1.000 .OOO .OOO Wallowa Lake 9 3 80 1.000 .OOO .OOO Lake Billy Chinook 9 2 96 1.000 -000 .OOO Link Creek 9 2 98 1.000 .OOO -000 Odell Lake 9 2 120 1,000 .OOO .OOO Wizard Falls Hatchery 93 156 1.000 -000 .OOO Lake Wenatchee 8 7 234 1.000 -000 .OOO Lake Wenatchee 8 8 320 1.000 -000 .OOO Okanogan River 9 0 126 1.000 -000 .OOO Babine Lake 9 0 120 1.000 -000 .OOO Fish Creek (Alaska) 9 2 80 .975 .025 .OOO
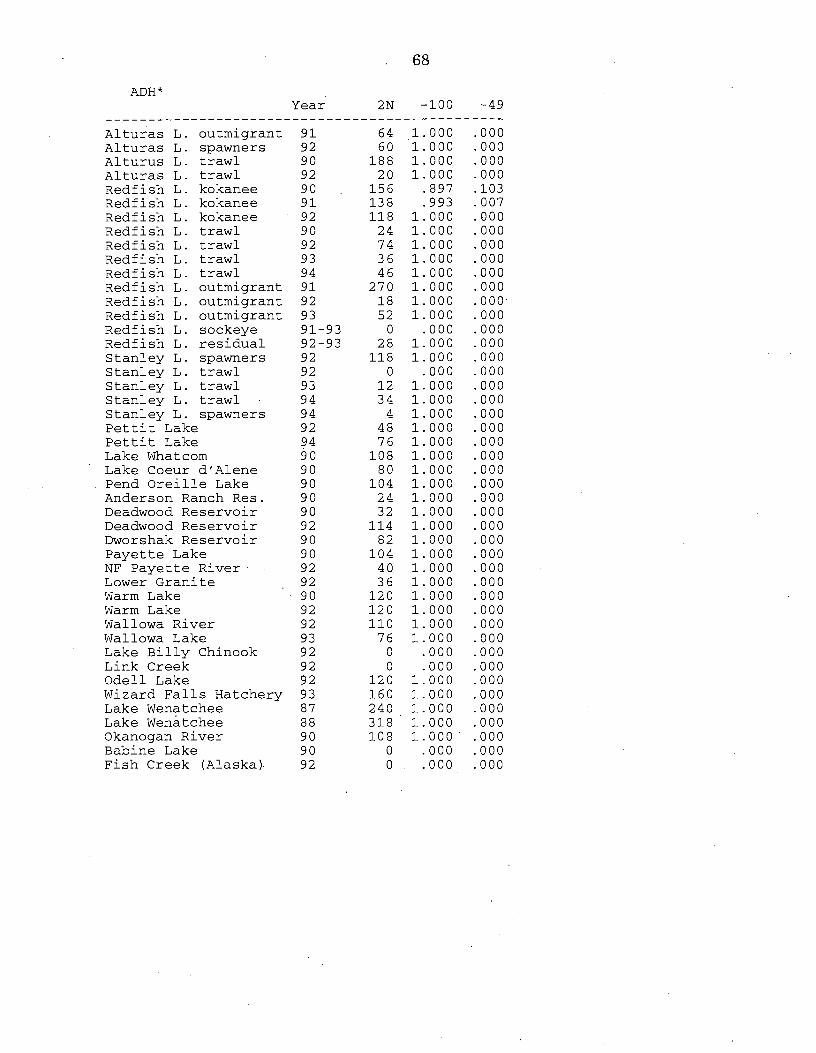
ADH * Year 2N
.................................... Alturas L. outmigrant 9 1 6 4 Alturas L. spawners 9 2 6 0 Alturus L. trawl 9 0 1 8 8 Alturas L. trawl 9 2 2 0 Redfish L. kokanee 9 0 1 5 6 ~edfish L. kokanee 9 1 1 3 8 Redfish L. kokanee 9 2 1 1 8 Redfish L. trawl 9 0 2 4 Redfish L. trawl 9 2 7 4 Redfish L. trawl 9 3 3 6 Redfish L. trawl 9 4 4 6 ~edfish L. outmigrant 9 1 2 7 0 Redfish L. outmigrant 92 1 8 Redfish L. outmigrant 93 5 2 Redfish L. sockeye 91-93 0 Redfish L. residual 92-93 2 8 Stanley L. spawners 9 2 1 1 8 Stanley L. trawl 9 2 0 Stanley L. trawl 9 3 1 2 Stanley L. trawl 9 4 3 4 Stanley L. spawners 9 4 4 Pettit Lake 9 2 4 8 Pettit Lake 9 4 7 6 Lake Whatcom 90 1 0 8 Lake Coeur dlAlene 9 0 8 0 Pend Oreille Lake 9 0 1 0 4 Anderson Ranch Res. 9 0 2 4 Deadwood ~eservoir 9 0 3 2 Deadwood Reservoir 9 2 1 1 4 Dworshak ~eservoir 9 0 8 2 Payette Lake 9 0 1 0 4 N F Payette River 9 2 40 Lower Granite , 92 3 6 Warm Lake 9 0 1 2 0 Warm Lake 9 2 1 2 0 Wallowa River 9 2 11 0 Wallowa Lake 9 3 7 6 Lake Billy Chinook 9 2 0 Link Creek 9 2 0 Odell Lake 9 2 1 2 0 Wizard Falls Hatchery 9 3 1 6 0 Lake Wenatchee 8 7 2 4 0 Lake ~enatchee 8 8 3 1 8 Okanogan River 9 0 1 0 8 Babine Lake 9 0 0 Fish Creek (Alaska) 9 2 0

sAH* Year 2N 100 117 8 3
..................................................... Aituras L. outmigrant 91 64 1.000 .ooo .ooo Alturas L. spawners 9 2 60 1.000 .ooo .Ooo Alturus L. trawl 9 0 186 1.000 .OOO .OOO Alturas L. trawl 9 2 20 1.000 .OOO .OOO Redfish L. kokanee 9 0 174 1.000 .OOO .OOO Redfish L. kokanee 9 1 138 1.000 .OOO .OOO Redfish L. kokanee 9 2 118 1.000 .OOO .OOO Redfish L. trawl 9 0 24 1.COO .OOO .OOO Redfish L. trawl 9 2 72 1.000 -000 .OOO Redfish L. trawl 9 3 40 1.000 .OOO .OOO Redfish L. trawl 9 4 48 1.000 .OOO .OOO Redfish L. outmigrant 91 272 1.000 .OOO .OOO Redfish L. outmigrant 92 34 1.000 .OOO .OOO Redfish L. outmigrant 93 52 1.000 .OOO .OOO Redfish L. sockeye 9 1 - 9 3 26 1.000 .OOO .OOO Redfish L. residual 92-93 28 1.000 .OOO .OOO Stanley L. spawners 9 2 120 1.000 .OOO .OOO Stanley L. trawl 9 2 0 .OOO .OOO .OOO Stanley L. trawl 9 3 12 1.000 .OOO .OOO Stanley L. trawl 9 4 34 1.000 .OOO .OOO Stanley L. spawners 9 4 14 1.000 .OOO .OOO Pettit Lake 9 2 50 1.000 -000 -000 Petti t Lake 9 4 76 1.000 .OOO -000 Lake Whatcom 9 0 120 1.000 -000 -000 Lake Coeur dlAlene 90 100 1.000 .OOO .OOO Pend Oreille Lake 90 120 1.000 .OOO .OOO Anderson Ranch Res. 9 0 22 1.000 .OOO .OOO Deadwood Reservoir 9 0 168 1.000 .OOO .OOO Deadwood Reservoir 9 2 120 1.000 .OOO .OOO Dworshak Reservoir 9 0 120 1.000 .OOO -000 Payette Lake 9 0 116 1.000 .OOO .OOO NF Payette River 9 2 118 1.000 .OOO -000 Lower Granite 9 2 36 1.000 .OOO .000 Warm Lake 9 0 104 1.000 .OOO .OOO Warm Lake 9 2 120 1.000 .OOO .OOO Wallowa River 9 2 118 1.000 -000 .OOO Wallowa Lake 9 3 78 1.000 .OOO .OOO Lake Billy Chinook 9 2 96 1.000 .OOO .OOO Link Creek 9 2 98 1.000 .OOO .OOO Odell Lake 9 2 120 1.000 -000 .OOO Wizard Falls Hatchery 93 160 1.000 .OOO .OOO Lake Wenatchee 8 7 238 1.000 -000 .OOO Lake Wenatchee 8 8 312 .997 .003 .OOO Okanogan River 9 0 126 .992 .008 .OOO Babine Lake 9 0 120 1.000 .OOO .OOO Fish Creek (Alaska) 9 2 80 1.000 .OOO .OOO
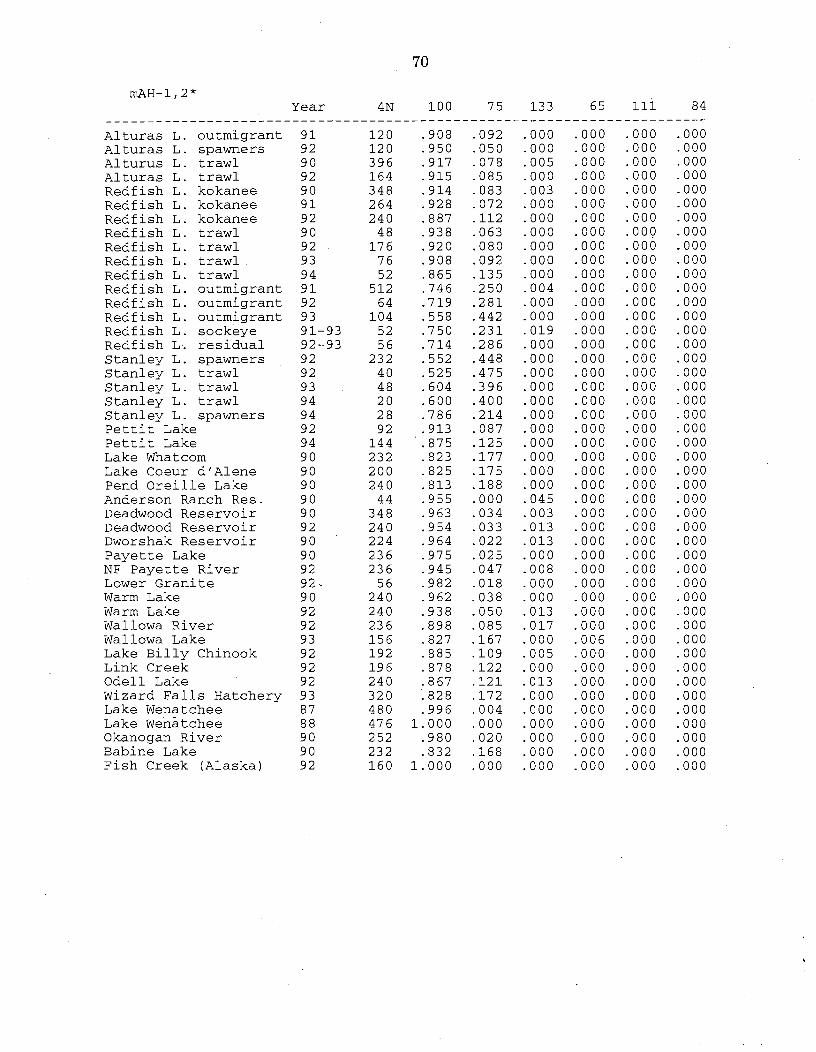
----------------------
Alturas L. outmigrant Alturas L. spawners Alturus L. trawl Alturas L. trawl Redfish L. kokanee Redfish L. kokanee Redfish L. kokanee Redf ish L. trawl Redfish L. trawl Redfish L. trawl Redfish L. trawl Redfish L. outmigrant Redfish L. outmigrant ~edfish L. outmigrant ~edfish L. sockeye ~edfish L. residual Stanley L. spawners Stanley L. trawl Stanley L. trawl Stanley L. trawl Stanley L. spawners Pettit Lake Pettit Lake Lake Whatcom Lake Coeur d'Alene Pend Oreille Lake Anderson Ranch Res. Deadwood Reservoir Deadwood Reservoir Dworshak Reservoir Payette Lake NF Payette River Lower Granite Warm Lake Warm Lake Wallowa River Wallowa Lake Lake Billy Chinook Link Creek Odell Lake Wizard Falls Hatchery Lake Wenatchee Lake ~enatchee Okanogan River Babine Lake Fish Creek (Alaska)
Year 4N 10 o 75 133 65 11i
9 1 120 .908 .092 .OOO .OOO .OOO 9 2 120 .950 .050 .OOO -000 .000 9 0 396 .917 .078 .005 .OOO .OOO 9 2 164 .915 .085 .OOO .OOO .000 9 0 348 .914 .083 .003 .OOO .OOO 9 1 264 .928 .072 .OOO .OOO .OOO 9 2 240 .887 .I12 .OOO .OOO .000 9 0 48 .938 .063 .OOO -000 .OOO 9 2 176 .920 .080 .OOO -000 .OOO 9 3 76 .908 .092 .OOO -000 .OOO 9 4 52 .865 .I35 .OOO .OOO .000 9 1 512 .746 .250 .004 .OOO .OOO 9 2 64 .719 .281 .OOO .OOO .OOO 9 3 104 .558 .442 -000 .OOO .OOO 91-93 52 .750 .231 .019 .OOO .OOO 92-93 56 .714 .286 .OOO .OOO .OOO 9 2 232 .552 .448 .OOO .OOO .OOO 9 2 40 .525 .475 .OOO -000 .OOO 9 3 48 .604 .396 .OOO .OOO -000 9 4 20 .600 .400 .OOO .OOO .OOO 9 4 28 .786 .214 .OOO -000 -000 9 2 92 .913 .087 .OOO .OOO .OOO 9 4 144 .875 -125 .OOO .OOO .OOO 9 0 232 .823 .I77 .OOO .OOO .OOO 9 0 200 .825 .I75 .OOO .OOO .OOO 9 0 240 .813 .I88 .OOO .OOO .OOO 9 0 44 .955 .OOO .045 .OOO .OOO 9 0 348 .963 .034 .003 .OOO .OOO 9 2 240 .954 .033 -013 .OOO .OOO 9 0 224 .964 .022 -013 .OOO .OOO 9 0 236 .975 .025 .OOO .OOO .OOO 9 2 236 .945 .047 -008 .OOO .OOO 92 - 56 .982 .018 .OOO .OOO -000 90 240 .962 -038 .OOO -000 .OOO 9 2 240 .938 .050 .013 -000 .OOO 9 2 236 .898 .085 .017 .OOO .OOO 9 3 156 .827 .I67 -000 .006 .OOO 9 2 192 .885 .I09 .005 .OOO .OOO 9 2 196 .878 .I22 .OOO .OOO .OOO 9 2 240 .867 .I21 -013 .OOO .OOO 9 3 320 .828 .I72 .OOO .OOO .OOO 8 7 480 .996 .004 .OOO .OOO .OOO 8 8 476 1.000 .OOO .OOO .OOO .OOO 9 0 252 -980 .020 .OOO .OOO .OOO 9 0 232 .832 .I08 .OOO .OOO .OOO 9 2 160 1.000 .OOO .OOO -000 .OOO

---------------------- Alturas L. outmigrant Alturas L. spawners Alturus L. trawl Alturas L. trawl ~edfish L. kokanee ~edfish L. kokanee Redfish L. kokanee Redfish L. trawl Redfish L. trawl Redfish L. trawl Redfish L. trawl Redfish L. outmigrant ~edfish L. outmigrant ~edfish L. outmigrant Redfish L. sockeye Redfish L. residual Stanley L. spawners Stanley L. trawl Stanley L. trawl Stanley L. trawl Stanley L. spawners Pettit Lake Pettit Lake Lake Whatcom Lake Coeur dlAlene Pend Oreille Lake Anderson Ranch Res. Deadwood Reservoir Deadwood ~eservoir Dworshak Reservoir Payette Lake NF Payette River Lower Granite Warm Lake Warm Lake Wallowa River Wallowa Lake Lake Billy Chinook Link Creek Ode11 Lake Wizard Falls Hatchery Lake Wenatchee Lake ~enatchee Okanogan River Babine Lake Fish Creek (Alaska)
Year 2 N 1 0 0 1 1 4 8 4
9 1 6 6 1 . 0 0 0 . O O O . O O O 9 2 6 0 1 . 0 0 0 - 0 0 0 . O O O 9 0 2 0 0 1 . 0 0 0 . o o o . o o o 9 2 8 4 1 . 0 0 0 . O O O . O O O 9 0 1 7 6 1 . 0 0 0 . O O O . O O O 9 1 1 3 4 1 . 0 0 0 . O O O . O O O 9 2 1 2 0 1 . 0 0 0 . o o o - 0 0 0 9 0 2 4 1 . 0 0 0 . O O O . O O O 9 2 9 4 1 . 0 0 0 . o o o - 0 0 0 9 3 8 6 1 . 0 0 0 . O O O . O O O 9 4 4 8 1 . 0 0 0 - 0 0 0 . O O O 9 1 2 7 4 1 . 0 0 0 . O O O - 0 0 0 9 2 2 0 1 . 0 0 0 . o o o - 0 0 0 9 3 4 6 1 . 0 0 0 . O O O . O O O 9 1 - 9 3 2 6 1 . 0 0 0 . O O O . O O O 9 2 - 9 3 2 8 1 . 0 0 0 . O O O . O O O 9 2 1 1 8 1 . 0 0 0 . O O O . O O O 9 2 2 0 1 . 0 0 0 . o o o . o o o 9 3 2 6 1 . 0 0 0 . O O O . O O O 9 4 3 4 1 . 0 0 0 . o o o . o o o 9 4 1 4 1 . 0 0 0 . O O O . O O O 9 2 4 6 1 . 0 0 0 . O O O . O O O 9 4 0 . o o o . o o o . o o o 9 0 1 2 0 1 . 0 0 0 . o o o . o o o 9 0 1 0 0 1 . 0 0 0 . o o o . o o o 9 0 1 2 0 1 . 0 0 0 . o o o . o o o 9 0 2 4 1 . 0 0 0 . O O O . O O O 9 0 1 7 4 1 . 0 0 0 . O O O . O O O 9 2 1 2 0 1 . 0 0 0 . o o o . o o o 9 0 1 1 4 1 . 0 0 0 . O O O . O O O 9 0 1 2 0 1 . 0 0 0 . o o o . o o o 9 2 1 1 8 1 . 0 0 0 . O O O . O O O 9 2 3 4 1 . 0 0 0 . o o o . o o o 9 0 1 2 0 1 . 0 0 0 - 0 0 0 . o o o 9 2 1 2 0 1 . 0 0 0 . o o o . o o o 9 2 1 2 0 1 . 0 0 0 - 0 0 0 - 0 0 0 9 3 7 8 . 9 8 7 . 0 1 3 . O O O 9 2 9 6 1 . 0 0 0 - 0 0 0 - 0 0 0 9 2 9 8 1 . 0 0 0 . O O O . O O O 9 2 1 2 0 1 . 0 0 0 . o o o . o o o 9 3 1 6 0 1 . 0 0 0 - 0 0 0 - 0 0 0 8 7 2 4 0 1 . 0 0 0 . O O O - 0 0 0 8 8 2 3 8 1 . 0 0 0 . O O O . O O O 9 0 1 2 6 1 . 0 0 0 . O O O - 0 0 0 9 0 1 2 0 1 . 0 0 0 . o o o - 0 0 0 9 2 8 0 1 . 0 0 0 . O O O . O O O
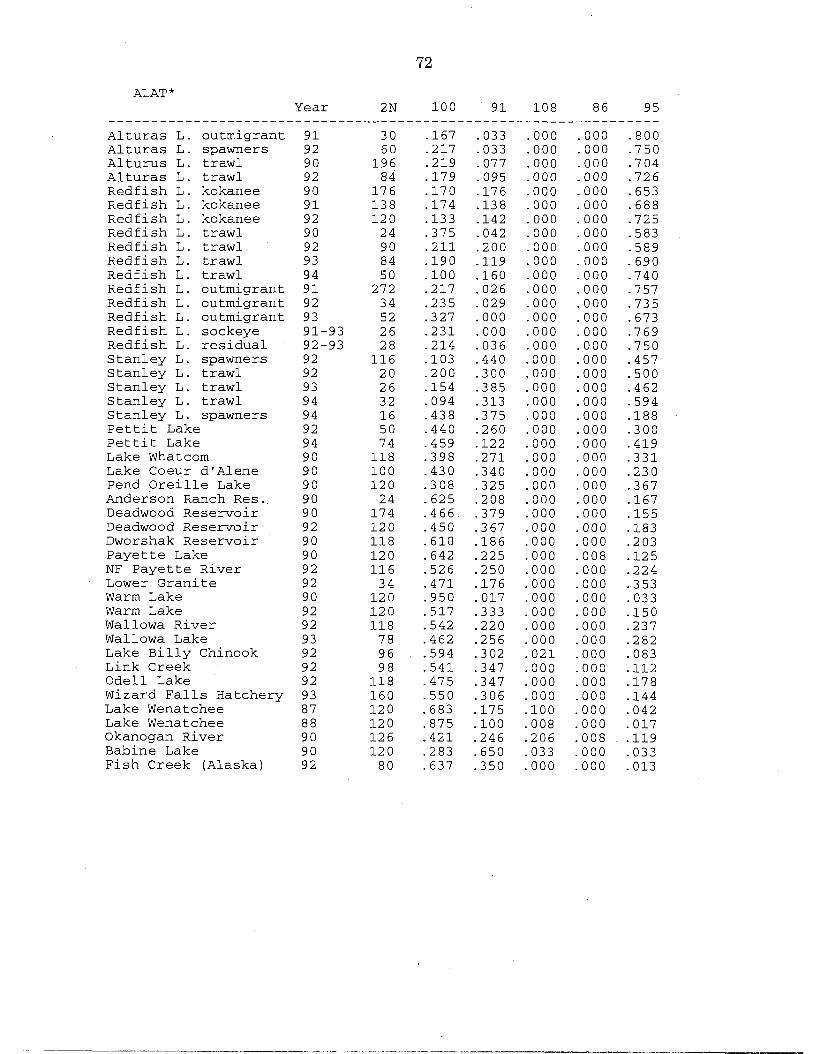
ALAT * Year 2N
.................................... Alturas L. outmigrant 91 30 Alturas L. spawners 9 2 6 0 Alturus L. trawl 9 0 196 Alturas L. trawl 9 2 8 4 Redfish L. kokanee 9 0 17 6 ~edfish L. kokanee 9 1 138 ~edfish L. kokanee 9 2 12 0 ~edfish L. trawl 9 0 2 4 Redf ish L. trawl 9 2 9 0 Redf ish L . trawl 93 8 4 Redf ish L . trawl 9 4 5 0 Redfish L. outmigrant 91 272 Redfish L. outmigrant 92 3 4 Redfish L. outmigrant 93 5 2 Redfish L. sockeye 91-93 26 Redfish L. residual 92-93 2 8 Stanley L. spawners 9 2 116 Stanley L. trawl 9 2 20 Stanley L. trawl 9 3 26 Stanley L. trawl 9 4 3 2 Stanley L. spawners 9 4 16 Pettit Lake 9 2 5 0 Pettit Lake 9 4 7 4 Lake Whatcom 9 0 11 8 Lake Coeur dlAlene 9 0 100 Pend Oreille Lake 9 0 12 0 Anderson Ranch Res. 9 0 2 4 Deadwood Reservoir 9 0 174 Deadwood Reservoir 92 12 0 Dworshak Reservoir 9 0 118 Payette Lake 9 0 12 0 NF Payette River 9 2 11 6 Lower Granite 9 2 3 4 Warm Lake 9 0 12 0 Warm Lake 9 2 12 0 Wallowa River 9 2 118 Wallowa Lake 9 3 7 8 Lake Billy Chinook 9 2 9 6 Link Creek 9 2 98 Odell Lake 9 2 118 Wizard Falls Hatchery 93 160 Lake Wenatchee 8 7 12 0 Lake Wenatchee 8 8 12 0 Okanogan River 9 0 12 6 Babine Lake 9 0 12 0 Fish Creek (Alaska) 9 2 8 0

---------------------- Alturas L. outmigrant Alturas L. spawners Alturus L. trawl Alturas L. trawl Redfish L. kokanee Redfish L. kokanee Redfish L. kokanee Redfish L. trawl Redfish L. trawl Redfish L. trawl Redfish L. trawl Redfish L. outmigrant Redfish L. outmigrant Redfish L. outmigrant Redfish L. sockeye Redfish L. residual Stanley L. spawners Stanley L. trawl Stanley L. trawl Stanley L. trawl Stanley L. spawners Pettit Lake Pettit Lake Lake Whatcom Lake Coeur dlAlene Pend Oreille Lake Anderson Ranch Res. Deadwood Reservoir Deadwood Reservoir Dworshak Reservoir Payette Lake NF Payette River Lower Granite Warm Lake Warm Lake Wallowa River Wallowa Lake Lake Billy Chinook Link Creek Odell Lake Wizard Falls Hatchery Lake Wenatchee Lake Wenatchee Okanogan River Babine Lake Fish Creek (Alaska)
Year 2 N 1 0 0 1 1 3
9 1 66 1 . 0 0 0 - 0 0 0 9 2 6 0 1 . 0 0 0 - 0 0 0 9 0 1 9 8 1 . 0 0 0 . O O O 9 2 8 4 1 . 0 0 0 . O O O 9 0 1 7 6 1 . 0 0 0 . O O O 9 1 1 3 8 1 . 0 0 0 - 0 0 0 9 2 1 2 0 1 . 0 0 0 - 0 0 0 9 0 2 4 1 . 0 0 0 . O O O 9 2 8 8 1 . 0 0 0 . O O O 9 3 7 4 1 . 0 0 0 . o o o 9 4 4 2 1 . 0 0 0 . O O O 9 1 2 7 4 1 . 0 0 0 . O O O 9 2 3 4 1 . 0 0 0 - 0 0 0 9 3 5 2 1 . 0 0 0 . O O O 9 1 - 9 3 2 6 1 . 0 0 0 - 0 0 0 9 2 - 9 3 2 6 1 . 0 0 0 . O O O 9 2 1 1 8 1 . 0 0 0 . O O O 9 2 2 0 1 . 0 0 0 . o o o 9 3 2 6 1 . 0 0 0 . O O O 9 4 3 2 1 . 0 0 0 - 0 0 0 9 4 1 6 1 . 0 0 0 - 0 0 0 9 2 5 0 1 . 0 0 0 . O O O 9 4 7 6 1 . 0 0 0 - 0 0 0 9 0 1 2 0 1 . 0 0 0 . o o o 9 0 1 0 0 1 . 0 0 0 . o o o 9 0 1 2 0 1 . 0 0 0 . o o o 9 0 2 4 1 . 0 0 0 - 0 0 0 9 0 1 6 4 1 . 0 0 0 - 0 0 0 9 2 1 2 0 1 . 0 0 0 ' . o o o 9 0 1 1 2 1 . 0 0 0 . o o o 9 0 1 1 8 1 . 0 0 0 . O O O 9 2 1 1 8 1 . 0 0 0 . O O O 9 2 3 6 1 . 0 0 0 . O O O 9 0 1 1 8 1 . 0 0 0 . O O O 9 2 1 2 0 1 . 0 0 0 . o o o 9 2 1 2 0 1 . 0 0 0 . o o o 9 3 7 8 1 . 0 0 0 . O O O 9 2 9 6 1 . 0 0 0 . O O O 9 2 9 8 1 . 0 0 0 . O O O 9 2 1 1 8 1 . 0 0 0 . O O O 9 3 1 6 0 1 . 0 0 0 - 0 0 0 8 7 2 4 0 . 9 9 6 . 0 0 4 8 8 3 1 8 1 . 0 0 0 . O O O 9 0 1 2 6 1 . 0 0 0 . O O O 9 0 1 1 6 1 . 0 0 0 . O O O 9 2 8 0 1 . 0 0 0 . O O O

CKA- 2 * Year 2N 100 122
............................................... Alturas L. outmigrant 91 66 1.000 -000 Alturas L. spawners 9 2 60 1.000 .ooo Alturus L. trawl 9 0 200 1.000 .OOO Alturas L. trawl 9 2 84 1.000 .ooo Redfish L. kokanee 9 0 176 1.000 .OOO Redfish L. kokanee 9 1 138 1.000 .OOO Redfish L. kokanee 9 2 120 1.000 .OOO Redf ish L . trawl 9 0 24 1.000 .OOO ~edfish L. trawl 9 2 88 1.000 .OOO ~edfish L. trawl 9 3 74 1.000 .OOO ~edfish L. trawl 9 4 42 1.000 .000 Redfish L. outmigrant 91 274 1.000 .OOO Redfish L. outmigrant 92 34 1.000 .OOO Redfish L. outmigrant 93 52 1.000 .OOO Redfish L. sockeye 91-93 26 1.000 .OOO Redfish L. residual 92-93 28 1.000 .OOO Stanley L. spawners 9 2 118 1.000 .OOO Stanley L. trawl 9 2 20 1.000 .OOO Stanley L. trawl 9 3 26 1.000 .OOO Stanley L. trawl 9 4 32 1.000 .OOO Stanley L. spawners 9 4 16 1.000 .OOO Pettit Lake 9 2 50 1.000 .OOO Pettit Lake 9 4 76 1.000 -000 Lake Whatcom 9 0 120 1.000 -000 Lake Coeur d'Alene 9 0 100 1.000 .OOO Pend Oreille Lake 9 0 120 1.000 .OOO Anderson Ranch Res. 9 0 24 1.000 .OOO Deadwood Reservoir 9 0 162 1.000 .OOO Deadwood Reservoir 9 2 120 1.000 .000 Dworshak Reservoir 9 0 110 1.000 .OOO Payette Lake 9 0 110 1.000 .OOO NF Payette River 9 2 118 1.000 -000 Lower Granite 9 2 36 1.000 .OOO Warm Lake 9 0 120 1.000 -000 Warm Lake 9 2 120 1.000 -000 Wallowa River 9 2 120 1.000 .OOO Wallowa Lake 9 3 78 .987 .013 Lake Billy Chinook 9 2 96 1.000 .OOO Link Creek 9 2 98 1.000 .OOO Odell Lake 9 2 118 1.000 .OOO Wizard Falls Hatchery 93 160 1.000 .OOO Lake Wenatchee 8 7 240 1.000 .OOO Lake ~enatchee 8 8 318 1.000 .OOO Okanogan River 9 0 126 1.000 .OOO Babine Lake 9 0 118 1.000 .OOO Fish Creek (Alaska) 9 2 80 1.000 .000
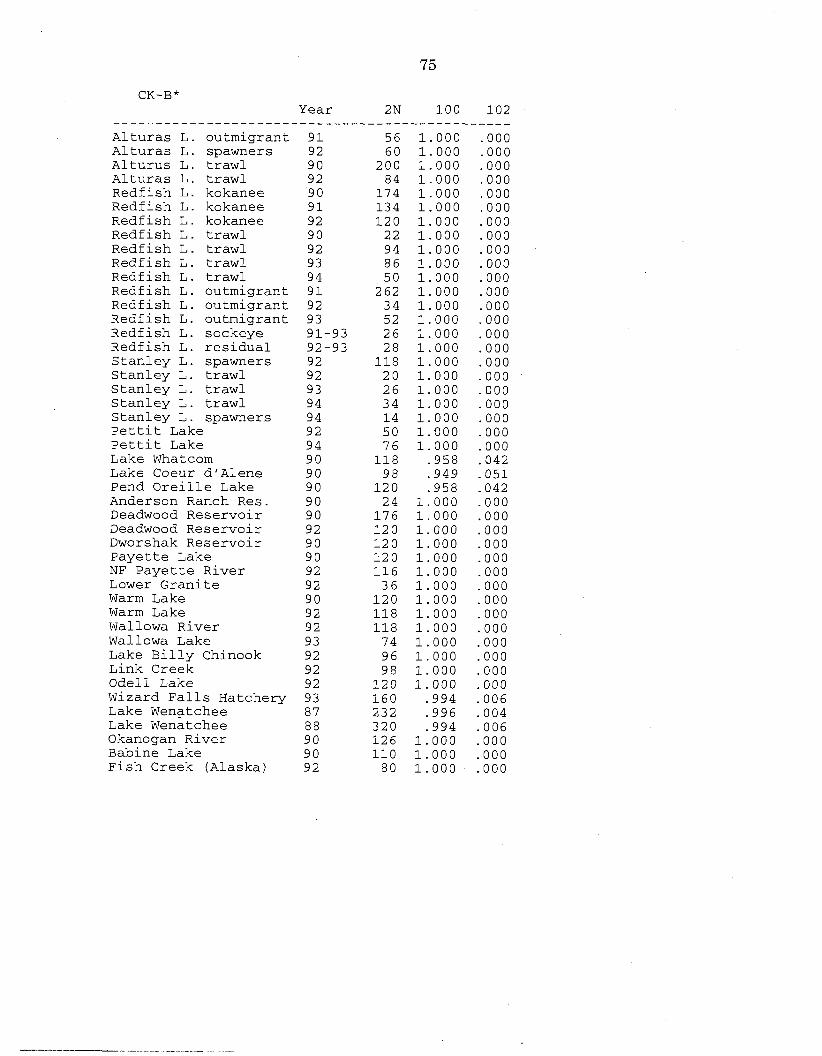
CK-B* Year 2N 100
Alturas L. outmigrant 91 56 1.000 Alturas L. spawners 9 2 60 1.000 Alturus L. trawl 9 0 200 1.000 Alturas L. trawl 9 2 84 1.000 Redfish L. kokanee '9 0 174 1.000 Redfish L. kokanee 9 1 134 1.000 Redfish L. kokanee 9 2 120 1.000 Redfish L. trawl 9 0 22 1.000 Redfish L. trawl 9 2 94 1.000 Redfish L. trawl 9 3 86 1.000 Redfish L. trawl 9 4 50 1.000 Redfish L. outmigrant 91 262 1.000 Redfish L. outmigrant 92 34 1.000 Redfish L. outmigrant 93 52 1.000 Redfish L. sockeye 91-93 26 1.000 Redfish L. residual 92-93 28 1.000 Stanley L. spawners 9 2 118 1.000 Stanley L . trawl 9 2 20 1.000 Stanley L. trawl 9 3 26 1.000 Stanley L. trawl 9 4 34 1.000 Stanley L. spawners 9 4 14 1.000 Pettit Lake 9 2 50 1.000 pettit Lake 9 4 76 1.000 Lake Whatcom 9 0 118 .958 Lake Coeur diAlene 9 0 98 .949 Pend Oreille Lake 9 0 120 .958 Anderson Ranch Res. 9 0 24 1.000 Deadwood Reservoir 9 0 176 1.000 Deadwood Reservoir 9 2 120 1.000 Dworshak Reservoir 9 0 120 1.000 Payette Lake 9 0 120 1.000 NF Payette River 9 2 116 1.000 Lower Granite 9 2 36 1.000 Warm Lake 9 0 120 1.000 Warm Lake 9 2 118 1.000 Wallows River 9 2 118 1.000 Wallowa Lake 9 3 74 1.000 Lake Billy Chinook 9 2 96 1.000 Link Creek 9 2 98 1.000 Odell Lake 92 120 1.000 wizard Falls Hatchery 93 160 .994 Lake Wenatchee 8 7 232 .996 Lake Wenatchee 8 8 320 .994 Okanogan River 9 0 126 1.000 Babine Lake 9 0 110 1.000 Fish Creek (Alaska) 9 2 80 1.000
CKC-2* Year 2N 100 102 9 5
..................................................... Alturas I,, outmigrant 91 56 1.000 -000 -000 Alturas L. spawners 9 2 60 1.000 .OOO .OOO Alturus L. trawl 9 0 194 1.000 .OOO .OOO Alturas L. trawl 9 2 84 1.000 ,000 .OOO Redfish L. kokanee 9 0 130 1.000 .OOO .OOO Redfish L. kokanee 9 1 132 1.000 .OOO .OOO Redfish L. kokanee 9 2 120 1.000 .OOO .OOO ~edfish L. trawl 9 0 18 1.000 .OOO .OOO ~edfish L. trawl 9 2 88 1.000 .OOO .OOO Redfish L. trawl 9 3 82 1.000 .OOO .000 Redfish L. trawl 9 4 50 1.000 .OOO .OOO ~edfish L. outmigrant 91 244 1.000 .000 .000 Redfish L. outmigrant 92 32 1.000 .OOO .OOO Redfish L. outmigrant 93 52 1.000 .OOO .OOO Redfish L. sockeye 91-93 26 1.000 .OOO .OOO Redfish L. residual 92-93 28 1.000 .OOO .OOO Stanley L. spawners 9 2 118 1.000 -000 .OOO Stanley L. trawl 9 2 20 1.000 .OOO -000 Stanley L. trawl 9 3 22 1.000 .OOO -000 Stanley L. trawl 9 4 30 1.000 .OOO .OOO Stanley L. spawners 9 4 14 1.000 .OOO -000 Pettit Lake 9 2 44 1.000 .OOO .OOO Pettit Lake 9 4 72 1.000 .OOO -000 Lake Whatcom 90 116 .991 .009 .OOO Lake Coeur dlAlene 9 0 94 1.000 .OOO .OOO Pend Oreille Lake 9 0 120 1.000 -000 .OOO Anderson Ranch Res. 9 0 22 1.000 ,000 -000 Deadwood Reservoir 9 0 90 1.000 .OOO .OOO Deadwood Reservoir 9 2 120 1.000 .OOO .OOO Dworshak Reservoir 9 0 92 1.000 .OOO .OOO Payette Lake 9 0 24 1.000 .OOO .OOO NF Payette River 9 2 116 1.000 .OOO .OOO Lower Granite 9 2 36 1.000 .OOO .OOO Warm Lake 9 0 120 1.000 -000 .OOO Warm Lake 9 2 118 1.000 -000 .OOO Wallowa River 9 2 120 1.000 .OOO .OOO Wallowa Lake 9 3 74 1.000 .OOO .OOO Lake Billy Chinook 9 2 96 1.000 .OOO .OOO Link Creek 9 2 98 1.000 .OOO .OOO Odell Lake 9 2 120 1.000 .OOO .OOO Wizard Falls Hatchery 93 160 .994 .006 .OOO Lake Wenatchee 8 7 232 1.000 .OOO .OOO Lake ~enatchee 8 8 320 1.000 .OOO .OOO Okanogan River 9 0 118 1.000 .OOO .OOO Babine Lake 9 0 96 1.000 .OOO .OOO Fish Creek (Alaska) 9 2 80 1.000 -000 -000

FBALD- 4 * Year 2N
................................... Alturas L. outmigrant 91 5 6 Alturas L. spawners 9 2 6 0 Alturus L. trawl 9 0 194 Alturas L. trawl 9 2 8 4 ~edfish L. kokanee 9 0 174 ~edfish L. kokanee 9 1 13 4 Redfish L. kokanee 9 2 12 0 Redf ish L. trawl 9 0 18 Redfish L. trawl 9 2 7 8 Redfish L. trawl 9 3 0 Redfish L. trawl 9 4 0 Redfish L. outmigrant 91 258 Redfish L. outmigrant 92 28 Redfish L. outmigrant 93 5 2 Redfish L. sockeye 91-93 2 6 Redfish L. residual 92-93 2 8 Stanley L. spawners 9 2 116 Stanley L. trawl 9 2 20 Stanley L. trawl 9 3 0 Stanley L. trawl 9 4 0 Stanley L. spawners 9 4 0 Pettit Lake 9 2 4 8 Pettit Lake 9 4 0 Lake Whatcom 9 0 0 Lake Coeur dfAlene 9 0 9 6 Pend Oreille Lake 9 0 12 0 Anderson Ranch Res. 9 0 20 Deadwood Reservoir 9 0 17 6 Deadwood Reservoir 9 2 8 0 Dworshak Reservoir 9 0 7 6 Payette Lake A 9 0 116 NF Payette River 9 2 7 8 Lower Granite 9 2 36 Warm Lake 9 0 0 Warm Lake 9 2 118 Wallowa River 9 2 118 Wallowa Lake 9 3 7 4 Lake Billy Chinook 9 2 96 Link Creek 9 2 9 8 Odell Lake 9 2 12 0 Wizard Falls Hatchery 93 158 Lake Wenatchee 8 7 240 Lake Wenatchee 8 8 3 14 Okanogan River 9 0 12 6 Babine Lake 90 10 4 Fish Creek (Alaska) 9 2 8 0
FDGH*
...................... Alturas L. outmigrant Alturas L. spawners Alturus L. trawl Alturas L. trawl Redfish L. kokanee Redfish L. kokanee Redfish L. kokanee ~edfish L. trawl Redfish L. trawl ~edfish L. trawl Redfish L. trawl Redfish L. outmigrant Redfish L. outmigrant ~edfish L. outmigrant ~edfish L. sockeye ~edfish L. residual Stanley L. spawners Stanley L. trawl Stanley L. trawl Stanley L. trawl Stanley L. spawners Pettit Lake Pettit Lake Lake Whatcom Lake Coeur d'Alene Pend Oreille Lake Anderson Ranch Res. Deadwood Reservoir Deadwood Reservoir Dworshak ~eservoir Payette Lake NF Payette River Lower Granite Warm Lake Warm Lake Wallowa River Wallowa Lake Lake Billy Chinook Link Creek Odell Lake Wizard Falls Hatchery Lake Wenatchee Lake ~enatchee Okanogan River Babine Lake Fish Creek (Alaska)
Year 2 N 1 0 0 1 0 8 1 2 8 ...............................
9 1 5 2 1 . 0 0 0 . O O O . O O O 9 2 5 4 1 . 0 0 0 . o o o . o o o 9 0 1 6 4 1 . 0 0 0 . O O O . O O O 9 2 2 0 1 . 0 0 0 . o o o . o o o 9 0 1 4 4 1 . 0 0 0 . O O O . O O O 9 1 1 2 8 1 . 0 0 0 . O O O . O O O 9 2 1 2 0 1 . 0 0 0 . o o o . o o o 9 0 2 4 1 . 0 0 0 . O O O . O O O 9 2 7 4 1 . 0 0 0 . o o o . o o o 9 3 4 0 1 . 0 0 0 . O O O . O O O 9 4 4 8 1 . 0 0 0 . O O O . O O O 9 1 2 2 2 1 . 0 0 0 . o o o . o o o 9 2 3 4 1 . 0 0 0 - 0 0 0 . o o o 9 3 5 2 1 . 0 0 0 . O O O . O O O 9 1 - 9 3 2 6 1 . 0 0 0 . O O O . O O O 9 2 - 9 3 2 8 1 . 0 0 0 . O O O . O O O 9 2 1 2 0 1 . 0 0 0 . o o o . o o o 9 2 0 . o o o . o o o . o o o 9 3 1 2 1 . 0 0 0 . o o o . o o o 9 4 3 4 1 . 0 0 0 . o o o . o o o 9 4 1 4 1 . 0 0 0 . O O O . O O O 9 2 5 0 1 . 0 0 0 . O O O . O O O 9 4 7 6 1 . 0 0 0 . O O O . O O O 9 0 1 1 6 1 . 0 0 0 . O O O . O O O 9 0 9 4 1 . 0 0 0 . o o o . o o o 9 0 1 2 0 1 . 0 0 0 . o o o . o o o 9 0 0 . o o o . o o o . o o o 9 0 1 5 6 1 . 0 0 0 . O O O . O O O 9 2 1 2 0 - 9 9 2 - 0 0 0 . 0 0 8 9 0 1 1 6 1 . 0 0 0 . O O O . O O O 9 0 6 8 1 . 0 0 0 . O O O . O O O 9 2 1 1 8 1 . 0 0 0 . O O O . O O O 9 2 3 6 1 . 0 0 0 . O O O . O O O 9 0 1 2 0 1 . 0 0 0 . o o o . o o o 9 2 1 1 8 1 . 0 0 0 . O O O . O O O 9 2 1 1 8 1 . 0 0 0 . O O O . O O O 9 3 7 8 1 . 0 0 0 . O O O . O O O 9 2 9 6 1 . 0 0 0 . O O O - 0 0 0 9 2 9 8 1 . 0 0 0 . O O O . O O O 9 2 1 2 0 . 9 9 2 . O O O . 0 0 8 9 3 1 6 0 1 . 0 0 0 . O O O . O O O 8 7 2 1 8 1 . 0 0 0 . O O O . O O O 8 8 2 8 6 1 . 0 0 0 . O O O . O O O 9 0 8 0 1 . 0 0 0 . O O O . O O O 9 0 1 1 6 1 . 0 0 0 . O O O . O O O 9 2 8 0 1 . 0 0 0 . O O O . O O O
...................... Alturas L. outmigrant Alturas L. spawners Alturus L. trawl Alturas L. trawl ~edfish L. kokanee Redfish L. kokanee Redfish L. kokanee Redfish L. trawl Redfish L. trawl Redfish L. trawl Redfish L. trawl Redfish L. outmigrant Redfish L. outmigrant Redfish L. outmigrant Redfish L. sockeye Redfish L. residual Stanley L. spawners Stanley L. trawl Stanley L. trawl Stanley L. trawl Stanley L. spawners Pettit Lake Pettit Lake Lake Whatcom Lake Coeur dlAlene Pend Oreille Lake Anderson Ranch Res. Deadwood Reservoir Deadwood Reservoir Dworshak Reservoir Payette Lake NF Payette River Lower Granite Warm Lake Warm Lake Wallowa River Wallowa Lake Lake Billy Chinook Link Creek Odell Lake Wizard Falls Hatchery Lake Wenatchee Lake ~enatchee Okanogan River Babine Lake Fish Creek (Alaska)
Year 2 N 1 0 0 6 9 . . .......................
9 1 6 1 . 0 0 0 . O O O 9 2 6 0 1 . 0 0 0 . O O O 9 0 1 7 4 1 . 0 0 0 . O O O 9 2 1 8 1 . 0 0 0 . O O O 9 0 1 4 0 1 . 0 0 0 . O O O 9 1 1 3 8 1 . 0 0 0 . O O O 9 2 1 1 8 1 . 0 0 0 . O O O 9 0 2 4 1 . 0 0 0 . O O O 9 2 7 4 1 . 0 0 0 . o o o 9 3 2 0 . 9 5 0 . 0 5 0 9 4 4 2 1 , 0 0 0 . O O O 9 1 2 1 2 1 . 0 0 0 . o o o 9 2 2 4 1 . 0 0 0 . O O O 9 3 4 0 1 . 0 0 0 . O O O 9 1 - 9 3 2 6 1 . 0 0 0 . O O O 9 2 - 9 3 2 4 1 . 0 0 0 . O O O 9 2 1 1 8 1 . 0 0 0 . O O O 9 2 0 . o o o . o o o 9 3 1 2 1 . 0 0 0 . o o o 9 4 3 4 1 . 0 0 0 . o o o 9 4 1 4 1 . 0 0 0 . O O O 9 2 5 0 1 . 0 0 0 . O O O 9 4 7 2 1 . 0 0 0 . O O O 9 0 1 0 0 1 . 0 0 0 . o o o 9 0 8 0 1 . 0 0 0 . O O O 9 0 9 4 1 . 0 0 0 . o o o 9 0 2 0 1 . 0 0 0 . o o o 9 0 2 6 1 . 0 0 0 - 0 0 0 9 2 1 2 0 1 . 0 0 0 - 0 0 0 9 0 8 4 1 . 0 0 0 . O O O 9 0 9 2 1 . 0 0 0 . O O O 9 2 1 1 8 1 . 0 0 0 . O O O 9 2 3 6 1 . 0 0 0 . O O O 9 0 3 4 1 . 0 0 0 . o o o 9 2 1 1 8 1 . 0 0 0 . O O O 9 2 1 1 4 1 . 0 0 0 . O O O 9 3 7 4 1 . 0 0 0 - 0 0 0 9 2 9 0 1 . 0 0 0 - 0 0 0 9 2 7 6 1 . 0 0 0 - 0 0 0 9 2 1 1 8 1 . 0 0 0 . O O O 9 3 1 6 0 1 . 0 0 0 - 0 0 0 8 7 2 4 0 1 . 0 0 0 . O O O 8 8 2 4 0 1 . 0 0 0 . O O O 9 0 1 0 4 1 . 0 0 0 . O O O 9 0 1 0 0 1 . 0 0 0 . o o o 9 2 7 8 1 . 0 0 0 . O O O

GAPDH- 4 * Year 2N
................................... Alturas L. outmigrant 91 20 Alturas L. spawners 9 2 6 0 Alturus L. trawl 90 19 6 Alturas L. trawl 9 2 8 4 Redfish L. kokanee 9 0 174 Redfish L. kokanee 9 1 13 4 Redfish L. kokanee 9 2 12 0 Redfish L. trawl 9 0 2 4 Redfish L. trawl 9 2 9 4 Redfish L. trawl 9 3 0 Redfish L. trawl 9 4 0 Redfish L. outmigrant 91 2 6 0 Redfish L. outmigrant 92 0 Redfish L. outmigrant 93 0 Redfish L. sockeye 91-93 26 Redfish L. residual 92 -93 28 Stanley L. spawners 9 2 11 8 Stanley L. trawl 9 2 20 Stanley L. trawl 9 3 0 Stanley L. trawl 9 4 0 Stanley L. spawners 9 4 0 Pettit Lake 9 2 5 0 Pettit Lake 9 4 0 Lake Whatcom 9 0 0 Lake Coeur dlAlene 9 0 9 8 Pend Oreille Lake 9 0 12 0 Anderson Ranch Res. 9 0 20 Deadwood Reservoir 9 0 17 6 Deadwood Reservoir 92 120 Dworshak Reservoir 9 0 12 0 Payette Lake 9 0 12 0 NF Payette River 9 2 118 Lower Granite 9 2 3 6 Warm Lake 9 0 0 Warm Lake 9 2 11 2 Wallowa River 9 2 11 8 Wallowa Lake 9 3 7 4 Lake silly Chinook 9 2 96 Link Creek 9 2 9 8 Odell Lake 9 2 12 0 Wizard Falls Hatchery 93 0 Lake Wenatchee 8 7 240 Lake Wenatchee 8 8 320 Okanogan River 90 12 6 Babine Lake 9 0 11 2 Fish Creek (Alaska) 9 2 8 0
G3 PDH-2 * Year 2N -100 -175
............................................... Alturas L. outmigrant 91 66 1.000 -000 Alturas L. spawners 9 2 60 1.000 .OOO Alturus L. trawl 9 0 200 1.000 .OOO Alturas L. trawl 9 2 84 1.000 .OOO Redfish L. kokanee 9 0 74 1.000 .OOO Redfish L. kokanee 9 1 138 1.000 .OOO Redfish L. kokanee 9 2 120 1.000 .OOO Redfish L. trawl 9 0 24 1.000 .000 Redfish L. trawl 9 2 88 1.000 .OOO Redfish L. trawl 9 3 84 1.000 .OOO ~edfish L. trawl 9 4 46 1.000 .OOO ~edfish L. outmigrant 91 142 1.000 -000 Redfish L. outmigrant 92 34 1.000 -000 Redfish L. outmigrant 93 52 1.000 .OOO Redfish L. sockeye 91-93 26 1.000 .OOO Redfish L. residual 92 -9 3 28 1.000 .OOO Stanley L. spawners 9 2 40 1.000 -000 Stanley L. trawl 9 2 20 1.000 .OOO Stanley L. trawl 9 3 26 1.000 .OOO Stanley L. trawl 9 4 34 1.000 .OOO Stanley L. spawners 9 4 16 -875 -125 Pettit Lake 9 2 50 1.000 .OOO Pettit Lake 9 4 76 1.000 .OOO Lake Whatcom 9 0 120 .983 .017 Lake Coeur dJAlene 9 0 100 1.000 .OOO Pend Oreille Lake 9 0 120 1.000 ,000 Anderson Ranch Res. 9 0 24 1.000 .OOO Deadwood Reservoir 9 0 0 .OOO .OOO Deadwood Reservoir 9 2 120 1.000 -000 Dworshak Reservoir 9 0 112 1.000 .OOO Payette Lake 9 0 120 1.000 .OOO NF Payette River 9 2 120 1.000 .OOO Lower Granite 9 2 36 1.000 .OOO Warm Lake 9 0 116 1.000 .OOO Warm Lake 9 2 120 1.000 .OOO Wallowa River 9 2 120 1.000 -000 Wallowa Lake 9 3 80 1.000 .OOO Lake Billy Chinook 9 2 96 1.000 .OOO Link Creek 9 2 98 1.000 .OOO Odell Lake 9 2 118 1.000 .OOO Wizard Falls Hatchery 93 160 1.000 .OOO Lake Wenatchee 8 7 40 1.000 .OOO Lake Wenatchee 8 8 236 1.000 .OOO Okanogan River 9 0 116 1.000 .OOO Babine Lake 9 0 110 1.000 .OOO Fish Creek (Alaska) 9 2 80 1.000 .OOO
---------- Alturas L. Alturas L. Alturus L. Alturas L. Redfish L. Redfish L. Redfish L. Redfish L. Redfish L. Redfish L. Redfish L. Redfish L.
------------ outmigrant spawners trawl trawl kokanee kokanee kokanee trawl trawl trawl trawl outmigrant
Redfish L. outmigrant Redfish L. outmigrant Redfish L. sockeye Redfish L. residual Stanley L. spawners Stanley L. trawl Stanley L. trawl Stanley L. trawl Stanley L. spawners Pettit Lake Pettit Lake Lake Whatcom Lake Coeur dlAlene Pend Oreille Lake Anderson Ranch Res. Deadwood Reservoir Deadwood Reservoir Dworshak Reservoir
, Payette Lake NF Payette River Lower Granite Warm Lake Warm Lake Wallowa River Wallowa Lake Lake Billy Chinook Link Creek Odell Lake Wizard Falls Hatchery Lake Wenatchee Lake Wenatchee Okanogan River Babine Lake Fish Creek (Alaska)
Year 2N ------------- 9 1 6 6 9 2 6 0 9 0 2 0 0 9 2 8 4 9 0 17 6 9 1 13 8 9 2 120 9 0 24 9 2 8 8 9 3 8 4 9 4 5 0 9 1 274 9 2 3 4 9 3 5 2 91-93 26 92-93 28 9 2 12 0 9 2 20 9 3 26 9 4 34 9 4 16 9 2 5 0 9 4 7 6 9 0 12 0 9 0 100 9 0 12 0 9 0 24 9 0 172 9 2 12 0 9 0 12 0 9 0 12 0 9 2 118 9 2 3 6 9 0 12 0 9 2 120 9 2 120 9 3 78 9 2 96 9 2 9 8 9 2 118 9 3 16 0 8 7 240 8 8 320 9 0 12 6 9 0 12 0 9 2 8 0
GPI -A* Year 2N
................................... Alturas L. outmigrant 91 6 6 Alturas L. spawners 9 2 6 0 Alturus L. trawl 9 0 200 Alturas L. trawl 9 2 8 4 Redfish L. kokanee 9 0 17 6 Redfish L. kokanee 9 1 138 Redfish L. kokanee 9 2 12 0 Redfish L. trawl 9 0 24 Redf ish L . trawl 9 2 8 8 Redfish L. trawl 9 3 8 4 Redfish L. trawl 94 5 0 Redfish L. outmigrant 91 274 Redfish L. outmigrant 92 3 4 Redfish L. outmigrant 93 5 2 Redfish L. sockeye 91-93 2 6 Redfish L. residual 92-93 28 Stanley L. spawners 9 2 12 0 Stanley L. trawl 9 2 20 Stanley L. trawl 9 3 26 Stanley L. trawl 9 4 34 Stanley L. spawners 9 4 16 pettit Lake 9 2 5 0 Pettit Lake 9 4 70 Lake Whatcom 9 0 12 0 Lake Coeur d'Alene 9 0 100 Pend Oreille Lake 9 0 12 0 Anderson Ranch Res. 9 0 2 4 Deadwood Reservoir 9 0 17 0 Deadwood Reservoir 9 2 12 0 Dworshak Reservoir 9 0 12 0 Payette Lake 9 0 12 0 NF Payette River . 92 118 Lower Granite 9 2 36 Warm Lake 9 0 12 0 Warm Lake 9 2 12 0 Wallowa River 9 2 12 0 Wallowa Lake 9 3 7 8 Lake Billy Chinook 9 2 9 6 Link Creek 9 2 9 8 Odell Lake 9 2 118 Wizard Falls Hatchery 93 160 Lake Wenatchee 8 7 240 Lake Wenatchee 8 8 320 Okanogan River 9 0 12 6 Babine Lake 9 0 12 0 Fish Creek (Alaska) 9 2 8 0
...................... Alturas L. outmigrant Alturas L. spawners Alturus L. trawl Alturas L. trawl Redfish L. kokanee Redfish L. kokanee Redfish L. kokanee Redfish L. trawl Redfish L. trawl Redfish L. trawl Redfish L. trawl Redfish L. outmigrant Redfish L. outmigrant Redfish L. outmigrant Redfish L. sockeye Redfish L. residual Stanley L. spawners Stanley L. trawl Stanley L. trawl Stanley L. trawl Stanley L. spawners Pettit Lake Pettit Lake Lake Whatcom Lake Coeur dfAlene Pend Oreille Lake Anderson Ranch Res. Deadwood Reservoir Deadwood Reservoir Dworshak Reservoir Payette Lake NF Payette River Lower Granite Warm Lake Warm Lake Wallowa River Wallowa Lake Lake Billy Chinook Link Creek Odell Lake Wizard Falls Hatchery Lake Wenatchee Lake Wenatchee Okanogan River Babine Lake Fish Creek (Alaska)
Year 2N - ---------
9 1 6 4 9 2 6 0 9 0 1 8 2 9 2 2 0 9 0 1 1 0 9 1 1 3 8 9 2 1 2 0 9 0 2 4 9 2 7 4 9 3 3 2 9 4 4 0 9 1 276 9 2 3 4 9 3 4 8 91-93 2 6 92-93 2 8 9 2 11 8 9 2 0 9 3 1 2 9 4 3 4 9 4 1 2 9 2 5 0 9 4 7 6 9 0 9 8 9 0 1 0 0 90 . 1 2 0 9 0 2 2 9 0 1 0 8 9 2 12 0 9 0 8 0 9 0 1 1 2 9 2 11 8 9 2 2 6 9 0 4 0 9 2 1 2 0 9 2 1 2 0 9 3 7 8 9 2 9 6 9 2 9 8 9 2 1 2 0 9 3 1 6 0 8 7 23 8 8 8 3 1 4 9 0 1 2 2 9 0 1 1 2 9 2 7 6

---------------------- Alturas L. outmigrant Alturas L. spawners Alturus L. trawl Alturas L. trawl ~edfish L. kokanee Redfish L. kokanee Redfish L. kokanee Redfish L. trawl Redf ish L. trawl Redfish L. trawl Redfish L. trawl Redfish L. outmigrant Redfish L. outmigrant Redfish L. outmigrant Redfish L. sockeye Redfish L. residual Stanley L. spawners Stanley L. trawl Stanley L. trawl Stanley L. trawl Stanley L. spawners Pettit Lake Pettit Lake Lake Whatcom Lake Coeur dlAlene Pend Oreille Lake Anderson Ranch Res. Deadwood Reservoir Deadwood Reservoir Dworshak Reservoir Payette Lake NF Payette River Lower Granite Warm Lake Warm Lake Wallowa River Wallowa Lake Lake Billy Chinook Link Creek Odell Lake wizard Falls Hatchery' Lake Wenatchee Lake ~enatchee Okanogan River Babine Lake Fish Creek (Alaska)
Year 2N 100 222 3 3 7 7
9 1 66 1.000 .OOO .OOO -000 9 2 60 1.000 .OOO .OOO .OOO 90 200 1.000 -000 .OOO -000 9 2 84 1.000 .OOO .OOO .000 90 176 1.000 .OOO .OOO .OOO 9 1 138 1.000 -000 .OOO .000 9 2 120 1.000 .ooo .ooo .ooo 9 0 24 1.000 .OOO .OOO .OOO 9 2 86 1.000 .OOO .OOO .OOO 9 3 84 1.000 .OOO .OOO .000 9 4 50 1.000 .OOO .OOO .OOO 9 1 276 1.000 .000 .000 .a00 9 2 34 1.000 .ooo .ooo .ooo 9 3 52 1.000 .000 .000 .OOO 91-93 26 1.000 .OOO .OOO .OOO 92-93 28 1.000 .OOO .OOO .OOO. 9 2 118 1.000 .OOO .OOO .OOO 9 2 20 1.000 -000 .ooo .ooo 9 3 26 1.000 .000 .000 .OOO 9 4 34 1.000 .ooo .ooo .ooo 9 4 16 1.000 .OOO .OOO .OOO 9 2 46 1.000 .OOO .OOO -000 9 4 76 1.000 .OOO .OOO .OOO 9 0 120 .992 .OOO .OOO .008 9 0 100 1.000 .ooo .ooo .ooo 90 120 1.000 .OOO .OOO -000 9 0 24 1.000 .OOO .OOO .OOO 9 0 176 1.000 .OOO .OOO .OOO 9 2 120 1.000 .ooo .ooo .ooo 9 0 120 1.000 .ooo .ooo .ooo 9 0 120 1.000 .ooo .ooo .ooo 9 2 118 1.000 .OOO .OOO .OOO 9 2 36 1.000 .OOO -000 .OOO 9 0 120 1.000 -000 -000 .ooo 9 2 120 1.000 .ooo .ooo .ooo 9 2 120 1.000 .ooo .ooo .ooo 9 3 78 1.000 .OOO .OOO .OOO 9 2 94 1.000 -000 .ooo .ooo 9 2 98 1.000 .OOO .OOO -000 9 2 120 1.000 .ooo .ooo .ooo 9 3 160 .981 .OOO .OOO .019 8 7 240 .871 .OOO .OOO .I29 8 8 320 .875 .OOO .OOO .I25 9 0 126 1.000 .OOO .OOO .OOO 9 0 120 1.000 .ooo .ooo .ooo 9 2 80 1.000 .OOO .OOO .OOO
...................... Alturas L. outmigrant Alturas L. spawners Alturus L. trawl Alturas L. trawl Redfish L. kokanee ~edfish L. kokanee Redfish L. kokanee Redfish L. trawl Redfish L. trawl ~edfish L. trawl Redfish L. trawl Redfish L. outmigrant Redfish L. outmigrant Redfish L. outmigrant Redfish L. sockeye Redfish L. residual Stanley L. spawners Stanley L. trawl Stanley L. trawl Stanley L. trawl Stanley L. spawners Pettit Lake Pettit Lake Lake Whatcom Lake Coeur dlAlene Pend Oreille Lake Anderson Ranch Res. Deadwood Reservoir Deadwood ~eservoir Dworshak Reservoir Payette Lake NF Payette River Lower Granite Warm Lake Warm Lake Wallowa River Wallowa Lake Lake Billy Chinook Link Creek Odell Lake Wizard Falls Hatchery Lake Wenatchee Lake ~enatchee Okanogan River Babine Lake Fish Creek (Alaska)
Year 2N -------------- 9 1 6 6 9 2 6 0 9 0 2 0 0 9 2 8 4 9 0 17 6 9 1 13 8 9 2 12 0 9 0 24 9 2 86 9 3 8 4 9 4 5 2 9 1 276 9 2 3 4 9 3 46 9 1 - 9 3 26 92-93 28 9 2 118 9 2 20 9 3 26 9 4 34 9 4 16 9 2 46 9 4 76 9 0 12 0 9 0 10 0 9 0 12 0 9 0 24 " 9 0 17 6 9 2 12 0 9 0 12 0 9 0 12 0 9 2 118 9 2 3 6 9 0 12 0 9 2 12 0 9 2 12 0 9 3 78 9 2 9 4 92 98 9 2 12 0 9 3 160 8 7 240 8 8 320 9 0 12 6 9 0 120 9 2 8 0
sIDHP-1" Year 2N 100 162 72 138 8 4
. . . . . . . . . . . . . . . . . . . . . . . . . . . . . . . . . . . . . . . . . . . . . . . . . . . . . . . . . . . . . . . . . Alturas L. outmigrant 91 64 1.000 .ooo .ooo .oloo .ooo Alturas L. spawners 9 2 60 1.000 .OOO .OOO .OOO .OOO Alturus L. trawl 90 200 1.000 .OOO .OOO .OOO .OOO Alturas L. trawl 9 2 84 1.000 .OOO .OOO . O O O .OOO Redfish L. kokanee 9 0 176 1.000 .OOO .OOO .OOO .OOO ~edfish L. kokanee 9 1 138 1.000 .OOO .OOO .OOO .OOO Redfish L. kokanee 9 2 120 1.000 .OOO .OOO .OOO .OOO Redfish L. trawl 90 24 1.000 .OOO .OOO .OOO .OOO Redfish L. trawl 9 2 94 1.000 .OOO .OOO .OOO .OOO Redfish L. trawl 9 3 86 1.000 .OOO .OOO .OOO .OOO Redfish L. trawl 9 4 52 1.000 .OOO .OOO .OOO .000 Redfish L. outmigrant 91 270 1.000 .OOO .OOO .OOO .OOO Redfish L. outmigrant 92 34 1.000 .OOO .OOO -000 .OOO Redfish L. outmigrant 93 50 1.000 .OOO .OOO .OOO .OOO Redfish L. sockeye 91-93 26 1.000 .OOO .OOO .OOO .OOO Redfish L. residual 92-93 28 1.000 .OOO .OOO .OOO -000 Stanley L. spawners 9 2 120 1.000 .OOO .OOO -000 .OOO Stanley L. trawl 9 2 20 1.000 .OOO .OOO .OOO .OOO Stanley L. trawl 9 3 26 1.000 .OOO .OOO .OOO .OOO Stanley L. trawl 9 4 34 1.000 .OOO .OOO .OOO .OOO Stanley L. spawners 9 4 16 1.000 .OOO .OOO .OOO .OOO Pettit Lake 9 2 50 1,000 .OOO .OOO .OOO .OOO Pettit Lake 9 4 76 1.000 .OOO .OOO .OOO .OOO Lake Whatcom 9 0 120 1.000 .OOO .OOO .OOO -000 Lake Coeur dlAlene 9 0 100 1.000 .OOO .OOO .OOO .OOO Pend Oreille Lake 9 0 120 .975 .OOO .OOO .025 .OOO Anderson Ranch Res. 9 0 24 1.000 .OOO .OOO .OOO .OOO Deadwood Reservoir 9 0 170 1.000 .OOO .OOO -000 .OOO Deadwood Reservoir 9 2 120 1.000 .OOO -000 -000 .OOO Dworshak Reservoir 9 0 120 1.000 .OOO .OOO .OOO .000 Payette Lake 90 120 1.000 .OOO .OOO .OOO .OOO NF Payette River 9 2 118 1.000 .OOO .OOO .OOO .OOO Lower Granite 9 2 36 1.000 .000 .OOO .000 .Ooo Warm Lake 9 0 120 1.000 .OOO .OOO -000 .OOO Warm Lake 9 2 120 1.000 .OOO .OOO .OOO .OOO Wallowa River 9 2 120 1.000 .OOO .OOO -000 .000 Wallowa Lake 9 3 78 1.000 .OOO .OOO .OOO .OOO Lake Billy Chinook 9 2 96 1.000 .OOO .OOO .OOO .OOO Link Creek 9 2 98 1.000 .OOO .OOO .OOO .OOO Odell Lake 9 2 120 1.000 .OOO .OOO .OOO .OOO Wizard Falls Hatchery 93 160 1.000 .OOO .OOO .OOO .OOO Lake Wenatchee 8 7 238 1.000 .OOO .OOO .OOO -000 Lake ~enatchee 8 8 316 1.000 .OOO .OOO .OOO .OOO Okanogan River 90 126 1.000 .OOO .OOO .OOO .OOO Babine Lake 9 0 120 1.000 .OOO .OOO .OOO .OOO Fish Creek (Alaska) 9 2 80 1.000 .OOO .OOO .OOO .OOO
---------------------- Alturas L. outmigrant Alturas L. spawners Alturus L. trawl Alturas L. trawl Redfish L. kokanee Redfish L. kokanee Redfish L. kokanee Redfish L. trawl ~edfish L. trawl Redfish L. trawl Redfish L. trawl Redfish L. outmigrant Redfish L. outmigrant ~edfish L. outmigrant Redfish L. sockeye Redfish L. residual Stanley L. spawners Stanley L. trawl Stanley L. trawl Stanley L. trawl Stanley L. spawners Pettit Lake Pettit Lake Lake Whatcom Lake Coeur dlAlene Pend Oreille Lake Anderson Ranch Res. Deadwood Reservoir Deadwood Reservoir Dworshak Reservoir Payette Lake NF Payette River Lower Granite Warm Lake Warm Lake Wallowa River Wallowa Lake Lake Billy Chinook Link Creek Odell Lake Wizard Falls Hatchery Lake Wenatchee Lake Wenatchee Okanogan River Babine Lake Fish Creek (Alaska)
Year 2N -100 --------------------- 9 1 15 1.000 9 2 30 1.000 9 0 99 1.000 9 2 42 1.000 9 0 85 1.000 9 1 79 1.000 9 2 60 1.000 9 0 12 1.000 9 2 44 1.000 9 3 42 1.000 9 4 25 1.000 9 1 136 1.000 9 2 17 1.000 9 3 26 1.000 91-93 9 1.000 92-93 14 1.000 9 2 59 1.000 9 2 10 1.000 9 3 13 1.000 9 4 17 1.000 9 4 8 .875 9 2 25 1.000 9 4 38 1.000 9 0 56 1.000 9 0 50 1.000 9 0 60 1.000 9 0 12 1.000 9 0 70 1.000 9 2 60 1.000 9 0 60 1.000 9 0 56 1.000 9 2 59 1.000 9 2 18 1.000 9 0 56 1.000 9 2 60 1.000 9 2 60 1.000 93 ' 39 1.000 9 2 48 1.000 9 2 47 1.000 9 2 59 1.000 9 3 80 .938 8 7 113 1.000 8 8 154 1.000 9 0 59 1.000 9 0 58 1.000 9 2 40 1.000

- - - - - - - Alturas Alturas A1 turus Alturas ~ e d f ish Redf ish Redf ish ~ e d f ish ~ e d f i sh Redf ish Redf ish Redf ish
outmigrant spawners trawl trawl kokanee kokane e kokanee trawl trawl trawl trawl outmigrant
~edfish L. outmigrant Redfish L. outmigrant Redfish L. sockeye Redfish L. residual Stanley L. spawners Stanley L. trawl Stanley L. trawl Stanley L. trawl Stanley L. spawners Pettit Lake Pettit Lake Lake Whatcom Lake Coeur dJAlene Pend Oreille Lake Anderson Ranch Res. Deadwood Reservoir Deadwood Reservoir Dworshak Reservoir Payette Lake NF Payette River Lower Granite Warm Lake Warm Lake Wallowa River Wallowa Lake Lake Billy Chinook Link Creek Odell Lake Wizard Falls Hatchery Lake Wenatchee Lake Wenatchee Okanogan River Babine Lake Fish Creek (Alaska)
Year 2N 100 123 152 5 2
9 1 56 1.000 .OOO -000 .000 9 2 60 1.000 .OOO .OOO -000 9 0 200 1.000 .ooo .ooo .ooo 9 2 84 1.000 .OOO .OOO .OOO 9 0 176 1.000 .OOO .OOO .OOO 9 1 138 1.000 .OOO .OOO .000 9 2 120 1.000 .ooo .ooo .ooo 90 24 1.000 -000 -000 .OOO 9 2 94 1.000 .ooo .ooo .ooo 9 3 86 1.000 .OOO .OOO .OOO 9 4 52 1.000 .OOO .OOO .a00 9 1 260 1.000 -000 .OOO .000 9 2 34 1.000 .ooo .ooo .000 9 3 52 1.000 .OOO .OOO .000 9 1 - 9 3 26 1.000 .OOO .OOO .000 92-93 28 1.000 .OOO .OOO .OOO 9 2 120 1.000 .ooo .ooo .000 9 2 20 1.000 .ooo .ooo .000 9 3 26 1.000 .OOO .OOO .OOO 9 4 34 1.000 .ooo .ooo .ooo 9 4 16 1.000 .OOO .OOO .a00 9 2 50 1.000 .OOO .OOO .OOO 9 4 76 1.000 .OOO -000 .OOO 9 0 120 .992 .OOO -000 .008 9 0 100 .970 .030 .OOO .OOO 9 0 120 .992 .008 .OOO .OOO 9 0 22 1.000 .ooo .ooo .ooo 9 0 176 1.000 -000 -000 .OOO 9 2 120 1.000 .ooo .ooo .ooo 9 0 120 1.000 .ooo .ooo -000 9 0 120 1.000 .ooo .ooo .ooo 9 2 118 1.000 .OOO .OOO .OOO 9 2 36 1.000 .OOO .OOO .OOO 9 0 120 1.000 .ooo .ooo .ooo 9 2 120 1.000 .ooo -000 .ooo 9 2 120 1.000 .ooo .ooo .ooo 9 3 78 1.000 .OOO .OOO .OOO 9 2 96 1.000 .OOO .OOO .OOO 9 2 98 1.000 .OOO .OOO .OOO 9 2 120 -992 .008 .OOO .OOO 9 3 160 1.000 .OOO -000 .OOO 8 7 240 1.000 .OOO .OOO .OOO 8 8 320 1.000 .OOO .OOO .OOO 9 0 126 1.000 .OOO .OOO .OOO 9 0 116 1.000 .OOO .OOO .OOO 9 2 80 1:OOO .OOO .OOO .OOO
LDH-B2 * Year 2N 10 0
........................................... Alturas L. outmigrant 91 66 1.000 Alturas L. spawners 9 2 60 1.000 Alturus L. trawl 9 0 190 1.000 Alturas L. trawl 9 2 84 1.000 Redfish L. kokanee 9 0 176 1.000 Redfish L. kokanee 9 1 138 1.000 ~edfish L. kokanee 9 2 120 1.000 Redfish L. trawl 9 0 24 1.000 Redfish L. trawl 9 2 88 1.000 Redfish L. trawl 9 3 86 1.000 Redfish L. trawl 9 4 52 1.000 Redfish L. outmigrant 91 276 1.000 Redfish L. outmigrant 92 34 1.000 Redfish L. outmigrant 93 52 1.000 Redfish L. sockeye 91-93 26 1.000 Redfish L. residual' 92-93 28 1.000 Stanley L. spawners 9 2 116 1.000 Stanley L. trawl 9 2 20 1.000 Stanley L. trawl 9 3 26 1.000 Stanley L. trawl 9 4 34 1.000 Stanley L. spawners 9 4 16 1.000 Pettit Lake 9 2 50 1.000 Pettit Lake 9 4 76 1.000 Lake Whatcom 9 0 120 1.000 Lake Coeur dlAlene 9 0 100 1.000 Pend Oreille Lake 9 0 120 1.000 Anderson Ranch Res. 9 0 24 1.000 Deadwood Reservoir 9 0 170 1.000 De,adwood Reservoir 9 2 120 1.000 Dworshak Reservoir 9 0 120 1.000 Payette Lake 9 0 120 1.000 NF Payette River 9 2 118 1.000 Lower Granite 9 2 36 1.000 Warm Lake 9 0 120 1.000 Warm Lake 9 2 120 1.000 Wallowa River 9 2 120 .983 Wallowa Lake 9 3 78 .987 Lake Billy Chinook 9 2 96 1.000 Link Creek 9 2 98 1.000 Odell Lake 9 2 120 .975 Wizard Falls Hatchery 93 160 1.000 Lake Wenatchee 8 7 240 1.000 Lake ~enatchee , 88 314 1.000 Okanogan River 9 0 126 1.000 Babine Lake 9 0 120 1.000 Fish Creek (Alaska) 9 2 80 ,913
LDH-C*
- - - - - - - - - - - Alturas L. Alturas L. Alturus L. Alturas L. Redfish L. Redfish L. Redfish L. Redfish L. Redfish L. Redfish L. Redfish L. Redfish L.
-- outmigrant spawners trawl trawl kokanee kokanee kokanee trawl trawl trawl trawl outmigrant
Redfish L. outmigrant ~edfish L. outmigrant Redfish L. sockeye Redfish L. residual Stanley L. spawners Stanley L. trawl Stanley L. trawl Stanley L. trawl Stanley L. spawners Pettit Lake Pettit Lake Lake Whatcom Lake Coeur d'Alene Pend Oreille Lake Anderson Ranch Res. Deadwood Reservoir Deadwood Reservoir Dworshak ~eservoir Payette Lake NF Payette River Lower Granite Warm Lake Warm Lake Wallowa River Wallowa Lake Lake Billy Chinook Link Creek Odell Lake Wizard Falls Hatchery Lake Wenatchee Lake Wenatchee Okanogan River Babine Lake Fish Creek (Alaska)
Year 2N . - - - - - - - - - - - - - 9 1 2 0 9 2 6 0 9 0 2 0 0 9 2 8 2 9 0 17 6 9 1 13 2 9 2 12 0 90 2 2 9 2 9 4 9 3 8 2 9 4 4 8 9 1 260 9 2 3 2 9 3 4 8 91-93 2 6 92-93 2 8 9 2 11 8 9 2 20 9 3 2 4 9 4 3 2 9 4 14 9 2 5 0 9 4 7 4 9 0 12 0 9 0 9 6 9 0 12 0 9 0 2 2 9 0 176 9 2 12 0 9 0 12 0 9 0 12 0 9 2 11 8 9 2 36 9 0 12 0 9 2 11 8 9 2 118 9 3 7 4 9 2 9 6 9 2 98 9 2 120 9 3 16 0 8 7 2 4 0 88 . 3 2 0 9 0 12 6 9 0 11 4 9 2 8 0

sMDH-A2 * Year 2N 100 6 4 46 147 11
----------------------------------------------------------------- Alturas L. outmigrant 91 66 1.000 .OOO .OOO .000 .000 Alturas L. spawners 9 2 60 1.000 .oOO .000 .ooo .ooo Alturus L. trawl 9 0 200 1.000 .ooo -000 .ooo .ooo Alturas L. trawl 9 2 84 1.000 .OOO .OOO .OOO .OOO Redfish L. kokanee 90 176 .994 .OOO .OOO .006 .OOO Redfish L. kokanee 9 1 138 1.000 .OOO .OOO .OOO .OOO Redfish L. kokanee 9 2 120 1.000 .OOO .OOO .OOO .OOO Redf ish L. trawl 9 0 24 1.000 -000 .OOO .OOO .OOO Redfish L. trawl 9 2 94 1.000 .OOO .OOO .OOO .OOO Redf ish L . trawl 9 3 86 1.000 -000 .OOO .OOO .OOO Redfish L. trawl 9 4 52 1.000 .OOO .OOO .OOO .OOO ~edfish L. outmigrant 91 276 1.000 .ooO .Ooo .ooo .ooo Redfish L. outmigrant 92 34 1.000 .OOO .OOO .OOO .OOO Redfish L. outmigrant 93 52 1.000 .OOO .OOO .OOO -000 Redfish L. sockeye 91-93 26 1.000 .OOO .OOO . O O O .OOO Redfish L. residual 92-93 28 1.000 .OOO .OOO .OOO .OOO Stanley L. spawners 9 2 118 1.000 -000 .OOO .OOO -000 Stanley L. trawl 9 2 20 1.000 .OOO .OOO -000 .OOO Stanley L. trawl 9 3 26 1.000 .OOO .OOO -000 -000 Stanley L. trawl 9 4 34 1.000 .OOO .OOO .OOO .OOO Stanley L. spawners 9 4 16 1.000 .OOO .OOO .OOO .OOO Pettit Lake 9 2 50 1,000 .OOO .OOO .OOO .OOO Pettit Lake 9 4 76 1.000 .OOO .OOO .OOO .OOO Lake Whatcom 9 0 120 1.000 .OOO .OOO -000 .OOO Lake Coeur dlAlene 9 0 100 1.000 .OOO .OOO -000 .OOO Pend Oreille Lake 9 0 120 1.000 .OOO .OOO -000 .OOO Anderson Ranch Res. 90 24 1.000 .OOO .OOO .OO O .OOO Deadwood Reservoir 9 0 176 1.000 .OOO .OOO .OlOO .OOO Deadwood Reservoir 9 2 120 1.000 .OOO .OOO .OD0 .OOO Dworshak Reservoir 9 0 120 1.000 .OOO .OOO .000 .OOO Payette Lake 9 0 120 1.000 -000 .OOO .000 .OOO NF Payette River 9 2 118 1.000 .OOO .OOO .OOO -000 Lower Granite 9 2 36 1.000 .OOO -000 .000 .OOO Warm Lake 9 0 120 1.000 .OOO ,000 .OD0 -000 Warm Lake 9 2 120 1.000 .OOO .OOO -000 .OOO Wallowa River 9 2 120 1.000 -000 -000 .OOO .OOO Wallowa Lake 9 3 78 1.000 .OOO .OOO .OOO .OOO Lake Billy Chinook 9 2 96 1.000 .OOO .OOO .OOO .OOO Link Creek 92 98 .969 .OOO .OOO .OOO .031 Odell Lake 9 2 120 1.000 .OOO .OOO .OOO .OOO Wizard Falls Hatchery 93 160 .994 .OOO .OOO .OOO .006 Lake Wenatchee 8 7 240 1.000 -000 .OOO .OOO .OOO Lake Wenatchee 8 8 320 1.000 .OOO .OOO .OOO .OOO Okanogan River 90 126 1.000 .OOO .OOO -000 .OOO Babine Lake 9 0 120 1.000 .OOO .OOO .OOO .OOO Fish Creek (Alaska) 9 2 80 .988 .OOO .OOO .013 .OOO

sMDH-B2 * Year 2N
................................... Alturas L. outmigrant 91 6 6 Alturas L. spawners 9 2 6 0 Alturus L. trawl 9 0 200 Alturas L. trawl 9 2 8 4 Redfish L. kokanee 9 0 17 6 ~ e d f ish L . kokanee 9 1 13 8 Redfish L. kokanee 9 2 120 ~edfish L. trawl 9 0 2 4 Redfish L. trawl 9 2 9 4 ~edfish L. trawl 9 3 8 6 Redfish L. trawl 9 4 5 2 Redfish L. outmigrant 91 276 Redfish L. outmigrant 92 34 Redfish L. outmigrant 93 5 2 ~edfish L. sockeye 91-93 26 Redfish L. residual 92-93 28 Stanley L. spawners 9 2 120 Stanley L. trawl 9 2 2 0 Stanley L. trawl 9 3 26 Stanley L. trawl 9 4 34 Stanley L. spawners 9 4 16 Pettit Lake 9 2 5 0 Pettit Lake 9 4 76 Lake Whatcom 9 0 12 0 Lake Coeur dlAlene 9 0 100 Pend Oreille Lake 9 0 12 0 Anderson Ranch Res. 9 0 2 4 Deadwood ~eservoir 9 0 17 6 Deadwood Reservoir 9 2 12 0 Dworshak Reservoir 9 0 12 0 Payette Lake 9 0 12 0 NF Payette River 9 2 118 Lower Granite 9 2 3 6 Warm Lake 9 0 120 Warm Lake 9 2 12 0 Wallowa River 9 2 12 0 Wallowa Lake 9 3 7 8 Lake Billy Chinook 9 2 96 Link Creek 9 2 9 8 Odell Lake 9 2 120 Wizard Falls Hatchery 93 160 Lake Wenatchee 8 7 240 Lake Wenatchee 8 8 320 Okanogan River 9 0 126 Babine Lake 9 0 12 0 Fish Creek (Alaska) 9 2 80
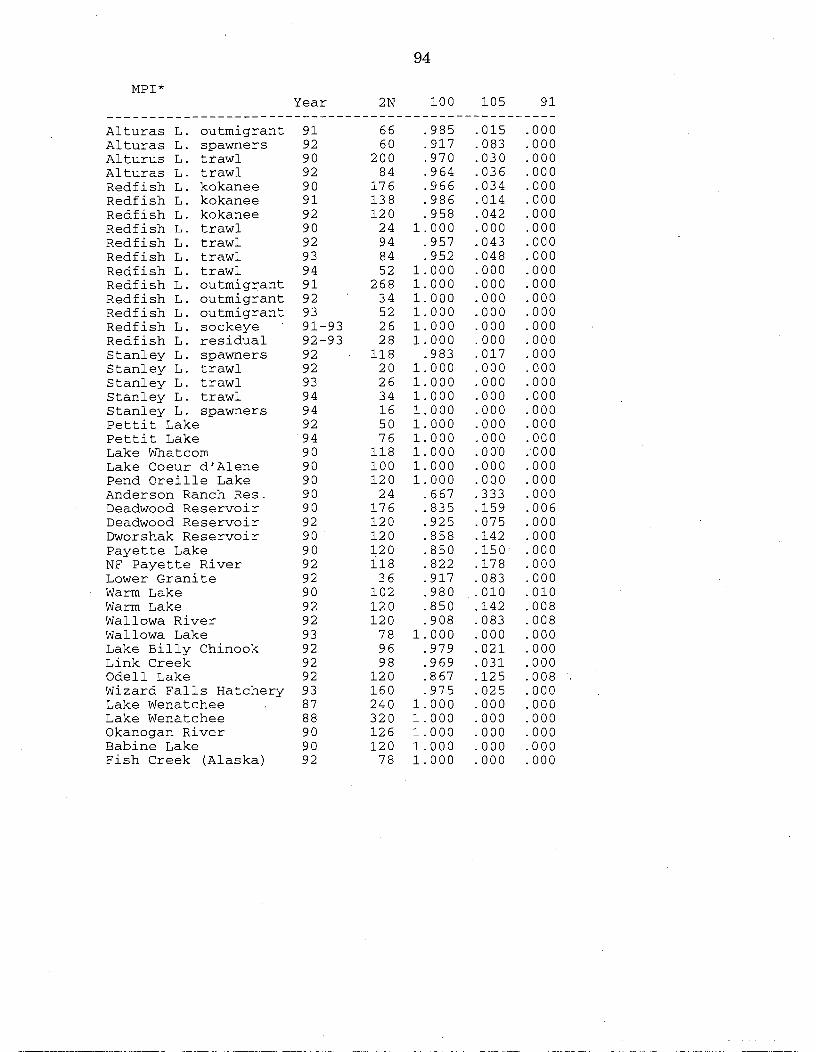
MPI * Year 2N 100
. . . . . . . . . . . . . . . . . . . . . . . . . . . . . . . . . . . . . . . . . . Alturas L. outmigrant 91 66 .985 Alturas L. spawners 9 2 60 .917 Alturus L. trawl 9 0 200 .970 Alturas L. trawl 9 2 84 .964 Redfish L. kokanee 9 0 176 .966 Redfish L. kokanee 9 1 138 .986 Redfish L. kokanee 9 2 120 -958 ~ e d f ish L. trawl 9 0 24 1.000 Redfish L . trawl 9 2 94 .957 Redfish L. trawl 9 3 84 .952 Redf ish L. trawl 9 4 52 1.000 Redfish L. outmigrant 91 268 1.000 ~edfish L. outmigrant 92 34 1.000 Redfish L. outmigrant 93 52 1.000 Redfish L. sockeye 91-93 26 1.000 Redfish L. residual 92-93 28 1.000 Stanley L. spawners 9 2 118 .983 Stanley L. trawl 9 2 20 1.000 Stanley L. trawl 9 3 26 1.000 Stanley L. trawl 9 4 34 1.000 Stanley L. spawners 9 4 16 1.000 Pettit Lake 9 2 50 1.000 Pettit Lake 9 4 76 1.000 Lake Whatcorn 9 0 118 1.000 Lake Coeur d'Alene 9 0 100 1.000 Pend Oreille Lake 9 0 120 1.000 Anderson Ranch Res. 9 0 24 -667 Deadwood Reservoir 9 0 176 .835 Deadwood Reservoir 9 2 120 .925 Dworshak Reservoir 9 0 120 .858 Payette Lake 9 0 120 .850 NF Payette River 9 2 118 -822 Lower Granite 9 2 36 .917 Warm Lake 9 0 102 .980 Warm Lake 9 2 120 .850 Wallowa River 9 2 120 .908 Wallowa Lake 9 3 78 1.000 Lake Billy Chinook 9 2 96 .979 Link Creek 9 2 98 .969 Odell Lake 9 2 120 .867 Wizard Falls Hatchery 93 160 .975 Lake Wenatchee 8 7 240 1.000 Lake Wenatchee 8 8 320 1.000 Okanogan River 9 0 126 1.000 Babine Lake 9 0 120 1.000 Fish Creek (Alaska) 9 2 78 1.000
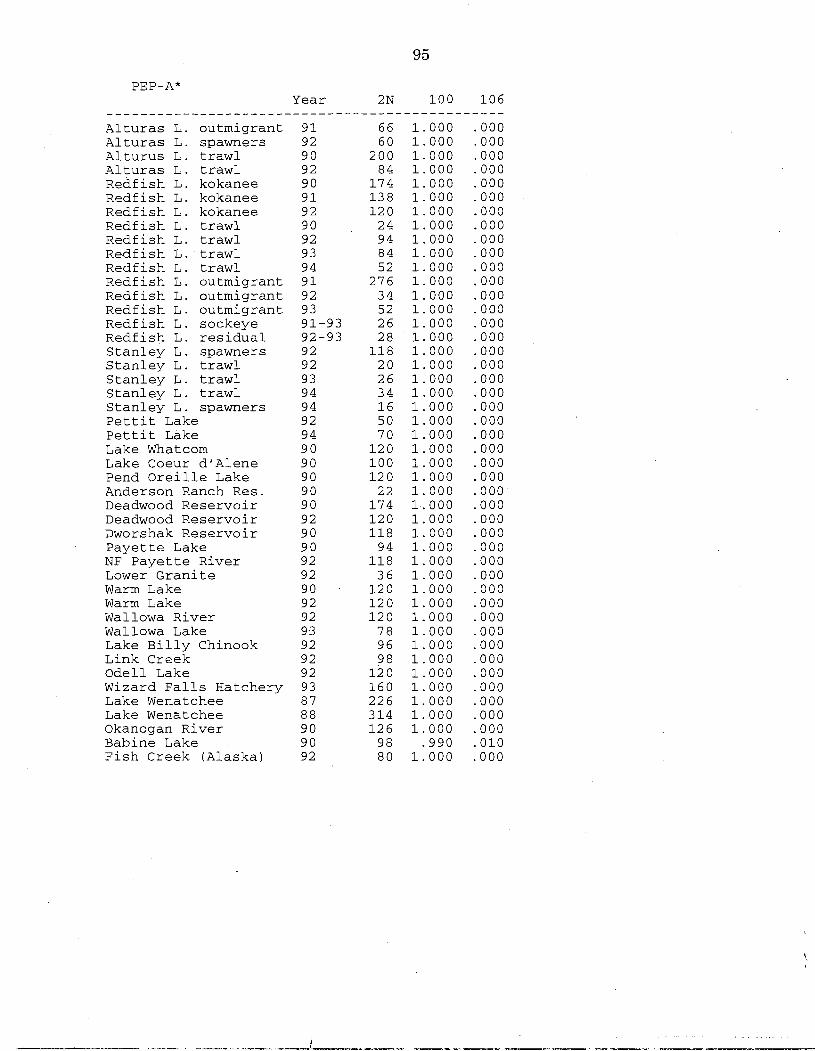
PEP-A*
. . . . . . . . . . . . . . . . . . . . . . Alturas L. outmigrant Alturas L. spawners Alturus L. trawl Alturas L. trawl Redfish L. kokanee ~edfish L. kokanee Redfish L. kokanee Redfish L. trawl Redfish L. trawl Redfish L.traw1 Redfish L. trawl Redfish L. outmigrant Redfish L. outmigrant Redfish L. outmigrant Redfish L. sockeye Redfish L. residual Stanley L. spawners Stanley L. trawl Stanley L. trawl Stanley L. trawl Stanley L. spawners Pettit Lake Pettit Lake Lake Whatcom Lake Coeur dlAlene Pend Oreille Lake Anderson Ranch Res. Deadwood Reservoir Deadwood Reservoir Dworshak Reservoir Payette Lake NF Payette River Lower Granite Warm Lake Warm Lake Wallowa River Wallowa Lake Lake Billy Chinook Link Creek Ode11 Lake Wizard Falls Hatchery Lake Wenatchee Lake Wenatchee Okanogan River Babine Lake Fish Creek (Alaska)
Year 2N 100 106
9 1 66 1.000 .OOO 9 2 60 1.000 .OOO 9 0 200 1.000 .ooo 9 2 84 1.000 .OOO 9 0 174 1.000 .OOO 9 1 138 1.000 .OOO 9 2 120 1.000 .ooo 9 0 24 1.000 .OOO 9 2 94 1.000 -000 9 3 84 1.000 .OOO 9 4 52 1.000 .OOO 9 1 276 1.000 .OOO 9 2 34 1.000 .ooo 9 3 52 1.000 .OOO 91-93 26 1.000 .OOO 92-93 28 ' 1.000 .OOO 9 2 118 1.000 .OOO 9 2 20 1.000 .ooo 9 3 26 1.000 .OOO 9 4 34 1.000 -000 9 4 16 1.000 -000 9 2 50 1.000 .OOO 9 4 70 1.000 .OOO 90 120 1.000 .OOO 9 0 100 1.000 -000 9 0 120 1.000 .ooo 9 0 22 1.000 .ooo 9 0 174 1.000 .OOO 9 2 120 1,000 .ooo 9 0 118 1.000 .OOO 90 94 1.000 .OOO 9 2 118 1.000 .OOO 9 2 36 1.000 .OOO 90 . 120 1.000 .OOO 9 2 120 1.000 .ooo 9 2 120 1.000 .ooo 9 3 78 1.000 -000 9 2 96 1.000 .OOO 9 2 98 1.000 .OOO 9 2 120 1.000 .ooo 9 3 160 1.000 .OOO 8 7 226 1.000 .OOO 8 8 314 1.000 .OOO 9 0 126 1.000 .OOO 9 0 98 -990 .010 9 2 80 1.000 .OOO

PEP-C* Year 2N
................................... Alturas L. outmigrant 91 2 0 Alturas L. spawners 9 2 6 0 Alturus L. trawl 9 0 2 0 0 Alturas L. trawl 9 2 8 4 Redfish L. kokanee 9 0 17 6 ~edfish L. kokanee 91 132 ~edfish L. kokanee 9 2 11 4 Redfish L. trawl 9 0 2 4 Redfish L. trawl 9 2 9 4 Redfish L. trawl 9 3 76 Redfish L. trawl 9 4 2 8 Redfish L. outmigrant 91 258 Redfish L. outmigrant 92 3 2 Redfish L. outmigrant 93 5 2 Redfish L. sockeye 91-93 26 Redfish L. residual 92-93 28 Stanley L. spawners 9 2 118 Stanley L. trawl 9 2 20 Stanley L. trawl 9 3 20 Stanley L. trawl 9 4 3 2 Stanley L. spawners 9 4 14 Pettit Lake 9 2 5 0 Pettit Lake 9 4 7 4 Lake Whatcom 9 0 116 Lake Coeur dlAlene 9 0 9 8 Pend Oreille Lake 9 0 12 0 Anderson Ranch Res. 90 2 2 Deadwood Reservoir 90 17 6 Deadwood Reservoir 9 2 12 0 Dworshak Reservoir 90 118 Payette Lake 9 0 12 0 NF Payette River 9 2 118 Lower Granite 9 2 3 6 Warm Lake 9 0 12 0 Warm Lake 9 2 12 0 Wallowa River 9 2 11 8 Wallowa Lake 9 3 7 4 Lake Billy Chinook 9 2 9 6 Link Creek 9 2 9 8 Odell Lake 9 2 12 0 Wizard Falls Hatchery 93 15 8 Lake Wenatchee 8 7 182 Lake Wenatchee 8 8 116 Okanogan River 9 0 116 Babine Lake 9 0 116 Fish Creek (Alaska) 9 2 8 0
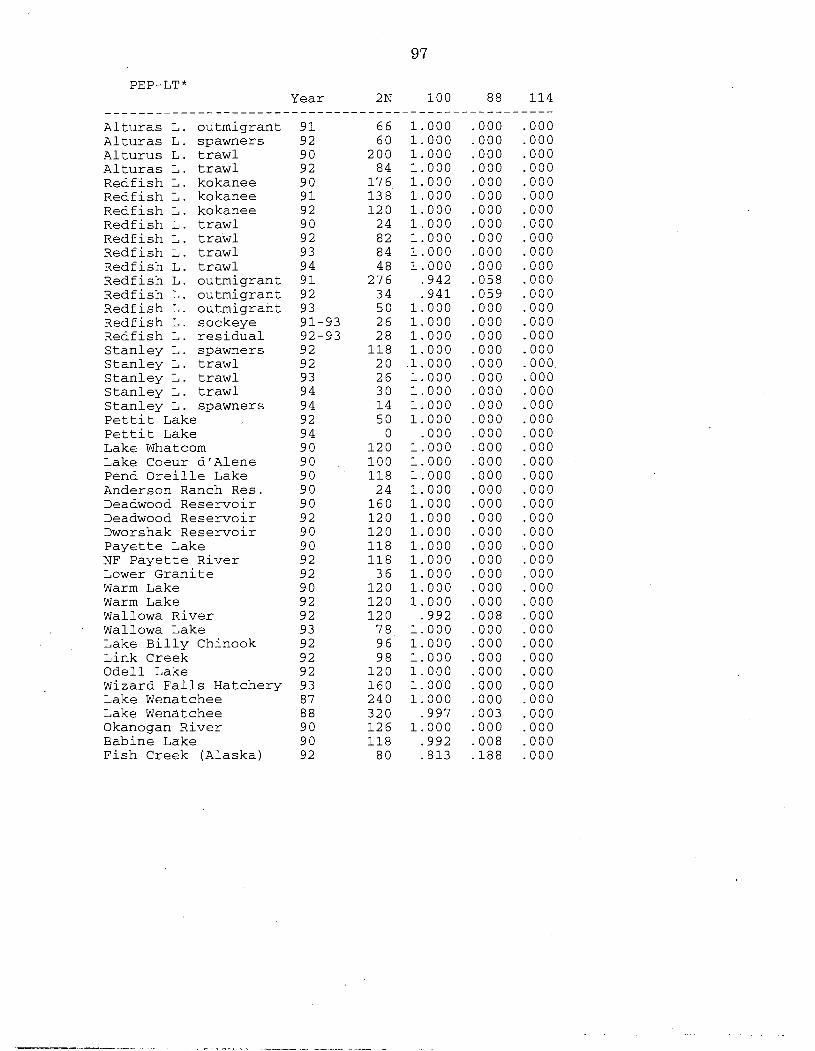
PEP-LT*
...................... Alturas L. outmigrant Alturas L. spawners Alturus L. trawl Alturas L. trawl Redfish L. kokanee Redfish L. kokanee Redfish L. kokanee Redfish L. trawl Redfish L. trawl Redfish L. trawl Redfish L. trawl Redfish L. outmigrant Redfish L. outmigrant Redfish L. outmigrant Redfish L. sockeye Redfish L. residual Stanley L. spawners Stanley L. trawl Stanley L. trawl Stanley L. trawl Stanley L. spawners pettit Lake Pettit Lake Lake Whatcom Lake Coeur d'Alene Pend ~reille Lake Anderson Ranch Res. Deadwood Reservoir Deadwood Reservoir Dworshak Reservoir Payette Lake NF Payette River Lower Granite Warm Lake Warm Lake Wallowa River Wallowa Lake Lake Billy Chinook Link Creek Odell Lake Wizard Falls Hatchery Lake Wenatchee Lake Wenatchee Okanogan River Babine Lake Fish Creek (Alaska)
Year 2 N -------------
9 1 6 6 9 2 6 0 9 0 200 9 2 8 4 9 0 17 6 9 1 13 8 9 2 12 0 9 0 2 4 9 2 8 2 9 3 8 4 9 4 4 8 9 1 27 6 9 2 34 9 3 5 0 91-93 2 6 92-93 2 8 9 2 11 8 9 2 20 9 3 2 6 9 4 30 9 4 14 9 2 5 0 9 4 0 9 0 120 9 0 100 9 0 118 9 0 2 4 9 0 160 9 2 12 0 9 0 12 0 9 0 118 9 2 118 9 2 3 6 9 0 12 0 9 2 12 0 9 2 12 0 9 3 78 9 2 96 9 2 9 8 9 2 12 0 9 3 16 0 8 7 240 8 8 320 9 0 12 6 9 0 11 8 9 2 8 0
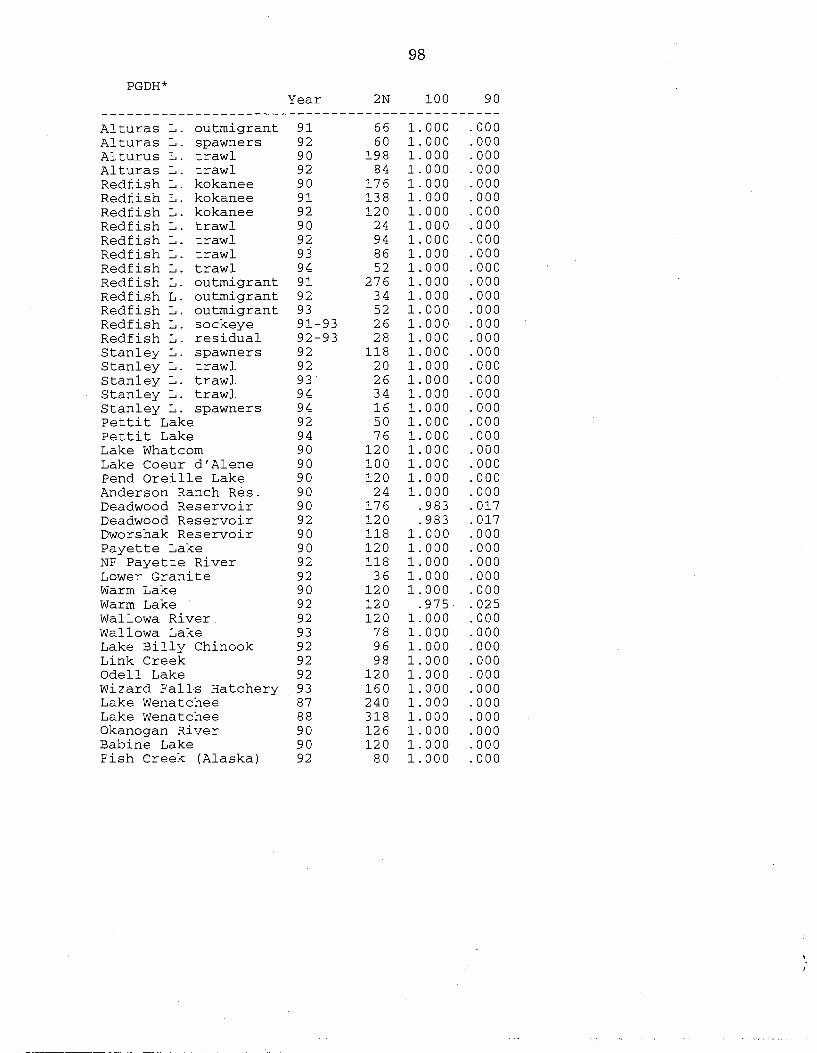
PGDH*
-----------
Alturas L. Alturas L. Alturus L. Alturas L. Redfish L. Redfish L. Redfish L. Redfish L. Redfish L. Redfish L. Redfish L. Redfish L.
. - - - - - - - - - - outmigrant spawners trawl trawl kokanee kokanee ko kane e trawl trawl trawl trawl outmigrant
Redfish L. outmigrant Redfish L. outmigrant Redfish L. sockeye Redfish L. residual Stanley L. spawners Stanley L. trawl Stanley L. trawl Stanley L. trawl Stanley L. spawners pettit Lake pettit Lake Lake Whatcom Lake Coeur dlAlene Pend Oreille Lake Anderson Ranch Res. Deadwood Reservoir Deadwood Reservoir Dworshak Reservoir Payette Lake NF Payette River Lower Granite Warm Lake Warm Lake Wallowa River Wallowa Lake Lake Billy Chinook Link Creek Odell Lake Wizard Falls Hatchery Lake Wenatchee Lake Wenatchee Okanogan River Babine Lake Fish Creek (Alaska)
Year 2N 100 9 0 .......................... 9 1 66 1.000 .OOO 9 2 60 1.000 .OOO 9 0 198 1.000 .OOO 9 2 84 1.000 -000 9 0 176 1.000 .OOO 9 1 138 1.000 .OOO 9 2 120 1.000 .ooo 9 0 24 1.000 ,000 9 2 94 1.000 .ooo 9 3 86 1.000 .OOO 9 4 52 1.000 .OOO 9 1 276 1.000 .OOO 9 2 34 1.000 .ooo 9 3 52 1.000 .OOO 91-93 26 1.000 .OOO 92-93 28 1.000 .OOO 9 2 118 1.000 .OOO 9 2 20 1.000 -000 9 3 26 1.000 .OOO 9 4 34 1.000 .ooo 9 4 16 1.000 .OOO 9 2 50 1.000 .OOO 9 4 76 1.000 .OOO 9 0 120 1.000 .ooo 9 0 100 1.000 -000 9 0 120 1.000 .ooo 9 0 24 1.000 -000 9 0 176 .983 -017 9 2 120 .983 .017 9 0 118 1.000 .OOO 9 0 120 1.000 .ooo 9 2 118 1.000 .OOO 9 2 36 1.000 .OOO 9 0 120 1.000 .ooo 9 2 120 -975 .025 9 2 120 1.000 .ooo 9 3 78 1.000 .OOO 9 2 96 1.000 .OOO 9 2 98 1.000 -000 9 2 120 1.000 .ooo 9 3 160 1.000 .OOO 8 7 240 1.000 .OOO 8 8 318 1.000 .OOO 9 0 126 1.000 -000 9 0 120 1.000 .ooo 9 2 80 1.000 .OOO
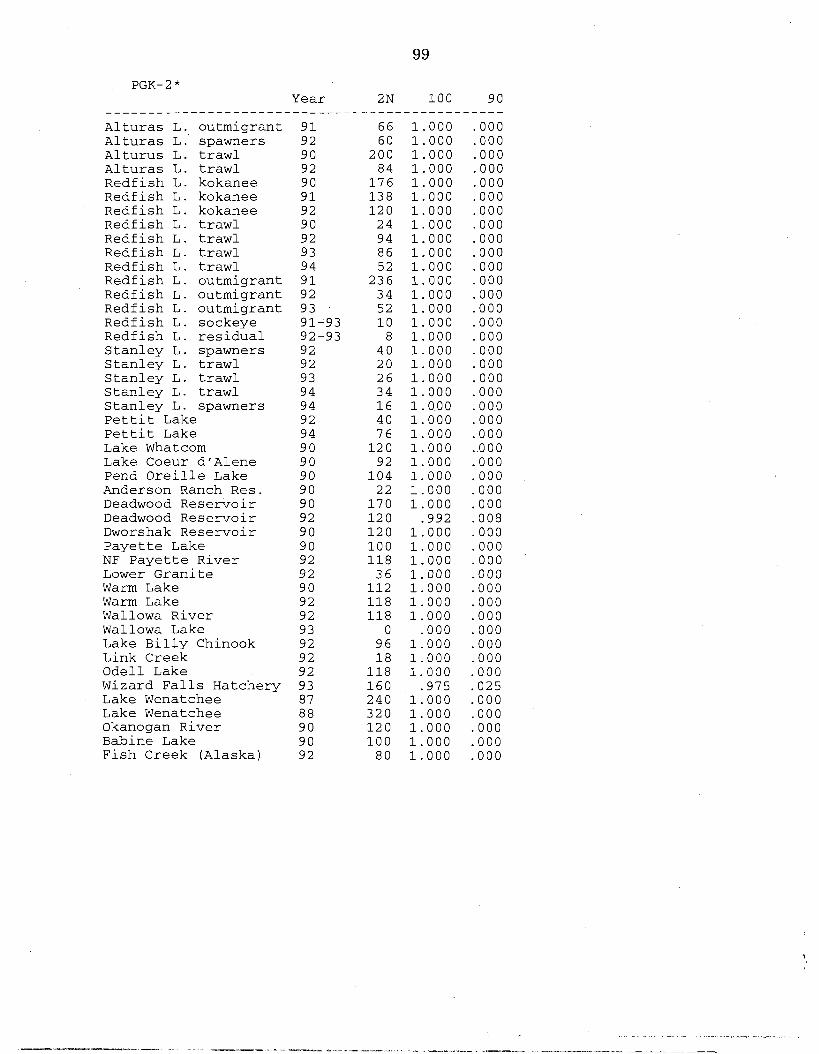
PGK- 2 *
----------
Alturas L. Alturas L. Alturus L. Alturas L. Redfish L. Redfish L. Redfish L. ~edfish L. Redfish L. Redfish L. Redfish L. Redfish L.
Year 2N .........................
outmigrant 9 1 spawners 9 2 trawl 9 0 trawl 9 2 kokanee 9 0 kokanee 9 1 kokanee 9 2 trawl 9 0 trawl 9 2 trawl 9 3 trawl 9 4 outmigrant 9 1
Redfish L. outmigrant 9 2 3 4 Redfish L. outmigrant 93 5 2 Redfish L. sockeye 91-93 1 0 Redfish L. residual 92-93 8 Stanley L. spawners 9 2 40 Stanley L. trawl 9 2 2 0 Stanley L. trawl 9 3 2 6 Stanley L. trawl 9 4 3 4 Stanley L. spawners 9 4 1 6 Pettit Lake 9 2 4 0 pettit Lake 9 4 7 6 Lake Whatcom 9 0 1 2 0 Lake Coeur dlAlene 9 0 9 2 Pend Oreille Lake 9 0 1 0 4 Anderson Ranch Res. 9 0 2 2 Deadwood Reservoir 9 0 1 7 0 Deadwood Reservoir 9 2 1 2 0 Dworshak Reservoir 9 0 1 2 0 Payette Lake 9 0 1 0 0 NF Payette River 9 2 11 8 Lower Granite 9 2 3 6 Warm Lake 9 0 1 1 2 Warm Lake 9 2 1 1 8 Wallowa River 9 2 11 8 Wallowa Lake 9 3 0 Lake Billy Chinook 9 2 9 6 Link Creek 9 2 1 8 Odell Lake 9 2 11 8 Wizard Falls Hatchery 93 1 6 0 Lake Wenatchee 8 7 2 4 0 Lake Wenatchee 8 8 3 2 0 Okanogan River 9 0 1 2 0 Babine Lake 9 0 1 0 0 Fish Creek (Alaska) 9 2 8 0
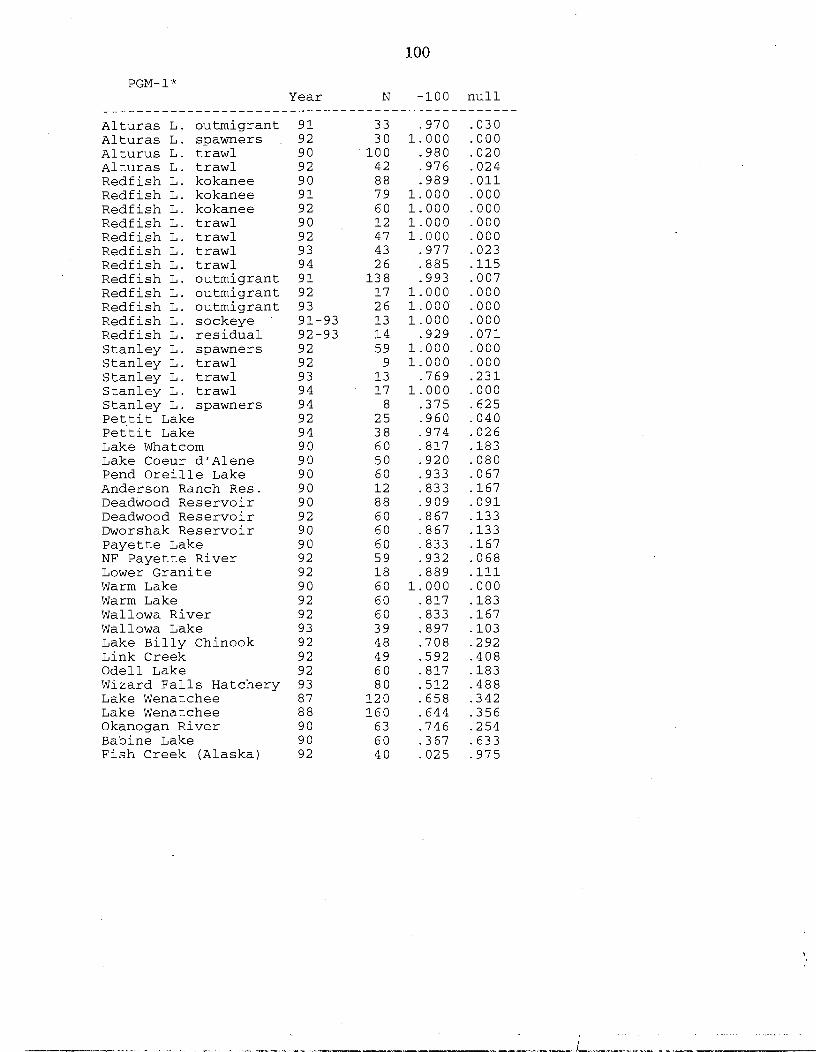
PGM- 1 *
----------------------
Alturas L. outmigrant Alturas L. spawners Alturus L. trawl Alturas L. trawl Redfish L. kokanee Redfish L. kokanee Redfish L. kokanee Redfish L. trawl Redfish L. trawl Redfish L. trawl Redfish L. trawl ~edfish L. outmigrant Redfish L. outmigrant ~edfish L. outmigrant Redfish L. sockeye Redfish L. residual Stanley L. spawners Stanley L. trawl Stanley L. trawl Stanley L. trawl Stanley L. spawners Petti t Lake Pettit Lake Lake Whatcom Lake Coeur dlAlene Pend Oreille Lake Anderson Ranch Res. Deadwood Reservoir Deadwood Reservoir Dworshak Reservoir Payette Lake NF Payette River Lower Granite Warm Lake Warm Lake Wallowa River Wallowa Lake Lake Billy Chinook Link Creek Odell Lake Wizard Falls Hatchery Lake Wenatchee Lake Wenatchee Okanogan River Babine Lake Fish Creek (Alaska)
Year N - 1 0 0 null
9 1 3 3 . 9 7 0 . 0 3 0 9 2 3 0 1 . 0 0 0 . O O O 9 0 1 0 0 . 9 8 0 . 0 2 0 9 2 4 2 . 9 7 6 . 0 2 4 9 0 8 8 . 9 8 9 . 0 1 1 9 1 7 9 1 . 0 0 0 . o o o 9 2 6 0 1 . 0 0 0 . O O O 9 0 1 2 1 . 0 0 0 . o o o 9 2 4 7 1 . 0 0 0 . o o o 9 3 4 3 . 9 7 7 . 0 2 3 9 4 2 6 ' . 8 8 5 . I 1 5 9 1 1 3 8 - 9 9 3 . 0 0 7 9 2 1 7 1 . 0 0 0 . O O O 9 3 2 6 1 . 0 0 0 . O O O 9 1 - 9 3 1 3 1 . 0 0 0 . O O O 9 2 - 9 3 1 4 . 9 2 9 . 0 7 1 9 2 5 9 1 . 0 0 0 . o o o 9 2 9 1 . 0 0 0 . o o o 9 3 1 3 . 7 6 9 . 2 3 1 9 4 1 7 1 . 0 0 0 . O O O 9 4 8 . 3 7 5 . 6 2 5 9 2 2 5 . 9 6 0 . 0 4 0 9 4 3 8 . 9 7 4 . 0 2 6 9 0 6 0 - 8 1 7 . I 8 3 9 0 5 0 . 9 2 0 . 0 8 0 9 0 6 0 . 9 3 3 . 0 6 7 9 0 1 2 . 8 3 3 . I 6 7 9 0 8 8 . 9 0 9 . 0 9 1 9 2 6 0 . 8 6 7 . I 3 3 9 0 6 0 . 8 6 7 - 1 3 3 9 0 6 0 . 8 3 3 . I 6 7 9 2 5 9 . 9 3 2 . 0 6 8 9 2 1 8 . 8 8 9 .I11 9 0 6 0 1 . 0 0 0 . O O O 9 2 6 0 . 8 1 7 . I 8 3 9 2 6 0 - 8 3 3 . I 6 7 9 3 3 9 - 8 9 7 . l o 3 9 2 4 8 . 7 0 8 . 2 9 2 9 2 4 9 . 5 9 2 . 4 0 8 9 2 6 0 . 8 1 7 . I 8 3 9 3 8 0 . 5 1 2 . 4 8 8 8 7 1 2 0 - 6 5 8 . 3 4 2 8 8 1 6 0 - 6 4 4 . 3 5 6 9 0 6 3 . 7 4 6 . 2 5 4 9 0 6 0 - 3 6 7 . 6 3 3 9 2 4 0 . 0 2 5 . 9 7 5
--.-.. . . . . - . - . -- ...-.---_--.--.-.-----ll_l. C.. - - -
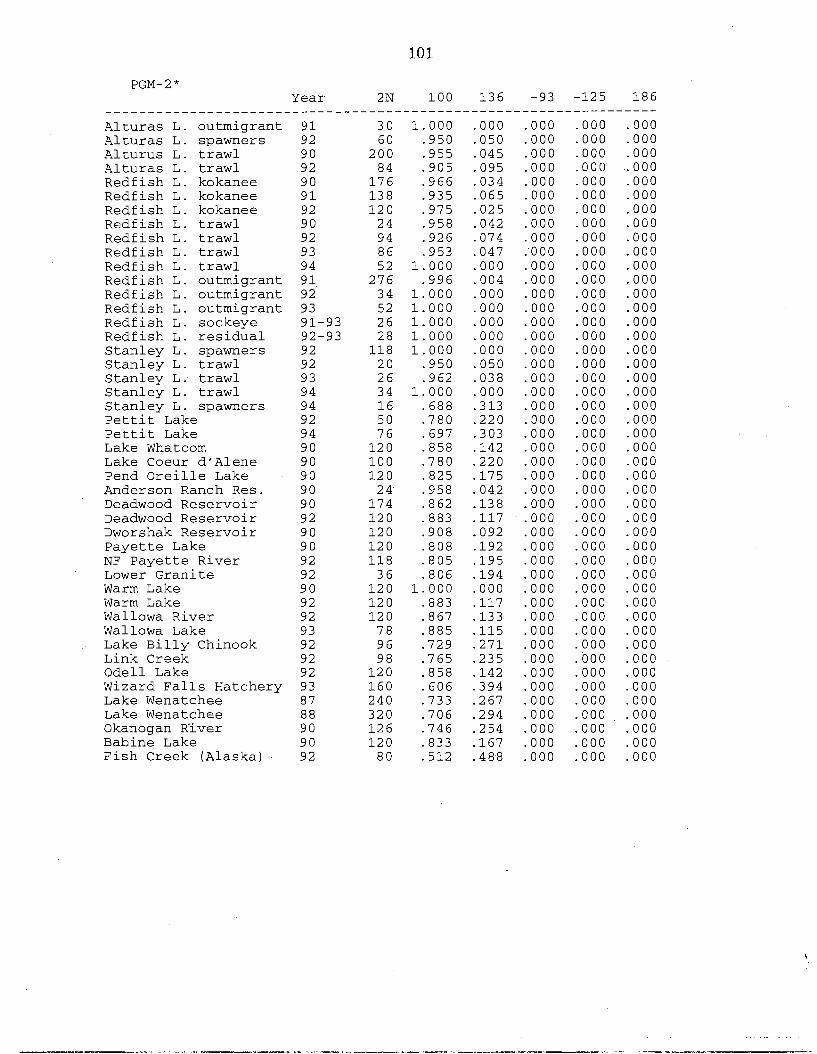
PGM- 2 * Year 2N 100 136 -93 -125 186
___________________-- - - - - - - - - - - - - - - - - - - - - - - - - - - - - - - - - - - - - - - - - - - - - Alturas L. outmigrant 91 30 1.000 .OOO .OOO .000 .ooo Alturas L. spawners 9 2 60 .950 .050 .OOO .000 .ooo Alturus L. trawl 9 0 200 .955 -045 .OOO .OOO .OOO Alturas L. trawl 9 2 84 .905 .095 .OOO .OOO .OOO Redf ish L. kokanee 9 0 176 .966 .034 .OOO .OOO .OOO Redfish L. kokanee 9 1 138 .935 -065 .OOO .OOO .OOO Redfish L. kokanee 9 2 120 .975 -025 .OOO .OOO .OOO Redfish L. trawl 9 0 24 .958 .042 .OOO .OOO .OOO Redfish L. trawl 9 2 94 -926 .074 .OOO .OOO .OOO Redfish L. trawl 9 3 86 .953 .047 .OOO .OOO .OOO Redfish L. trawl 9 4 52 1.000 .OOO .OOO .OOO .OOO Redfish L. outmigrant 91 276 .996 .004 .OOO .OOO .OOO Redfish L. outmigrant 92 34 1.000 .OOO .OOO ,000 .OOO Redfish L. outmigrant 93 52 1.000 .OOO .OOO .OOO .OOO ~edfish L. sockeye 91-93 26 1.000 .OOO .OOO .OOO .OOO Redfish L. residual 92-93 28 1.000 -000 .OOO .OOO .OOO Stanley L. spawners 9 2 118 1.000 .OOO .OOO .OOO .OOO Stanley L. trawl 9 2 20 .950 .050 .OOO .OOO .OOO Stanley L. trawl 9 3 26 .962 .038 .OOO .OOO .OOO Stanley L. trawl 9 4 34 1.000 .OOO .OOO .OOO .OOO Stanley L. spawners 9 4 16 .688 .313 -000 .OOO .OOO Pettit Lake 9 2 50 .780 .220 .OOO .OOO .OOO Pettit Lake 9 4 76 .697 .303 .OOO -000 .OOO Lake Whatcom 9 0 120 .858 .I42 .OOO .OOO .OOO Lake Coeur d'Alene 9 0 100 .780 .220 -000 .OOO .OOO Pend Oreille Lake 9 0 120 .825 .I75 .OOO .OOO .OOO Anderson Ranch Res. 9 0 24 .958 .042 .OOO .OOO .OOO Deadwood ~eservoir 9 0 174 .862 .I38 .OOO .OOO .OOO Deadwood Reservoir 9 2 120 -883 .I17 .OOO .OOO .OOO Dworshak Reservoir 9 0 120 .908 .092 .OOO .OOO -000 Payette Lake 9 0 120 .808 .I92 .OOO .OOO -000 NF Payette River 9 2 118 .805 -195 .000 .000 .ooO Lower Granite 9 2 36 .806 .I94 .000 .OOO .000 Warm Lake 9 0 120 1.000 .OOO .OOO .OOO .OOO Warm Lake 9 2 120 .883 .I17 .OOO .OOO .OOO Wallowa River 9 2 120 .867 ,133 -000 .OOO -000 Wallowa Lake 9 3 78 .885 .I15 .OOO .OOO .OOO Lake Billy Chinook 9 2 96 .729 .271 .OOO .OOO .OOO Link Creek 9 2 98 .765 .235 .OOO .OOO .OOO Odell Lake 9 2 120 .858 .I42 .OOO .OOO .OOO Wizard Falls Hatchery 93 160 .606 .394 .OOO .OOO .OOO Lake Wenatchee 8 7 240 .733 -267 .OOO .OOO .OOO Lake Wenatchee 8 8 320 .706 .294 .OOO .OOO .OOO Okanogan R'iver 9 0 126 .746 -254 .OOO .OOO .OOO Babine Lake 9 0 120 .833 .I67 .OOO .OOO .OOO Fish Creek (Alaska) 9 2 80 .512 -488 .OOO -000 .OOO
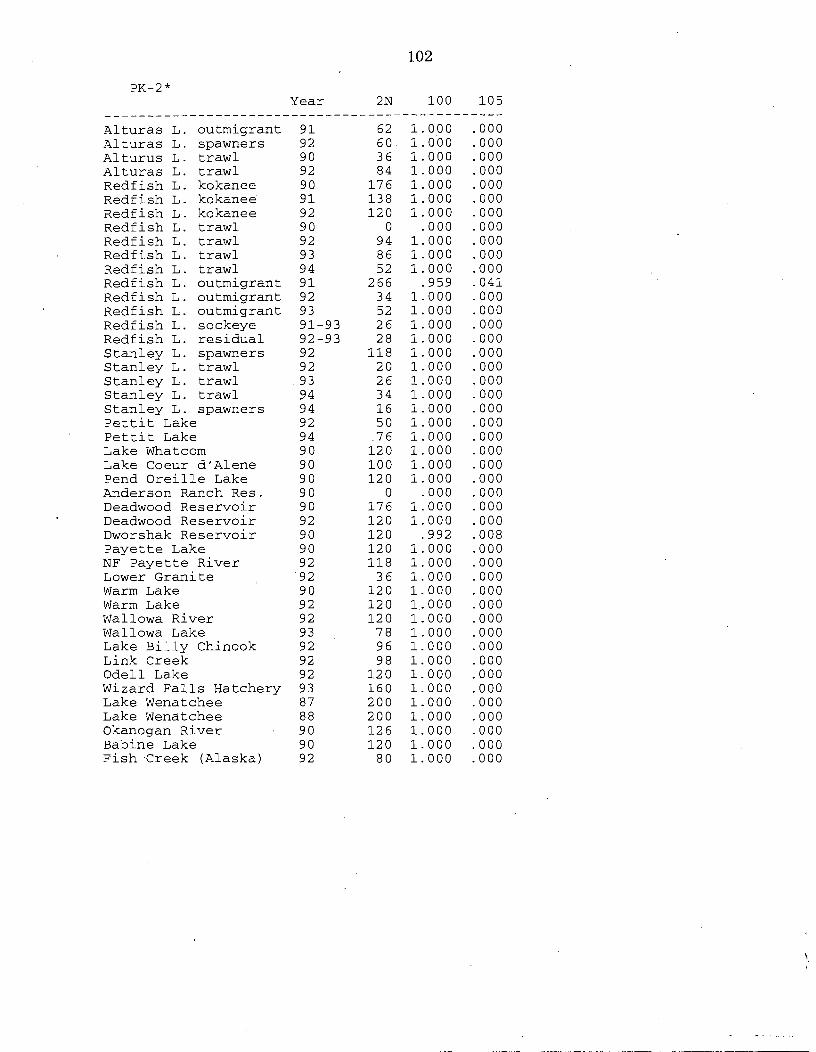
---------------------- Alturas L. outmigrant Alturas L. spawners Alturus L. trawl Alturas L. trawl Redfish L. kokanee ~edfish L. kokanee ~edfish L. kokanee Redfish L. trawl Redfish L. trawl Redfish L. trawl Redfish L. trawl Redfish L. outmigrant Redfish L. outmigrant Redfish L. outmigrant Redfish L. sockeye Redfish L. residual Stanley L. spawners Stanley L. trawl Stanley L. trawl Stanley L. trawl Stanley L. spawners Pettit Lake Pettit Lake Lake Whatcom Lake Coeur dlAlene Pend Oreille Lake Anderson Ranch Res. Deadwood Reservoir Deadwood Reservoir Dworshak Reservoir Payette Lake NF Payette River Lower Granite Warm Lake Warm Lake Wallowa River Wallowa Lake Lake Billy Chinook Link Creek Odell Lake Wizard Falls Hatchery Lake Wenatchee Lake Wenatchee Okanogan River Babine Lake Fish Creek (Alaska)
Year 2 N 1 0 0 1 0 5
9 1 62 1 . 0 0 0 . O O O 9 2 6 0 1 . 0 0 0 . O O O 9 0 3 6 1 . 0 0 0 - 0 0 0 9 2 8 4 1 . 0 0 0 . O O O 9 0 1 7 6 1 . 0 0 0 . O O O 9 1 1 3 8 1 . 0 0 0 . O O O 9 2 1 2 0 1 . 0 0 0 . o o o 9 0 0 . o o o . o o o 9 2 9 4 1 . 0 0 0 . o o o 9 3 8 6 1 . 0 0 0 . O O O 9 4 5 2 1 . 0 0 0 . O O O 9 1 2 6 6 . 9 5 9 . 0 4 1 9 2 3 4 1 . 0 0 0 - 0 0 0 9 3 5 2 1 . 0 0 0 . O O O 9 1 - 9 3 2 6 1 . 0 0 0 . O O O 9 2 - 9 3 2 8 1 . 0 0 0 . O O O 9 2 1 1 8 1 . 0 0 0 . O O O 9 2 2 0 1 . 0 0 0 . o o o 9 3 2 6 1 . 0 0 0 . O O O 9 4 3 4 1 . 0 0 0 . o o o 9 4 1 6 1 . 0 0 0 . O O O 9 2 5 0 1 . 0 0 0 . O O O 9 4 7 6 1 . 0 0 0 . O O O 9 0 1 2 0 1 . 0 0 0 . o o o 9 0 1 0 0 1 . 0 0 0 . o o o 9 0 1 2 0 1 . 0 0 0 . O O O 9 0 0 . O O O . O O O 9 0 1 7 6 1 . 0 0 0 . O O O 9 2 1 2 0 1 . 0 0 0 . o o o 9 0 1 2 0 . 9 9 2 . 0 0 8 9 0 1 2 0 1 . 0 0 0 . o o o 9 2 1 1 8 1 . 0 0 0 . O O O 9 2 3 6 1 . 0 0 0 . O O O 9 0 1 2 0 1 . 0 0 0 . o o o 9 2 1 2 0 1 . 0 0 0 . o o o 9 2 1 2 0 1 . 0 0 0 . o o o 9 3 7 8 1 . 0 0 0 - 0 0 0 9 2 9 6 1 . 0 0 0 . O O O 9 2 9 8 1 . 0 0 0 . O O O 9 2 1 2 0 1 . 0 0 0 . o o o 9 3 1 6 0 1 . 0 0 0 . O O O 8 7 2 0 0 1 . 0 0 0 . O O O 8 8 2 0 0 1 . 0 0 0 . O O O 9 0 1 2 6 1 . 0 0 0 . O O O 9 0 1 2 0 1 . 0 0 0 . o o o 9 2 8 0 1 . 0 0 0 . O O O

sSOD-1 * Year 2 N 100
.......................................... Alturas L. outmigrant 91 64 1.000 Alturas L. spawners 9 2 60 1.000 Alturus L . trawl 9 0 188 1.000 Alturas L. trawl 9 2 20 1.000 Redfish L. kokanee 9 0 170 1.000 ~edfish L. kokanee 9 1 130 1.000 Redfish L. kokanee 9 2 120 1.000 Redfish L. trawl 9 0 24 1.000 Redfish L. trawl 9 2 74 1.000 Redfish L. trawl 9 3 24 1.000 Redfish L. trawl 9 4 48 1.000 Redfish L. outmigrant 91 ' 272 1.000 Redfish L. outmigrant 92 34 1.000 Redfish L. outmigrant 93 52 1.000 Redfish L. sockeye 91-93 26 1.000 Redfish L. residual 92-93 28 1.000 Stanley L.. spawners 9 2 118 1.000 Stanley L. trawl 9 2 20 1.000 Stanley L. trawl 9 3 12 1.000 Stanley L. trawl 9 4 34 1.000 Stanley L. spawners 9 4 10 1.000 Pettit Lake 9 2 50 1.000 Pettit. Lake 9 4 76 1.000 Lake Whatcom 9 0 120 1.000 Lake Coeur dfAlene 9 0 100 1.000 Pend Oreille Lake 9 0 120 1.000 Anderson Ranch Res. 9 0 22 1.000 Deadwood Reservoir 9 0 166 1.000 Deadwood Reservoir 9 2 120 1.000 Dworshak Reservoir 90 112 1.000 Payette Lake 9 0 112 1.000 NF Payette River 9 2 118 1.000 Lower Granite 9 2 36 1.000 Warm Lake 9 0 120 1.000 Warm Lake 9 2 120 1.000 Wallowa River 9 2 118 1.000 Wallowa Lake 9 3 80 1.000 Lake Billy Chinook 9 2 96 1.000 Link Creek 9 2 98 1.000 Odell Lake 9 2 120 1.000 Wizard Falls Hatchery 93 160 1.000 Lake Wenatchee 8 7 240 .983 Lake Wenatchee 8 8 314 -978 Okanogan River 90 124 .992 Babine Lake 9 0 120 1.000 Fish Creek (Alaska) 9 2 80 1.000
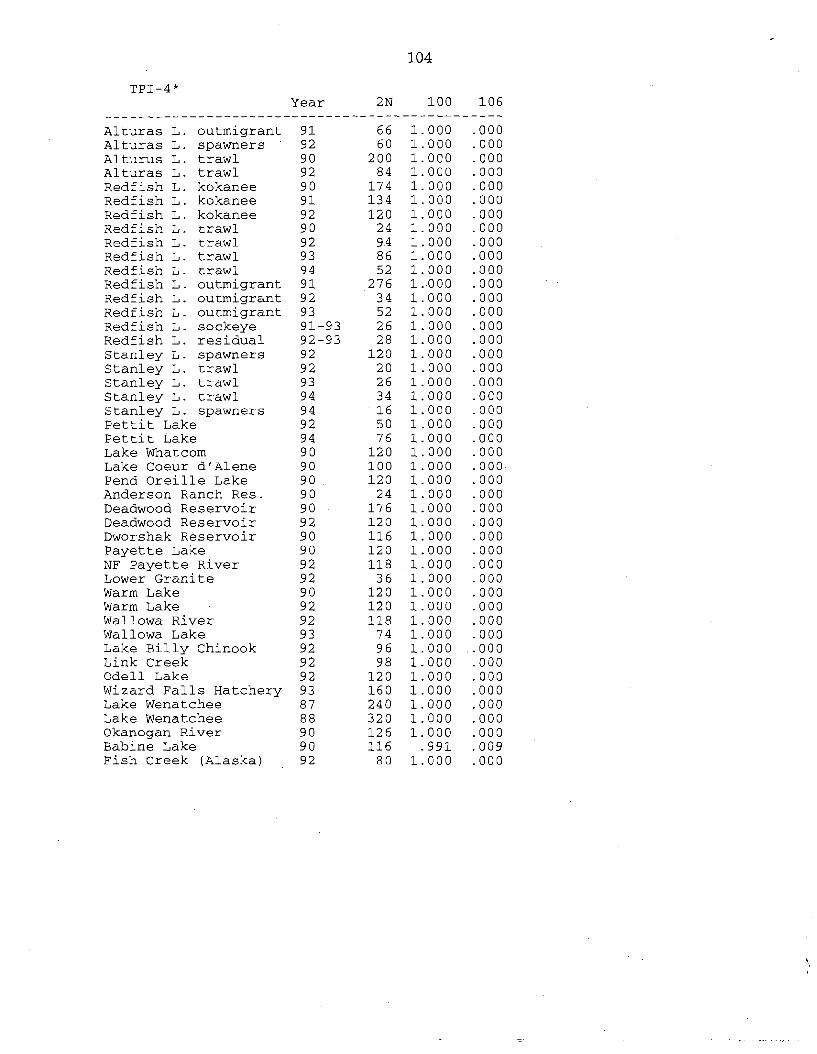
---------------------- Alturas L. outmigrant Alturas L. spawners Alturus L. trawl Alturas L. trawl Redf ish L. kokanee Redfish L. kokanee Redfish L. kokanee Redf ish L. trawl Redfish L. trawl Redfish L. trawl Redf ish L. trawl Redfish L. outmigrant Redfish L. outmigrant Redfish L. outmigrant Redfish L. sockeye Redfish L. residual Stanley L. spawners Stanley L. trawl Stanley L. trawl Stanley L. trawl Stanley L. spawners Pettit Lake Petti t Lake Lake Whatcom Lake Coeur dlAlene Pend Oreille Lake Anderson Ranch Res. Deadwood Reservoir Deadwood Reservoir Dworshak Reservoir Payette Lake NF Payette River Lower Granite Warm Lake Warm Lake . Wallowa River Wallowa Lake Lake Billy Chinook Link Creek Odell Lake Wizard Falls Hatchery Lake Wenatchee Lake Wenatchee Okanogan River Babine Lake Fish Creek (Alaska)
Year 2N 100 106
9 1 66 1.000 .OOO 9 2 60 1.000 .OOO 9 0 200 1.000 .ooo 9 2 84 1.000 .OOO 9 0 174 1.000 .OOO 9 1 134 1.000 .OOO 9 2 120 1.000 -000 9 0 24 1.000 .OOO 9 2 94 1.000 .ooo 9 3 86 1.000 .OOO 9 4 52 1.000 -000 9 1 276 1.000 .OOO 9 2 34 1.000 -000 9 3 52 1.000 .OOO 91-93 26 1.000 .OOO 92-93 28 1.000 .OOO 9 2 120 1.000 -000 9 2 20 1.000 .ooo 9 3 26 1.000 -000 9 4 34 1.000 .ooo 9 4 16 1.000 -000 9 2 50 1.000 .000 9 4 76 1.000 -000 9 0 120 1.000 .ooo 9 0 100 1.000 .ooo 9 0 120 1.000 .ooo 9 0 24 1.000 .OOO 9 0 176 1.000 .OOO 9 2 120 1.000 .ooo 9 0 116 1.000 -000 9 0 120 1.000 .ooo 9 2 118 1.000 -000 92 36 1,000 .OOO 9 0 120 1.000 .ooo 9 2 120 1.000 .ooo 9 2 118 1.000 .OOO 9 3 74 1.000 .ooo 9 2 96 1.000 .OOO 9 2 98 1.000 .OOO 9 2 120 1.000 .ooo 9 3 160 1.000 .OOO 8 7 240 1.000 .OOO 8 8 320 1.000 .OOO 9 0 126 1.000 .OOO 9 0 116 -991 .009 9 2 80 1.000 .OOO
Top Related