


Languages
Pages
Legal


Improving Interactive User Experience With Microinteractions: an Application of Biometric and Affect Detection Systems on Landing Pages
CitationReyneke, Rupert. 2019. Improving Interactive User Experience With Microinteractions: an Application of Biometric and Affect Detection Systems on Landing Pages. Master's thesis, Harvard Extension School.
Permanent linkhttp://nrs.harvard.edu/urn-3:HUL.InstRepos:42006719
Terms of UseThis article was downloaded from Harvard University’s DASH repository, and is made available under the terms and conditions applicable to Other Posted Material, as set forth at http://nrs.harvard.edu/urn-3:HUL.InstRepos:dash.current.terms-of-use#LAA
Share Your StoryThe Harvard community has made this article openly available.Please share how this access benefits you. Submit a story .
Accessibility
Improving interactive user experience with microinteractions:
An application of biometric and affect detection systems on landing pages
Rupert Reyneke
A Thesis in the Field of Information Technology
for a Masters of Liberal Arts in Digital Media Design
Harvard University
February 2019

Abstract
The essence of User Experience (UX) is to improve the quality of the user’s interaction
with the perception of the product or service offered. Measuring user perception of these
interactions has been subjective and challenging to quantify in objective terms. Biometric
sensors provide real time inferences of the user’s emotional affect. Facial recognition software
provides an additional data layer to infer the emotional affect during each interaction. Answers to
subjective questions, such as How the user feels about this interaction? What interaction caused
the user frustration? And what interactions resulted in enjoyable experiences?, can be ascertained
and provide deeper insights into improving the user experience. Data from biometric sensors can
infer and validate whether the UX strategy is meeting the intended goals and objectives.
Decision makers can use these insights to quickly improve and gain a deeper
understanding of the user’s preferences and perceptions, thereby increasing profitability and user
loyalty. These insights will be measured by: time spent on tasks, interactions, and emotional
affect throughout the session on digital media assets.
Keywords: AFFDEX, Affectiva, emotions, emotion classification, facial micro-expressions,
microinteractions, FACS, facial expression, feedback loop, user experience, iMotions, Tobii,
user experience, UX/UI.
i

ii
Dedication
To those who have supported me on my journey.
None of this would have been possible without your support.
iii
Acknowledgements
This research study would not be possible without the support of many individuals. First
and foremost, I would like to thank my wonderful wife, Janel Reyneke, whose love, support, and
encouragement has led to my personal and professional development, and to the completion of
my degree. I would be amiss without acknowledging my eternal gratitude to honor the memory
and legacy of my parents who sacrificed everything for the belief in “Life, Liberty, and the
Pursuit of Happiness” which led our family to start a new life in the United States.
I am incredibly grateful for the guidance and support from Dr. Sylvain Jaume and Jose
Luis Ramirez Herran. Not only did they encourage me to embrace growing opportunities and
develop my research abilities, they unwaveringly supported and helped me reach the finish line.
My deepest thanks and gratitude to Dr. Marco A. Palma, Jeff Pool, Samir Huseynov, and
the incredible professionals at the Human Behavior Lab at Texas A&M University for their
gracious hospitality and collaborative nature in opening their doors to me. I am extremely
grateful to Dr. Jessica M. Wilson, Robert Christopherson and the iMotions team for their
generosity, expertise, and guidance with their innovative platform and solutions that made this
research possible.
I also would like to extend my heartfelt appreciation to all the amazing individuals and
community members at Harvard and MIT, who have so graciously accepted and supported me
over the years. Your professionalism, kindness, and support has not only touched me to my core
but has fueled my commitment for continuous improvement; not just for myself, but to
contribute and serve our global communities of practice.

iv
Finally, to all who have come into my life I extend my sincere thanks and gratitude. You
have been instrumental in helping me make the necessary changes that have kindled an
awareness and awakening to pursue my dreams and reach my full potential. I am truly honored
and humbled to stand on the shoulders of scientists, researchers, programmers, engineers,
designers, and all the greats that have influenced and enhanced our lives.
v
Table of Contents
LIST OF TABLES AND CHARTS ............................................................................................. IX
LIST OF FIGURES ...................................................................................................................... XI
LIST OF ABBREVIATIONS .................................................................................................... XIII
CHAPTER 1 : INTRODUCTION ................................................................................................... 1
BACKGROUND .............................................................................................................................. 1
PROBLEM STATEMENT ............................................................................................................... 2
PURPOSE OF RESEARCH ............................................................................................................. 5
RESEARCH QUESTION ................................................................................................................ 6
KEY TERMINOLOGY .................................................................................................................... 6
User Experience Design ...................................................................................................... 6
Affective Computing ........................................................................................................... 7
Biometric Sensors ................................................................................................................ 8
Microexpressions ............................................................................................................... 12
SIGNIFICANCE OF STUDY ........................................................................................................ 12
THESIS SUMMARY AND OVERVIEW ..................................................................................... 13
CHAPTER 2 : THEORETICAL FRAMEWORK ........................................................................ 15
HUMAN COMPUTING INTERACTION .................................................................................... 16
USER EXPERIENCE DESIGN ..................................................................................................... 21

vi
MICROINTERACTIONS .............................................................................................................. 24
EMOTION, COGNITION, AND BEHAVIOR ............................................................................. 30
Affective Computing ......................................................................................................... 33
Biometric Sensors .............................................................................................................. 36
MEASURING EXPERIENCE ....................................................................................................... 53
ETHICAL CONSIDERATIONS IN UX RESEARCH .................................................................. 54
SUMMARY .................................................................................................................................... 58
CHAPTER 3 : METHODS ............................................................................................................ 60
PURPOSE OF RESEARCH ........................................................................................................... 60
RESEARCH QUESTION .............................................................................................................. 61
RESEARCH DESIGN .................................................................................................................... 62
Rationale for Convergent Mixed Methods Approach ....................................................... 62
Researcher’s Role .............................................................................................................. 64
Study Population and Sample Selection ............................................................................ 64
PHASE ONE DATA COLLECTION STRATEGIES ................................................................... 66
Tools and Instrumentation ................................................................................................. 74
Data Collection Procedures ............................................................................................... 74
Data Analysis Procedures .................................................................................................. 77
Phase Two Data Collection Strategies .............................................................................. 77
Tools and Instrumentation ................................................................................................. 78
Data Collection Procedures ............................................................................................... 79
Data Analysis Procedures .................................................................................................. 79
STUDY VALIDITY AND RELIABILITY ................................................................................... 80
vii
CHAPTER SUMMARY ................................................................................................................ 81
CHAPTER 4 : ANALYSIS & RESULTS ..................................................................................... 82
PHASE ONE FINDINGS ............................................................................................................... 82
PHASE TWO SURVEY FINDINGS ........................................................................................... 105
SUMMARY .................................................................................................................................. 117
CHAPTER 5 : CONCLUSION AND FUTURE CONSIDERATION ....................................... 118
STUDY ISSUE AND PURPOSE ................................................................................................. 118
RESEARCH QUESTION CONCLUSIONS ............................................................................... 118
RESEARCH SUB-QUESTION ONE CONCLUSIONS ............................................................. 119
RESEARCH SUB-QUESTION TWO CONCLUSIONS ............................................................ 120
RESEARCH SUB-QUESTION THREE CONCLUSIONS ........................................................ 120
LIMITATIONS OF THE STUDY ............................................................................................... 121
STUDY INTERNAL VALIDITY ................................................................................................ 123
DISCUSSIONS, OPPORTUNITIES AND FUTURE WORK .................................................... 123
CONCLUSIONS .......................................................................................................................... 124
REFERENCES ............................................................................................................................ 125
APPENDIX A: IRB STUDY APPROVAL ................................................................................ 135
APPENDIX B: PHASE ONE – RECRUITMENT FLYER ........................................................ 136
APPENDIX C: PHASE ON – ELIGIBILITY SCREENING ..................................................... 137
APPENDIX D: PHASE ONE – DEMOGRAPHIC SURVEY ................................................... 138
viii
APPENDIX E: PHASE ONE – ADULT CONSENT FORM ..................................................... 140
APPENDIX F: PHASE ONE POST-SCENARIO SURVEY ..................................................... 143
APPENDIX G: PHASE TWO – AGENCY SURVEY ............................................................... 146
APPENDIX D: SAMPLE BIOMETRIC DATA FROM PHASE ONE ..................................... 149
APPENDIX E: FACIAL EXPRESSION ANALYSIS DASHBOARD ...................................... 172
APPENDIX F: GALVANIC SKIN RESPONSE DASHBOARD (SHIMMER3) ...................... 173

ix
List of Tables and Charts
Table 2-1 Examples of Microinteractions ..................................................................................... 29
Table 2-2 Table of muscles involved in fEMG ............................................................................ 45
Table 2-3 Ethical OS Cliff Notes. Institute for the Future and Omidyar Network ....................... 58
Table 3-1 Visual display of the data used in Chapter 4: Analysis & Results ............................... 63
Table 3-2 Brief Overview of Microinteraction used for Website A ............................................. 67
Table 3-3 Phase 1 Data collection method and analysis overview ............................................... 70
Table 3-4 Example of Raw Eye Tracking Data Values ................................................................ 70
Table 3-5 Example of Facial Expression Analysis Data .............................................................. 72
Table 3-6 Example of GSR Raw Data Export .............................................................................. 73
Table 3-7 Biometric Tools ............................................................................................................ 74
Table 3-8: Phase One Procedure ................................................................................................... 77
Table 3-9 Phase Two Data collection method and analysis overview .......................................... 78
Table 4-1 Demographics ............................................................................................................... 90
Table 4-2 Website Relevance (Site A) .......................................................................................... 92
Table 4-3 Website Relevance (Site B) .......................................................................................... 93
Table 4-4 Website Engagement (Site A) ...................................................................................... 94
Table 4-5 Website Engagement (Site B) ...................................................................................... 95
Table 4-6 Website Trust (Site A) .................................................................................................. 95
Table 4-7 Website Trust (Site B) .................................................................................................. 96
Table 4-8 Website Brand (Site A) ................................................................................................ 97
Table 4-9 Website Brand (Site B) ................................................................................................. 98
Table 4-10 Feelings (Site A) ......................................................................................................... 99

x
Table 4-11 Feelings (Site B) ....................................................................................................... 100
Table 4-12 Net Promoter Score (Site A) ..................................................................................... 100
Table 4-13 Net Promoter Score (Site B) ..................................................................................... 101
Table 4-14 Thematic analysis of website A ................................................................................ 102
Table 4-15 Thematic analysis of website A ................................................................................ 103
Table 4-16 Survey Demographics .............................................................................................. 106
Table 4-17 Current Use of Biometrics or Neuromarketing in UX Testing ................................ 109
Table 4-18 Current Tools for UX Testing and Research Tools .................................................. 110
Table 4-19 UX Testing & Research Tools – Other Category ..................................................... 111
Table 4-20 Preferred Tool or Platform for UX Testing .............................................................. 111
Table 4-21 Formal Ethical Framework in Place for UX Testing ................................................ 112
Table 4-22 Ethical Frameworks Familiarity ............................................................................... 112
Table 4-23 Confidence Levels of UX Ethics and Organizational Best Practices (N = 55) ........ 113
Table 4-24 Confidence in Business Model Choice Level (Rating Scale of 1-10) ...................... 114
Table 4-25 Confidence in Team Level (Rating Scale of 1-10) ................................................... 115
Table 4-26 Thematic Analysis of Concerns in UX Research ..................................................... 115
xi
List of Figures
Figure 2-1 Visualization of UX & Interaction Design ................................................................. 20
Figure 2-2 The structure of a microinteraction ............................................................................. 27
Figure 2-3 LeDoux’s model of fear when seeing a snake ............................................................ 34
Figure 2-4 Eye tracking map originally used by Alfred Yarbus. ................................................. 37
Figure 2-5 Fixations and saccades examples. ............................................................................... 39
Figure 2-6 Heatmaps in various applications. .............................................................................. 40
Figure 2-7 Area of Interest (AOI) with KPI metrics .................................................................... 41
Figure 2-8 Various devices used to measure GSR ....................................................................... 43
Figure 2-9 Galvanic Skin Response Example. ............................................................................. 44
Figure 2-10 Muscles of the face used in Facial Electromyograph (fEMG). ................................ 45
Figure 2-11 Biosensor processing pipeline for fEMG .................................................................. 46
Figure 2-12 Action unit number and FACS name ........................................................................ 47
Figure 2-13 Visual representation of facial expression analysis .................................................. 49
Figure 2-14 Emotional arousal from respondents watching a 4-minute trailer. ........................... 49
Figure 2-15 The QRS complex & PPG signal. ............................................................................. 50
Figure 2-16 Various EEG hardware devices. ............................................................................... 51
Figure 2-17 Framework for evaluating User Experience ............................................................. 53
Figure 2-18 Ethical OS 8 Risk Zones ........................................................................................... 57
Figure 3-1 Visual display for the study’s convergent mixed methods design .............................. 63
Figure 3-2 Illustration of Website A (Opt-in Microinteraction) and Website B .......................... 68
Figure 3-3 Microinteraction used for Website A .......................................................................... 69
Figure 3-4 Messages and visual feedback from interacting with the microinteraction ................ 69

xii
Figure 3-5 Lab Stations and Individual Station for Data Collection ............................................ 75
Figure 3-6 GSR Device placement and iMotions Platform with live GSR data .......................... 75
Figure 3-7 GSR Dashboard details ............................................................................................... 75
Figure 3-8 Facial Expression Analysis. ........................................................................................ 76
Figure 3-9 Facial Expression Analysis Dashboard. ...................................................................... 76
Figure 4-1 Screenshot of a Participant’s Eye Tracking Gaze Calibration Results ....................... 84
Figure 4-2 Screenshot of a participant’s eye position (green) and mouse position (red arrow) ... 85
Figure 4-3 Screenshot of a Participant’s Collective Gaze Plot ..................................................... 85
Figure 4-4 Screenshot of a participant’s gaze points (website A) ................................................ 86
Figure 4-5 Engagement level between Website A and Website B ............................................... 87
Figure 4-6 Levels of Emotion between Website A and Website B Participants .......................... 88
Figure 4-7 Levels of Surprise between Website A and Website B Participants .......................... 88
Figure 4-8 GSR respondents with peak > 1 Peak (N=10) ............................................................ 89
Figure 4-9 Opt-in Rate by Site ...................................................................................................... 89

xiii
List of Abbreviations
AC Affective Computing
CTA Call to Action
HCI Human Computer Interaction
ISO International Organization for Standardization
PC Personal Computer
UCD User-Centered Design
UI User Interface
UX User Experience
1
Chapter 1 : Introduction
Cognition and emotion cannot be separated. Cognitive thoughts lead to emotions:
emotions drive cognitive thoughts. The brain is structured to act upon the world, every
action carries with it expectations, and these expectations drive emotions. That is why
much of language is based on physical metaphors, why the body and its interaction with
the environment are essential components of human thought. Emotion is highly
underrated. In fact, the emotional system is a powerful information processing system
that works in tandem with cognition. Cognition attempts to make sense of the world:
emotion assigns value. It is the emotional system that determines whether a situation is
safe or threatening, whether something that is happening is good or bad, desirable or
not. Cognition provides understanding: emotion provides value judgments. A human
without a working emotional system has difficulty making choices. A human without a
cognitive system is dysfunctional.
― Donald A. Norman, The Design of Everyday Things (2013, p. 47)
Background
We live in an information overload age where competition for time and attention has
become rampant. Users are increasingly being more selective on where they invest their time. On
average, users take 50 milliseconds to judge the perceived value of a website or interface to
determine whether they stay or leave by the first impressions or layout design (Lindgaard,
Fernandes, Dudek & Brown, 2006). This perception of value is based on the user’s opinion and
not necessarily rooted from data or logic (San José-Cabezudo, Gutiérrez-Cillán, & Gutiérrez-
Arranz, 2008). Biometric technology and machine learning can help gauge the effectiveness of
creative design assets and advertising. Emotional intelligence firm Realeyes (Momentum
Worldwide, 2017) remarked, “65% of marketing ROI is driven by creative, but more than 90%
of creative is never tested, which is in part because it has historically been difficult to test – and

2
focus groups are slow and expensive and yield weak links to creative and media decisions” (p.
4). As users assign value and align themselves to brands they feel they can trust, it is imperative
to understand the user’s rationale for those decisions and choices. According to Perez (2013),
users’ demand for good experience is increasing. Analysts stated that only 16% of people would
try a mobile app more than twice, this implies that user have a low tolerance of poor user
experience. This is where microinteractions, a strategic small design detail, can help users
complete their desired tasks, differentiate, and create experiences that stir emotion and delight
users as they interact online.
This study will also aim to identify some of the most common microinteractions that
mostly go unnoticed but have a significant impact on the overall perceived value of the interface
and brand. Additionally, the study will prioritize current issues and ethical guidelines for UX
research development. It is anticipated that from the data collected, a clearer more deeper
understanding of the issues can be acquired. This will inform the development of a framework
which will provide clarity and direction for the overall body of knowledge. Furthermore, it will
make recommendations as to how best UX research development can be leveraged in the
industry based on sound evidence derived from the population to which it concerns. The use of
an online survey consisting of agencies and designers will help to acquire a valid data set which
is expected to make a substantial and effective contribution to answering the research questions.
The results and recommendations will be disseminated through a variety of appropriate channels.
Problem Statement
This study seeks to explore ways to improve user experience by using microinteractions
and will be measured by the use of biometric sensors and facial recognition software in real-time.
In order to develop products and services that users have an affinity for, it is crucial to be able to

3
measure a user’s emotional affect (Loureiro, Ruediger & Demetris, 2012). Measuring emotion
has historically been a challenge due to the array of complexities involving emotions. Often
when a user is asked what they are feeling in an interview or survey, they might state what they
think an interviewer wants to hear or might simply have reservations about articulating their true
emotions to someone they do not know (Wilson, 2014). It is critical for UX researchers to
understand the emotional state of their users and empathize with them in order to not only
develop a solution “that works,” but rather one “that wows.”
In order to understand the complexities and nuances of improving user experience, it is
important that a convergent mixed-method study be conducted to determine how to best measure
and improve user experience with microinteractions. The rationale for this method allows the
researcher to collect qualitative and quantitative data simultaneously yet separate from one
another, results are analyzed separately, then the two results are compared. The objective is to
triangulate the findings from the two data sets. Triangulation of the two sets of findings serves to
validate both the qualitative and quantitative findings (if the results from two methods agree), or
to generate insights in need of further research (if the results from two methods
disagree)(Creswell, 2008). This study is expected to add to the general body of knowledge by
strengthening the industry as a whole due to the lack of systematic literature reviews on
microinteractions with biometrics.
Emotional motivators are the strongest drivers of customer behavior, such as purchasing,
paying higher prices and remaining loyal. John Mellor, Vice President of Strategy and Business
Operations for Adobe's Digital Experience Business, remarked: “Emotion is the currency of
experience” (Adobe Summit EMEA, 2017). Organizations understand the need to better connect
with their users and the importance of emotional motivators. They need consistent ways to define
user’s emotions, better connect with users, and demonstrate impact with concise metrics. One of
4
the challenges in extracting this information is that users are not always aware of what they are
experiencing or feeling.
By understanding users emotional affect, researchers can analyze and leverage emotional
insights to deliver dynamic content tailored for the targeted user. Emotional intelligence firm
Realeyes remarked, “65% of marketing ROI is driven by creative, but more than 90% of creative
is never tested, which is in part because it has historically been difficult to test – and focus
groups are slow and expensive and yield weak links to creative and media decisions” (2017, p. 4)
Measuring emotion has been historically challenging. There are two main dominant
views of emotional structures, the Discrete Emotion and Continuous Approaches. The Discrete
Emotion theorists suggest the existence of six or more basic emotions (fear, anger, sadness,
happiness, fear, disgust, and surprise). These emotions have been universally accepted across
cultures and countries despite the variance in facial display of the emotions. The Continuous
Approach (multidimensional scaling) uses positive and negative valence and physiology, which
correspond or correlate with various physiological body activities such as pulse and skin
conductance.
Eye tracking was one of the first biometric tools used to infer user motivation and
intention. There is a deep correlation between eye movements and user feedback. Jay Eskenazi
commented on this at the IxDA forum in 2009,
Eye tracking can provide insights into how people learn to use an interface. For instance,
when a user first interacts with an application, where do they look? On the second on
third visits, where is their attention? These insights can provide data into how the users
are able to learn the interface and the rates of completion for routine tasks (2009)
5
This project will attempt to use a variety of biometric devices and software to analyze
user metrics such as: Eye Tracking, EEG, ECG, GSR, fEMG, PPG; in addition to using Machine
Learning systems to analyze user Microexpressions on a pixel level through third party
applications. These data sources can infer what the user may be experiencing. If emotional
engagement can be measured effectively in users, then creative assets can be measured and
assigned a key performance indicator using emotional engagement as part of the organizational
metric dashboard.
Purpose of Research
The purpose of this convergent mixed-method study is to determine how biometrics can
be incorporated in the design process to measure efficacy of designs and user experience,
determining which emotional data metrics to use to strengthen a brand, measuring the impact of
microinteractions on user habits and behaviors, and discussing UX ethical guidelines and
considerations to safeguard and protect users. Quantitative data will be gathered and analyzed
using biometric sensors and facial recognition software to identify affect and inferences.
Qualitative data will be used to identify themes and patterns. A heuristic review of the interface
will be conducted. Additionally, online surveys will be administered to design and agency
representatives to identify trends and patterns within the industry. It is intended that the research
findings will contribute to the development of a framework or toolkit designed to support
designers and UX researchers in their delivery of digital and interactive assets.
6
Research Question
The overall central guiding question is: How can biometrics be integrated into the design
process to validate creative assets and improve user experience? This research question will be
addressed through exploration of three sub-questions:
1. What emotional data metrics can be used to measure content for relevance and
engagement, build trust, and strengthen a brand?
2. What is the efficacy of microinteractions to form habits and changes in user behavior?
3. What UX ethical guidelines and considerations can be incorporated into the design
process to safeguard and protect a user’s privacy and well-being?
Key Terminology
The following key terminology defined below have been identified as crucial for the
overall understanding of this study.
User Experience Design
A/B Testing: multiple variations (typical two) of content are presented to the user to
determine which version resonates or has a higher conversion rate (Rochelle, 2017).
Cognitive Workload: the total amount of mental effort used in the working memory.
Cognitive Load theory is differentiated into three classes: intrinsic, extraneous, and germane
(DeLeeuw & Mayer, 2008).
Heuristic Review: the evaluation of a website or application that documents flaws in
usability and details recommendations for improvement (Shepard, 2013).
Mouse Click Counts: this metric is primarily helpful when looking at the paths that users
take from a single decision point within an interface. If given a task to find a specific piece of
7
information, where do users click first? If users interact with faceted navigation, which elements
of that navigation do they click on most? While not specific to eye tracking, the eye tracker’s
ability to record this data can provide valuable information in conjunction with other eye
tracking metrics and usability findings (Rotolo, 2017).
Neuromarketing: a field of marketing incorporating the use of medical technologies and
equipment such as EEG’s to study the individuals brain responses to marketing stimuli.
Researchers use these measures to learn why consumers make the decisions they do, and which
regions in the brain are responsible for those (Lee, Broderick & Chamberlain, 2007).
Red Routes: the specific tasks that users will carry out on the site or application. This helps
identify and eliminate any user obstacles on the user journey (Baker, 2018).
Think Aloud (TA): a traditional usability testing method. Users are asked to speak their
thoughts, feelings, and opinions as they are interacting with the interface. This feedback helps
the facilitator identify the experience and pain points (Nielsen, 2012).
Visits or Dwell Time: the total length of time that a visitor spends on a page before
returning to the SERPs (Search Engine Results Page) (Forrester, 2019).
Affective Computing
Arousal Valence Model: a circumplex model of emotional affect with the horizontal axis
representing the valence dimension and the vertical axis representing the arousal or activation
dimension (Harmon-Jones, & Winkielman, 2007).
Emotional Arousal: a heightened physiological state. Strong emotions such as anger and
fear experienced from daily responses can induce the emotional arousal. This state is fluid and
can change over the course of a time period (Turner, 2007).
8
Facial Expression Recognition: the valent measurement and emotional recognition of
positive, negative, and neutral emotional states (Young, 2016).
Biometric Sensors
Biometric: the technical term to calculate body measurements. It refers to metrics related to
human characteristics. Biometrics authentication is used in computer science as a form of
identification and access control, and information feedback (Jain, Flynn & Ross, 2008).
Electroencephalogram (EEG): an electrophysiological monitoring method that measures
and records the electrical activity of the brain. Noninvasive electrodes are placed along the scalp
which measure voltage fluctuations occurring from ionic current within the neurons of the brain
(Markland, 2014).
Eye tracking: a tool used to collect user data through eye sensors connected to a computer.
Most tracking systems include a light source and a camera. The light source is pointed towards
they and the camera tracks the reflection of light on the eye. The data reveals the rotation and
direction of the eye and the direction of gaze (Bergstrom, Schall, Dunkerley, Scherer &
Studholme, 2014).
Facial electromyography (fEMG): a tool for measuring emotional reaction. Studies have
found that activity of the corrugator muscle, which lowers the eyebrow and is involved in
producing frowns, varies inversely with the emotional valence of presented stimuli and reports
of mood state. Muscle activity is detected with sensors measuring micro electrical impulses that
are generated by the facial muscle fibers when they contract. It primarily focuses on two major
muscle groups in the face: the corrugator supercilii group which is associated with frowning and
the zygomaticus major muscle group which is associated with smiling (Harmon-Jones & Beer,
2009).

9
GSR (Galvanic Skin Response): the measurement of dermal conductance that correlates
with the arousal states (Westerink, Van den Broek, Schut, Van Herk, Tuinenbreijer &
Ouwerkerk, 2008).
Eye tracking
Areas of Interest (AOI): referred to as AOIs, are user-defined sub regions of a displayed
stimulus. Extracting metrics for separate AOIs are useful when evaluating the performance of
two or more specific areas in the same video, picture, website or interface. This can be
performed to compare groups of participants, conditions, or different features within the same
scene (Farnsworth, 2018).
Fixation Count: the number of fixations within the AOI of the screen the user is interacting
with during a session (Farnsworth, 2018).
Fixation Duration: the time spent in fixation within the specific AOI during a session
(Farnsworth, 2018).
Fixation Points: a specific time period where the eyes are locked toward a certain object.
Typically, the fixation duration is 100 – 300 milliseconds. Eye movements between fixations are
known as saccades (Farnsworth, 2018).
Fixation Sequence: Based on fixation position (where?) and timing information (when?)
you can generate a fixation sequence. This is dependent on where respondents look and how
much time they spend, and provides insight into the order of attention, telling you where
respondents looked first, second, third, etc. This is a commonly used metric in eye tracking
research as it reflects salient elements (elements that stand out in terms of brightness, hue,
saturation, etc.) in the display or environment that are likely to catch attention (Farnsworth,
2018).
10
Gaze Points: one of the basic units of measure. A gaze point equals one raw sample
captured by the eye tracking sensor. If the eye tracker measures 60 times a second, then each
gaze point represents a sixtieth of a second (or 16.67 milliseconds). When a series of gaze points
are close in time and range, the resulting gaze cluster denotes a fixation (Farnsworth, 2018).
Observation Length: across all fixations on a media element (page), how long a participant
looked at a specific area of interest. Observation length can generally give you the best indication
of the division of attention various elements of a page receive. You may notice a block of text
receives less than a second of total observations, indicating users are not reading the messaging
in full. Or you may see in conjunction with the percentage fixated metric that while an element
of a page may not have been seen by a lot of participants, when it was seen, it received a lot of
attention. As with all metrics, qualitative questioning can help determine the reasons why some
elements viewed for longer than other elements (Farnsworth, 2018).
Perceptual Span: unlike reading, locking your eyes toward a moving object won’t generate
any saccades, but a smooth pursuit trajectory. This way of seeing operates as you might expect –
the eyes smoothly track the object. This occurs up to 30°/s – at speeds beyond this, saccades are
used to catch up to the object (Farnsworth, 2018).
Percentage Fixated: also known as Participant Percentage in some versions of Tobii
Studio. The percent of participants who fixated at least once on an area of interest. This metric
can show you how many participants fixated on this call to action when trying to determine how
many people noticed a call to action during a task. Using this metric in conjunction with
observation length and mouse click count (explained below), you can see out of those who saw
an element of a page, did they look at it long enough to register it in their memory (this can be
subjective), and out of those who saw the element, how many clicked it in context of the task
(Farnsworth, 2018).
11
Pupil Center Corneal Reflection (PCCR): a technology used in eye tracking that utilizes
the near-infrared technology with a high-resolution camera to track gaze direction (Farnsworth,
2018).
Respondent Count: the respondent count describes how many of your respondents actually
guided their gaze towards a specific AOI. A higher count shows that the stimulus is widely
attended to, while a low count shows that little attention is paid to it (Farnsworth, 2018).
Smooth Pursuit: reading involves both saccades and fixations, with each fixation involving
a perceptual span. This refers to the number of characters we can recognize on each fixation,
between each saccade. This is usually 17-19 letters, dependent on the text. Experienced readers
have a higher perceptual span compared to early readers and can therefore read faster
(Farnsworth, 2018).
Time from First Fixation to Next Mouse Click: the time that a user first fixates on an item
until they click on the intended link or button. This metric is more valuable and insightful than
simply measuring click rates as it provides more insights into the reason why a user delays in
taking action (Farnsworth, 2018).
Time to First Fixation (TTFF) Output: the time to first fixation indicates the amount of
time it takes a respondent to look at a specific AOI from stimulus onset. TTFF can indicate both
bottom-up stimulus driven searches (a flashy company label catching immediate attention, for
example) as well as top-down attention driven searches (respondents actively decide to search
for certain elements or areas on a website, for example). TTFF is a basic yet very valuable metric
in eye tracking (Farnsworth, 2018).

12
Microexpressions
Microexpressions: emotional responses that conflict with each other. These responses are a
result of voluntary and involuntary responses that occur when the amygdala responds to the
stimuli an individual experience but wishes to conceal the emotion. This is experienced a very
brief display of the true emotion followed by a false emotion. These emotions are unconscious
bio-psycho-social reactions originating from the amygdala, lasting between 0.5 - 4 seconds.
Microexpressions will typically last less than 1/2 of a second. It is possible to capture an
individual’s expressions with a high-speed camera and replay them at much slower speeds to
interpret the individual’s emotional response (Saffer, 2013).
Significance of Study
This project aims to identify ways to integrate biometrics into human-centered design as
a way to improve user experience in interactive systems and strengthen the overall brand. User
experience is defined as a person's perceptions and responses resulting from the use and/or
anticipated use of a product, system or service (ISO 9241-210:2010(en) 2.15). User experience
includes all the users' emotions, beliefs, preferences, perceptions, physical and psychological
responses, behaviors and accomplishments that occur before, during and after use (ISO 9241-
210:2010(en) 2.15). As noted by 3M (Vitael, 2017, p. 6) by 2020, “customer experience will
overtake price and product as the key brand differentiator.” Since the advent of smart devices
and improved access to the internet in the palms of our hands, users have access to more
information than ever before to make informed choices (World Bank Group, 2019). Users are
now actively engaged in sharing their ideas and opinions and are becoming more centrally
collaborative in the design process.

13
This study also intends to contribute to the general body of knowledge as the research
and literature is limited on microinteractions and biometrics in UX. Future implications of this
study hope to provide designers and other UX professionals with opportunities to measure and
identify ways to improve the user experience. Furthermore, this study may be able to positively
impact future exploration into issues relating to ethical safeguards and strategies involving
interactive technologies.
Thesis Summary and Overview
Chapter 1 provided a background of the problems and challenges of designing interactive
systems and measuring the efficacy of creative assets developed. The chapter introduced the
problem, purpose of the research, a central guiding question with sub-questions, and significance
of the study to guide the research that will be conducted in subsequent chapters. To support
understanding of the research, key terminology and definitions were provided.
Chapter 2 provides additional detail into the theoretical framework and literature of
human-centered design for interactive systems. Usability and usefulness of systems, user needs
and requirements, microinteractions; along with techniques and principles to enhance
effectiveness and efficiency, improve human well-being, user satisfaction, and accessibility and
sustainability are explored. Additionally, theory of affective computing, biometric sensors, and
user behavior are also discussed.
Chapter 3 presents the research methods and design to discuss the research questions. A
description of the methods, processes and frameworks will be reviewed; followed by the real-
time biometric affect detection will be outlined. Results from qualitative surveys and feedback
will be reviewed.

14
Chapter 4 reviews the results and achievements of the research project. The results of the
real-time biometric evaluation of the interactive system are presented. The evaluation
methodology along with a detailed description of the measures used will be presented.
Chapter 5 provides the summary and highlights on the specific contributions made by this
thesis and discusses current trends and opportunities for future research.
15
Chapter 2 : Theoretical Framework
Good design is actually a lot harder to notice than poor design, in part because good
designs fit our needs so well that the design is invisible, serving us without drawing
attention to itself. Bad design, on the other hand, screams out its inadequacies, making
itself very noticeable.
― Donald A. Norman, The Design of Everyday Things (2013, p. xi)
Dressed to the nines and rubbing shoulders with the upper crust of New York City, an
audience in Avery Fisher Hall began baying for blood where prior pleasantries and politeness
were once exchanged. The jarring infamous sound of an iPhone Marimba ringtone shattered the
sacred space where the long anticipated climactic measures of Mahler’s Symphony No. 9 were
being performed at the New York Philharmonic. Then the unthinkable happened. The conductor
abruptly halted the performance while the culprit’s, later identified as “Patron X”, ringtone
furiously played on. This increasingly instigated the uprising of the audience who grew louder
and insistently vocalized their disproval and disdain. After what seemed like an eternity or
torment waiting, the phone was silenced. A cheering roar of approval sounded. Humanity was
momentarily restored, and the performance continued. The man whom the Philharmonic refer to
as Patron X was a lifelong lover of live classical performance and a patron of the arts. Upon
asking about the discovery that he was the culprit that disrupted the performance, he remarked
“It’s horrible, horrible,” commenting that the event had cost him two days of sleep. The New
York Times (2012) reported that Patron X had just received an upgraded phone. Prior to the
iPhone his company had provided him with a Blackberry. When the performance was about to
start, he flipped the mute switch on the phone which silenced the sound and ringer. However,
little to his knowing, there was a small microinteraction rule that dictated that any alarm would

16
go off and override the silenced mode. Now the argument can be made that when a phone is on
silent everything must be silent. Apple’s iOS Human Interface Guidelines (Apple, 2019)
provides reasoning for this:
For example, in a theater, users switch their devices to silent to avoid bothering other
people in the theater. In this situation, users still want to be able to use apps on their
devices, but they don’t want to be surprised by sounds they don’t expect or explicitly
request, such as ringtones or new message sounds. The Ring/Silent (or Silent) switch
does not silence sounds that result from user actions that are solely and explicitly
intended to produce sound.
The counter argument that Apple evangelist John Gruber (2012) noted, that if mute
switch did indeed silence the phone and all its sounds, then thousands of people would oversleep
from silencing their phones the night before. Microinteractions and User Experience Design
rarely make headlines and most good design is considered invisible, but when they do not work
as intended or imagined, they are glaringly obvious and potentially offensive.
This chapter will further explain the conceptual foundation for the study, improving user
experiences through biometrics with the implementation of microinteractions. The chapter will
briefly review the field of Human Computer Interaction, an overview of microinteractions and
the emerging field of user experiences. The conceptual foundation comes from research about
emotion, cognition, and behavior in correlation to biometric sensors for user experience.
Measuring user experience and ethical considerations are overviewed.
Human Computing Interaction
Human-Computer Interaction (HCI) emerged in the early 1980s initially as an area of
computer science that explored human cognition and human factors in engineering (Carroll,
17
1997). Its growth has rapidly expanded attracting multi-disciplinary experts and approaches to
the field. HCI is now a collective of semi-autonomous fields of research and practice in human-
centered informatics. The rise of the Personal Computer (PC) in the late 1970s disrupted the
existing paradigm of what constituted a computer user. Prior to this time, technology
professionals and avid hobbyists were the primary users of computers. During the same time the
broad project of cognitive science; which incorporated cognitive psychology, artificial
intelligence, linguistics, cognitive anthropology, and the philosophy of mind, had formed. A
segment of this program of cognitive science was intended to articulate systematic and
scientifically informed applications to be declared as cognitive engineering (Lee & Kirlik, 2013).
The first examples of cognitive engineering were HCI. As software complexity began to emerge,
the need to focus on nonfunctional requirements such as usability and maintainability began to
be prioritized (Carroll, 1997). With advancing computer graphics and information processing,
the field recognized that the future needed to be more focused on understanding and better
empowering users. Microsoft’s vision in 1980, “a computer on every desk and in every home”
also meant that focusing on everyday people and redefining users would be crucial to realize that
goal.
The most notable focus of HCI was and continues to be the idea of usability (Carroll,
2004). A slogan that casually developed in the industry was, “easy to learn, easy to use” (Carroll,
1997, p. 66). This paradigm was meant to unify and hold the field together, however the concept
of usability in HCI has been continually rearticulated and reworded. HCI has expanded beyond
computer science and is often taught in practices and disciplines such as design,
communications, psychology, and industrial manufacturing to name a (Mysers, 1998).
Consequently, this vast reach and growth meant that it no longer just fit within computer science
as it has become larger and more diverse than originally conceived. There is no singular unified

18
concept of HCI. Academically, HCI programs cater to a diverse range of professionals such as
user experience designers, interaction designers, usability engineers, application developers, and
online information designers. Sub-communities of HCI are also extensive and diverse. HCI has
become the name for a community of communities (Carroll, 2004). What started as a single
strand of a small and heretical view of computing, has now expanded to a vast multifaceted
community rooted in the evolving paradigm of usability, and provided value to the human
experience through technology (Carroll, 1997).
Initially HCI was viewed as a design science or as being a point of reference for guidance
for designers, which was first viewed as separate from the HCI research (Grudin, 2012).
Eventually in the 1990s a series of design communities began emerging from HCI. As designers
merged the science and engineering techniques into the user interfaces, richer and robust
experiences began to emerge (Grudin, 2012). From this inclusion we began to see interaction
design and user experience design emerging as design disciplines originating from the field of
HCI. This fragmented and often complex field has given rise to several communities that have,
in turn, provided more focus and discipline into the meta-project of HCI (Carroll, 1997).
Some of the most impactful contributions to interaction design and user experience have
come from HCI research. An example of perhaps one of the most frequently used interaction
laws or guidelines is Fitts’s Law. Psychologist Paul Fitts (1954) researched the human motor
system and demonstrated that the time required to move to a target depends on the distance to it
and relates inversely to its size. This meant that fast movements and small targets resulted in
greater error rates as a result of speed-accuracy trade-offs. This law is universally applied in UX
and user interface (UI) design and was s one of the most impactful influencers that led to the
development of larger buttons on smartphones and devices. Smaller buttons would have less

19
accuracy and would involve more time to accurately hit or trigger a target. The formula for
Fitts’s Law can be written as follows:
�푇 = �푎 + �푏 log2 ( 2DW ) T: Time is the amount of time needed for the user to complete their movement. a + b: are “regression coefficients,” these are found by observing the slope of the object. D: Distance between the user’s starting point and their target. W: Width of the target object.
In simple terms, Fitts’s Law provides a theory that makes it easy for the user to find a
target and select it. Designing with this principle in mind can contribute to a user experience that
is enjoyable, usable, and useful (Coleman, 2015).

20
Figure 2-1 Visualization of UX & Interaction Design and the variety of disciplinary knowledge and skills involved in contemporary design of human-computer interactions. (Saffer, 2008)
Given this growing and evolving field, Hassenzahl, (2006) found it critical to note some of the
limitations that are crucial to human centered design and needs:
In HCI, it is widely accepted that usability is the appropriate definition of quality.
However, the focus of usability on work-related issues (e.g., effectiveness and efficiency)
and cognitive information processing has been criticized. Its’ quite narrow definition of

21
quality neglects additional hedonic (non-instrumental) human needs and related
phenomena, such as emotion, affect, and experience. (p. 266)
Blythe and Wright argued that in HCI, traditional approaches to usability are not enough
and that measuring emotion and enjoyment on website design is crucial (2003, p. xvi).
As technology continues to advance, new contenders such as quantum computing and artificial
intelligence are becoming household terms. We can only suppose that there will be a significant
increase in processing power and resources allocated to additional features beyond the simplicity
of only a screen interface, and will most likely see an expansion in gesture recognition, speech
recognition, and more cognitive and affective recognition and interface technologies. As
demonstrated by its past, the field of HCI will yet again undergo more changes and advances in
the pursuit of bridging the gap between man and machine (Shen, 2019).
User Experience Design
User experience is an elaborate overarching concept that has a long history of debates and
many attempts to define it (Jay, 2004). As was discussed in the prior chapter, UX emerged from
the HCI field and draws on several professions with significant overlap. Experiences are
meaningful, personally encountered events. These experiences become part of memory,
influence decisions and opinions in the future, and have a tendency to improve over time (van
Boven, 2005). Van Boven explains this process of perceptual experience (2005, p. 137) as
follows:
As one forgets the incidental annoyances and distractions that detract from the online,
momentary enjoyment of an experience, one’s memory of an experience can be
sharpened, levelled, and ‘spun’ so that the experience seems better in retrospect than it
actually was.
22
This implies that not only does the user interact with the direct experience, but the long-
term value or impact of the experience can change over time as the user recounts and recalls their
experience, necessitating the significance of consistent messaging and impressions to provide the
desired content and context for the user.
In psychology, an experience emerges from the integration of perception, action,
motivation, and cognition into an inseparable, meaningful whole (Hassenzahl., 2008). This
interconnected concept is reflected by Russell’s (2003) model of emotions that emphasizes the
importance of self-observation, attribution, and categorization, in order to have an emotionally
charged experience. Action theorists suggest a close link between actions, thoughts, and
emotions (Kaptelinin & Nardi, 2006; Carver & Schrier, 1989). Experience is subjective, holistic,
dynamic, situated, and worthwhile (Hassenzahl, 2010).
The International Organization for Standardization (ISO), has outlined a series of quality
measures that provide the fundamental elements of what User Experience is within the context of
Human Centered Design (HCD). The current version defines UX as:
A person's perceptions and responses resulting from the use and/or anticipated use of a
product, system or service…User Experience includes all the users' emotions, beliefs,
preferences, perceptions, physical and psychological responses, behaviors and
accomplishments that occur before, during and after use…User Experience is a
consequence of brand image, presentation, functionality, system performance,
interactive behavior and assistive capabilities of the interactive system, the user's
internal and physical state resulting from prior experiences, attitudes, skills and
personality, and the context of use…Usability, when interpreted from the perspective of
the users' personal goals, can include the kind of perceptual and emotional aspects
typically associated with User Experience. Usability criteria can be used to assess
aspects of user experience (ISO 9241-210:2010(en) 2.15).

23
From this definition we can see why Hassenzahl et al, (2010) argues for an experience to
be viewed as an episode or piece of time; interlaced with sights, sounds, feelings, and thoughts,
motives and actions, all closely bound together in the recesses of memory; to be labelled, relived,
and communicated to others. While this might seem incredibly complex and have a wide range
of emotion within these experiences, there is an inherent binary way to simplify the evaluation of
the experiences, and that is to catalog them as pleasurable or painful (Russell, 2003). A study of
technology-mediated positive experiences revealed that stimulation, relatedness, competence,
and popularity were viewed as sources of pleasure by users (Hassenzahl et al, 2010). In thinking
of positive user experiences with technology, we can look no further than the use of texting.
When a wife receives an unsolicited text from her husband with the words “I love you” written
across the screen of the device, a smile and moment of happiness and joy can be seen as she
recounts the experience. This simple interaction is an effective example of relatedness
experience by fulfilling a need for social relationship and intimacy (Hassenzahl, 2003). The
smart phone is the instrument to create this experience, the positive emotions and feelings are a
result of meeting a universal psychological need. Need-fulfilment is what makes an experience
pleasurable (Hassenzahl, 2003).
While designing for experience is significantly more complex that looking through a lens
of pleasure or pain, it is beneficial for UX design to focus on a simple model to craft an
interaction with a product or interface. This model involved three levels of: What, How, and
Why (Hassenzahl, 2003). The What involves what users can actually do through the interaction,
such as making a purchase, logging on the check email, etc. The What typically is intimately tied
to the technology. The How is generally where the interaction designer spends most of their time,
making functionality pleasing. An example of this is the email interface. If a user needs to access

24
their email, the steps involved in logging on, common tasks performed, and logging off are
designed so it “feels” intuitive and natural. General assumptions of the bundling of What and
How are considered by many to be the experiential component of UX design. Having this
mindset ignores the real motivation of why people use the product/solution. A text message
becomes so much more than a message or the transfer of data. It becomes part of a love story, a
relationship building tool, a vehicle to stay more connected to the ones we love. These
motivational drivers provide insights into the realm of the Why. This is where UX design comes
into being, it starts with the Why, to truly understand the users’ needs and emotions involved.
Only when understood adequately enough should the What and the accompanying How be built.
When Why, What, and How are in harmony; something beautiful happens. The result are
products that transcend their purpose and have a story to share. In short, the user experience, or
interactive experience, should never be an end in itself, instead it should be instrumental to some
life experience (Hassenzahl, 2010).
Utilizing these principles and priorities is what Verganti (2009) meant when speaking of
design-driven innovation, wherein the designer pushes a new meaning, a new experience onto
the public. Designers are crucial in innovating and producing products and solutions that
meaningfully impact the Why, What, and How.
Microinteractions
As was noted in the prior section, experience design is focused on close attention to
details with an overarching goal of understanding the bigger picture to ensure that users can have
enjoyable experiences and moments using the product. This is where microinteractions can
potentially create delightful moments when using a product. They have the potential to take
tedious tasks and transform them into mesmerizing moments that can make the mundane seem

25
more meaningful. In his book, Microinteractions: Designing with Details, Dan Saffer (2013, p.
2) defines microinteractions as “contained product moments that revolve around a single use
case—they have one main task.” Microinteractions are good for: accomplishing a single task,
managing ongoing tasks, pairing devices together, interacting with a single piece of data,
controlling ongoing processes, adjusting settings, creating or viewing a piece of content, and
turning features on/off. The toaster is an example of a microinteraction in a real-world product.
The primary role of the toaster is to do one thing and one thing alone, to toast. User places bread
into the toaster and push down to start the toasting; when complete, toast pops up. There are of
course variations on this process with additional buttons and extra settings like light, medium, or
dark. In general, the device is powered by a single microinteraction (Saffer, 2013).
Much like the toaster example, applications and digital products are typically made up of
one main microinteraction doing one thing well such as converting measures like pounds to
kilograms or an alarm/timer on a clock app. Microinteractions are often overlooked as they are
frequently considered the last parts of the product to be built. This is seen in the original versions
of the Android phone as compared to the iPhone. One of the notable frustrations from users were
the inconsistencies in some of the triggered applications such as performing a search. There were
inconsistent actions when users attempted to perform, search, or delete items. These overlooked
details resulted in user pain and frustration, a reminder that the strength and integrity of a product
is only as good as the smallest part. An example of the impact of microinteractions can be seen
when considering operating systems. At their core, most operating systems perform similar tasks.
They install and launch applications, manage files, connect software and hardware, and manage
open applications. From the perspective of a user, the microinteractions can be significant
enough to pledge loyalty to a brand; as have been noted from several Mac users as to the reasons
why they prefer using the operating system and product. When feature parity is present,
26
microinteractions are a key differentiator and have the potential to help with product adoption
and increase brand loyalty (Saffer, 2013). Microinteractions are ideal for multiplatform
integration since they can translate well across various devices that have small or limited screen
size. Small interactions are suitable for small devices. The frequented “check-in” or “like” button
on a phone or digital watch are examples of the speed and specificity of these small details.
These types of streamlined, fast, on demand, or at a glance moments fit well into the
overcrowded and often overcomplicated lives we lead providing a moment of simplicity in an
already complex or burdensome world.
This history of microinteractions can be traced back beyond digital products. Arguably,
the origins of microinteractions could be evident in the radio in 1893, the washing machine in
1900, or even the flashlight in 1986 (DeRouchey, 2010). In his talk, The History of the Button,
Bill DeRouchey observes that prior to the electric era it was easier for users to understand the
role and impact of their actions. For instance, when a lever was engaged the associated gears,
mechanics, and connections of input to output were easily observed. When electricity was
introduced to homes, this process still involved a “lever” or button but was instantaneous. The
method or process was not directly observable while the feedback was. Connecting the input to
the output was no longer seen like traditional mechanical processes before. With the push of a
button light was emitted, music would play, and communication was possible. Action had
become abstracted. Much like the concept of syncing data across devices, there is no physical
analog that effectively conveys this abstract idea. Input methods evolved beyond buttons to
include keyboards, mice, touchscreens, voice, and gesture to trigger microinteractions. Prior to
1956 the only possible way to interact with a physical environment was to be present within it
and within its’ proximity. When Robert Adler invented the Zenith Space Commander TV
remote, users were able to remotely and invisibly control an object from a distance. The same

27
idea and concept are expected with microinteractions. We use apps to control thermostats from
anywhere on the planet. We use phones to transfer money from banks to merchants with the
click of a button, and the list goes on. The button represents how we interact with the products
we create (DeRouchey, 2010). The history of technology is intertwined with the history of
microinteractions working in tandem.
Each microinteraction has four critical elements that are needed a trigger, a set of rules,
feedback, and loops and modes. The trigger initiates the microinteraction, rules are then applied
to determine how the microinteraction will work, feedback is provided that sheds light on the
rules, while loops and modes provide the meta rules affecting the microinteraction (Saffer,
2013).
Figure 2-2 The structure of a microinteraction
An example of a trigger would be logging into a smartphone. The user initiates this
process by touching the screen of a phone to begin or start the microinteraction. This step reflects
an understanding of the user need or what the user wants to do and the frequency. In the case of
the smart phone, the need is privacy and security. The trigger (touching the screen once inactive)
is available all the time regardless of the applications running. The user can also engage with the
microinteraction and receive feedback. In order for something to happen their needs to be some
functionality associated with the trigger. In the case of logging onto the phone the password
needs to be verified. If the user enters an incorrect password, the phone provides feedback stating
28
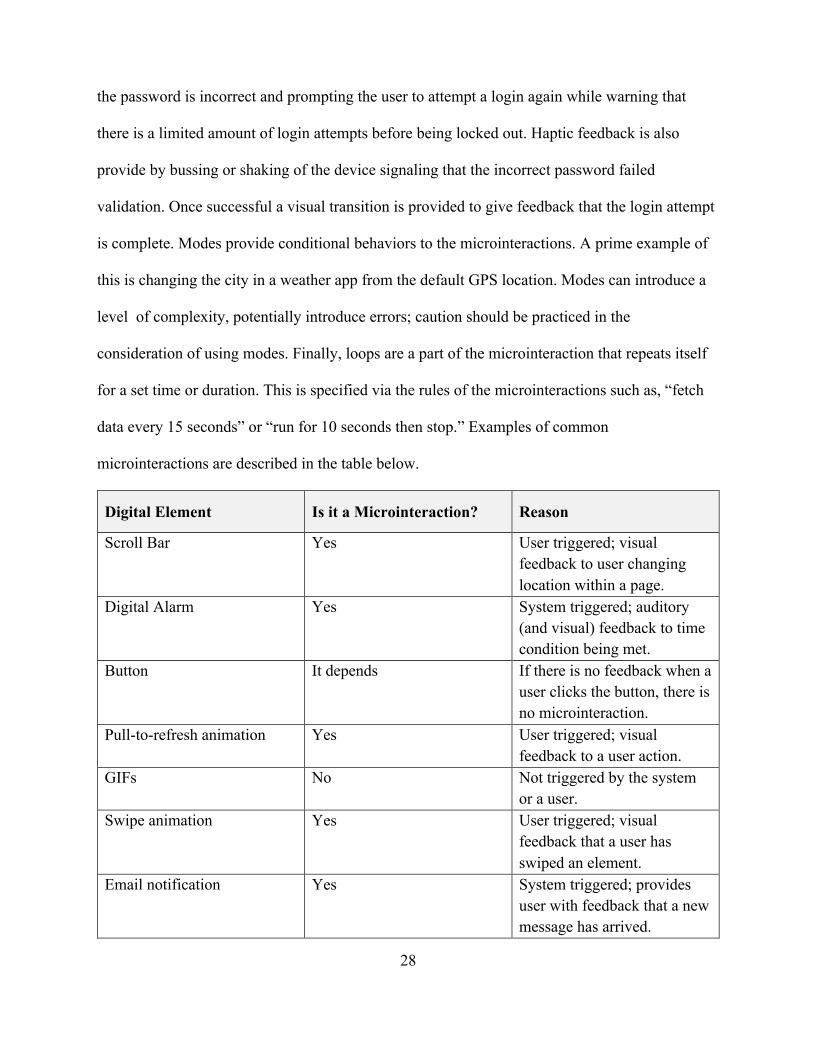
the password is incorrect and prompting the user to attempt a login again while warning that
there is a limited amount of login attempts before being locked out. Haptic feedback is also
provide by bussing or shaking of the device signaling that the incorrect password failed
validation. Once successful a visual transition is provided to give feedback that the login attempt
is complete. Modes provide conditional behaviors to the microinteractions. A prime example of
this is changing the city in a weather app from the default GPS location. Modes can introduce a
level of complexity, potentially introduce errors; caution should be practiced in the
consideration of using modes. Finally, loops are a part of the microinteraction that repeats itself
for a set time or duration. This is specified via the rules of the microinteractions such as, “fetch
data every 15 seconds” or “run for 10 seconds then stop.” Examples of common
microinteractions are described in the table below.
Digital Element Is it a Microinteraction? Reason
Scroll Bar Yes User triggered; visual feedback to user changing location within a page.
Digital Alarm Yes System triggered; auditory (and visual) feedback to time condition being met.
Button It depends If there is no feedback when a user clicks the button, there is no microinteraction.
Pull-to-refresh animation Yes User triggered; visual feedback to a user action.
GIFs No Not triggered by the system or a user.
Swipe animation Yes User triggered; visual feedback that a user has swiped an element.
Email notification Yes System triggered; provides user with feedback that a new message has arrived.

29
Video player No Feature, not a microinteraction; volume control within the video player would be a microinteraction.
Table 2-1 Examples of Microinteractions. (Nielsen Norman Group, 2018)
Microinteractions can be incorporated in three ways. First, to approach them on a case-
by-case basis. This occurs during the design process when a possible microinteraction is
identified and then transformed into a sequence that could possiby lead to a Signature Moment.
These Signature Moments are what Saffer (2013) describes as product differentiators. Perhaps
one of the most memorable microinteraction that has become a Signature Moment is the “Like”
button in Facebook. This microinteraction is often marketed as a feature and has become an icon
of brand recognition and customer loyalty. One of the challenges that Saffer (2013) emphasizes
is to keep the scope of the microinteraction limited. Designers have a tendency to want to turn
these into features. In the process of creating a microinteraction, the focus should be on doing
one thing really well, as Mies van der Rohe’s mantra reminds us “less is more.”
Second, reducing complex applications to individual products that are built around a
microinteraction. This is known as a microinteractions as a product strategy, in that the product
does one thing really well. This practice involved reducing the features and considering releasing
those as separate products (Saffer, 2013). An example of this is the original iPod. The focus is on
the Minimum Viable Product (MVP), which in turn can be a microinteraction. Third, treat
microinteractions as a set of combined or linked features that are part of a digital product (Saffer,
2013). An example of this is a software platform that performs multiple interactions separately or
in tandem. The product is the crowning result of all of these interactions working together in
30
harmony. All of the details are considered as an opportunity to exceed users’ expectations. As
Dieter Rams (Satter, 2013, p. 20) stated:
I have always had a soft spot in my heart for the details. I consider details more important
than a great draft. Nothing works without details. Details are the essentials. The standard
to measure quality by.
A guiding principle in the design process is to treat each piece of functionality, including
the entire product, as a combination of microinteractions. This approach follows the Agile
framework that has become commonplace within software development (Saffer, 2013). The
challenge remains seeing the forest despite the trees. An additional challenge is ensuring that
sufficient time is dedicated to the details of the microinteraction. As these details have the
potential to significantly improve the product; it is crucial for the designer to ensure they are
taken into consideration within the design process and communicating that to clients and
stakeholders. Microinteraction have a macro role of positively impacting the look and feel of a
product and improving the overall user experience (Joyce, 2018). They serve as a vehicle to
communicate and provide feedback to the user. They command brand loyalty and can be a
differentiator in product selection. These small details can transform something that works into
something that wows.
Emotion, Cognition, and Behavior
Emotion is central to culture, creativity, and interaction (Christian P., Crane, E., Fabri,
M., Agius, H., & Axelrod, L., 2008). As technology is advancing and platforms and interactions
are increasingly involving social engagement, emotion and affect are more relevant and needed
than ever before. Emotions impact our physiology, cognition, and value system. In researching
major theories of emotion and motivation, it can be concluded that they are generally categorized
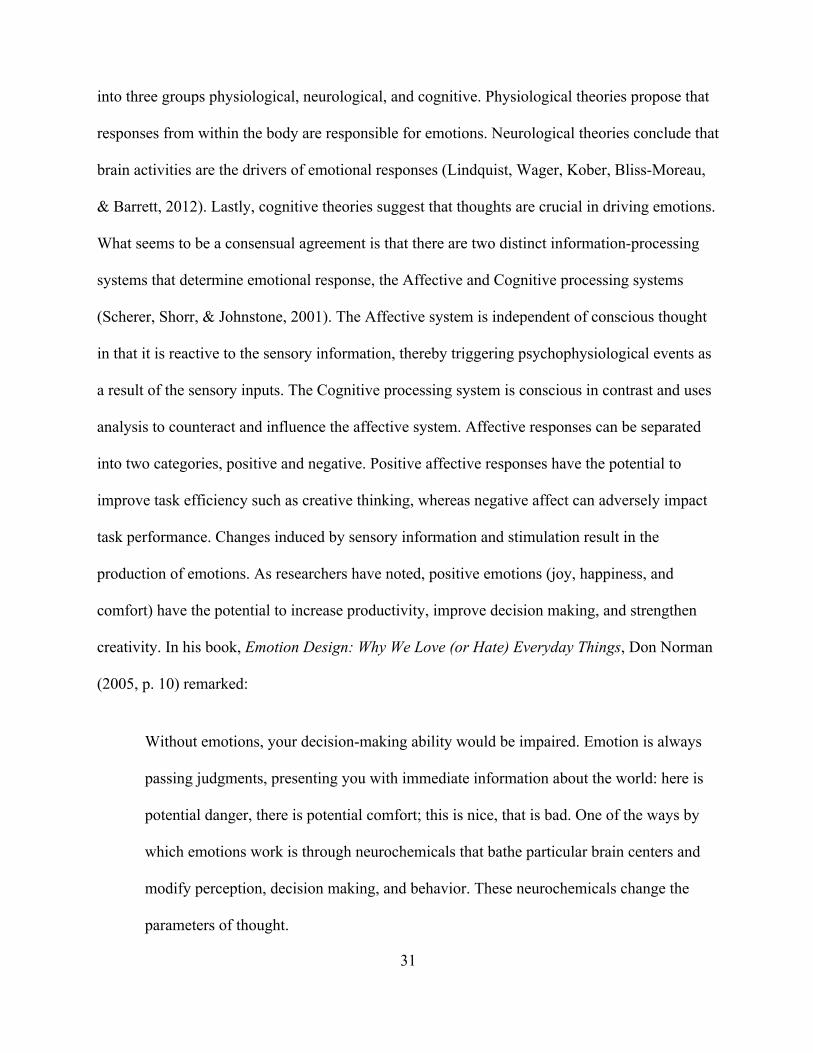
31
into three groups physiological, neurological, and cognitive. Physiological theories propose that
responses from within the body are responsible for emotions. Neurological theories conclude that
brain activities are the drivers of emotional responses (Lindquist, Wager, Kober, Bliss-Moreau,
& Barrett, 2012). Lastly, cognitive theories suggest that thoughts are crucial in driving emotions.
What seems to be a consensual agreement is that there are two distinct information-processing
systems that determine emotional response, the Affective and Cognitive processing systems
(Scherer, Shorr, & Johnstone, 2001). The Affective system is independent of conscious thought
in that it is reactive to the sensory information, thereby triggering psychophysiological events as
a result of the sensory inputs. The Cognitive processing system is conscious in contrast and uses
analysis to counteract and influence the affective system. Affective responses can be separated
into two categories, positive and negative. Positive affective responses have the potential to
improve task efficiency such as creative thinking, whereas negative affect can adversely impact
task performance. Changes induced by sensory information and stimulation result in the
production of emotions. As researchers have noted, positive emotions (joy, happiness, and
comfort) have the potential to increase productivity, improve decision making, and strengthen
creativity. In his book, Emotion Design: Why We Love (or Hate) Everyday Things, Don Norman
(2005, p. 10) remarked:
Without emotions, your decision-making ability would be impaired. Emotion is always
passing judgments, presenting you with immediate information about the world: here is
potential danger, there is potential comfort; this is nice, that is bad. One of the ways by
which emotions work is through neurochemicals that bathe particular brain centers and
modify perception, decision making, and behavior. These neurochemicals change the
parameters of thought.
32
Since cognitive and affective systems are responsible for emotional responses,
consideration into influencing these systems becomes crucial in designing interactions that
increase the likelihood of users’ enjoyment of the products/solutions and becoming loyal
customers. The correlation between user decision-making, cognition, and affect is still in its’
infancy despite research demonstrating that positive affect can significantly influences consumer
behavior (Komninos, 2018). The implications in the design process have the potential to
influence: the breadth of options a user considers, the speed in which the final decision is made,
and the emotional responses induced (Komninos, 2018). This means that strategic changes in the
interface can potentially yield significant results. Three considerations to influence positive
affect, as noted by Komninos (2018), are: visceral design changes, meaning that the strategic use
and placement of colors, shapes, and layouts have a correlation with positive affect; behavioral
level changes, how usable and useful the interface or solution is; and reflective level changes,
conscious considerations of using the interface and designing for positive affect to promote
reflective processing. These findings suggest attractive things really do work better (Norman,
2005), even if this is only the case because they make us feel better when we are using them.
The process involved in emotion, cognition, and behavior are interdependent rather than
independent of each other. When one of these systems is activated the other systems respond in
turn. Affect, cognition, and behavior have traditionally been viewed as separate and independent
processes operating casually in a linear fashion; however, current empirical research studies
support the concept that these systems are processing interdependently in tandem much like an
orchestra with each member in harmony with the other (Eysenck & Martin, 1987).

33
Affective Computing
Emotions are a fundamental part of being human. They influence our cognition,
perception of the world, learning, communication, and impact the decisions we make.
Surprisingly, technologists and engineers have ignored the value of emotion subsequently
leading towards interactions and experiences that frustrate users (Hassenzahl, 2006). This is
primarily due to misunderstanding what affect is and how to really measure it (Picard, 1997).
Historically studies on emotion and emotion expression in academic research primarily focused
on how emotion is problematic to rational thinking, until a resurgence of new research began in
the early 1990’s.
Researchers began exploring the role of emotion in multiple areas such as psychology
(Ellsworth & Scherer, 2003), neurology (LeDoux, 1996), and medicine (Damasio, 1995). Prior to
that point, emotions were primarily seen as being less valuable and impeded the decision-making
process. The emerging research revealed that emotional experiences aren’t exclusive to the mind
or brain, instead they are experienced by our whole body through hormonal changes, nervous
signals, blood flow, body postures, and facial expressions (Davidson et al., 2002). These
processes provide a body brain feedback loop that helps regulate thinking and experiences.
In studying the brain, neurologists have confirmed that emotion processing is a key part
of cognition. LeDoux (1996) observed that while emotion processes reside in the central part of
the brain; the processing runs from the frontal brain lobe to the brain stem to the body then loops
back again. Philosopher Maxine Sheets-Johnstone noted “there is a generative as well as
expressive relationship between movement and emotion [processes]” (Sheets-Johnstone, 2009, p.
41). Research notes that emotional experiences do not exclusively reside within ourselves, rather
they are spread over the social setting we are experiencing (Katz, 1999; Lutz, 1986; Lutz 1988;
34
Parkinson, 1996). Emotion is communication socially and dynamically; which is most evident
when individuals are taught how to express and process emotions in a social context. Our
emotions are influenced by our cultural and situation experiences; suggesting that emotions
affect the physical. For example, smiling results in the reciprocation and return of a smile from
another.
Figure 2-3 LeDoux’s model of fear when seeing a snake.
The resurgence of research on emotion has led to new advances in innovative technology.
In HCI, understanding the users’ emotions are crucial to be able to effectively evaluate the
products and solutions being built. Three distinct theoretical perspectives on emotion and design
have emerged in HCI. The first design approach emerged by Rosalind Picard at MIT, Affective
Computing, shortly after her groundbreaking book also titled, Affective Computing, was released
in 1997. As noted by Calvo, D'Mello, Gratch, Kappas, and Picard, (2015, p. 19):
Affective computing is a powerful and deeply important area of research, full of
extremely difficult technical, scientific, philosophical, and ethical challenges. I believe it
contains the most complex real-time problems to be solved in human–computer

35
interaction and in computer science models of human behavior and intelligence. At the
same time, the field is not merely a subset of computer science. The complexity and
challenge of giving computers real-time skills for understanding and responding
intelligently to complex naturally occurring and naturally expressed human emotion
spans many fields, including the human sciences of neuroscience, physiology, affective-
cognitive science, and psychology. Affective computing is no longer a topic to be treated
lightly, although laughter remains one of my favorite emotional expressions.
The second design approach, Affective Interaction, focuses on the culturally determined
perspective of emotion, as opposed to focusing primarily on cognition and biology. Any
interaction colored by an emotional experience could be considered an affective interaction
(Lottridge, Chignell, & Jovic, 2011). Proponents of this approach include: Phoebe Senger, Paul
Dourish, Bill Gaver, and (Boehner et al., 2007, Boehner et al. 2005, Gaver 2009, Sundström et
al. 2007, Höök, 2006, Höök 2008, Höök 2009).
Lastly, the third approach, Technology as Experience, views the focus on emotion being
singled out from the interaction leads to compromised interactions. Emotion is viewed as a part
of a larger whole of designed experiences that unifies the overall system. Proponents of this
approach include: John McCarthy, Peter Wright, Don Norman and Bill Gaver.
It should be noted that there are nuances of these approaches that overlap. All three
approaches mentioned above help increase the overall knowledge and awareness of emotion as
an integral part of the design process. With the advancement of the Affective Computing field,
we now have multiple tools to use for affective input; such as bio-sensors and facial recognition.
Affective Interaction is helping us understand the sociocultural aspects of emotion beyond just
bodily processes. The Technology as Experience is ensuring the focus on emotion processes as

36
integral to designing tools and solutions for people (Höök 2009). We are at the cusp of exciting
new disruptive affective technologies that are changing the way we view ourselves and our world
and as we embrace emotions and experiences more intently in the design process.
Biometric Sensors
Central to affective computing is the use of biometric sensors and measures to provide
insights into how the brain and body interact. Human cognitive-behavior is complex and is
influenced by a multitude of factors ranging from unconscious modulations of emotional
reactions, to decision-making based on conscious thoughts and cognition (Farnsworth, 2018).
Often these processes are unrecognized by the individual experiencing them. Biometrics are
being used to access many of these hidden processes that can give insights to the cognitive
processes of the individual making decisions. Since these processes occur rapidly, multiple
stacks of sensors and software aid in extrapolating and interpreting user affect and behavior. The
emotional and cognitive responses individuals experience are driven by factors such as arousal,
workload, and environmental conditions impacting well-being during a specific moment
(Komninos, 2018). These aspects of human behavior can be captured by using specific devices
such as: eye trackers, EEG systems, GSR, and ECG sensors. Additionally, camera-based facial
expression analysis can be used to measure emotional states and microexpressions.
Eye Tracking. One of the primary components of the biometric stack, eye tracking is a
process that involves measuring what an individual is looking at, the attention spent on a
particular area, and other eye movements that provide insights during an interaction (Farnsworth,
2018). In human behavior research, eye tracking is the only method that allows researchers to
objectively measure and quantify eye movements. This process allows researchers to understand
subconscious mental processing in individuals, which can be used to determine which aspects of
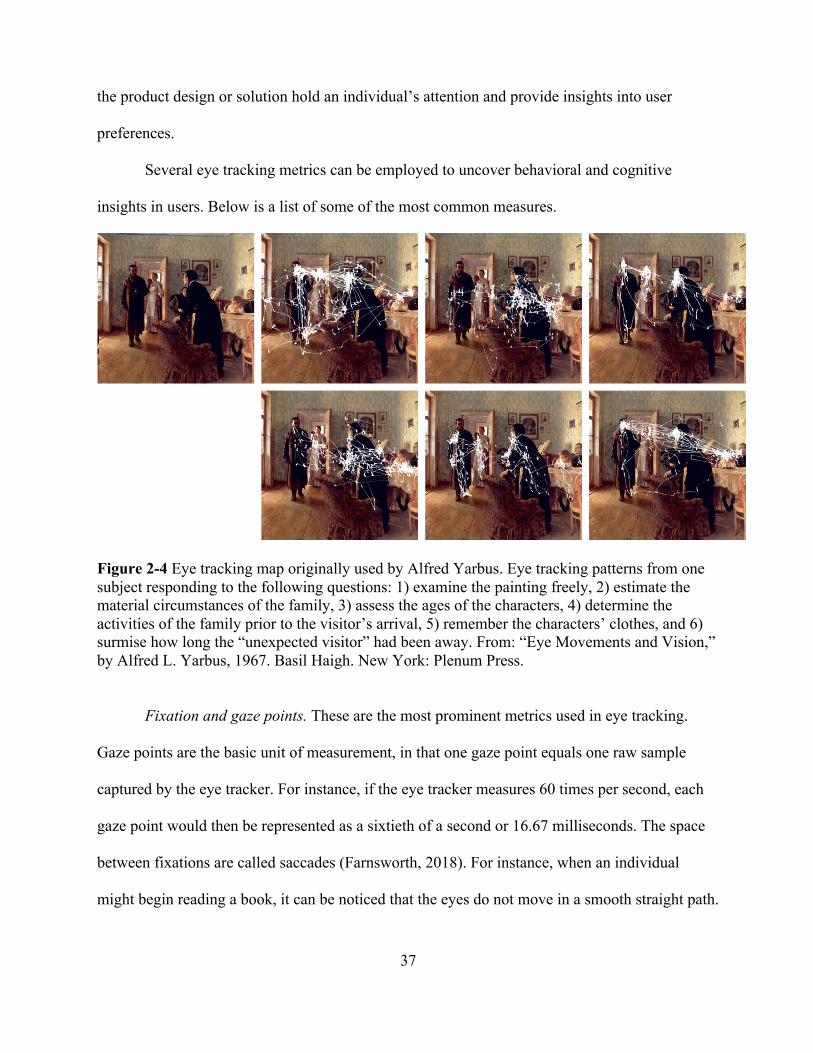
37
the product design or solution hold an individual’s attention and provide insights into user
preferences.
Several eye tracking metrics can be employed to uncover behavioral and cognitive
insights in users. Below is a list of some of the most common measures.
Figure 2-4 Eye tracking map originally used by Alfred Yarbus. Eye tracking patterns from one subject responding to the following questions: 1) examine the painting freely, 2) estimate the material circumstances of the family, 3) assess the ages of the characters, 4) determine the activities of the family prior to the visitor’s arrival, 5) remember the characters’ clothes, and 6) surmise how long the “unexpected visitor” had been away. From: “Eye Movements and Vision,” by Alfred L. Yarbus, 1967. Basil Haigh. New York: Plenum Press.
Fixation and gaze points. These are the most prominent metrics used in eye tracking.
Gaze points are the basic unit of measurement, in that one gaze point equals one raw sample
captured by the eye tracker. For instance, if the eye tracker measures 60 times per second, each
gaze point would then be represented as a sixtieth of a second or 16.67 milliseconds. The space
between fixations are called saccades (Farnsworth, 2018). For instance, when an individual
might begin reading a book, it can be noticed that the eyes do not move in a smooth straight path.
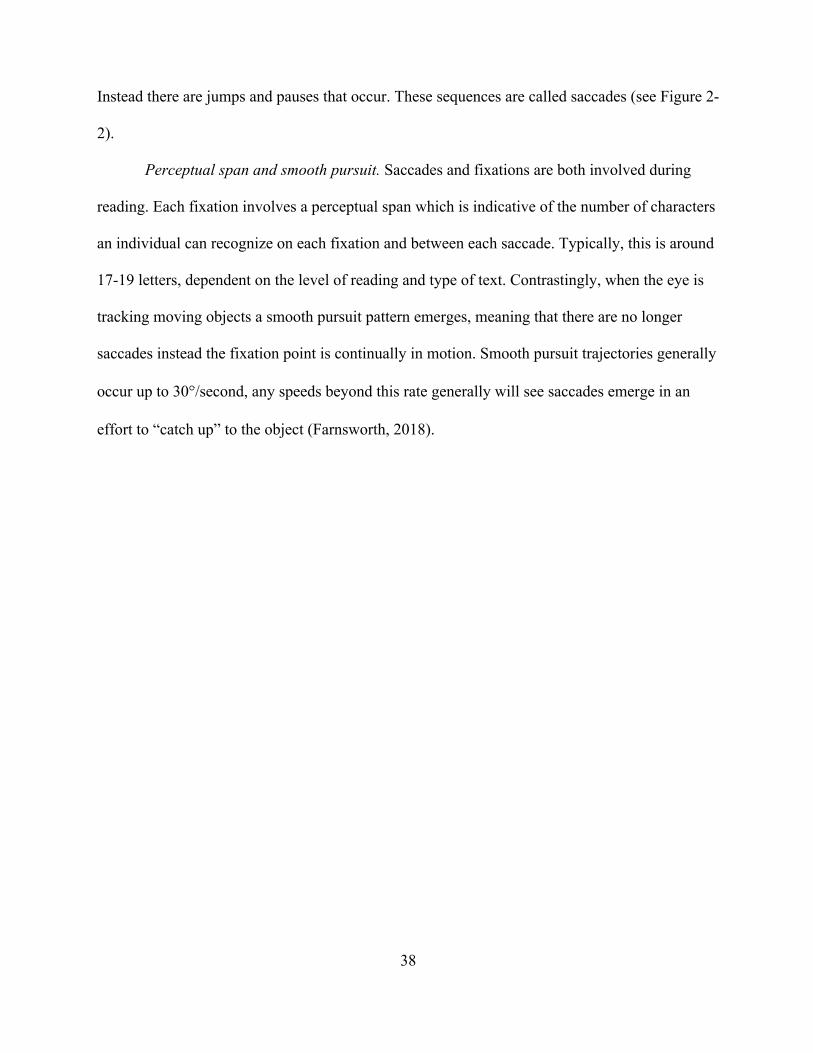
38
Instead there are jumps and pauses that occur. These sequences are called saccades (see Figure 2-
2).
Perceptual span and smooth pursuit. Saccades and fixations are both involved during
reading. Each fixation involves a perceptual span which is indicative of the number of characters
an individual can recognize on each fixation and between each saccade. Typically, this is around
17-19 letters, dependent on the level of reading and type of text. Contrastingly, when the eye is
tracking moving objects a smooth pursuit pattern emerges, meaning that there are no longer
saccades instead the fixation point is continually in motion. Smooth pursuit trajectories generally
occur up to 30°/second, any speeds beyond this rate generally will see saccades emerge in an
effort to “catch up” to the object (Farnsworth, 2018).
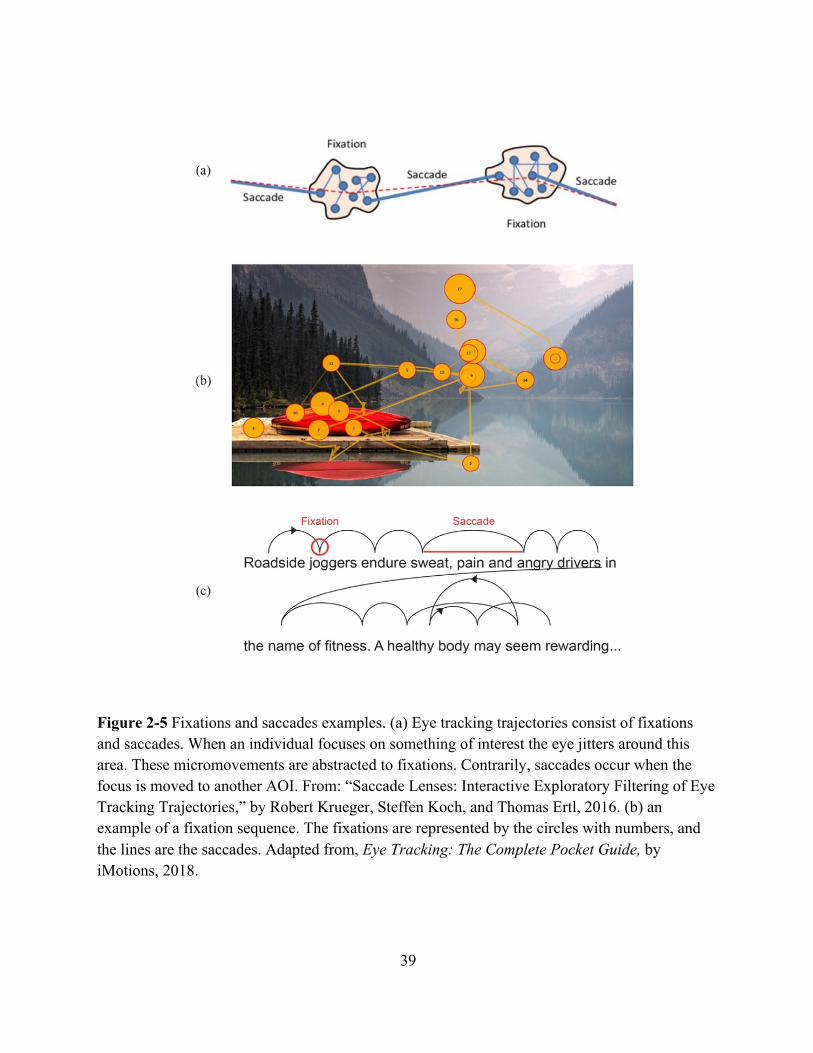
39
Figure 2-5 Fixations and saccades examples. (a) Eye tracking trajectories consist of fixations and saccades. When an individual focuses on something of interest the eye jitters around this area. These micromovements are abstracted to fixations. Contrarily, saccades occur when the focus is moved to another AOI. From: “Saccade Lenses: Interactive Exploratory Filtering of Eye Tracking Trajectories,” by Robert Krueger, Steffen Koch, and Thomas Ertl, 2016. (b) an example of a fixation sequence. The fixations are represented by the circles with numbers, and the lines are the saccades. Adapted from, Eye Tracking: The Complete Pocket Guide, by iMotions, 2018.
40
Heat Maps. These can be static or dynamic aggregations of the gaze points and fixations.
They are extremely helpful in demonstrating where visual attention has been focused. Heat maps
can confirm which areas or elements of the stimulus were able to draw attention. A high number
of gaze points is illustrated in red while decreasing levels shift to orange, yellow, green, and
finally blue; indicating colder or less gazed on areas. Areas without color suggest that little to no
attention was held.
Figure 2-6 Heatmaps in various applications. This figure contains 3 images that show where users directed their attention the most as represented in red, yellow, and green as the primary areas of interest. Adapted from, Eye Tracking: The Complete Pocket Guide, by iMotions, 2018.
Areas of Interest (AOI). These are areas of the interface that are strategically defined for
their value of potential interest to the user. Collecting metrics for separate AOIs can be helpful in
evaluating performance of multiple points of interests within the interface and can be better used
for comparative statistical analysis (Farnsworth, 2018).

41
Figure 2-7 Area of Interest (AOI) with KPI metrics (left image). Fixation sequences (right image).
Fixation Sequences. This is a metric that is based on where the user looks and how much
time is spent in that area. A fixation position (where?) and timing information (when?) are
needed to generate the sequences. This provides insights into where the user looked first, second,
third, and so on. This is an indicator of what stands out or is of interest to the user.
Time to First Fixation (TTFF). The amount of time for a user to look at the specific AOI
from the initial start. Regardless of whether the user looks at the AOI from the top or the bottom,
this provides insights to the research as to what elements caught the user’s attention.
Time Spent. This quantifies the amount of time users spend looking at an AOI. Users will
filter out other stimuli in the visual periphery when they have found what they are looking for.
The amount of time spent on a particular area can indicate the level of interest.
Respondent Count. This is an indicator of the number of users that shifted their gaze to a
specific AOI. The higher the count indicates that the stimulus receives a lot of attention, while a
low count shows that little attention is paid to it.
42
Pupil Size: Dilation/Constriction. The increase in pupil size is a dilation and the decrease
in size is a constriction. Pupil size is most impacted by ambient light. When light can be
accounted for, then other attributes from pupil size changes can be derived. Two specific
properties are emotional arousal, meaning the amount of emotional valence or engagement; and
cognitive workload, meaning how taxing or mentally exhausting the stimulus is.
Distance to the Screen. An additional useful measure is the distance from the screen
relative to the user. Leaning forward or backwards can be an indicator of approach-avoidance
behavior, however this is very subjective and special attention to the specifics of the interface
need to be considered when interpreting the data.
Galvanic Skin Response. The average human adult has 21 square feet of skin which
goes through a process of renewal every 28 days. In addition to the regeneration and regrowth,
the skin also reveals information on how we are feeling when exposed to emotional stimuli.
When an individual is stressed, excited, feeling anxious, or sad, the electrical conductivity of the
skin changes in response to the feeling. Galvanic Skin Response (GSR), or Electrodermal
Activity (EDA), sometimes also referred to as Skin Conductance (SC) monitors electrical
activity on the skins surface in response to emotional and physiological arousal. This process
allows researchers the ability to gain insights and perspectives into an individual’s subconscious
arousal when an emotional stimulus is introduced. GSR measures the amount of moisture
secreted from pores towards the skin surface. The change of positive and negative ion balance
allows for electrical current flows to be more rapid. Increased skin conductance = decreased skin
resistance. GSR activity is generally measured in “micro-Siemens” (µS) or “micro-Mho” (µM).
Emotional experiences trigger changes in the autonomic nervous system. Exposure to emotional
stimuli such as a spider in front of a person could induce fear, which in turn would cause an

43
increase in sweat secretion which would be measurable on the electrodermal activity. The
amount of sweat measured most of the time is microscopic and not always visible to the eye.
These processes are triggered automatically by the body’s response to stimuli.
Figure 2-8 Various devices used to measure GSR.
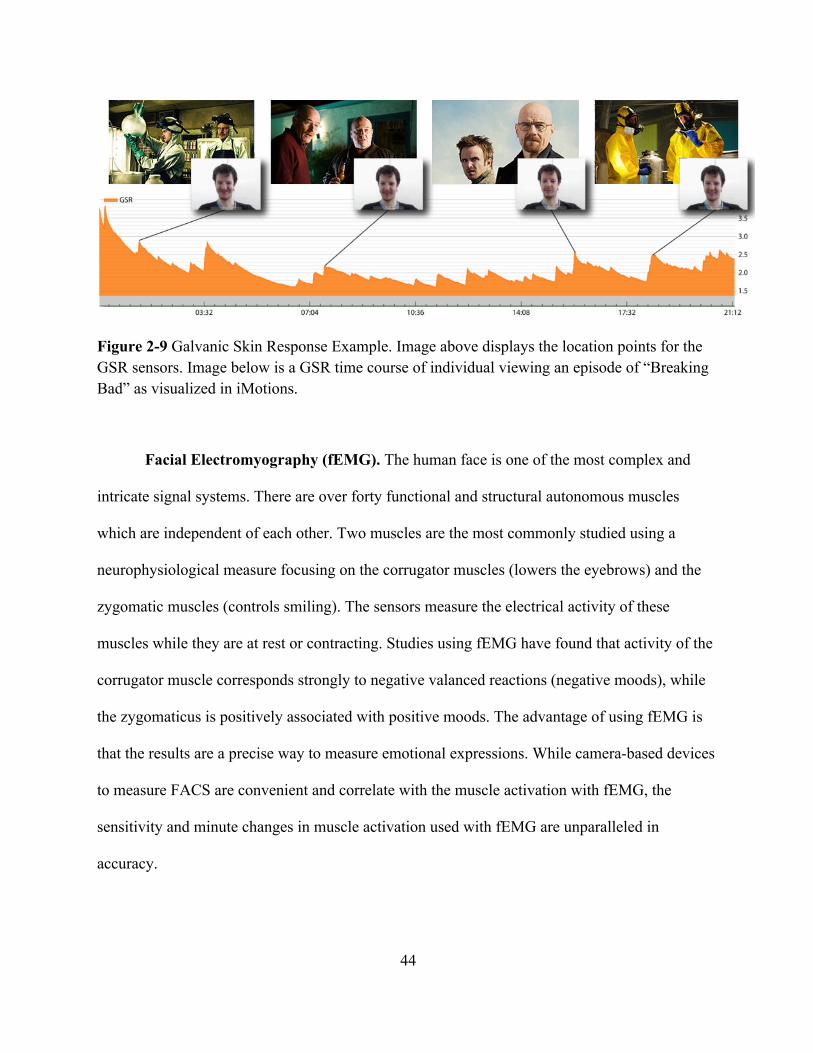
44
Figure 2-9 Galvanic Skin Response Example. Image above displays the location points for the GSR sensors. Image below is a GSR time course of individual viewing an episode of “Breaking Bad” as visualized in iMotions.
Facial Electromyography (fEMG). The human face is one of the most complex and
intricate signal systems. There are over forty functional and structural autonomous muscles
which are independent of each other. Two muscles are the most commonly studied using a
neurophysiological measure focusing on the corrugator muscles (lowers the eyebrows) and the
zygomatic muscles (controls smiling). The sensors measure the electrical activity of these
muscles while they are at rest or contracting. Studies using fEMG have found that activity of the
corrugator muscle corresponds strongly to negative valanced reactions (negative moods), while
the zygomaticus is positively associated with positive moods. The advantage of using fEMG is
that the results are a precise way to measure emotional expressions. While camera-based devices
to measure FACS are convenient and correlate with the muscle activation with fEMG, the
sensitivity and minute changes in muscle activation used with fEMG are unparalleled in
accuracy.

45
Figure 2-10 Muscles of the face used in Facial Electromyograph (fEMG).
Elementary Emotions
Muscles Involved Associated Actions in BMS
Joy Orbicularis oculi Zygomaticus major
Eye closure Smile
Surprise Frontalis Levator palpebrae superioris
Brow raise Brow furrow Eye widen
Fear Frontalis Corrugator supercilia Levator palpebrae superioris
Brow raise Brow furrow Eye widen
Anger Corrugator supercilia Levator palpebrae superioris Orbicularis oculi
Brow furrow Eye widen Closing eyelids
Sadness Frontalis Corrugator supercilia Depressor anguli oris
Brow raise Brow furrow Lip corner depressor
Disgust Levator labii superios Levaror labii superioris alaeque nasi
Uper lip raise Upper lip raise & nose wrinkle
Table 2-2 Table of muscles involved in fEMG

46
The benefits of using fEMG is that it is a non-invasive, precise, sensitive way to
continually measure facial muscle activity. Additionally, it is not dependent on language and
does not require cognitive effort or memory. fEMG is sensitive and can measure subtle muscle
activity even when users are told to mask their emotional expression.
There are some limitations of fEMG requiring electrodes and other hardware devices. As
a result, it can appear intrusive and heighten the user’s awareness of what is being measured.
Since it is highly sensitive, this can be impacted by electrical interference and other stimuli.
Above all, the analysis of fEMG requires expert biosensor processing skills.
Figure 2-11 Biosensor processing pipeline for fEMG
Facial Action Coding System (FACS). One of the most influential methods to
objectively code facial behavior, based on the work of Carl-Herman Hjortsjö, Paul Ekman, and
Wallace V. Friesen. Their approach represents a complete standardized classification of facial
expressions based on anatomic features. Experts typically observe videos of the individual
muscles or groups of muscles combination as components called Action Units (AUs). All facial
expressions can be simplified into their constituent AUs. If facial expressions were words, AUs
are the letters that make up those words (iMotions, 2018). Facial action unit coding provides the
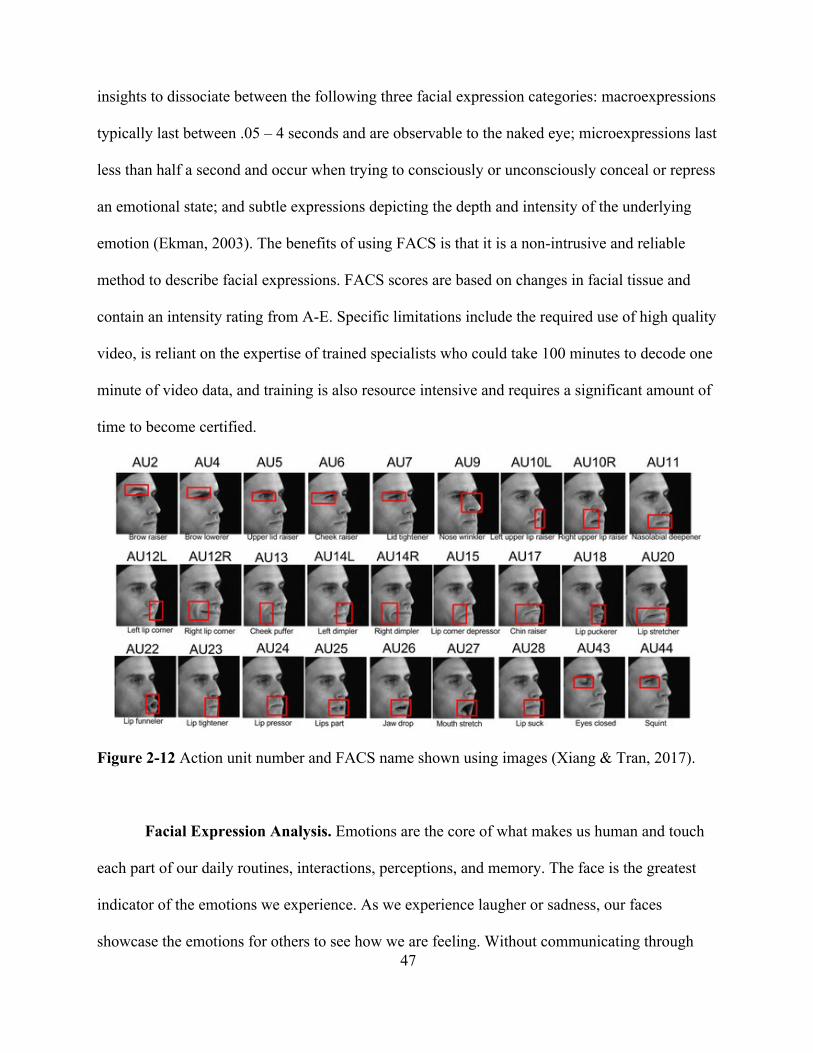
47
insights to dissociate between the following three facial expression categories: macroexpressions
typically last between .05 – 4 seconds and are observable to the naked eye; microexpressions last
less than half a second and occur when trying to consciously or unconsciously conceal or repress
an emotional state; and subtle expressions depicting the depth and intensity of the underlying
emotion (Ekman, 2003). The benefits of using FACS is that it is a non-intrusive and reliable
method to describe facial expressions. FACS scores are based on changes in facial tissue and
contain an intensity rating from A-E. Specific limitations include the required use of high quality
video, is reliant on the expertise of trained specialists who could take 100 minutes to decode one
minute of video data, and training is also resource intensive and requires a significant amount of
time to become certified.
Figure 2-12 Action unit number and FACS name shown using images (Xiang & Tran, 2017).
Facial Expression Analysis. Emotions are the core of what makes us human and touch
each part of our daily routines, interactions, perceptions, and memory. The face is the greatest
indicator of the emotions we experience. As we experience laugher or sadness, our faces
showcase the emotions for others to see how we are feeling. Without communicating through

48
words, our faces can reveal our inner emotions. Most of the facial muscles are innervated by one
nerve referred to as the facial nerve or the VII cranial nerve. We are able to produce thousands of
variations of expressions, however there is only a small set of distinctive facial configurations
that almost everyone recognizes regardless of age, race, culture, or language. These are: anger,
fear, sadness, happiness, disgust, and surprise (iMotions Global, 2016).
Facial expressions can be collected and analyzed in three various ways. First by tracking
the fEMG activity, second by observing and manually coding facial activity live, and finally by
automatic facial expression analysis using computer-vision algorithms. Through using the fEMG
concepts and the FACS system in tandem with machine learning algorithms and computer
vision, we are able to analyze and interpret which potential emotions a user is experiencing based
on the facial expressions in the databases that have been gathered. This is done by the use of
cameras that can be embedded on laptops and cell phones or mounted in front of candidates to
capture video of respondent’s expressions in real-time. Most of the emotion recognition engines
follow these steps: Face detection, the face is found in a video or image typically by applying
the Viola Jones Cascaded Classifier algorithm, much like the way a smart phone camera is able
to track a face by the outline of a square. Feature Detection, once the face has been identified
then key landmarks such as eyes, brows, and mouths are detected. This is like a virtual mesh
being placed on the face. Feature Classification, once the face model is available, orientation
and position information are fed into the classification algorithms translating them into Action
Unit codes, emotional states, and additional affective metrics (iMotions Global, 2016).

49
Figure 2-13 Visual representation of facial expression analysis
Figure 2-14 Emotional arousal from respondents watching a 4-minute trailer. Varying emotional arousal levels are detected as the scene unfolds.
Automatic facial expression analysis provides several metrics and scores for facial
expressions. These scores and metrics are considered detectors in that they reflect zero when the
expression is absent to a score of 100 when the expression is fully present. A popular facial
expression engine is Affectiva AFFDEX which contains a robust database of emotions and
human perceptions. Facial expression analysis makes it possible to gain real-time metrics and
data that would have taken hundreds of hours to analyze traditionally (iMotions Global, 2016).
ECG/PPG. Of all our organs, the heart is perhaps awe inspiring. Consistently pumping
and suppling the body with blood throughout a lifespan. An average person at 79 years of age
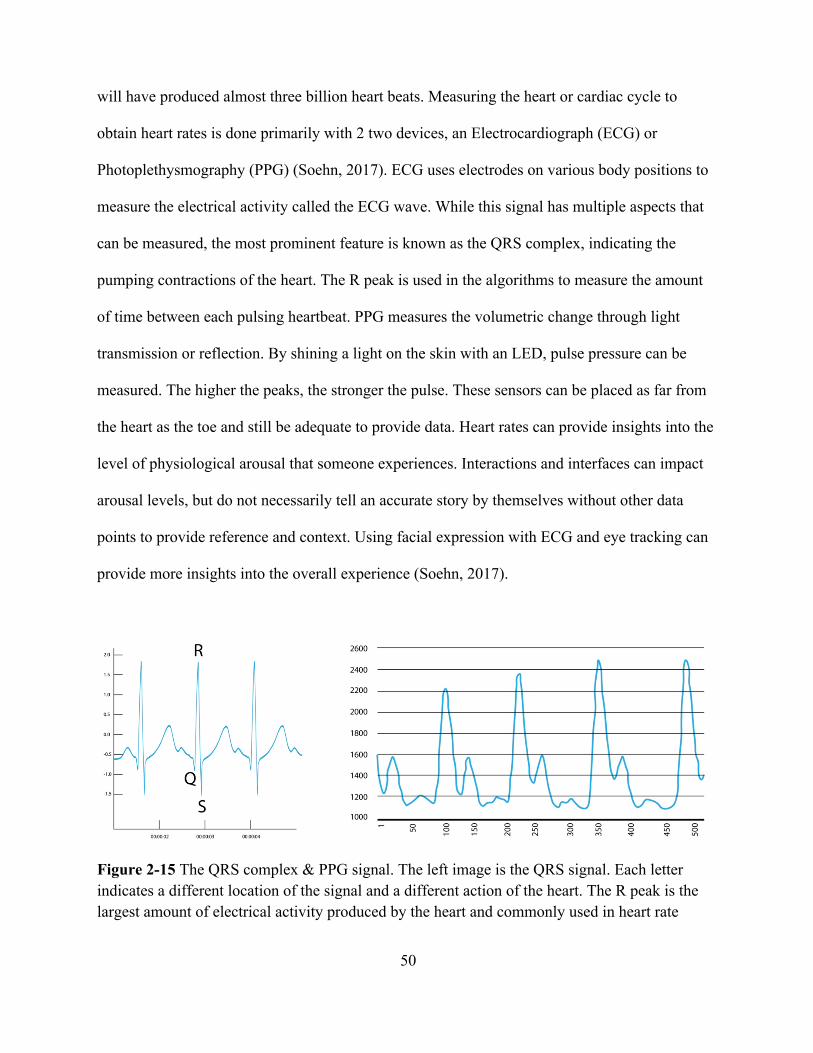
50
will have produced almost three billion heart beats. Measuring the heart or cardiac cycle to
obtain heart rates is done primarily with 2 two devices, an Electrocardiograph (ECG) or
Photoplethysmography (PPG) (Soehn, 2017). ECG uses electrodes on various body positions to
measure the electrical activity called the ECG wave. While this signal has multiple aspects that
can be measured, the most prominent feature is known as the QRS complex, indicating the
pumping contractions of the heart. The R peak is used in the algorithms to measure the amount
of time between each pulsing heartbeat. PPG measures the volumetric change through light
transmission or reflection. By shining a light on the skin with an LED, pulse pressure can be
measured. The higher the peaks, the stronger the pulse. These sensors can be placed as far from
the heart as the toe and still be adequate to provide data. Heart rates can provide insights into the
level of physiological arousal that someone experiences. Interactions and interfaces can impact
arousal levels, but do not necessarily tell an accurate story by themselves without other data
points to provide reference and context. Using facial expression with ECG and eye tracking can
provide more insights into the overall experience (Soehn, 2017).
Figure 2-15 The QRS complex & PPG signal. The left image is the QRS signal. Each letter indicates a different location of the signal and a different action of the heart. The R peak is the largest amount of electrical activity produced by the heart and commonly used in heart rate
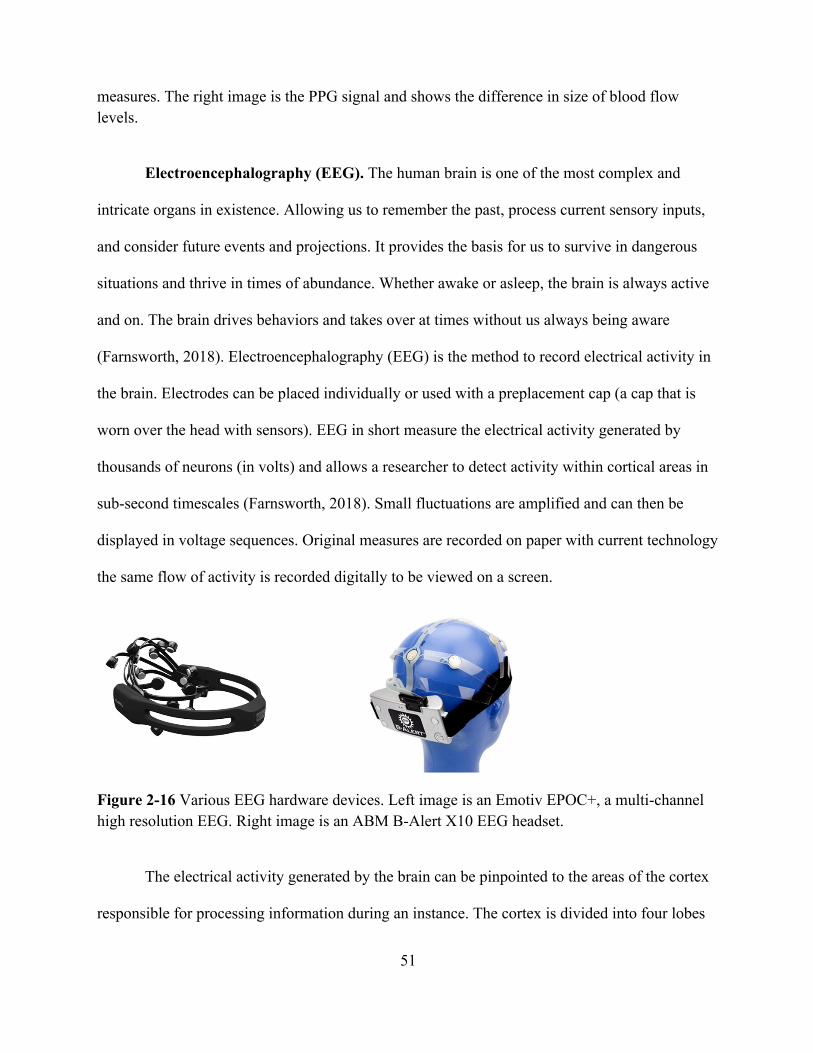
51
measures. The right image is the PPG signal and shows the difference in size of blood flow levels.
Electroencephalography (EEG). The human brain is one of the most complex and
intricate organs in existence. Allowing us to remember the past, process current sensory inputs,
and consider future events and projections. It provides the basis for us to survive in dangerous
situations and thrive in times of abundance. Whether awake or asleep, the brain is always active
and on. The brain drives behaviors and takes over at times without us always being aware
(Farnsworth, 2018). Electroencephalography (EEG) is the method to record electrical activity in
the brain. Electrodes can be placed individually or used with a preplacement cap (a cap that is
worn over the head with sensors). EEG in short measure the electrical activity generated by
thousands of neurons (in volts) and allows a researcher to detect activity within cortical areas in
sub-second timescales (Farnsworth, 2018). Small fluctuations are amplified and can then be
displayed in voltage sequences. Original measures are recorded on paper with current technology
the same flow of activity is recorded digitally to be viewed on a screen.
Figure 2-16 Various EEG hardware devices. Left image is an Emotiv EPOC+, a multi-channel high resolution EEG. Right image is an ABM B-Alert X10 EEG headset.
The electrical activity generated by the brain can be pinpointed to the areas of the cortex
responsible for processing information during an instance. The cortex is divided into four lobes
52
(occipital, parietal, temporal, and frontal) that are responsible for processing different types of
sensory inputs. The occipital cortex is primarily responsible for visual information and any EEG
research dealing with visual will focus on this area. The parietal cortex is primarily responsible
for motor functions, such as tasks and prioritizations of tasks. The temporal cortex is responsible
for language processing and speech. Finally, the frontal cortex handles executive functions and
helps maintain control for planning and assessment (Farnsworth, 2018).
When the brain is in a certain state, the frequency patterns change providing insights into
the cognitive processes. The brain wave frequencies are divided into the following waves: delta,
theta, alpha, beta, and gamma. Delta (1-4Hz) typically deals with the depth of sleep and
concentration of internal working memory (Harmony, 2013). Theta (4-7 Hz) is associated with
memory encoding and retrieval in addition to workload. It is also associated with increased
fatigue levels (Craig, Tran & Nguyen, 2012). Alpha (7-12 Hz) is associated with calm states of
relaxation. Closing our eyes can bring a calm state because alpha waves take over (Klimesch,
2012). Beta (12-30 Hz) is associated with executive movements of body parts and are noticeable
when we observe bodily movements of other people. There is a “mirror neuron system” in the
brain coordinated by beta frequencies (Farnsworth, 2018; Takahashi, Saleh, Penn, &
Hatsopoulos, 2011). Gamma (30-50 Hz) is considered by some researchers to facilitate data
between brain regions (Farnsworth, 2018; Jia & Kohn, 2011). Others have associated it with fast
eye movements or micro-saccades, integral to processing and information uptake (Yuval-
Greenberg, Tomer, Keren, Nelken & Deouell, 2008). EEG analyzation can be challenging and
can require a certain level of expertise and experience to correctly identify and extract valuable
information from the collected data.

53
Measuring Experience
In the prior section biometric sensors and the concept of measuring user behavior and
emotions were introduced. These measures can provide deeper insights into the user experience,
which is often easy to miss, traditionally unmeasurable, and can be challenging to consistently
and accurately measure. Before any user metrics are conducted there needs to be a foundational
understanding of the organizational key performance indictors (KPIs) that contribute to the
success of the product and organization. Several interactive products software applications such
as: SUPR-Q, SUS, TAM, and UMUX-Lite can be integrated to solicit user perception of the
product and brand. While it is noted that the extensibility of UX metrics can be a study in itself,
this section is intended to briefly summarize the core concept and priorities of measuring user
experience. Inspired from the Six Sigma DMAIC (Define, Measure, Analyze, Improve, and
Control) methodology, a cyclical process that ensures maximal results, the chart below provides
a framework for evaluating and improving user experiences (Sauro, 2015).
Figure 2-17 Framework for evaluating User Experience
The framework ensures that the correct metrics are used with the right users to measure
what matters. This has the potential for an environment where pixels to profits can be realized
while understanding what users think and do (Suaro, 2015). An example of understanding what
users think versus what they do and the KPI used can be seen in the prior section on eye tracking.
One of the most common measure in eye tracking are heatmaps. A heatmap is a graphical

54
representation of data that show the most looked at or popular (hot) and unpopular (cold) of a
locations on a website page. Viewing the collective user data provides a quick at-a-glance visual
representation of how users interact with the web page. While this is one of hundreds of UX
measures, the relationship between heat maps and buttons or Call to Actions (CTAs) can help the
design team determine if users are making the intended action on the page. For example, if the
company metric was to receive 1,000 subscriptions on a CTA button, the heatmap data from eye
tracking would be directly correlated to that company KPI. Being able to relate and connect
company KPI’s and UX measures allows for a more robust way of knowing the users’ WHY and
being able to provide better user experiences.
Measuring UX helps designers and leaders make better decisions (Tullis & Albert,
2013). Without these metrics critical questions about meeting the users’ needs would not be
answerable or known. Some of the central guiding questions most research metrics attempt to
answer are: Will the users recommend the product? Is this new product more efficient to use than
the current product? How does the user experience of this product compare to the
competition? Do the users feel good about the product or themselves after using it? What are the
most significant usability problems with this product? Are improvements being made from one
design iteration to the next? Gaining insights to these questions from biometric sensors can help
provide insights into the relationship between user and product and improve decisions that
designers and stakeholders make to improve the user experience while strengthening brand
loyalty.
Ethical Considerations in UX Research
It is projected that by 2020 there will be approximately 200,000 billion connected digital
devices in the world, hence our lives are infused with technology (Shamonsky, 2018). As a UX
55
professional it becomes imperative to have a set of guiding ethical standards given the potential
social and global impact of UX design. Recent issues of fake news, addictive behaviors in
technology, and social isolation have raised concerns about the potential weaponization of social
media and the need to have structure and policies for its use in place (Shamonsky, 2018).
As biometric technology is growing rampantly, ethical concerns with privacy, collection,
storage, and use are more relevant than ever (Chinchilla, 2012). Civil liberty organizations have
taken interest in the conversation as the implications of the technology impact societal and
human rights for privacy and anonymity (Shaikh, 2018). Researchers have noted the complex
environment and intersection of corporate policy, coding implementation, and design integration
and where accountability resides. While the UX profession is still relatively new compared to
older professions with established and proven ethical frameworks; according to Dr. Shamonsky
(2018) in her discussion on Developing a Code of Ethics for UX Design, the speed, reach, and
influence of the work has the potential to be pervasive. Many of the UX organizations provide
guidelines and ethical considerations for their members such as: acting in the best interest of
everyone; being honest; doing no harm and when possible providing benefits; acting with
integrity; avoiding conflicts of interest; respecting privacy, confidentiality, and anonymity; and
providing all resultant data (UXPA, 2016). These ethical principles are foundational for UX
professionals and invite UX professionals to be active evaluators of the potential risks and
benefits of their actions. As UX designers and researchers often collaborate with stakeholders,
departments, and leaders across the organization, a challenge that remains relevant is ensuring
the entire organization is committed to the broader scope of ethical practices with interactive
technology. California’s Palo Alto based think tank, Institute for the Future, recently released an
Ethical OS (operating system) with the aim to link larger technology companies and researchers
interested in studying the impact of technology’s increasing impact on society (Shamonsky,

56
n.d.). One of the unique approaches of the Ethical OS is using a series of questions to spark
conversation rather that have an explicit set of guidelines. While the application is not exclusive
or specific to UX, the approach is flexible enough to apply to any technology-based organization
which could make adoption and conversation more universal across the HCI field.
Most interactive technologies are designed with the best intentions. However, all bets are
off once released and scaled. The Ethical OS risk mitigation manual presents eight risk zones
identified as “hard-to-anticipate and unwelcome consequences” that are likely to emerge from
interactive technologies (Institute for the Future and Omidyar Network, 2018). A review of these
core areas is designed to facilitate conversations within teams and organizations. This process
leans towards incorporating the findings into the product design requirements and developing a
checklist of ways to anticipate and mitigate potential ethical risks rather than be blindsided by
not actively being more prepared.

57
Figure 2-18 Ethical OS 8 Risk Zones. (Institute for the Future and Omidyar Network, 2018)
Some of the considerations from the Ethical OS questions below are intended to start
conversations with stakeholders and peers within organizations that develop interactive
technology.
Ethical OS Questions
How could your product, service or business most positively impact the world you want to see? Beyond the problem you’re trying to solve, how will the world be better for having this innovation introduced?
Could your product or product feature harm someone directly? Consider not only the first-order consequences but try to imagine the second- and third-order as well. Could a malicious actor use your product or product feature to harm a person or group? Commit a crime?

58
Could the business model behind your product harm someone or a group of people? Could it fuel addiction? Could it impact certain groups—children, seniors, minority groups, the disenfranchised or disempowered—in different ways.
Could your product risk someone’s privacy? What happens if someone’s data gets leaked, hacked, or lost? Do you have a plan in place for these contingencies? How can you best build trust with your users?
Could your product or business do anything your users are unaware of? If so, why are you not sharing this information explicitly? Would it pose a risk to your business if it showed up in tomorrow’s news?
What can or should you do as a board to ensure your company lives up to the best version of itself?
Table 2-3 Ethical OS Cliff Notes. Institute for the Future and Omidyar Network (2018).
Ethical thinking is critical to UX design and requires active participation in conversations
about the impact and consequences of design decisions. Perhaps most importantly is the
commitment to knowing and seeking to understand what the hidden, unintended consequences
that could emerge as a result of the interactions designed.
Summary
The review of the literature in this chapter examined the scope of the field of Human
Computing Interaction and the emergent field of User Experience; reaching beyond usability and
extending to emotion and enjoyment. The concept of Human Centered Design and the
transcendent qualities of product design by comprehensively understanding the why, what, and
how of the users’ needs were explained. A review was presented on the relationship between
enhanced user experiences and the history and purpose of microinteractions in accomplishing
tasks effectively while delighting users. Emotion, cognition and behavior theories, and
advancements were reviewed. A brief history of affective computing was introduced. Human

59
cognitive-behavior and emotion biometric sensors such as: eye tracking, GSR, fEMG, FACS,
facial expression analysis, ECG/PPG, and EEG were reviewed for their use and impact on
measuring emotion to improve user experiences. Ethical thinking and considerations for
interactive technologies and their impact socially and globally were discussed. Few studies exist
on improving the user experience with real-time biometrics through the use of microinteractions.
The intent of this study proposes to contribute to the overall body of knowledge. Chapter Three
presents the methodology and procedures used for this study, the sample population, and the
methods used for data collection and analysis.

60
Chapter 3 : Methods
Microinteractions are an exercise in restraint, in doing as much as possible with as little as
possible. Embrace the constraints and focus your attention on doing one thing well. Mies van der
Rohe’s mantra of “less is more” should be the microinteraction designer’s mantra as well.
― Dan Saffer, Microinteractions: Designing with Details (2013, p. 19)
The purpose of this convergent mixed-method study is: determine how biometrics can be
incorporated in the design process to measure efficacy of design and user experience,
determining which emotional data metrics to use to strengthen a brand, measuring the impact of
microinteractions on user habits and behaviors, and discussing UX ethical guidelines and
considerations to safeguard and protect users. Quantitative data was gathered and analyzed using
biometric sensors and facial recognition software to identify affect and inferences. Qualitative
data was used to identify themes and patterns. A heuristic review of the interface was conducted.
Additionally, online surveys were administered to design and agency representatives to identify
trends and patterns within the industry. It is intended that the research findings will contribute to
the development of a framework or toolkit designed to support designers and researchers in their
delivery of digital and interactive assets.
Purpose of Research
The purpose of this convergent mixed-method study is to determine how biometrics can
be incorporated into the design process to measure efficacy of designs and user experience,
determining which emotional data metrics to use to strengthen a brand, measuring the impact of
microinteractions on user habits and behaviors, and discussing UX ethical guidelines and
considerations to safeguard and protect users. Quantitative data will be gathered and analyzed
61
using biometric sensors and facial recognition software to identify affect and inferences.
Qualitative data will be used to identify themes and patterns. A heuristic review of the interface
will be conducted. Additionally, online surveys were administered to both design and agency
representatives to identify trends and patterns within the industry. It is intended that the research
findings will contribute to the development of a framework or toolkit designed to support
designers and researchers in their delivery of digital and interactive assets.
Research Question
The overall central guiding question in this study was: How can biometrics be integrated
into the design process to validate creative assets and improve user experience? This research
question will be addressed through exploration of three topics 1.) measurement of emotion in
relationship to the overall brand 2.) the role of microinteractions and user behavior 3.) and
ethical guidelines and considerations. These specific sub-questions are:
1. What emotional data metrics can be used to measure content for relevance and
engagement, build trust, and strengthen a brand?
2. What is the efficacy of microinteractions to form habits and changes in user behavior?
3. What UX ethical guidelines and considerations can be incorporated into the design
process to safeguard and protect a user’s privacy and well-being?
These sub-questions are relevant to the central guiding question in that they may have an impact
on how to effectively integrate biometrics into the design process, what factors and key
indicators have an impact on the affinity of a brand, as well as what current ethical
considerations could be used to provide high standards of privacy and user well-being.

62
Research Design
The study utilized a convergent mixed methods design, with the intent of gaining an
understanding of user’s preferences and frustrations in interactive systems using
microinteractions. Creswell (2009) describes convergent design as follows: “the basic idea is to
compare the two results with the intent of obtaining a more complete understanding of a
problem, to validate one set of findings with the other, or to determine if participants respond in
a similar way” (p. 65). The results of the research are reported in Chapter 4.
Rationale for Convergent Mixed Methods Approach
For the purpose of this research a convergent mixed method approach was used. This
provided the researcher the ability to collect and analyze two separate databases—quantitative
and qualitative—then merging the two databases in order to compare or contrast them (Creswell,
2011). This approach provides different but complementary data that is directly related to the
research topic. The design incorporates the strengths of both qualitative and quantitative datasets
and assists in providing a more complete understanding of the research problem. An additional
benefit of utilizing this approach allows the researcher to collect both types of data in one visit
thereby increasing time efficiency and gleaning increased insights from participants (Creswell &
Plano Clark 2011; Plano Clark & Ivankova 2016). Furthermore, in order to confirm and validate
the results from the biometric sensors and inferences, the qualitative feedback from participants
helps ensure that the results are in alignment with the collected sensor data.
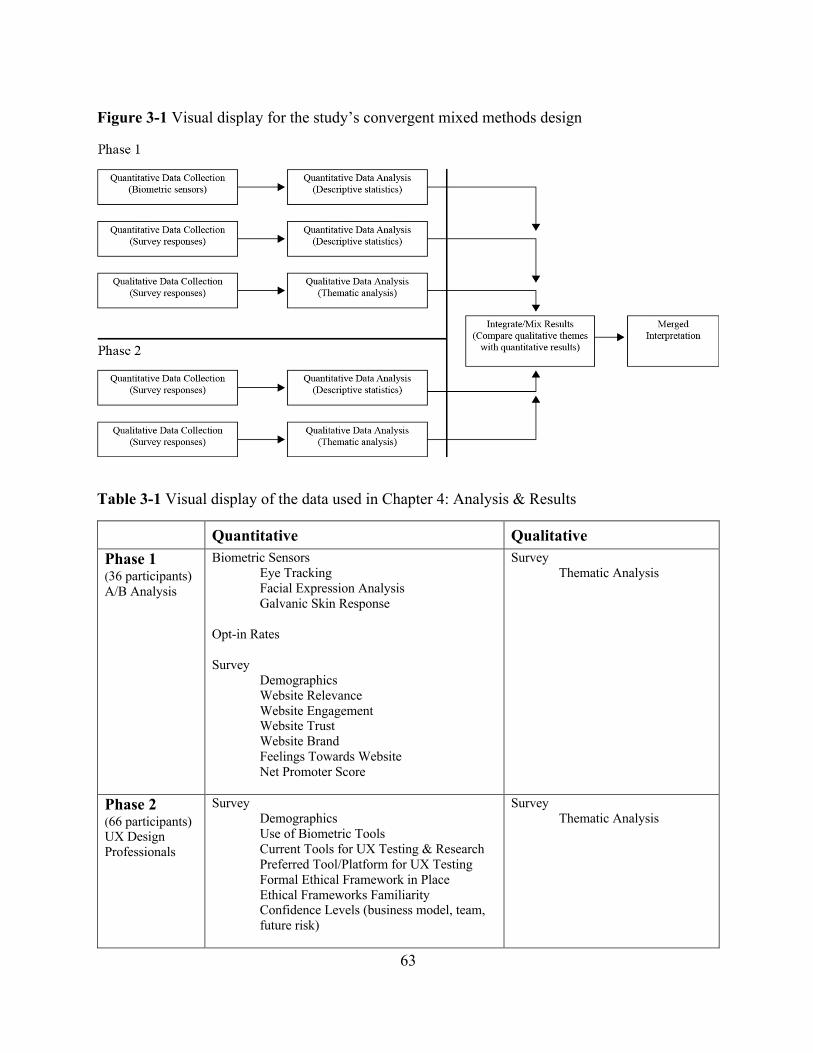
63
Figure 3-1 Visual display for the study’s convergent mixed methods design
Table 3-1 Visual display of the data used in Chapter 4: Analysis & Results
Quantitative Qualitative
Phase 1 (36 participants) A/B Analysis
Biometric Sensors Eye Tracking Facial Expression Analysis Galvanic Skin Response
Opt-in Rates Survey
Demographics Website Relevance Website Engagement Website Trust Website Brand Feelings Towards Website Net Promoter Score
Survey Thematic Analysis
Phase 2 (66 participants) UX Design Professionals
Survey Demographics Use of Biometric Tools Current Tools for UX Testing & Research Preferred Tool/Platform for UX Testing Formal Ethical Framework in Place Ethical Frameworks Familiarity Confidence Levels (business model, team, future risk)
Survey Thematic Analysis

64
Researcher’s Role
The researcher is a UX/UI designer and has been working in the digital media sector over
the last decade. The majority of the researcher’s experiences has been in developing interactive
systems in collaboration with designers, developers, and stakeholders. Additionally, the
researcher is an active contributor to several digital media design and marketing groups, and
organizations, and is a member of several human-centered design organizations. The majority of
this research will be conducted online and in collaboration with the various digital media
agencies.
When a research study is undertaken, it is crucial for reflexivity to be practiced in the
interpretation and analyzation of collected data. According to Creswell (2009), reflexivity
describes the “identification of personal values, assumptions and biases at the outset of the
study” (p. 207). The researcher’s background, current professional role, and personal experiences
have an impact on how the survey responses are interpreted and have been identified in the
statement of assumptions.
The researcher assumed, based upon prior experience and in the review of the literature
for this study, that the effective use of microinteractions were impactful in creating value for
interactive designs and have a strong influence on user behavior and emotion.
Study Population and Sample Selection
This research study was conducted in two phases. The first phase occurred at the Human
Behavior Laboratory at Texas A&M University. The site is recognized as a global leader in
biometric testing. The lab provides the ability to track multiple types of affect detection and
biometric activity in an individual candidate simultaneously and in one session. This allowed for
the ability to conduct research in “real-time” to review eye movements, changes in facial
65
expressions, respiration and heart rates, and perspiration. The lab provided several dozen testing
stations to conduct research simultaneously with multiple participants. Study participants were
selected through the use of nonprobability sampling techniques. All participants were job seekers
or individuals looking to improve their resume. These participants were recruited from within the
Texas A&M University area. As Creswell remarked, “In nonprobability sampling, the research
selects individuals because they are available and convenient and represent some characteristic
the investigator seeks to study” (2015, p.144). Random sampling for this study would not have
been appropriate because some individuals may not use digital interfaces frequently or might
have the digital literacy needed to engage in specific digital interactions. Phase One of the
research study involved soliciting participants to potentially eliminate the aforementioned issues.
Phase Two of the research study used expert purposive techniques to select participants.
Patton (2002) explains that techniques are widely used in qualitative research for the
identification and selection of information-rich cases ensuring efficiency using limited resources.
This entails identifying and selecting individuals or groups of individuals that are qualified to
provide expertise and knowledge of the area of interest (Cresswell & Plano Clark, 2011).
Additionally, Bernard (2002) and Spradley (1979) emphasized the willingness to participate, and
an ability to effectively articulate experiences and opinions. Global participants with a strong
background in user experience research were identified and invited to complete an online survey.
Sixty-six individuals participated in the Phase Two of the research study. Participants were
recruited from over twenty various global online groups and forums on Facebook and LinkedIn
that specialized in User Experience Design. By focusing on this population, the researcher was
able to gain accurate insights into current practices, trends, and challenges from within the UX
profession not just within the United States, but internationally.
66
Phase One Data Collection Strategies
For Phase One data collection, an A/B testing approach was used. A/B testing is a
method of comparing two versions of a website against each other to determine which one
performs better. It is essentially an experiment where two or more variants of a page are shown
randomly to participants to determine which performs better against a given conversion goal.
The variable measured on Website A was a “Spin-to-Win” opt-in microinteraction. This was
selected to test the efficacy of using a microinteraction with a gamified feel to increase opt-in
rates to the subscribe list. Thirty-six participants were recruited and provided a financial
incentive of $25 each to participate in the 60-minute session. Participants were adults ranging
from 18-44 years old and were able to read and speak English proficiently. Participants were
randomly divided into two groups and were asked to engage with the website naturally. After
reviewing and interacting with the website, participants completed an online survey that ranked
the overall website to evaluate trust, ease of use, and overall user experience. Participants were
also asked open-ended questions to solicit qualitative written responses. Biometric data from
each A/B session were recorded to determine participants reactions to the opt-in
microinteraction, website content, and layout. The following biometric sensors were used: Eye
Tracking (Tobii X2-60), Facial Expression Analysis (Affectiva’s AFFDEX engine), and Electro
Dermal Activity (EDA otherwise known as Galvanic Skin Response, GSR) using the Shimmer
3GSR.

67
Table 3-2 Brief Overview of Microinteraction used for Website A
Trigger Rules Feedback Loops & Modes Display on scroll • When user scrolls past the third section of the website or when the user navigates to the opt-in section and clicks on the button.
User must provide data:
• Email • First Name • Last Name
Wheel spins • When user clicks button, an animation of a spin to win wheel is displayed with winning possibilities.
Slide out from left Open loop • If user does not provide data and clicks on button, a animated jitter with red outlines occurs.
Closed loop • If user enters all the data and a valid email address the spin to win sequence is triggered.
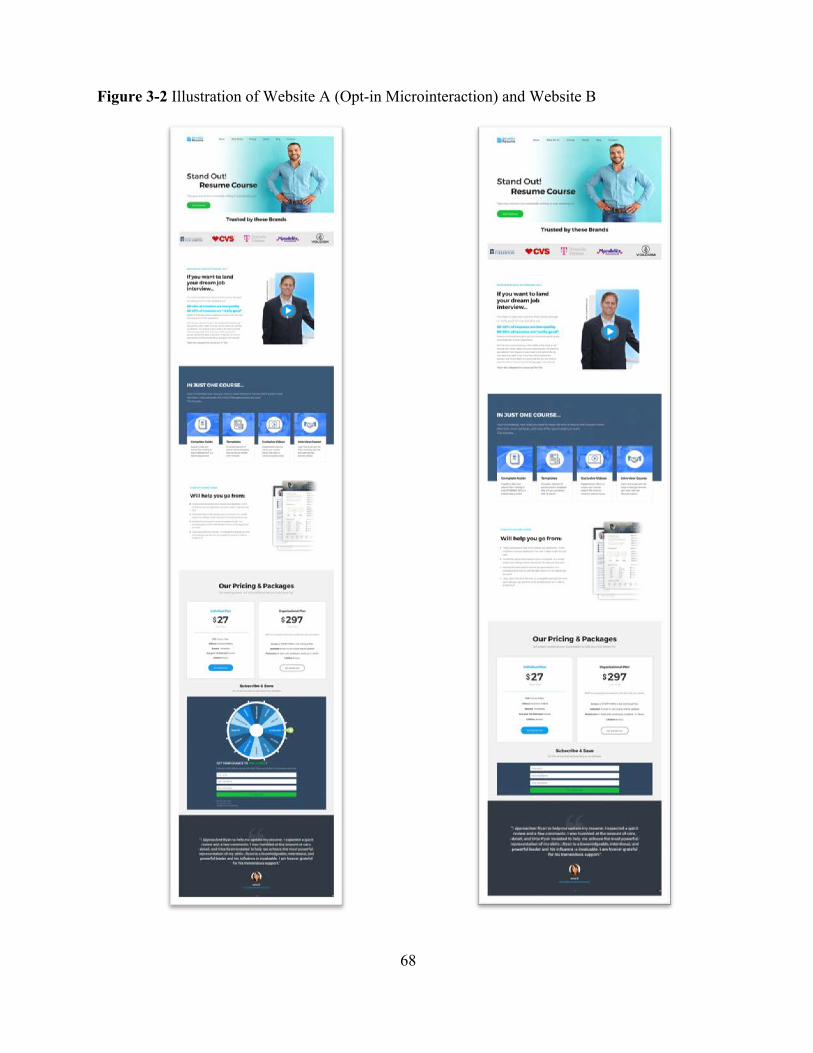
68
Figure 3-2 Illustration of Website A (Opt-in Microinteraction) and Website B
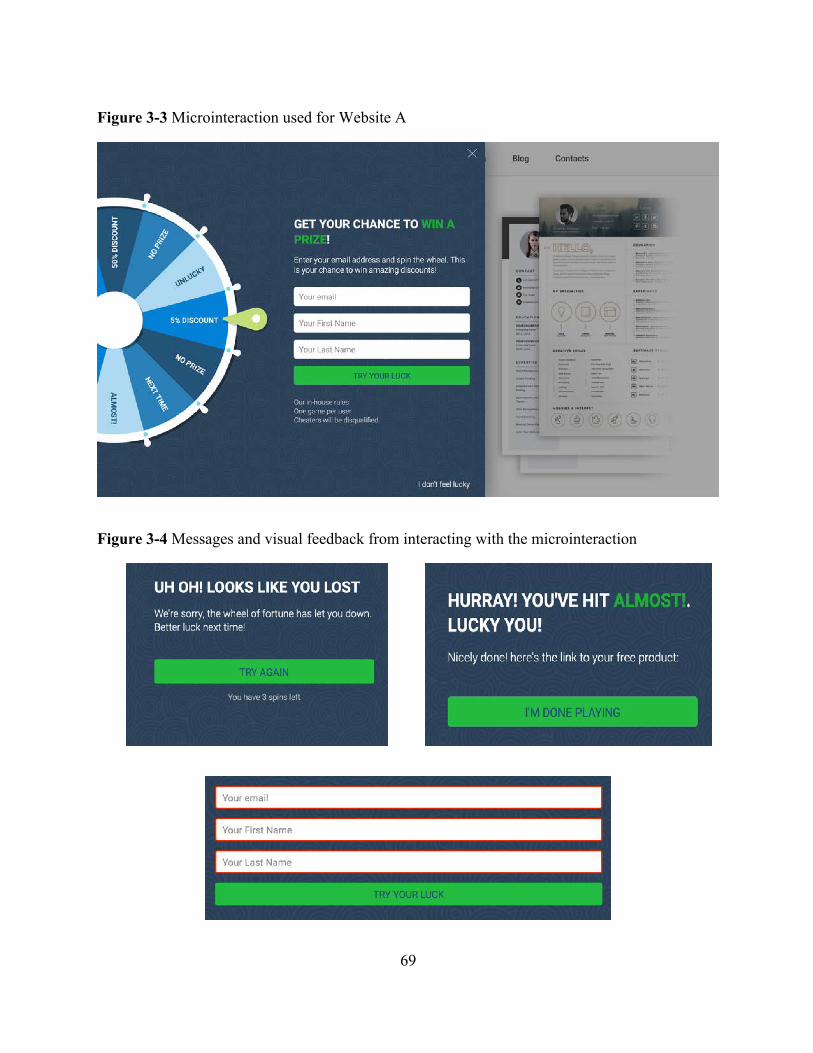
69
Figure 3-3 Microinteraction used for Website A
Figure 3-4 Messages and visual feedback from interacting with the microinteraction
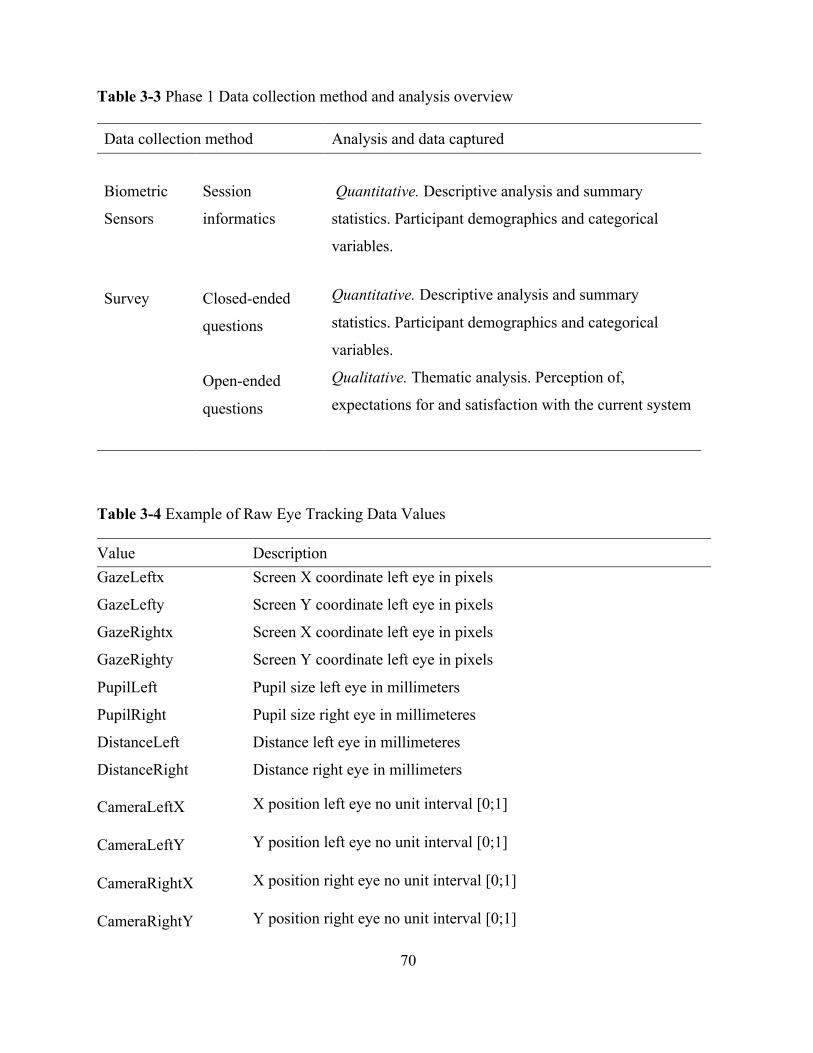
70
Table 3-3 Phase 1 Data collection method and analysis overview
Table 3-4 Example of Raw Eye Tracking Data Values
Value Description GazeLeftx Screen X coordinate left eye in pixels
GazeLefty Screen Y coordinate left eye in pixels
GazeRightx Screen X coordinate left eye in pixels
GazeRighty Screen Y coordinate left eye in pixels
PupilLeft Pupil size left eye in millimeters
PupilRight Pupil size right eye in millimeteres
DistanceLeft Distance left eye in millimeteres
DistanceRight Distance right eye in millimeters
CameraLeftX X position left eye no unit interval [0;1]
CameraLeftY Y position left eye no unit interval [0;1]
CameraRightX X position right eye no unit interval [0;1]
CameraRightY Y position right eye no unit interval [0;1]
Data collection method Analysis and data captured
Biometric
Sensors
Session
informatics
Quantitative. Descriptive analysis and summary
statistics. Participant demographics and categorical
variables.
Quantitative. Descriptive analysis and summary
statistics. Participant demographics and categorical
variables.
Qualitative. Thematic analysis. Perception of,
expectations for and satisfaction with the current system
Survey Closed-ended
questions
Open-ended
questions
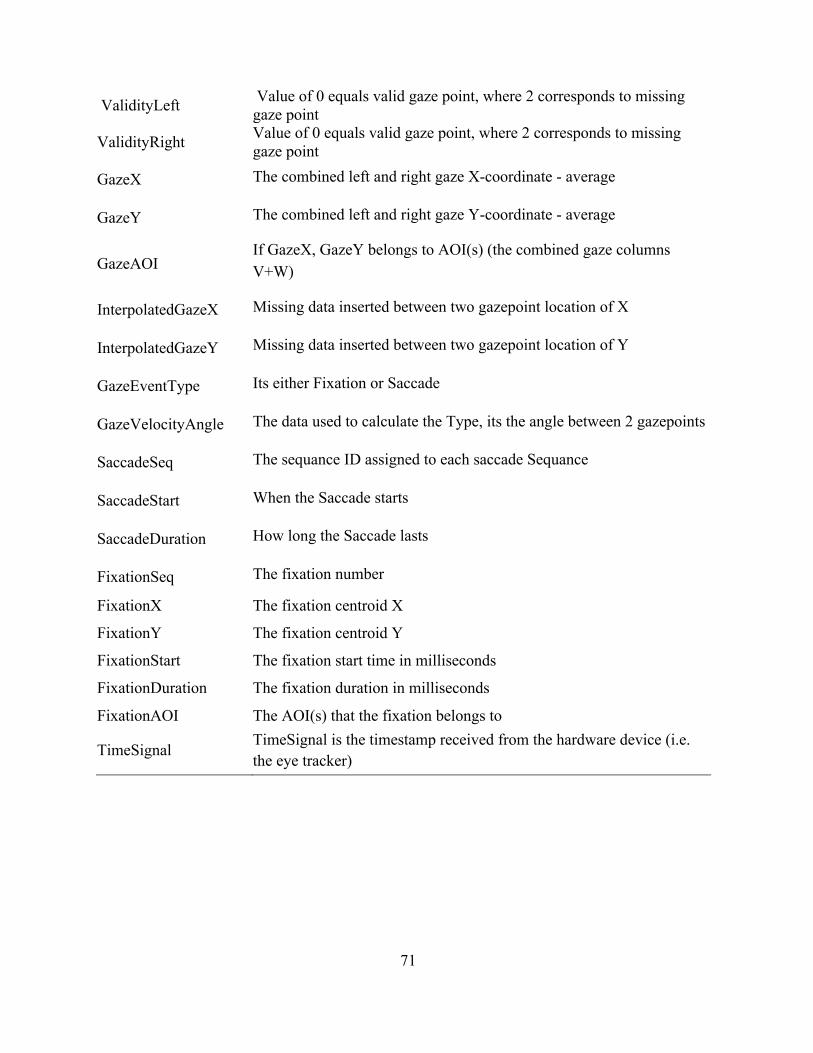
71
ValidityLeft Value of 0 equals valid gaze point, where 2 corresponds to missing gaze point
ValidityRight Value of 0 equals valid gaze point, where 2 corresponds to missing gaze point
GazeX The combined left and right gaze X-coordinate - average
GazeY The combined left and right gaze Y-coordinate - average
GazeAOI If GazeX, GazeY belongs to AOI(s) (the combined gaze columns V+W)
InterpolatedGazeX Missing data inserted between two gazepoint location of X
InterpolatedGazeY Missing data inserted between two gazepoint location of Y
GazeEventType Its either Fixation or Saccade
GazeVelocityAngle The data used to calculate the Type, its the angle between 2 gazepoints
SaccadeSeq The sequance ID assigned to each saccade Sequance
SaccadeStart When the Saccade starts
SaccadeDuration How long the Saccade lasts
FixationSeq The fixation number
FixationX The fixation centroid X
FixationY The fixation centroid Y
FixationStart The fixation start time in milliseconds
FixationDuration The fixation duration in milliseconds
FixationAOI The AOI(s) that the fixation belongs to
TimeSignal TimeSignal is the timestamp received from the hardware device (i.e. the eye tracker)

72
Table 3-5 Example of Facial Expression Analysis Data
Value Description Brow Furrow Both eyebrows moved lower and closer together Brow Raiser Both eyebrows moved upwards Engagement Participant aggregate level of facial muscle activation Lip Corner Puller Lip corner tightened and pulled inwards
Smile Lip corners pulling outwards and upwards towards the ears, combined with other indicators from around the face
Valence Overall experience value from 0 to 100 (positive) -100 to 0 (negative)
Attention Measure of focus based on the head orientation Interocular Distance Distance between the two outer eye corners Pitch Head pose estimation
Yaw Head pose estimation
Roll Head pose estimation
Inner Brow Raiser The inner corners of eyebrows are raised
Eye Closure Both eyelids closed
Nose Wrinkle Wrinkles appear along the sides and across the root of the nose due to skin pulled upwards
Upperlid Raise The upper lip moved upwards
Lip Suck Pull of the lips and the adjacent skin into the mouth
Lip Press Pressing the lips together without pushing up the chin boss
Mouth Open Lower lip dropped downwards
Chin Raise The chin boss and the lower lip pushed upwards
Smirk Left or right lip corner pulled upwards and outwards
Lip Pucker Lips pushed forward
Anger Participant aggregated anger level
Sadness Participant aggregated sadness level
Disgust Participant aggregated disgust level
Joy Participant aggregated joy level
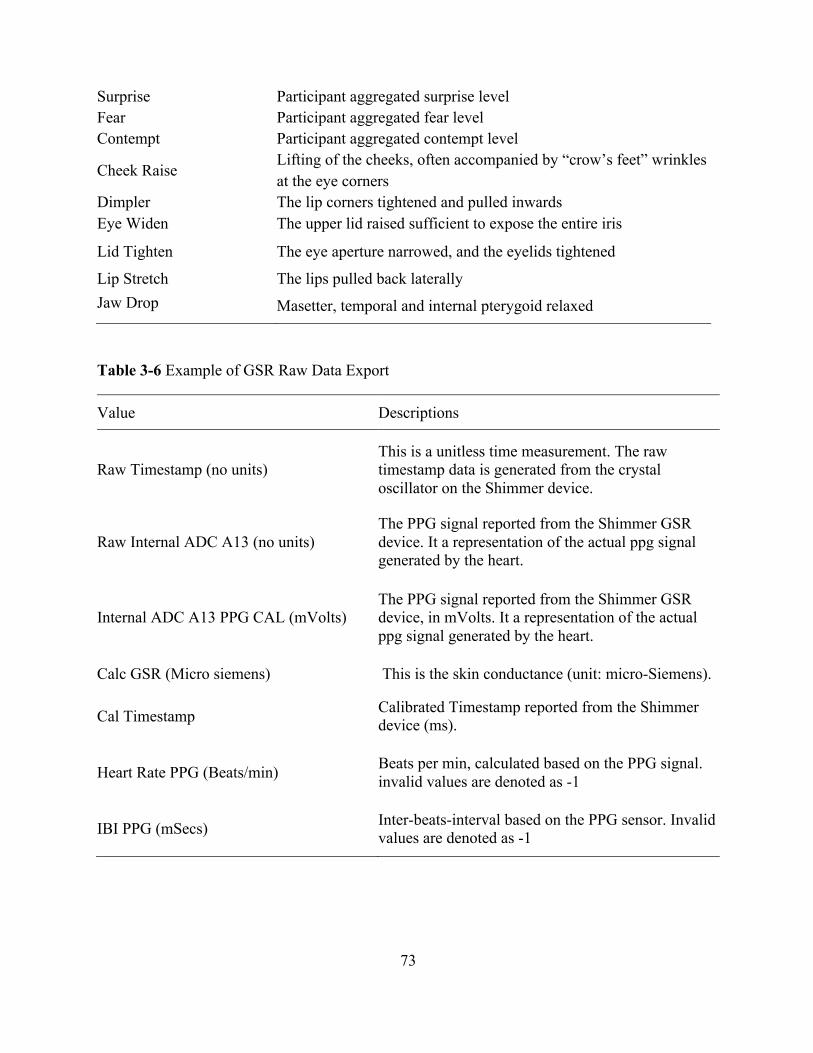
73
Surprise Participant aggregated surprise level Fear Participant aggregated fear level Contempt Participant aggregated contempt level
Cheek Raise Lifting of the cheeks, often accompanied by “crow’s feet” wrinkles at the eye corners
Dimpler The lip corners tightened and pulled inwards Eye Widen The upper lid raised sufficient to expose the entire iris
Lid Tighten The eye aperture narrowed, and the eyelids tightened
Lip Stretch The lips pulled back laterally Jaw Drop Masetter, temporal and internal pterygoid relaxed
Table 3-6 Example of GSR Raw Data Export
Value Descriptions
Raw Timestamp (no units) This is a unitless time measurement. The raw timestamp data is generated from the crystal oscillator on the Shimmer device.
Raw Internal ADC A13 (no units) The PPG signal reported from the Shimmer GSR device. It a representation of the actual ppg signal generated by the heart.
Internal ADC A13 PPG CAL (mVolts)
The PPG signal reported from the Shimmer GSR device, in mVolts. It a representation of the actual ppg signal generated by the heart.
Calc GSR (Micro siemens) This is the skin conductance (unit: micro-Siemens).
Cal Timestamp Calibrated Timestamp reported from the Shimmer device (ms).
Heart Rate PPG (Beats/min) Beats per min, calculated based on the PPG signal. invalid values are denoted as -1
IBI PPG (mSecs) Inter-beats-interval based on the PPG sensor. Invalid values are denoted as -1
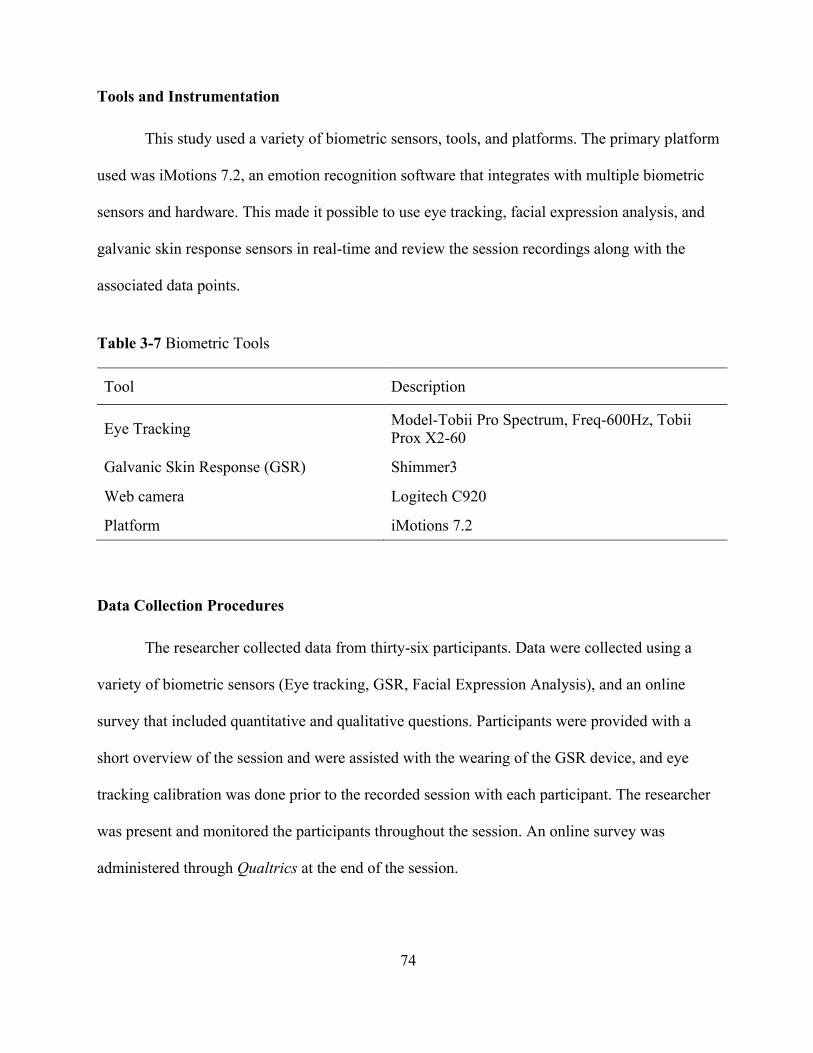
74
Tools and Instrumentation
This study used a variety of biometric sensors, tools, and platforms. The primary platform
used was iMotions 7.2, an emotion recognition software that integrates with multiple biometric
sensors and hardware. This made it possible to use eye tracking, facial expression analysis, and
galvanic skin response sensors in real-time and review the session recordings along with the
associated data points.
Table 3-7 Biometric Tools
Tool Description
Eye Tracking Model-Tobii Pro Spectrum, Freq-600Hz, Tobii Prox X2-60
Galvanic Skin Response (GSR) Shimmer3
Web camera Logitech C920
Platform iMotions 7.2
Data Collection Procedures
The researcher collected data from thirty-six participants. Data were collected using a
variety of biometric sensors (Eye tracking, GSR, Facial Expression Analysis), and an online
survey that included quantitative and qualitative questions. Participants were provided with a
short overview of the session and were assisted with the wearing of the GSR device, and eye
tracking calibration was done prior to the recorded session with each participant. The researcher
was present and monitored the participants throughout the session. An online survey was
administered through Qualtrics at the end of the session.
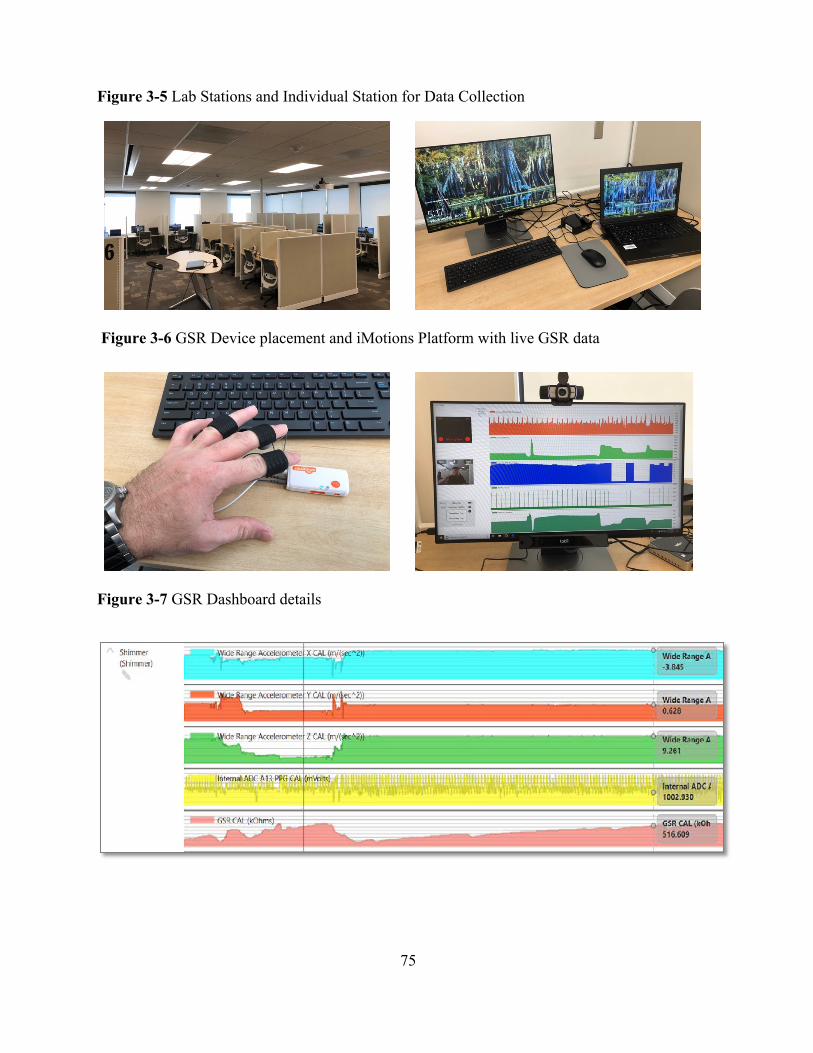
75
Figure 3-5 Lab Stations and Individual Station for Data Collection
Figure 3-6 GSR Device placement and iMotions Platform with live GSR data
Figure 3-7 GSR Dashboard details
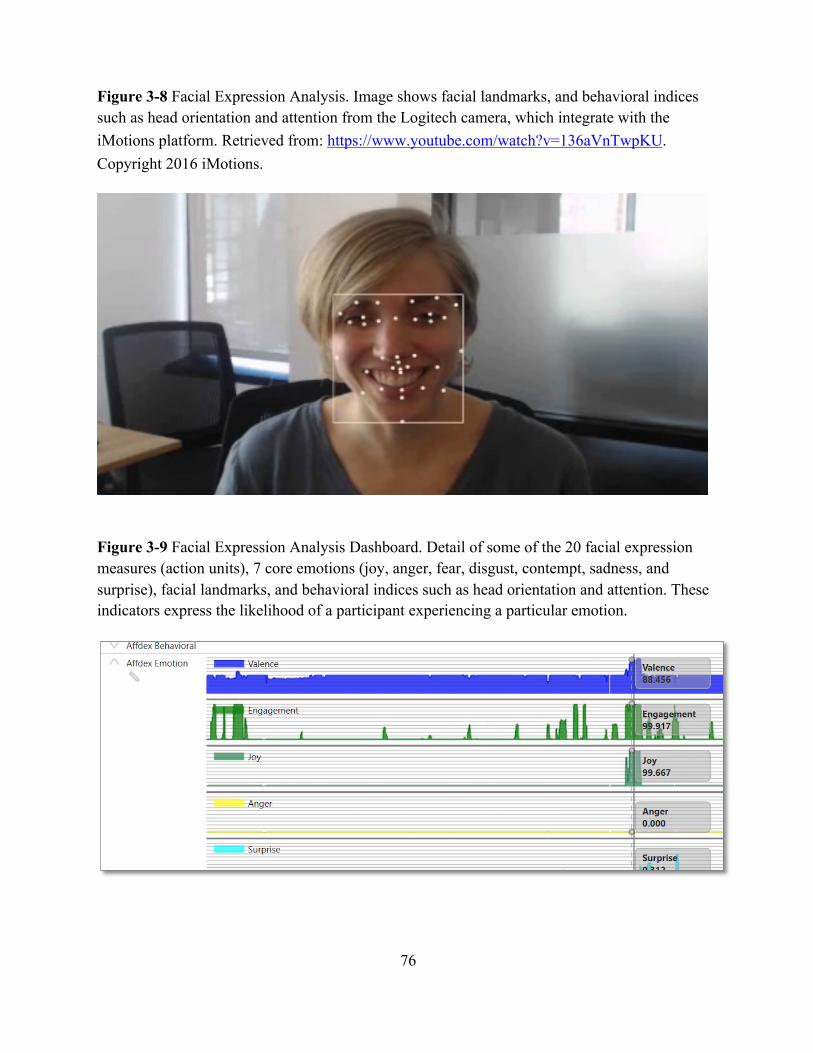
76
Figure 3-8 Facial Expression Analysis. Image shows facial landmarks, and behavioral indices such as head orientation and attention from the Logitech camera, which integrate with the iMotions platform. Retrieved from: https://www.youtube.com/watch?v=136aVnTwpKU. Copyright 2016 iMotions.
Figure 3-9 Facial Expression Analysis Dashboard. Detail of some of the 20 facial expression measures (action units), 7 core emotions (joy, anger, fear, disgust, contempt, sadness, and surprise), facial landmarks, and behavioral indices such as head orientation and attention. These indicators express the likelihood of a participant experiencing a particular emotion.
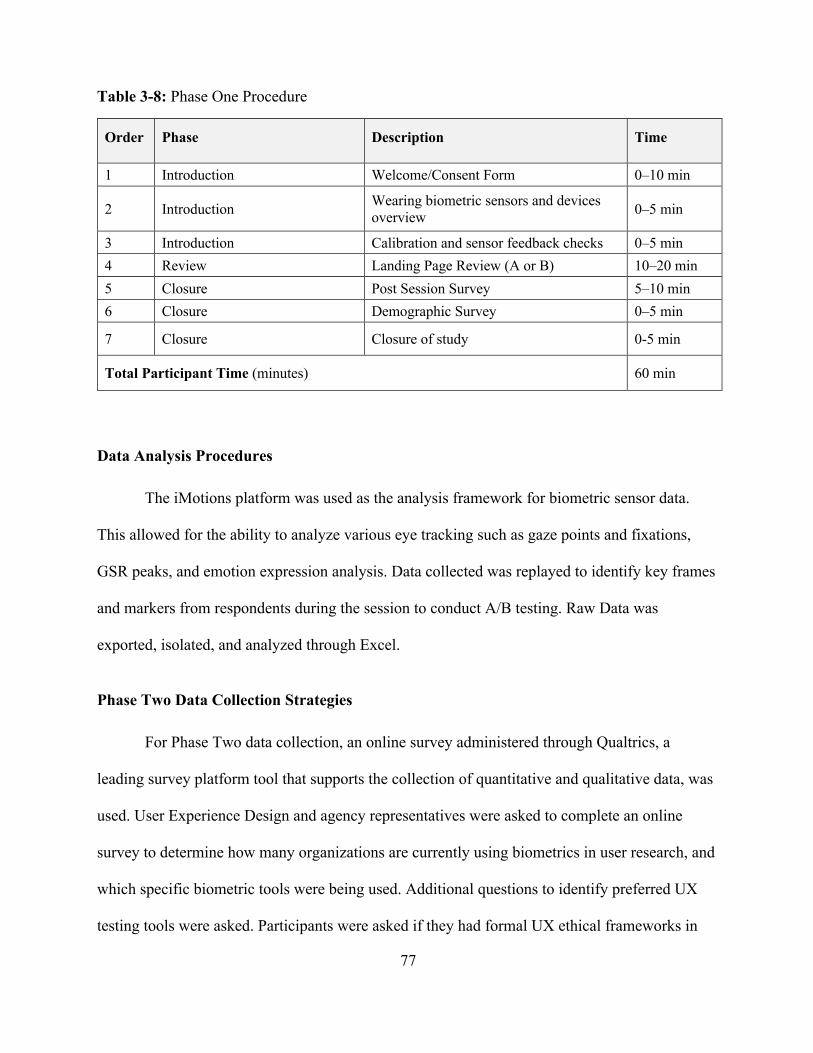
77
Table 3-8: Phase One Procedure
Order Phase Description Time
1 Introduction Welcome/Consent Form 0–10 min
2 Introduction Wearing biometric sensors and devices overview 0–5 min
3 Introduction Calibration and sensor feedback checks 0–5 min 4 Review Landing Page Review (A or B) 10–20 min 5 Closure Post Session Survey 5–10 min 6 Closure Demographic Survey 0–5 min
7 Closure Closure of study 0-5 min
Total Participant Time (minutes) 60 min
Data Analysis Procedures
The iMotions platform was used as the analysis framework for biometric sensor data.
This allowed for the ability to analyze various eye tracking such as gaze points and fixations,
GSR peaks, and emotion expression analysis. Data collected was replayed to identify key frames
and markers from respondents during the session to conduct A/B testing. Raw Data was
exported, isolated, and analyzed through Excel.
Phase Two Data Collection Strategies
For Phase Two data collection, an online survey administered through Qualtrics, a
leading survey platform tool that supports the collection of quantitative and qualitative data, was
used. User Experience Design and agency representatives were asked to complete an online
survey to determine how many organizations are currently using biometrics in user research, and
which specific biometric tools were being used. Additional questions to identify preferred UX
testing tools were asked. Participants were asked if they had formal UX ethical frameworks in
78
place, and their familiarity with said frameworks. Participants were asked to explain what their
greatest challenge or concern in UX testing and research were. The purpose of these questions
was to identify some of the industry challenges and concerns with current UX research
measurement. The researcher provided a random drawing for one $100 Amazon Gift Card as an
incentive for the completion of the survey.
Table 3-9 Phase Two Data collection method and analysis overview
Tools and Instrumentation
The online survey tools for this research study were created by the researcher and
consisted of three sections. Basic demographic questions with specific organizational-specific
questions provided insights into the respondent, questions relating to the use of biometric testing
for UX design, and ethical questions and considerations for UX design were included. One
ethical question used a 7-point scale with 1 representing “Strongly Disagree” and 7 representing
“Strongly Agree.” Finally, participants were asked what their greatest challenges or concerns in
UX testing and research were. Several questions were open-ended to allow for deeper insights
into current practices.
Data collection method Analysis and data captured
Online
Survey
Closed-ended
questions
Open-ended
questions
Quantitative. Descriptive analysis and summary
statistics. Participant demographics and categorical
variables.
Qualitative. Thematic analysis. Perception of current
UX testing and research methods, ethics, and
challenges.
79
Data Collection Procedures
The online survey was distributed among 20 various UX professional groups through
Facebook and LinkedIn. The survey provided a description of the study and an informed consent
for the participant to agree to voluntarily participate in the survey or exit at any time if they so
choose. Participation was voluntary and the survey was available for a duration of three weeks.
Participants were told that there would be a random drawing for one $100 Amazon Gift for
completed responses.
Data Analysis Procedures
The quantitative and qualitative survey data were exported from Qualtrics and analyzed
with a brief description of the finding. Figures and tables representative of the data were
developed. For the open-ended questions a thematic coding process (Glaser & Strauss, 1967),
was used to identify emergent thematic categories.
According to Merriam (1988) validity of conclusions are improved when data collection
is triangulated. For this study, triangulation of the quantitative and qualitative data occurred
after the analysis of Phase One and Two thereby arriving at the conclusions for this study.
Ethical Considerations
A formal review of the research proposal was conducted through Harvard University’s
Institutional Review Board (Appendix A) prior to the study being conducted. Data was collected
through a combination of electronic and paper-based data throughout the study. Physical
documents including signed participant consent forms, surveys, and supporting documents will
be exclusively kept with the researcher in a locked room in a locked drawer, until the
transcribing and transferal to a secure password protected server. Electronic data, including

80
digital photographs taken on a dedicated camera, transcribed observation notes and
survey/interview responses, and data collected using software were stored on password protected
and encrypted laptops.
The study targeted individuals who were consenting adults and at least 18 years of age.
During the survey, participants were only asked to share their perceptions and affinity interactive
systems. All participants had anonymity of response, as the electronic survey tool did not capture
any personally identifiable data. All data was handled with the utmost care and any responses,
including personally identifying information was stripped from the data prior to analysis and
stored to protect against any possible breach in procedures.
All surveys were anonymous, confidential and contained no participant identifiers.
Although demographic information was collected, it was collected in categories that are
sufficiently broad to ensure individuals are not easily identifiable (e.g., specific age was not
collected, but rather age category). Surveys were created and collected through Qualtrics, and
services hosted on data centers that are independently audited and use the SSAE-16 industry
method. Data was accessed on a secure server and only accessed on a password protected device.
No identifying data on participants was be collected.
Study Validity and Reliability
This study used measures consistent with scientific literature to ensure validity.
Triangulation was applied as a safeguard incorporated into the study to increase validity.
Creswell states, “this ensures that the study will be accurate because the information draws on
multiple sources of information, individuals, or processes. In this way, it encourages the
researcher to develop a report that is both accurate and credible” (2015, p. 259). Quantitative and
81
qualitative data were both collected simultaneously in each phase, then merged at the conclusion
of the study.
Chapter Summary
The problem and research questions investigated in this study were restated. Chapter 3
included a detailed description of the research’s methodology and the research design. The study
population and sample selections, sources of data, trustworthiness of the study, data collection
procedures, and data analysis procedures were also explored. Ethical considerations were
addressed to protect human subjects and limitations identified. An explanation as to why
limitations should not affect results was also included. Chapter 4 incorporates a summary and
analysis of data in the results section. Chapter 5 contains a discussion and interpretation that is
designed to connect research questions to results; including a section with implications for
practice and recommendations for future research, and a formal conclusion.
82
Chapter 4 : Analysis & Results
The purpose of this study was to explore how biometrics can be integrated into the design
process to validate creative assets and improve user experience. This study included two phases.
Phase One took place at Texas A&M University’s Human Behavior Lab, while Phase Two
involved the gathering of data from a quantitative and qualitative online survey of UX
professionals worldwide. This chapter presents the findings for each of the two phases: thirty-six
participants using biometric sensors and 66 UX professionals. These findings are organized by
phase and include demographic description, findings and observations, and thematic analysis of
responses to open-ended survey items.
Phase One Findings
A convenience sampling approach was utilized to identify and recruit participants for this
study. To qualify as a candidate for this study, participants were required to be 18 years or older,
English speaking, proficient with using a web browser, and seeking employment or wanting to
improve their resume. Facebook ads and emails were used to invite individuals from within the
College Station, Texas area to participate in the research. A total of 36 individuals participated in
Phase One. This sample was comprised of 20 women and 15 men and one individual identifying
as ‘other’. Individuals identified as 19% White/Caucasian, 27% Asian, 27%
Latina/Latino/Latinx/Hispanic, and 8% Black/African-American. 77% of individuals were
between 18-24 years old. The biometric data and qualitative & quantitative survey data were
collected on June 13, 2019.
The biometric sensor data collected from the study was extensive and contained an
extremely large and diverse data set. This included the data collected from the GSR sensors, eye-
tracking, and facial expression analysis from the camera. The data between all 36 participants
83
was around 18GB. The process to analyze the data and compare it to the site with the
microinteraction (website A) versus the site without the microinteraction (website B), involved
identifying all the collective moments and timestamps when participants first engaged with the
microinteraction and their immediate actions involved shortly after. The researcher reviewed
these sessions and recordings individually to verify and confirm the timestamps and the instances
when the microinteraction was determined to be seen by a participant. These moments were
analyzed to see what the participants’ specific biometric markers were in real-time when the
microinteraction was first triggered. Prior to starting the session, participants required individual
eye calibration to ensure accuracy and quality of eye tracking data. The eye tracking insights
helped to confirm what the participant was specifically looking at and what the inferred affect
was during that experience. The biometrics primarily focused on measuring user affect through
facial expression. Eye tracking was used as a supplemental contextual tool to provide insights
into what the participants were looking at in relationship to the additional biometric channels and
datasets. Galvanic Skin Response (GSR) were used to ascertain the emotional arousal state of
participants during the microinteraction. Opt-in rates were used to determine the efficacy of the
microinteraction.
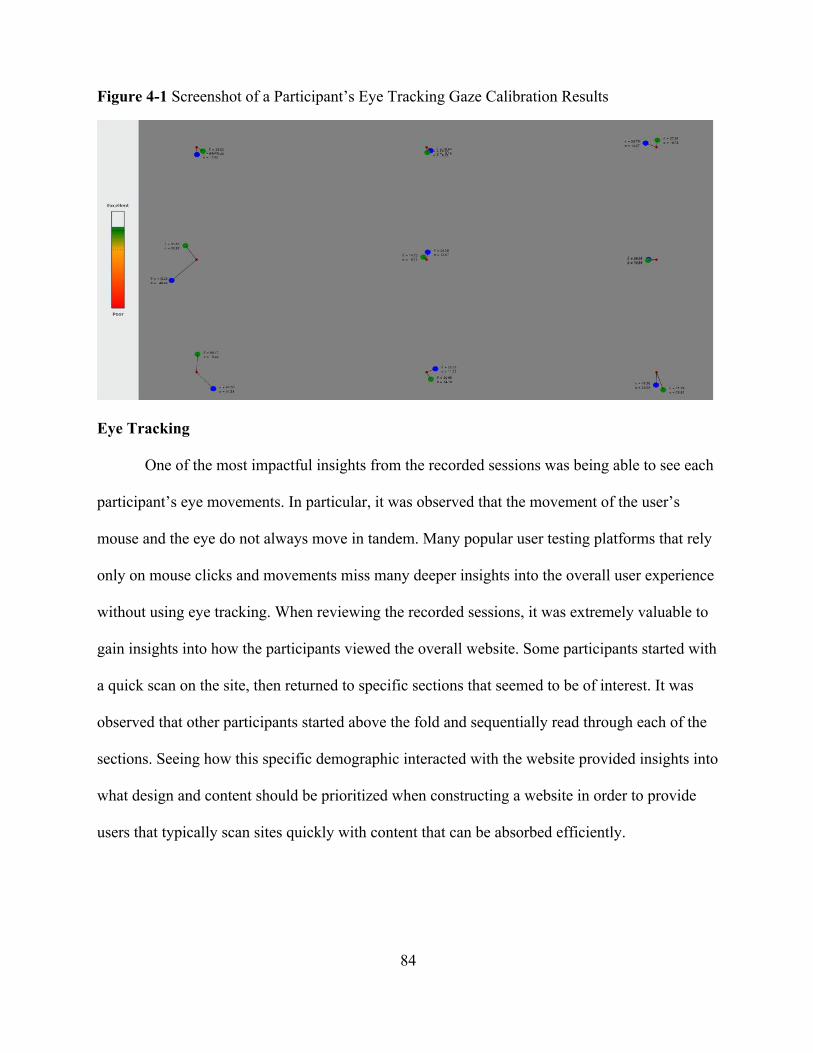
84
Figure 4-1 Screenshot of a Participant’s Eye Tracking Gaze Calibration Results
Eye Tracking
One of the most impactful insights from the recorded sessions was being able to see each
participant’s eye movements. In particular, it was observed that the movement of the user’s
mouse and the eye do not always move in tandem. Many popular user testing platforms that rely
only on mouse clicks and movements miss many deeper insights into the overall user experience
without using eye tracking. When reviewing the recorded sessions, it was extremely valuable to
gain insights into how the participants viewed the overall website. Some participants started with
a quick scan on the site, then returned to specific sections that seemed to be of interest. It was
observed that other participants started above the fold and sequentially read through each of the
sections. Seeing how this specific demographic interacted with the website provided insights into
what design and content should be prioritized when constructing a website in order to provide
users that typically scan sites quickly with content that can be absorbed efficiently.
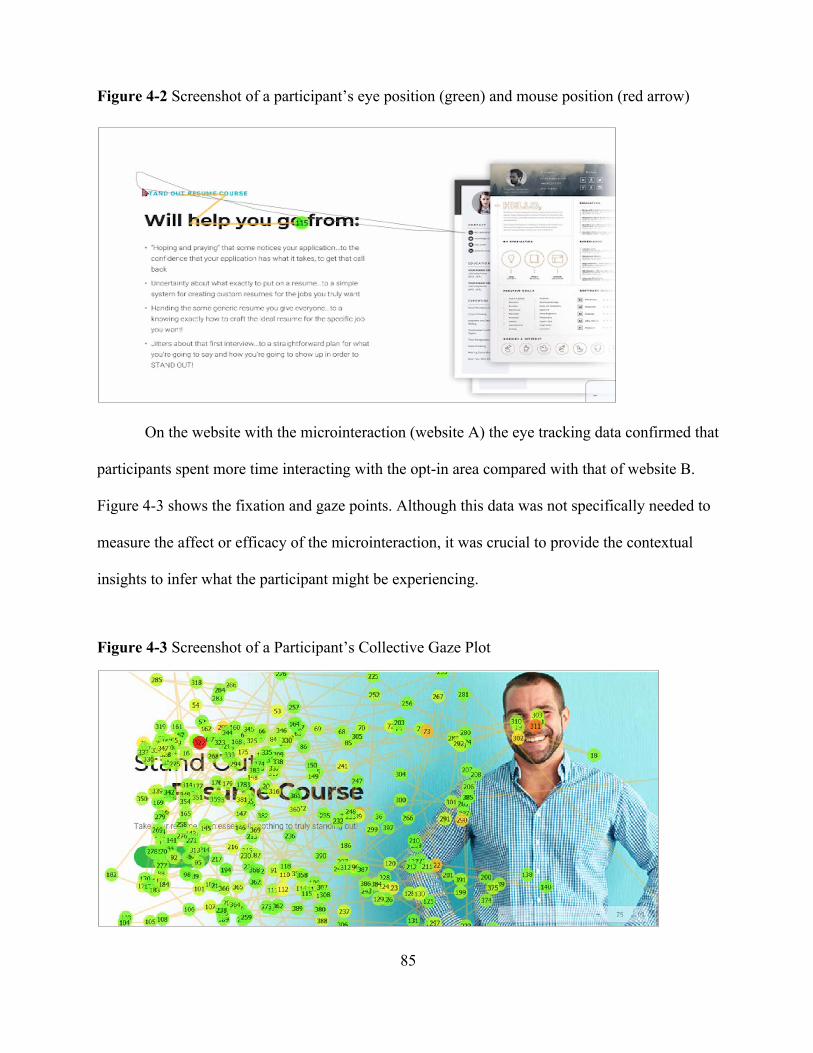
85
Figure 4-2 Screenshot of a participant’s eye position (green) and mouse position (red arrow)
On the website with the microinteraction (website A) the eye tracking data confirmed that
participants spent more time interacting with the opt-in area compared with that of website B.
Figure 4-3 shows the fixation and gaze points. Although this data was not specifically needed to
measure the affect or efficacy of the microinteraction, it was crucial to provide the contextual
insights to infer what the participant might be experiencing.
Figure 4-3 Screenshot of a Participant’s Collective Gaze Plot

86
Figure 4-4 Screenshot of a participant’s gaze points (website A)
Affdex Emotion – Engagement
One of the most noticeable observations comparing website A against website B was the
engagement levels. Website A had an average value of 56.31 compared to website B (without the
microinteraction) which had a value of 10.55 on a scale of 0-100 (0 = not expressed; 100 = it was
expressed). According to Affectiva, engagement levels are a weighted sum of facial expressions

87
such as: brow raise, brow furrow, nose wrinkle, lip corner depressor, chin raise, lip pucker, lip
press, mouth open, lip suck, smile.
Figure 4-5 Engagement level between Website A and Website B
Affdex Emotion Categories
Figure 4-6 shows the emotion categories compared between website A and B. Aggregate
disgust levels across participants were markedly higher (1.1254) with the website that had the
microinteraction compared to its counterpart (0.382). There was an increase in the levels of joy
in website A participants (0.08) compared with website B (0.0016). Finally, the sadness levels
seemed higher in website A (0.14) versus B (0.0188). This information could be used in the
design process to discuss ways to improve the creative assets and lower disgust and sadness
levels since a baseline has now been established.
An additional emotion category that had a marked difference were the levels of surprise.
This is suspected due to the gamification nature of the opt-in microinteraction. The spin-to-win
nature of interacting with that section seemed to invoke an element of surprise comparing
website A (21.22) versus website B (2.198).
10.5501
56.3178
Website A Website B

88
Figure 4-6 Levels of Emotion between Website A and Website B Participants
Figure 4-7 Levels of Surprise between Website A and Website B Participants
Galvanic Skin Response (GSR)
GSR measures changes in electrical activity related to sweat gland activity. There is a
correlation between emotional arousal and sweat secretion. Positive and negative stimuli result in
an increase in arousal levels. What this means is that the data is representative of the intensity of
an emotion and not the type of emotion. Data was collected and aggregated on an interval. The
time interval (3 seconds) was measured from the time the respondents first saw the
microinteraction in website A, and the time respondents first saw the newsletter form fields in
0.382
0.0188
0.1925
0.1
0.026
0.0016
1.1254
0.14
0.21
0.0405
0.0285
0.08
Disgust
Sadness
Contempt
Fear
Anger
Joy
Website A Website B
2.1978
21.122Surprise
Website A Website B

89
website B. GSR data was aggregated based on the binarization of the signal. A value of 1
(“true”) was assigned to intervals that contained at least one GSR peak, and a value of 0 (“false”)
was assigned to intervals that contained no GSR peaks. While the data does not delineate the
type of emotional experience respondents had, in website A more respondents were emotionally
aroused.
Figure 4-8 GSR respondents with peak > 1 Peak (N=10)
Opt-in Rate
Opt-in rates are a key metric used as an indicator of visitors that choose to subscribe to a
list after visiting a website. Participants from website A (31%), with the microinteraction, were
overwhelmingly higher than participants from website B (5%), without the microinteractions.
This confirms that the microinteraction was indeed effective.
Figure 4-9 Opt-in Rate by Site
2
3
Website A Website B
5%
31%
Website A Website B

90
In addition to the biometric data collection, participants were given a survey to gauge the
overall correspondence with the in-session data and post session data. At the end of the survey
participants were awarded $25 for completing the session.
The survey contained 21 questions and seven parts: (a) eight participant demographic
questions; (b) four Likert scaled statements regarding the websites: relevance, engagement,
trust, and brand; (c) a bipolar table variation displaying two extreme feelings about the website;
(d) a Net Promoter Score on a scale of 0-10 for the likelihood of recommending the website; (e)
six open-ended question asking participants about their experience, preferences, and the overall
feelings towards the website. The survey was conducted on June 13, 2019. An online survey
software, Qualtrics, was used to collect and analyze the responses.
Description of the survey participants
This sample was comprised of 20 women and 15 men and one individual identifying as
other. Individuals identified as 19% White/Caucasian, 27% Asian, 27%
Latina/Latino/Latinx/Hispanic, and 8% Black/African-American. 77% of individuals were
between 18-24 years old. Forty-six percent were students working part-time, most of which
worked in academia. Participants were recruited from within the College Station, Texas area.
Table 4-1 Demographics
Factor Total Sample (Site A) Total Sample (Site B)
Gender N % Female % Male % Trans % Intersex % Other
19
57.89 36.84 0 0 5.26
17
52.94 47.06 0 0 0
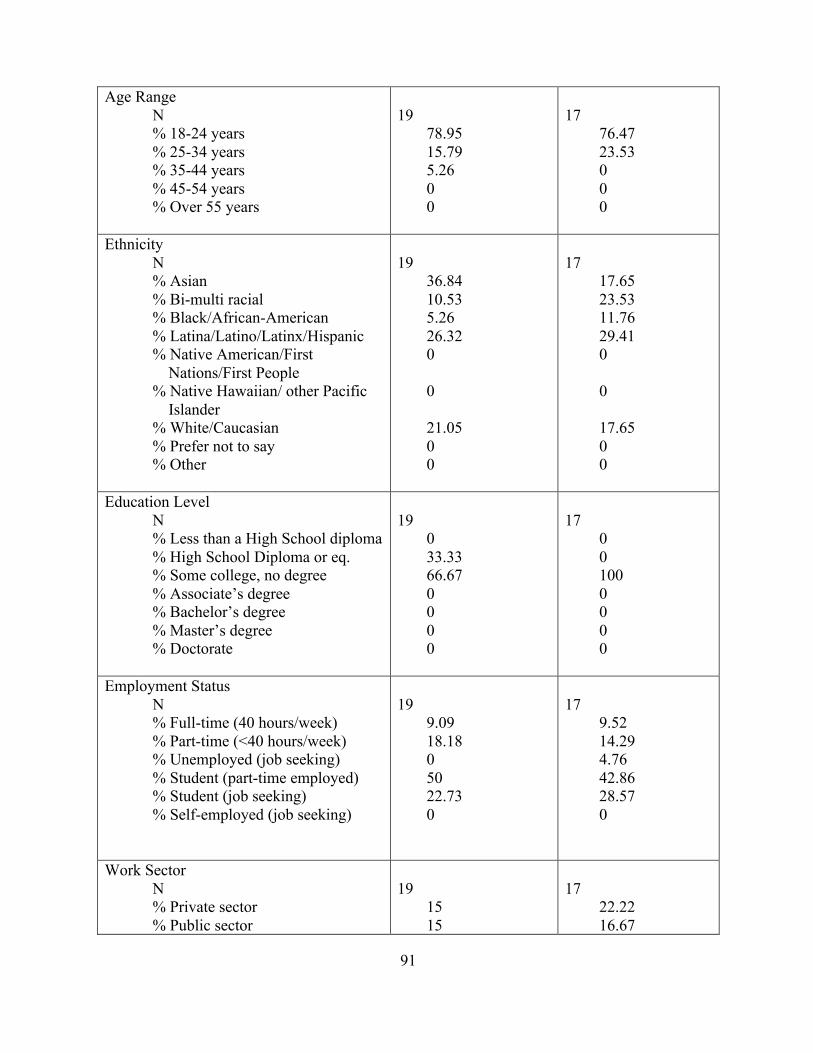
91
Age Range N % 18-24 years % 25-34 years % 35-44 years % 45-54 years % Over 55 years
19
78.95 15.79 5.26 0 0
17
76.47 23.53 0 0 0
Ethnicity N % Asian % Bi-multi racial % Black/African-American % Latina/Latino/Latinx/Hispanic % Native American/First Nations/First People % Native Hawaiian/ other Pacific Islander % White/Caucasian % Prefer not to say % Other
19
36.84 10.53 5.26 26.32 0 0 21.05 0 0
17
17.65 23.53 11.76 29.41 0 0 17.65 0 0
Education Level N % Less than a High School diploma % High School Diploma or eq. % Some college, no degree % Associate’s degree % Bachelor’s degree % Master’s degree % Doctorate
19
0 33.33 66.67 0 0 0 0
17
0 0 100 0 0 0 0
Employment Status
N % Full-time (40 hours/week) % Part-time (<40 hours/week) % Unemployed (job seeking) % Student (part-time employed) % Student (job seeking) % Self-employed (job seeking)
19
9.09 18.18 0 50 22.73 0
17
9.52 14.29 4.76 42.86 28.57 0
Work Sector N % Private sector % Public sector
19
15 15
17
22.22 16.67
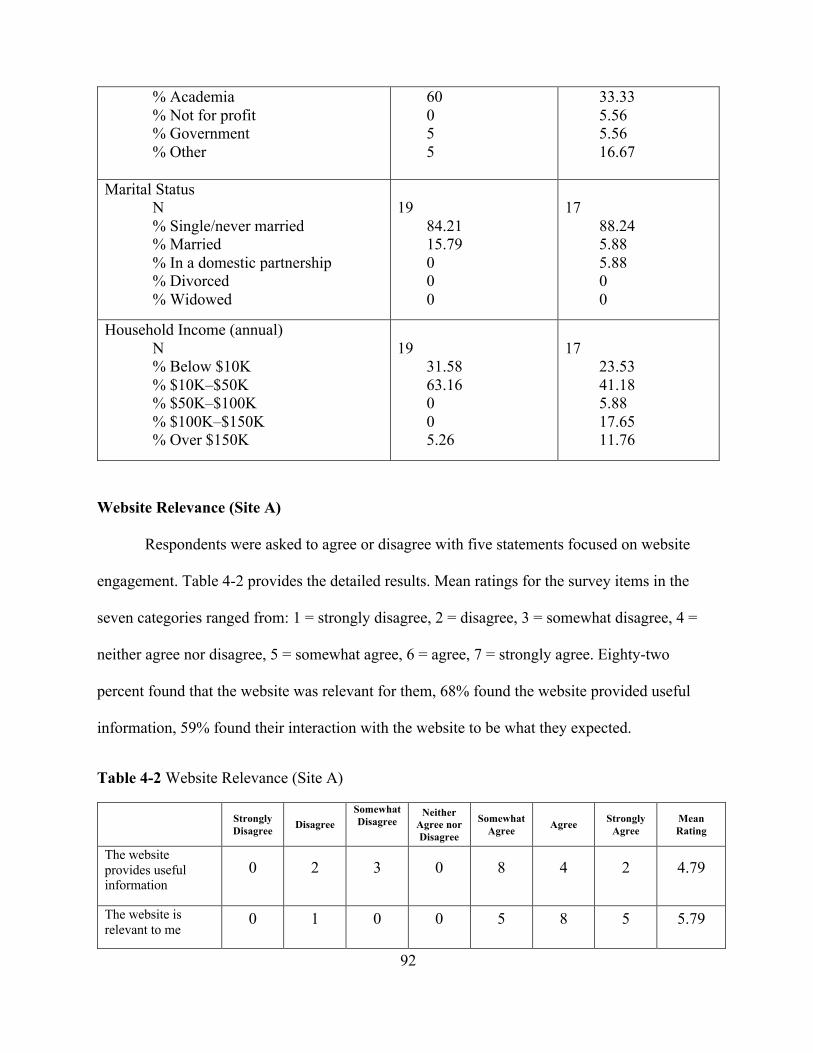
92
% Academia % Not for profit % Government % Other
60 0 5 5
33.33 5.56 5.56 16.67
Marital Status N % Single/never married % Married % In a domestic partnership % Divorced % Widowed
19
84.21 15.79 0 0 0
17
88.24 5.88 5.88 0 0
Household Income (annual) N % Below $10K % $10K–$50K % $50K–$100K % $100K–$150K % Over $150K
19
31.58 63.16 0 0 5.26
17
23.53 41.18 5.88 17.65 11.76
Website Relevance (Site A)
Respondents were asked to agree or disagree with five statements focused on website
engagement. Table 4-2 provides the detailed results. Mean ratings for the survey items in the
seven categories ranged from: 1 = strongly disagree, 2 = disagree, 3 = somewhat disagree, 4 =
neither agree nor disagree, 5 = somewhat agree, 6 = agree, 7 = strongly agree. Eighty-two
percent found that the website was relevant for them, 68% found the website provided useful
information, 59% found their interaction with the website to be what they expected.
Table 4-2 Website Relevance (Site A)
Strongly Disagree Disagree
Somewhat Disagree
Neither Agree nor Disagree
Somewhat Agree Agree Strongly
Agree Mean Rating
The website provides useful information
0 2 3 0 8 4 2 4.79
The website is relevant to me
0 1 0 0 5 8 5 5.79
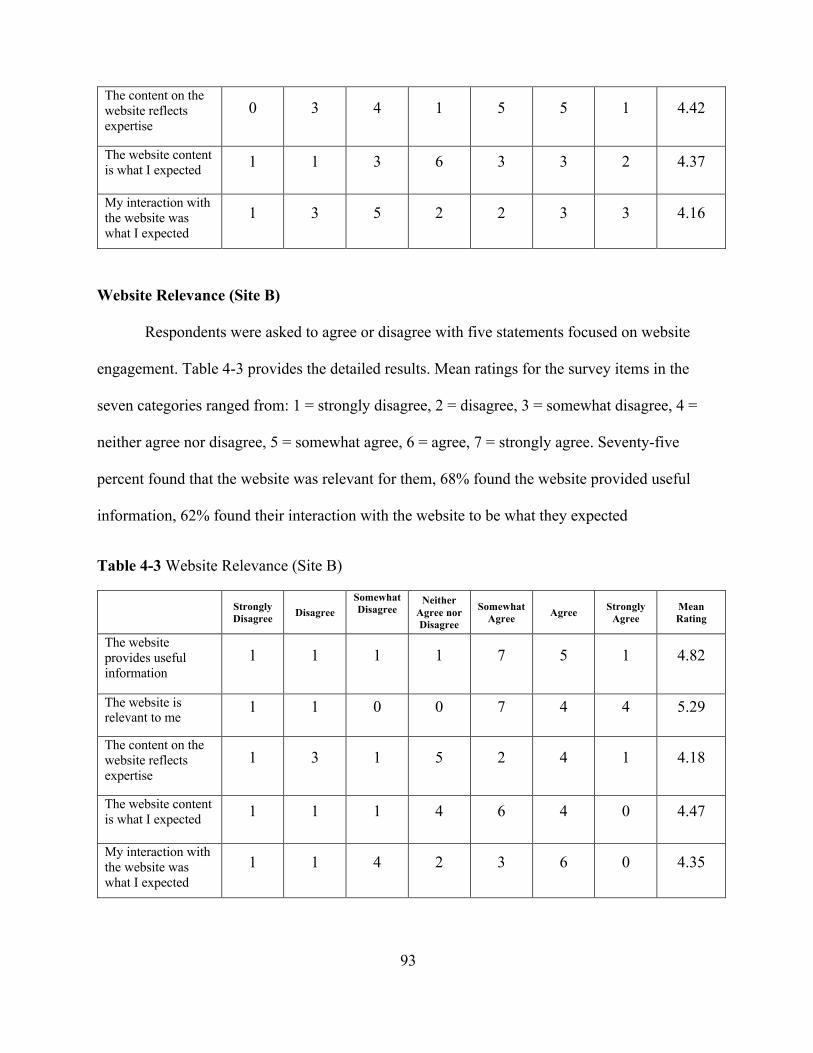
93
The content on the website reflects expertise
0 3 4 1 5 5 1 4.42
The website content is what I expected 1 1 3 6 3 3 2 4.37
My interaction with the website was what I expected
1 3 5 2 2 3 3 4.16
Website Relevance (Site B)
Respondents were asked to agree or disagree with five statements focused on website
engagement. Table 4-3 provides the detailed results. Mean ratings for the survey items in the
seven categories ranged from: 1 = strongly disagree, 2 = disagree, 3 = somewhat disagree, 4 =
neither agree nor disagree, 5 = somewhat agree, 6 = agree, 7 = strongly agree. Seventy-five
percent found that the website was relevant for them, 68% found the website provided useful
information, 62% found their interaction with the website to be what they expected
Table 4-3 Website Relevance (Site B)
Strongly Disagree Disagree
Somewhat Disagree
Neither Agree nor Disagree
Somewhat Agree Agree Strongly
Agree Mean Rating
The website provides useful information
1 1 1 1 7 5 1 4.82
The website is relevant to me
1 1 0 0 7 4 4 5.29
The content on the website reflects expertise
1 3 1 5 2 4 1 4.18
The website content is what I expected 1 1 1 4 6 4 0 4.47
My interaction with the website was what I expected
1 1 4 2 3 6 0 4.35
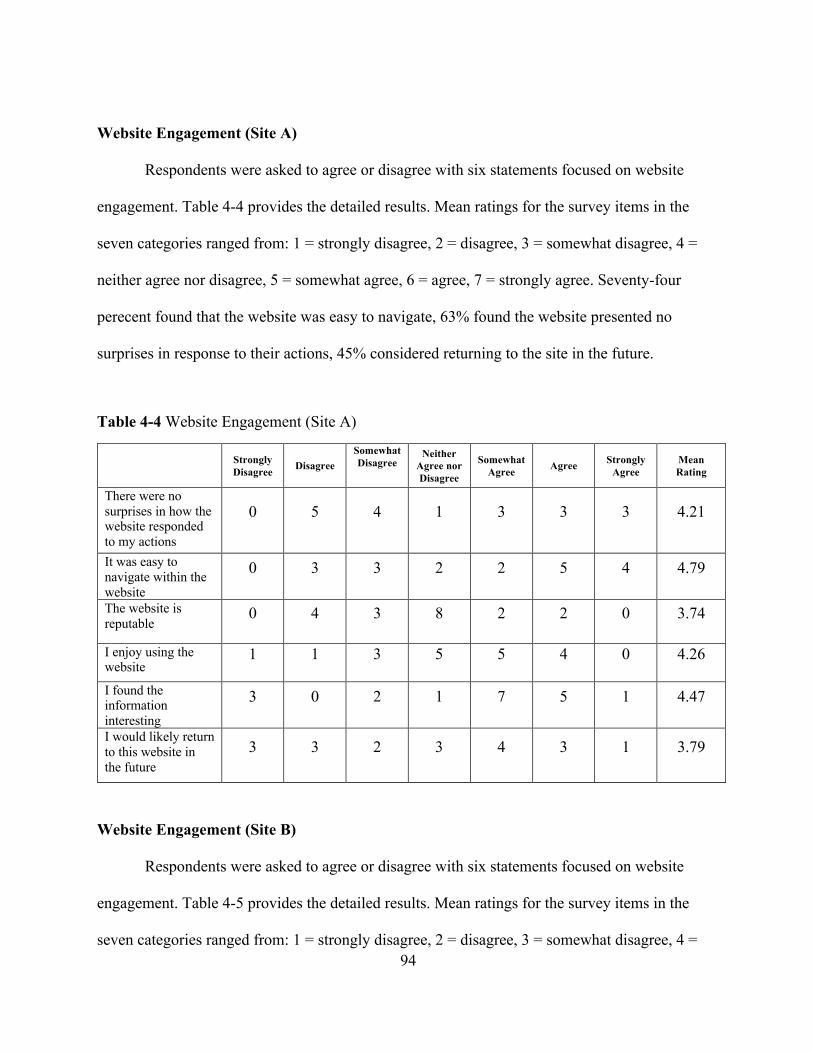
94
Website Engagement (Site A)
Respondents were asked to agree or disagree with six statements focused on website
engagement. Table 4-4 provides the detailed results. Mean ratings for the survey items in the
seven categories ranged from: 1 = strongly disagree, 2 = disagree, 3 = somewhat disagree, 4 =
neither agree nor disagree, 5 = somewhat agree, 6 = agree, 7 = strongly agree. Seventy-four
perecent found that the website was easy to navigate, 63% found the website presented no
surprises in response to their actions, 45% considered returning to the site in the future.
Table 4-4 Website Engagement (Site A)
Strongly Disagree Disagree
Somewhat Disagree
Neither Agree nor Disagree
Somewhat Agree Agree Strongly
Agree Mean Rating
There were no surprises in how the website responded to my actions
0 5 4 1 3 3 3 4.21
It was easy to navigate within the website
0 3 3 2 2 5 4 4.79
The website is reputable
0 4 3 8 2 2 0 3.74
I enjoy using the website
1 1 3 5 5 4 0 4.26
I found the information interesting
3 0 2 1 7 5 1 4.47
I would likely return to this website in the future
3 3 2 3 4 3 1 3.79
Website Engagement (Site B)
Respondents were asked to agree or disagree with six statements focused on website
engagement. Table 4-5 provides the detailed results. Mean ratings for the survey items in the
seven categories ranged from: 1 = strongly disagree, 2 = disagree, 3 = somewhat disagree, 4 =
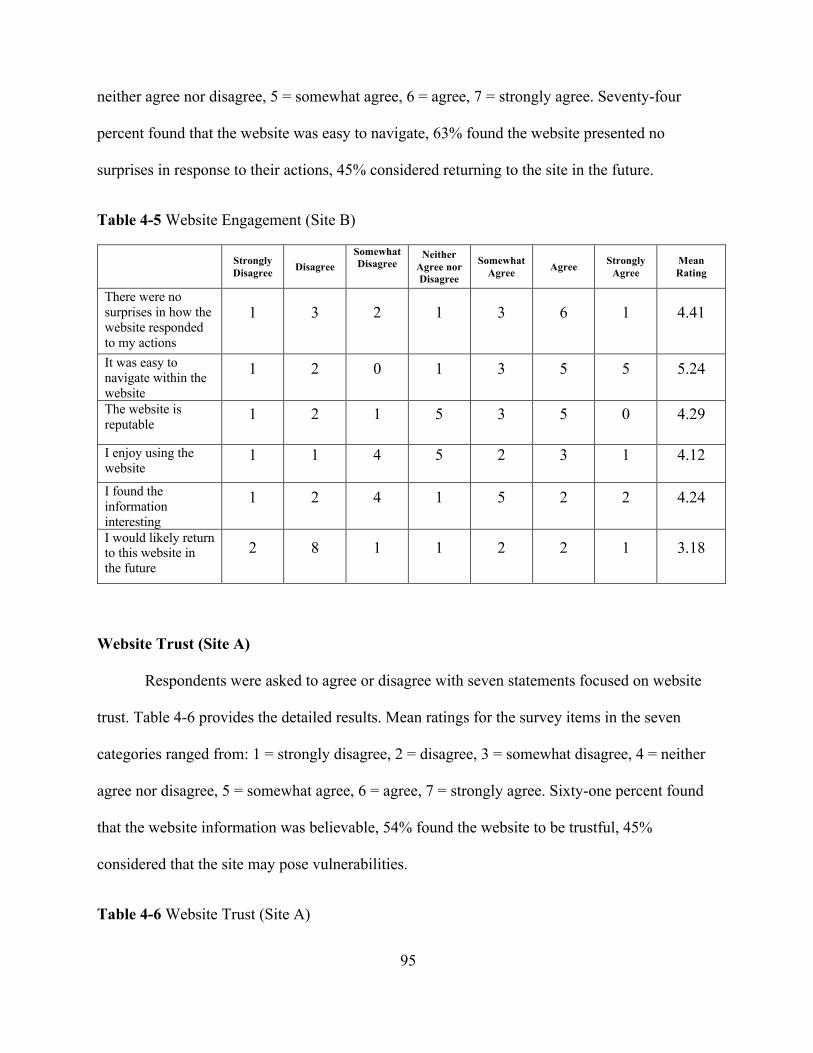
95
neither agree nor disagree, 5 = somewhat agree, 6 = agree, 7 = strongly agree. Seventy-four
percent found that the website was easy to navigate, 63% found the website presented no
surprises in response to their actions, 45% considered returning to the site in the future.
Table 4-5 Website Engagement (Site B)
Strongly Disagree Disagree
Somewhat Disagree
Neither Agree nor Disagree
Somewhat Agree Agree Strongly
Agree Mean Rating
There were no surprises in how the website responded to my actions
1 3 2 1 3 6 1 4.41
It was easy to navigate within the website
1 2 0 1 3 5 5 5.24
The website is reputable
1 2 1 5 3 5 0 4.29
I enjoy using the website
1 1 4 5 2 3 1 4.12
I found the information interesting
1 2 4 1 5 2 2 4.24
I would likely return to this website in the future
2 8 1 1 2 2 1 3.18
Website Trust (Site A)
Respondents were asked to agree or disagree with seven statements focused on website
trust. Table 4-6 provides the detailed results. Mean ratings for the survey items in the seven
categories ranged from: 1 = strongly disagree, 2 = disagree, 3 = somewhat disagree, 4 = neither
agree nor disagree, 5 = somewhat agree, 6 = agree, 7 = strongly agree. Sixty-one percent found
that the website information was believable, 54% found the website to be trustful, 45%
considered that the site may pose vulnerabilities.
Table 4-6 Website Trust (Site A)

96
Strongly Disagree Disagree
Somewhat Disagree
Neither Agree nor Disagree
Somewhat Agree Agree Strongly
Agree Mean Rating
The information on the website is believable
0 2 5 1 8 2 1 4.32
I feel vulnerable when I interact with this website
1 7 4 2 5 0 0 3.16
I believe there could be negative consequences from the use of this site
6 4 2 1 5 1 0 2.89
I feel the need to be cautious using this website
3 4 1 2 4 5 0 3.79
I feel unsafe using this website 6 5 4 2 1 1 0 2.47
I expect this website will not take advantage of me
0 2 3 4 8 2 0 4.26
I trust this website 0 4 5 3 5 2 0 3.79
Website Trust (Site B)
Respondents were asked to agree or disagree with seven statements focused on website
trust. Table 4-7 provides the detailed results. Mean ratings for the survey items in the seven
categories ranged from: 1 = strongly disagree, 2 = disagree, 3 = somewhat disagree, 4 = neither
agree nor disagree, 5 = somewhat agree, 6 = agree, 7 = strongly agree. sixty-six percent found
that the website information was believable, 53% found the website to be trustful, only 36%
considered that the site may pose vulnerabilities.
Table 4-7 Website Trust (Site B)
Strongly Disagree Disagree
Somewhat Disagree
Neither Agree nor Disagree
Somewhat Agree Agree Strongly
Agree Mean Rating
The information on the website is believable
1 2 0 3 4 7 0 4.65

97
I feel vulnerable when I interact with this website
4 6 2 4 1 0 0 2.53
I believe there could be negative consequences from the use of this site
3 5 3 3 1 1 1 3.06
I feel the need to be cautious using this website
1 6 2 3 2 1 2 3.59
I feel unsafe using this website
2 7 2 2 2 1 1 3.12
I expect this website will not take advantage of me
1 3 5 3 1 4 0 3.71
I trust this website 1 5 1 4 3 3 0 3.71
Website Brand (Site A)
Respondents were asked to agree or disagree with six statements focused on website
branding. Table 4-8 provides the detailed results. Mean ratings for the survey items in the seven
categories ranged from: 1 = strongly disagree, 2 = disagree, 3 = somewhat disagree, 4 = neither
agree nor disagree, 5 = somewhat agree, 6 = agree, 7 = strongly agree. Eighty-four percent found
that the website presentation was clean and simple, 72% found the website to be beneficial for
them, only 51% considered the course price to be reasonable.
Table 4-8 Website Brand (Site A)
Strongly Disagree Disagree
Somewhat Disagree
Neither Agree nor Disagree
Somewhat Agree Agree Strongly
Agree Mean Rating
I found the website to be attractive 1 2 0 3 2 9 2 5.00 The website reflects integrity 0 1 3 6 4 4 1 4.53
The website has a clean and simple presentation
0 0 0 3 2 8 6 5.89

98
I find this website beneficial to me
0 2 1 3 4 6 3 5.05
The website helps address some of my problems
1 2 1 1 8 4 2 4.74
The course is reasonably priced 2 4 4 2 5 1 1 3.58
Website Brand (Site B)
Respondents were asked to agree or disagree with six statements focused on website
branding. Table 4-9 provides the detailed results. Mean ratings for the survey items in the seven
categories ranged from: 1 = strongly disagree, 2 = disagree, 3 = somewhat disagree, 4 = neither
agree nor disagree, 5 = somewhat agree, 6 = agree, 7 = strongly agree. Sixty-one percent found
the website attractive, 78% found that the website presentation was clean and simple, only 50%
considered the course price to be reasonable.
Table 4-9 Website Brand (Site B) Strongly
Disagree Disagree Somewhat Disagree
Neither Agree nor Disagree
Somewhat Agree Agree Strongly
Agree Mean Rating
I found the website to be attractive 2 3 0 2 5 3 2 4.29 The website reflects integrity 1 2 3 4 2 5 0 4.12
The website has a clean and simple presentation
0 1 0 2 3 9 2 5.47
I find this website beneficial to me 1 2 1 1 5 6 1 4.71
The website helps address some of my problems
2 1 2 4 3 5 0 4.18
The course is reasonably priced 3 4 3 0 2 5 0 3.53

99
Feelings Towards Website (Site A)
Participants were asked to rate the strength of their feelings towards the website using a
bipolar table variation displaying two extreme feelings. Participants selected a point between
these two extremes. Mean ratings for the survey items in the seven categories ranged from: -3 =
very strong negative affect, -2 = strong negative affect, -1 = somewhat negative affect, 0 =
neither negative or positive affect, 1 = somewhat positive affect, 2 = strong positive affect, 3 =
very strong positive affect. Seventy-six percent felt that the website was relevant, clear (73%),
while 61% reported that they felt the website was interesting.
Table 4-10 Feelings (Site A)
(–) -3 -2 -1 0 1 2 3 Mean Rating (+)
Dissatisfaction 0 2 5 1 4 7 0 4.47 Satisfaction Boring 1 3 2 3 4 5 1 4.32 Interesting Useless 1 0 4 2 4 5 3 4.84 Useful Confusing 0 2 1 2 7 2 5 5.11 Clear Unpleasant 0 0 1 7 7 4 0 4.74 Enjoyable Unhelpful 1 0 2 4 6 4 2 4.79 Helpful Irrelevant 0 0 2 4 3 5 5 5.37 Relevant Unmotivated 0 1 2 5 5 4 2 4.79 Motivated
Feelings Towards Website (Site B)
Participants were asked to rate the strength of their feelings towards the website using a
bipolar table variation displaying two extreme feelings. Participants selected a point between
these two extremes. Mean ratings for the survey items in the seven categories ranged from: -3 =
very strong negative affect, -2 = strong negative affect, -1 = somewhat negative affect, 0 =
neither negative or positive affect, 1 = somewhat positive affect, 2 = strong positive affect, 3 =
very strong positive affect. Sixty-eight percent felt that the website was clear, useful (68%),
while 55% reported that they felt motivated by the website.

100
Table 4-11 Feelings (Site B)
(–) -3 -2 -1 0 1 2 3 Mean Rating (+)
Dissatisfaction 1 1 2 4 2 6 1 4.59 Satisfaction Boring 2 3 1 0 7 3 1 4.18 Interesting Useless 2 1 0 3 4 4 3 4.76 Useful Confusing 2 1 0 3 3 5 3 4.82 Clear Unpleasant 2 1 1 6 3 3 1 4.18 Enjoyable Unhelpful 2 2 0 3 6 2 2 4.35 Helpful Irrelevant 2 2 0 2 5 3 3 4.59 Relevant Unmotivated 4 2 0 3 3 4 1 3.88 Motivated
Net Promoter Score (Site A)
Participants were asked on a scale of 0 to 10 to rate their likelihood of recommending the
company or website to a friend or colleague. Responses were grouped into the following
categories: 0-6 = Detractors, 7-8 = Passives, and 9-10 = Promoters. Then a Net Promoter Score
was obtained by subtracting the percentage of participants who are detractors from the
percentage that are promoters. The Net Promoter Score is an index ranging from -100 to 100 that
measures the willingness of customers to recommend a company’s products or services to others.
This can be used to gauge a customer’s overall satisfaction with a company’s product or service
and the customer’s loyalty to the brand. In total there were: 68% detractors, 26% passives, and
5% promoters. The NPS was -63.16.
Table 4-12 Net Promoter Score (Site A)
68% 26% 5%NPS ( - 6 3 . 1 6 )
Detractor Passive Promoter
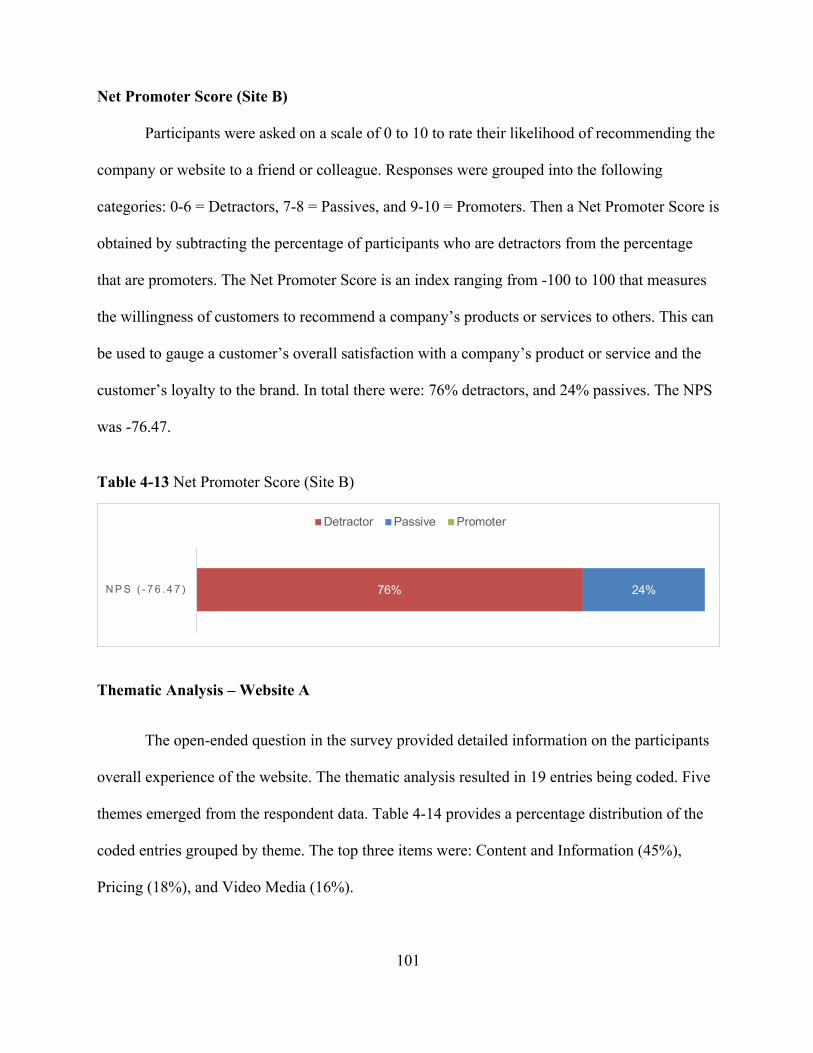
101
Net Promoter Score (Site B)
Participants were asked on a scale of 0 to 10 to rate their likelihood of recommending the
company or website to a friend or colleague. Responses were grouped into the following
categories: 0-6 = Detractors, 7-8 = Passives, and 9-10 = Promoters. Then a Net Promoter Score is
obtained by subtracting the percentage of participants who are detractors from the percentage
that are promoters. The Net Promoter Score is an index ranging from -100 to 100 that measures
the willingness of customers to recommend a company’s products or services to others. This can
be used to gauge a customer’s overall satisfaction with a company’s product or service and the
customer’s loyalty to the brand. In total there were: 76% detractors, and 24% passives. The NPS
was -76.47.
Table 4-13 Net Promoter Score (Site B)
Thematic Analysis – Website A
The open-ended question in the survey provided detailed information on the participants
overall experience of the website. The thematic analysis resulted in 19 entries being coded. Five
themes emerged from the respondent data. Table 4-14 provides a percentage distribution of the
coded entries grouped by theme. The top three items were: Content and Information (45%),
Pricing (18%), and Video Media (16%).
76% 24%NPS ( - 7 6 . 4 7 )
Detractor Passive Promoter

102
Table 4-14 Thematic analysis of website A
Theme Percentage
Content and Information 45
Usability Issues 11
Pricing 18
Video Media 16
Microinteraction Related 10
Content and Information
Several participants commented that they wanted to see more information on the resume
course breakdown and see specifically what the value of the course would bring to them.
Additional comments were wanting to see a blog and more content that could provide credibility
and confidence.
Usability Issues
Participants commented that there were some usability issues experienced with the site,
such as broken links or redirects that weren’t loading correctly. Participants expressed frustration
with not being able to access parts of the site as they wanted more information on the course.
Pricing
Several comments were related to pricing. Some of those were uncertainty on what the
specifics and course deliverables would be. Some participants expressed that they would have
preferred a trial option, while others would have preferred to have a visual representation of what
the deliverables would be.

103
Video/Media
Participants commented that they did not resonate with the video that was included on the
site. Several participants suggested having shorter video clips that were related to the specific
components of the resume course or a sneak peak of the course.
Microinteraction Related
There were a few participants that felt that the “spin-to-win” microinteraction detracted
from their feelings towards the website. Some participants expressed that they do not enjoy any
type of a pop-up or browser triggered event.
Thematic Analysis – Website B
The open-ended question in the survey provided detailed information on the participants
overall experience of the website. The thematic analysis resulted in 19 entries being coded. Five
similar themes from participants in website A emerged from the respondent data. Table 4-14
provides a percentage distribution of the coded entries grouped by theme. The top three items
were: Content and Information (51%), Pricing (22%), and Usability Issues (13%).
Table 4-15 Thematic analysis of website A
Theme Percentage
Content and Information 51
Usability Issues 13
Pricing 22
Video Media 8
Credibility 6
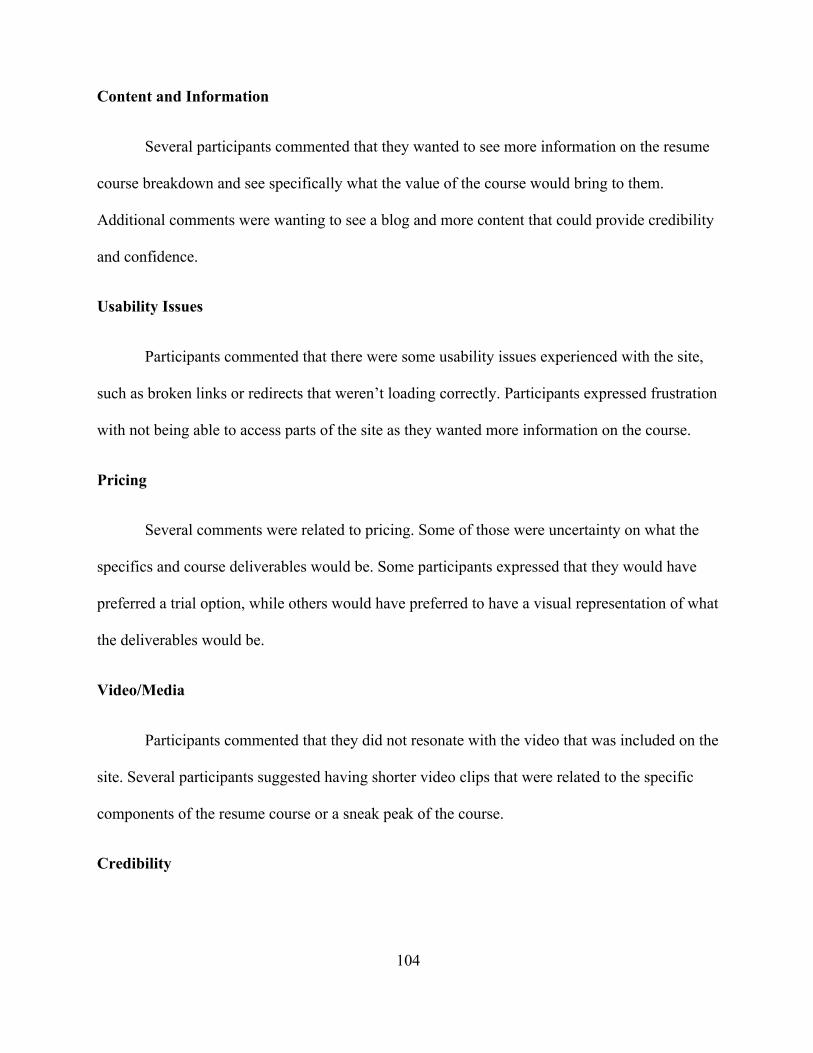
104
Content and Information
Several participants commented that they wanted to see more information on the resume
course breakdown and see specifically what the value of the course would bring to them.
Additional comments were wanting to see a blog and more content that could provide credibility
and confidence.
Usability Issues
Participants commented that there were some usability issues experienced with the site,
such as broken links or redirects that weren’t loading correctly. Participants expressed frustration
with not being able to access parts of the site as they wanted more information on the course.
Pricing
Several comments were related to pricing. Some of those were uncertainty on what the
specifics and course deliverables would be. Some participants expressed that they would have
preferred a trial option, while others would have preferred to have a visual representation of what
the deliverables would be.
Video/Media
Participants commented that they did not resonate with the video that was included on the
site. Several participants suggested having shorter video clips that were related to the specific
components of the resume course or a sneak peak of the course.
Credibility

105
Some participants commented that they didn’t feel that the author or the organizations on
the site provided the level of credibility they expected. Some participants wanted to see brands
that they felt affinity towards endorse the site.
Phase Two Survey Findings
Phase Two of the research involved a survey component designed to answer the research
question:
• What UX ethical guidelines and considerations can be incorporated into the design
process to safeguard and protect a user’s privacy and well-being?
Survey participants were comprised of UX Design professionals from various industries and
practices across the globe. An invitation to participate in the survey was posted to over twenty
professional groups on Facebook and LinkedIn. The researcher provided an incentive giveaway
for a drawing of a $100 Amazon gift for completed surveys. Sixty-six participants participated in
the survey.
The survey contained 21 questions and seven parts: (a) nine participant demographic and
industry questions; (b) questions related to whether biometric or neuromarketing are used, and
what specific biometric tools are used (if applicable); (c) an open-ended question to determine
what the preferred platform or tool currently used to conduct UX testing; (d) questions to
determine whether a formal ethical framework is in place for UX testing, and what popular
ethical frameworks participants were or were not familiar with; (e) four Likert scaled statements
regarding the participants confidence in: UX testing, anticipations and recognition of potential
malicious use of products or services, confidence of the business model to protect users, and
confidence that the organization’s commitment to excellence; (f) two rating scale questions (on a

106
scale of 1-10) were asked to determine the confidence levels of the business model, and the team
members to actively safeguard user’s from potential risk; (g) an open ended question asking
participants what their greatest challenge or concern in UX testing and research was asked. The
survey was open on June 10, 2019 and closed on July 3, 2019. An online survey software,
Qualtrics, was used to collect and analyze the responses.
Description of the survey participants
This sample was comprised of 36 women and 30 men. Individuals identified as 54%
White/Caucasian, 27% Asian, 6% Latina/Latino/Latinx/Hispanic, 4% Black/African-American,
1% Native American/First Nations/First People, and 1% Other. The main area of work was: UX
Design (18%), Experience Design (11%), and Strategy (10%). Most participants worked full-
time at an agency/consultancy (28%) and in-house (19%). The main three organizational
business focus areas were: Strategy Innovation (16%), Product Design (16%), and Branding
(12%). The main work titles held by participants were: UX Designer (25%), Researcher (15%),
and Lead Designer (12%). Most participants came from organizations with less than 10
employees (41%) followed by participants that had 1,000 employees (26%). This correlated with
the organizational annual revenue where most participants had under $499K (43%) followed by
over $250M (18%). Participants came from 22 countries, the main three countries were: United
States (33%), United Kingdom (9%), and India (9%).
Table 4-16 Survey Demographics
Factor Total Sample (Site A)
Gender N % Female % Male % Trans % Intersex
66
54.55 45.55 0 0 0

107
% Other
Ethnicity N % Asian % Bi-multi racial % Black/African-American % Latina/Latino/Latinx/Hispanic % Native American/First Nations/First People % Native Hawaiian/ other Pacific Islander % White/Caucasian % Prefer not to say % Other
66
27.27 1.52 4.55 6.06 1.52 0 54.55 1.52 3.03 1.52
Area of Work N % AI/Algorithm % Animation % AR/VR Design % Data Science % Experience Design % Graphic Design % Illustration % Interaction Design % Marketing % Motion Graphics % Research % Strategy % UX Design % UI Design % Other
66
1.22 1.22 2.04 1.22 11.84 9.80 2.86 8.57 8.57 2.04 8.98 10.20 18.37 9.39 3.67
Employment Status N % Educator % Full-time employee (agency/consultancy) % Full-time employee (in-house) % Freelance % Self-employed % Not working % Student
66
6.06 28.79 19.70 10.61 18.18 3.03 13.64
Organizational Focus 66

108
N % Advertising % Branding % Product Design % Industrial Design % Media % Service Design % Social Impact % Student % Research % Strategy/Innovation % Other
7.88 12.73 16.36 0.61 7.27 10.91 4.24 6.67 10.91 16.97 5.45
Title/Position N % Owner, partner, principle % President or VP % Creative Director % Design Lead or manager % Senior Designer % C-Level % UX Designer % UI Designer % Researcher % Other
66
12.10 0.81 5.65 12.10 11.29 0 25.81 9.68 15.32 7.26
Organizational Size N % 1-10 employees % 11-50 employees % 51-100 employees % 101-250 employees % 251-999 employees % 1,000+ employees
66
41.79 14.93 5.97 5.97 4.48 26.87
Country of Origin N % Australia % Bangladesh % Canada % Finland % Germany % Hungary % Iceland % India % Israel
66
1.52 1.52 3.03 3.03 3.03 1.52 1.52 9.09 1.52

109
% Italy % Jordan % Malaysia % Norway % Pakistan % Poland % South Africa % Spain % Sweden % Uganda % United Kingdom % United States % Vietnam
6.06 1.52 1.52 1.52 1.52 6.06 7.58 1.52 1.52 1.52 9.09 33.33 1.52
Organizational Revenue (annual)
N % under $499K % $500K - $999K % $1M - $4.9M % $5M - $9M % $10M - $49M % $50M - $99M % $100 - $249M % Over $250M
66
43.94 7.58 7.58 10.61 3.03 7.58 1.52 18.18
Use of Biometric Tools
Most participants reported that they currently do not use biometrics in UX testing (89%).
Table 4-17 Current Use of Biometrics or Neuromarketing in UX Testing
89%
11%
Yes No
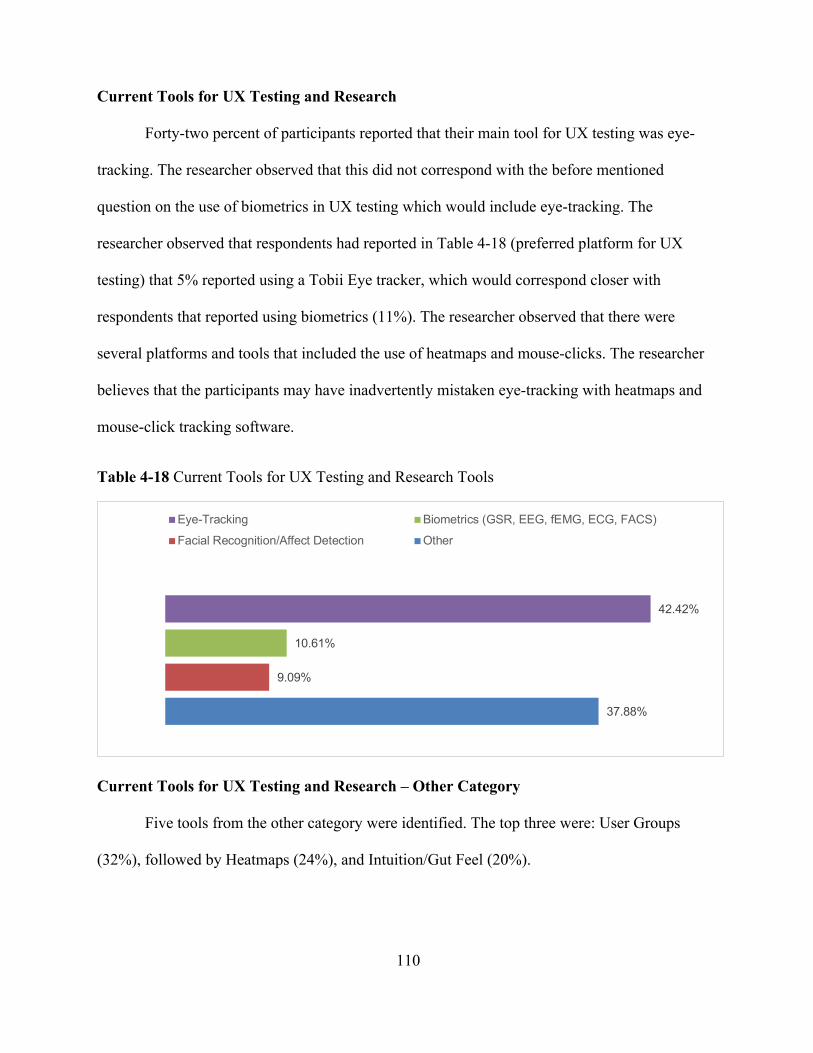
110
Current Tools for UX Testing and Research
Forty-two percent of participants reported that their main tool for UX testing was eye-
tracking. The researcher observed that this did not correspond with the before mentioned
question on the use of biometrics in UX testing which would include eye-tracking. The
researcher observed that respondents had reported in Table 4-18 (preferred platform for UX
testing) that 5% reported using a Tobii Eye tracker, which would correspond closer with
respondents that reported using biometrics (11%). The researcher observed that there were
several platforms and tools that included the use of heatmaps and mouse-clicks. The researcher
believes that the participants may have inadvertently mistaken eye-tracking with heatmaps and
mouse-click tracking software.
Table 4-18 Current Tools for UX Testing and Research Tools
Current Tools for UX Testing and Research – Other Category
Five tools from the other category were identified. The top three were: User Groups
(32%), followed by Heatmaps (24%), and Intuition/Gut Feel (20%).
37.88%
9.09%
10.61%
42.42%
Eye-Tracking Biometrics (GSR, EEG, fEMG, ECG, FACS)
Facial Recognition/Affect Detection Other

111
Table 4-19 UX Testing & Research Tools – Other Category
Other Tools Percentage
Heatmaps 24
Think Aloud 8
User Groups 32
Session Recordings 16
Intuition/Gut Feel 20 Preferred Tool or Platform for UX Testing
Participants were asked what their preferred tool or platform was for UX Testing. There
were 11 platforms/tools in total that were identified. Proprietary platforms (18%) were identified
as the main tool for testing followed by, User Zoom (14%), and Hotjar (12%). The additional
platforms and tools are listed below (See Table 4-18).
Table 4-20 Preferred Tool or Platform for UX Testing
Platform/Tool Percentage
Adobe XD 5
Axure 4
Crazyegg 5
Google Analytics 9
Hotjar 12
InVision 9
Proprietary platform 18
Tobii Eye Tracker 5
Usertesting.com 9
User Zoom 14
User Interviews 11
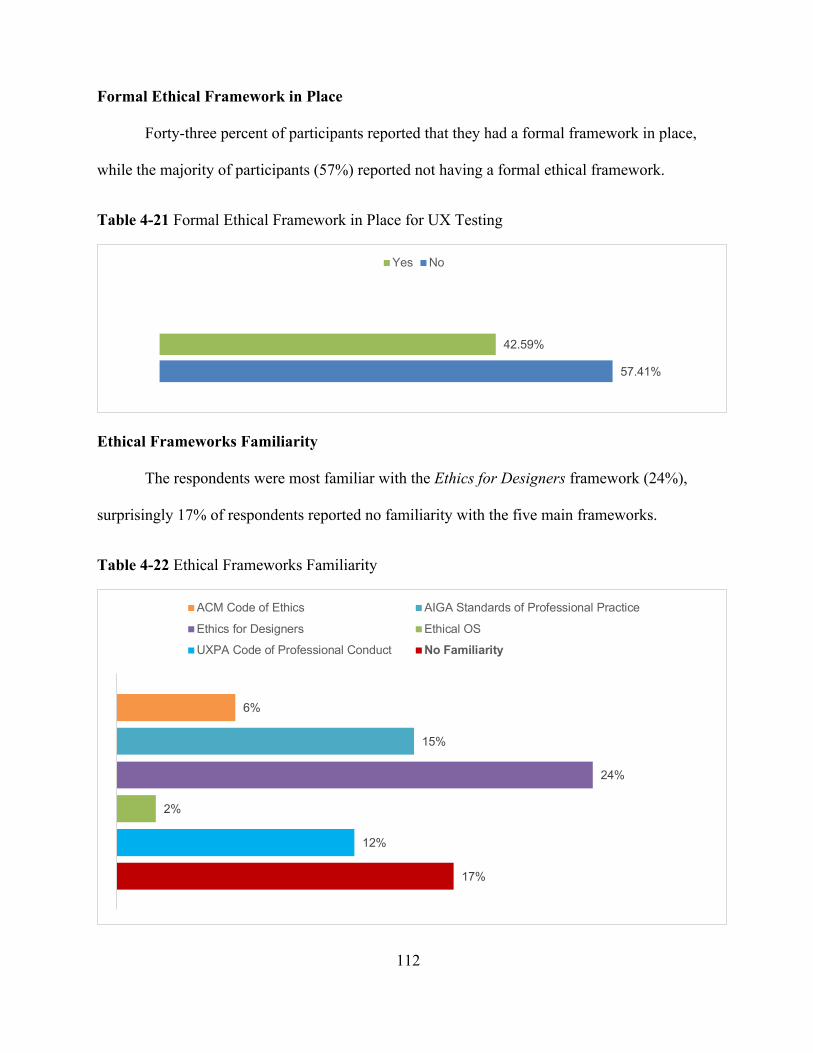
112
Formal Ethical Framework in Place
Forty-three percent of participants reported that they had a formal framework in place,
while the majority of participants (57%) reported not having a formal ethical framework.
Table 4-21 Formal Ethical Framework in Place for UX Testing
Ethical Frameworks Familiarity
The respondents were most familiar with the Ethics for Designers framework (24%),
surprisingly 17% of respondents reported no familiarity with the five main frameworks.
Table 4-22 Ethical Frameworks Familiarity
57.41%
42.59%
Yes No
17%
12%
2%
24%
15%
6%
ACM Code of Ethics AIGA Standards of Professional Practice
Ethics for Designers Ethical OS
UXPA Code of Professional Conduct No Familiarity
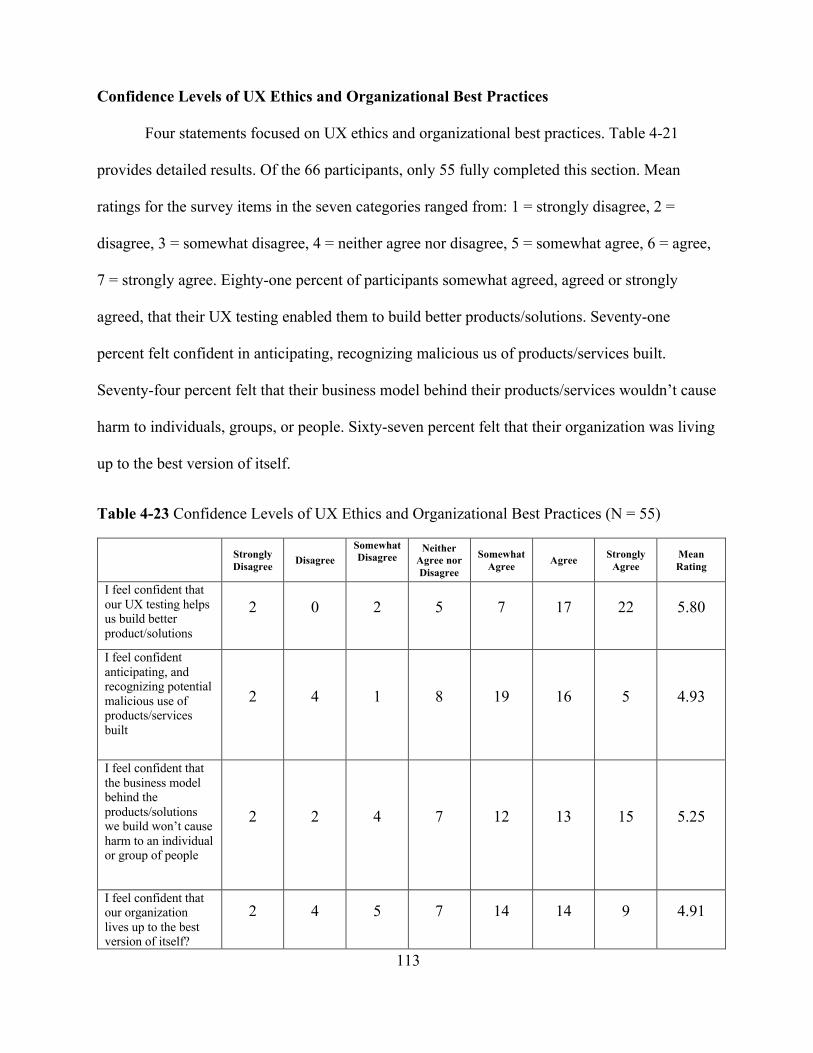
113
Confidence Levels of UX Ethics and Organizational Best Practices
Four statements focused on UX ethics and organizational best practices. Table 4-21
provides detailed results. Of the 66 participants, only 55 fully completed this section. Mean
ratings for the survey items in the seven categories ranged from: 1 = strongly disagree, 2 =
disagree, 3 = somewhat disagree, 4 = neither agree nor disagree, 5 = somewhat agree, 6 = agree,
7 = strongly agree. Eighty-one percent of participants somewhat agreed, agreed or strongly
agreed, that their UX testing enabled them to build better products/solutions. Seventy-one
percent felt confident in anticipating, recognizing malicious us of products/services built.
Seventy-four percent felt that their business model behind their products/services wouldn’t cause
harm to individuals, groups, or people. Sixty-seven percent felt that their organization was living
up to the best version of itself.
Table 4-23 Confidence Levels of UX Ethics and Organizational Best Practices (N = 55)
Strongly Disagree Disagree
Somewhat Disagree
Neither Agree nor Disagree
Somewhat Agree Agree Strongly
Agree Mean Rating
I feel confident that our UX testing helps us build better product/solutions
2 0 2 5 7 17 22 5.80
I feel confident anticipating, and recognizing potential malicious use of products/services built
2 4 1 8 19 16 5 4.93
I feel confident that the business model behind the products/solutions we build won’t cause harm to an individual or group of people
2 2 4 7 12 13 15 5.25
I feel confident that our organization lives up to the best version of itself?
2 4 5 7 14 14 9 4.91
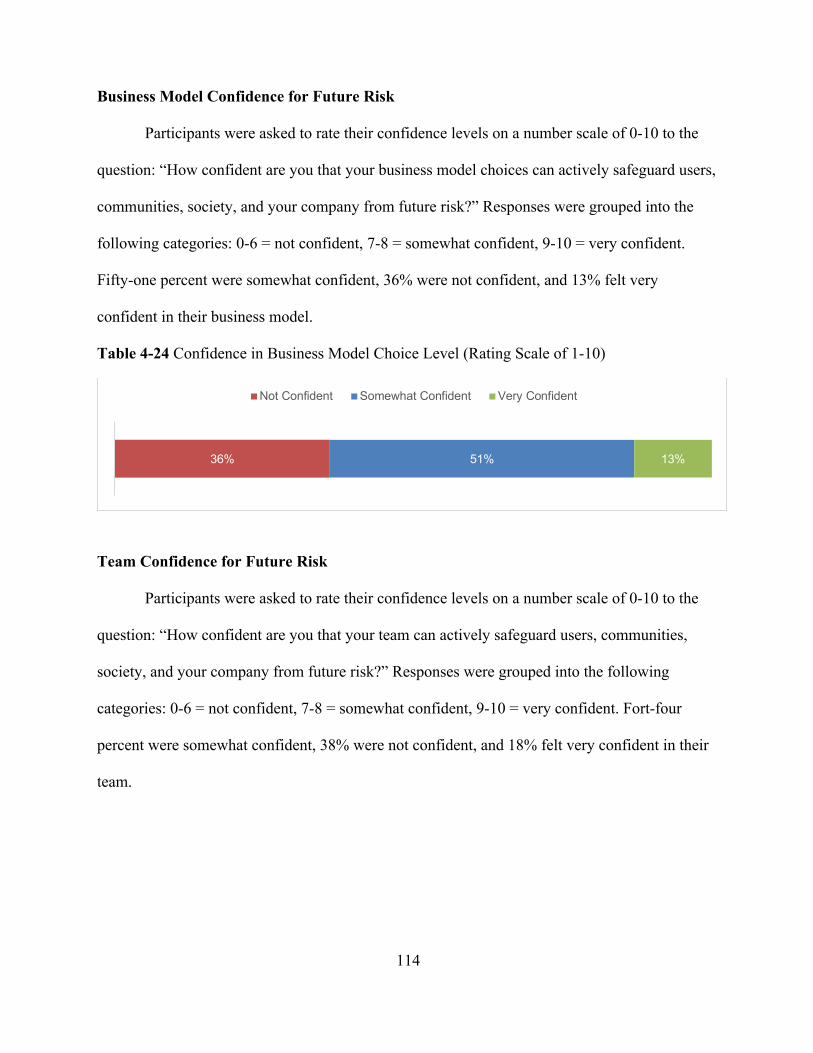
114
Business Model Confidence for Future Risk
Participants were asked to rate their confidence levels on a number scale of 0-10 to the
question: “How confident are you that your business model choices can actively safeguard users,
communities, society, and your company from future risk?” Responses were grouped into the
following categories: 0-6 = not confident, 7-8 = somewhat confident, 9-10 = very confident.
Fifty-one percent were somewhat confident, 36% were not confident, and 13% felt very
confident in their business model.
Table 4-24 Confidence in Business Model Choice Level (Rating Scale of 1-10)
Team Confidence for Future Risk
Participants were asked to rate their confidence levels on a number scale of 0-10 to the
question: “How confident are you that your team can actively safeguard users, communities,
society, and your company from future risk?” Responses were grouped into the following
categories: 0-6 = not confident, 7-8 = somewhat confident, 9-10 = very confident. Fort-four
percent were somewhat confident, 38% were not confident, and 18% felt very confident in their
team.
36% 51% 13%
Not Confident Somewhat Confident Very Confident

115
Table 4-25 Confidence in Team Level (Rating Scale of 1-10)
Thematic Analysis – Biggest Challenge or Concern in UX Research
The open-ended question in the survey provided detailed information on some of the
current challenges facing UX professionals. The thematic analysis resulted in 66 entries being
coded. Six themes emerged from the respondent data. Table 4-24 provides a percentage
distribution of the coded entries grouped by theme. The top three concerns were:
Budget/resources constraints (45%), Stakeholder buy-in (18%), and Formal UX process (12%).
Table 4-26 Thematic Analysis of Concerns in UX Research
Theme Percentage
Managing user research data and participant privacy 7
Stakeholder buy-in 18
Formal UX process 12
Budget/resource constraints 45
Finding the right participants 10
Culture of ethics 8
Managing User Research Data and Participant Privacy
Managing user data includes the data collected from users and being compliant with any
data regulations such as GDPR (General Data Protection Regulation). Additional components are
38% 44% 18%
Not Confident Somewhat Confident Very Confident

116
informing participants on what details and data are collected, collecting only what’s needed, and
agreeing to retention periods, third-party contractor management and reporting. Participants
voiced concern of inconsistencies of user data protection and not always knowing how to best
safeguard user’s data.
Stakeholder Buy-in
Stakeholder engagement is a critical part of the UX process. One of the biggest
challenges that were voiced was not having upper management or key personal invested in the
idea of UX research. Additional concerns identified were the stakeholder’s concern of financial
payback or return of UX activities and research.
Formal UX Process
A UX process is similar to a Design Thinking approach, which consists of five basic
phases: empathizing with users, defining the problem, ideation, prototyping, and testing.
Processes for UX design typical differ depending on the needs of the organization, technology
stacks, and the ability to deliver at scale. While these organizations and processes vary, it is
generally best practice to formally adopt and customize a UX process for all stakeholders. Some
participants voiced concern that they lacked a consistent UX process within their organization.
Additional comments were on testing and validating the problem early in the process and using
those insights to influence the prototype phase.
Budget/Resource Constraints
Several participants shared concerns of budgeting the resources to do research during the
early phases of development and not just after the launch of the product. Additional comments
and concerns were directed towards being able to demonstrate the right level of ROI (return on
investment) to stakeholders in order to get continuous buy-in for research on future projects.

117
Finding the Right Participants
One of the most critical components of UX research is identifying and selecting the right
participants and the right number of them. Survey respondents commented that there were
inconsistencies in the quality and methods of finding and recruiting the right participants.
Additional comments were directed towards not knowing current customers well enough to ask
the right questions or formulate better research questions.
Culture of Ethics
Participants voiced concern on knowing the best practices in UX/UI research and
developing a culture of ethics within their organizations. Participants observed that occasionally
business objectives and ethical principles are not always in alignment. Additional comments
shared were that business models generally started with the best intentions, however when there
was an exploit or potential ethical breach, it was not clear how to get things back on track.
Summary
This chapter described the collected results from Phase One and Phase Two of the
convergent mixed methods design. Results of the use of an opt-in microinteraction with
biometric and traditional user survey tools demonstrated the efficacy of using biometrics in UX
testing to improve the user experience. Emotional data biometrics and survey data from
participants related to relevance, engagement, trust, and brand were reviewed. The efficacy of
microinteractions to influence user behavior through opt-in rates was analyzed and reviewed.
Results from UX professionals provided deeper insights into ethical guidelines and
considerations that could enhance the design process and safeguard user’s privacy. Chapter Five
will discuss the conclusions, study limitations, and recommendations for future study and
contributions to User Experience Design.
118
Chapter 5 : Conclusion and Future Consideration
Chapter five reviews the study issue and purpose, study limitations and discussion of
opportunities for future work are discussed.
Study Issue and Purpose
The purpose of this convergent mixed-methods study was to address the overall central
guiding question: How can biometrics be integrated into the design process to validate creative
assets and improve user experience? This research question was addressed through exploration
of three topics 1.) measurement of emotion in relationship to the overall brand 2.) the role of
microinteractions and user behavior 3.) and ethical guidelines and considerations. These specific
sub-questions were:
1. What emotional data metrics can be used to measure content for relevance and
engagement, build trust, and strengthen a brand?
2. What is the efficacy of microinteractions to form habits and changes in user behavior?
3. What UX ethical guidelines and considerations can be incorporated into the design
process to safeguard and protect a user’s privacy and well-being?
Research Question Conclusions
The central guiding question asked, “How can biometrics be integrated into the design
process to validate creative assets and improve user experience?”
Conclusion: biometric research is best integrated into the design process when
the specific outcomes and achievements are identified and formed into a specific research
question. Due to the quantitative nature of the biometric data, it is beneficial to use precise
119
metrics to analyze. Second, define what stimuli and sensors should be used. For instance, is a UX
designer is interested in reviewing the impact or efficacy of a video, it would be beneficial to use
eye tracking, facial expression analysis, and GSR sensors to provide the level of emotional
arousal and the inferred emotions. Third, create the research study and collect data. As with any
research there are best practices and strategies to use with various participants and sample sizes.
It could be beneficial for UX designers to conduct a small test study during the Prototype phase
of the Design Process. The insights from this study can help provide baseline information to
optimize the study and follow the Iteration phase of the Design Process. Biometrics have the
potential to speed up the design process as it can provide more clarity into user affect, behavior,
and affinity.
Research Sub-Question One Conclusions
Research sub-question one addressed, “What emotional data metrics can be used to
measure content for relevance and engagement, build trust, and strengthen a brand?
Conclusions: this study used biometric data to understand inferred user affect through
facial expression analysis. There were several channels that inferred several emotions. While this
information was informative and insightful to provide a contextual overview during a
participant’s session, it would be valuable to have a set of key performance emotional indicators
that an organization could actively baseline to improve their brand and strengthen the overall
user experience. Much like a Net Promoter score that provides a universally understandable and
recognizable way of improving customer satisfaction, it would be beneficial to conduct further
research into what specific emotion metrics organizations could use to improve their delivery of
services to their users.

120
Research Sub-Question Two Conclusions
Research sub-question two addressed, “What is the efficacy of microinteractions to form
habits and changes in user behavior?”
Conclusions: microinteractions are impactful and can strengthen the overall brand but
are an exercise of restraint where less is more. This study took a risk by using an opt-in
microinteraction that utilization a gamification experience. Some users do not like pop-ups or
experience a strong negative affect towards brands and sites that use them. Based on the opt-in
rates, this microinteraction was impactful and effective at increasing opt-in rates, however after
reviewing the biometric data and survey results the researcher believes that an iteration of the
microinteraction that is more discrete and less obtrusive could add value to the target market
audience and help strengthen the brand.
Research Sub-Question Three Conclusions
Research sub-question three addressed, “What UX ethical guidelines and considerations
can be incorporated into the design process to safeguard and protect a user’s privacy and well-
being?”
Conclusions: based on the survey feedback from within the UX profession one of the
key areas of concern was developing a more structured or formal UX process. This can help
address the other concern of stakeholder involvement. Inviting organizational stakeholders and
decision makers into the UX process is critical to establishing the value of user-based research
and ensuring that decisions are made to safeguard the users. Ethical frameworks that encourage
organizational conversations about the impact of their business model, product/solutions, and
technical impact have the potential to shift organizations to become proactive participants in
managing and mitigating risk. Due to the diversity of organizations that use various interactive

121
technologies for their users, there is no one-size-fits-all approach. A framework such as Ethical
OS encourages open conversation to discuss core areas that stakeholders and leaders might not
proactively be thinking about. UX professionals are at the forefront of the products and services
that are used by most individuals on a daily basis. It is critical that they see themselves as the
stewards that protect their users and safeguard their information.
Limitations of the Study
Biometric systems provide an enormous amount of data to analyze. It also requires
decisions and assumptions to made under uncertainty. Appraisal theorists of emotion suggest that
context has an influence on emotion. While the visual markers and data points infer a range of
emotions and intensity levels, it is beneficial for the researcher to understand the user context and
to attempt to ascertain the possible reasons that the user is experiencing the specific inferred
emotion. Biometric data utilizes complex theories and algorithms and requires additional
expertise and training to ensure the correct assumptions are being made. The researcher isolated
the data to focus exclusively on the initiation of the microinteraction. Additional attention,
consulting, and attention was carried out to ensure that the data and analysis was reliable.
Lighting conditions and skin tones can affect sensor readings and calibration. It was
observed by the researcher that there were some challenges in eye tracking calibrations on
certain participants with darker skin tones and darker eyes. Some of these calibration issues were
resolved by changing the lighting conditions and attempting a full eye calibration test.
Furthermore, it was observed that the time of day and light streaming in through the drawn
shades had an impact on the eye tracking effectiveness. This was resolved by moving the
affected participants to a station with a more controlled lighting environment.
122
Technical issues, software updates, and hardware anomalies. During the session, there
were technical issues that caused some of the work stations to crash and the session terminated
early for some participants. Although no data was lost, it was observed that this interruption
might impact the user’s overall experience and possibly impact affect levels. While it did not
appear to have a negative impact on the data, it did provide an opportunity for the researcher to
consider provisions for technical support allocations and on-call technicians in future data
collection strategies.
Target market audience and research sample. This study used participants that resided
within the College Station, Texas area. Participants were limited to one state and one region
therefore, might not accurately reflect a more diverse population. Ideally this study would have
used participants from several regions and states. Future work and consideration could benefit
from a more diverse population and sample.
Website design and marketing limitations. This study used an existing organizations
content and websites to A/B test the impact of an opt-in microinteraction. Based on the feedback
and comments from participants, it would have been more beneficial to have a site where
participants weren’t distracted by usability or content issues to more accurately measure the
biometric nuances with a microinteraction. Future research could benefit from using biometric
data to drive the design process and isolate the specific interactions or creative assets to gain
deeper insights.
The microinteraction was effective however, participants biometric data suggests that
there are additional opportunities available to improve the user experience. By using the
biometric data in real-time, the researcher was able to identify trends and formulate hypothesis
that could improve the overall user experience. After comparing the various sessions from
123
website A and website B, it was observed that isolating and pinpointing flaws and potential
obstacles for users became faster.
Study Internal Validity
The limitations of this study could result in threats to the internal validity. The research
proactively took steps to minimize these threats to ensure reliable interpretations of the data. The
convergent mixed methods allowed the researcher to collect multiple data sets of biometric
quantitative data, and qualitative data. To further ensure the internal validity of the study, the
researcher consulted with several peers, biometric specialists, and individuals that could provide
validation and expertise on the study and data.
Discussions, Opportunities and Future Work
User Experience Design and research presents many challenges and opportunities.
Specifically, understanding and knowing what psychometric or emotional affective metrics to
use compared to usability metrics. This presents a new challenge to UX researchers to better
understand what their users experience compared to what they expect.
Microinteractions have the potential to have a significant impact on the overall user
experience. As Dan Saffer (2014) and many other designers have commented, designing and
developing impactful interactions is an exercise of restraint where less is more. Use biometric
sensors and platforms allows UX and UI designers the opportunity to validate creative assets
before releasing them to a broader audience. This can help strengthen the overall organizational
brand and user affinity with the brand. It could be beneficial to develop a more concise and
robust taxonomy of microinteractions and their trends. By using biometric sensor data,
124
animations, sounds, interactivity and other forms of user feedback can be more explicitly
measure to ascertain the impact of the interaction against the individual or targeted audience.
Conclusions
Conducting biometric research is complicated. Many users and individuals inadvertently
or consciously filter their feelings. Using biometric sensor for UX testing presents large data sets
for researchers to better understand their audience and users. This study contributes to the UX
field to understand the impact of biometrics systems, and to measure creative assets such as
microinteractions for efficacy, impact, and enjoyment. Future research would be beneficial in
determining what key emotional metrics would be beneficial to strengthen a brand and
strategically enhance the development of products and services.

125
References
Al Masri, A., Jasra, S. K. (2016). The Forensic Biometric Analysis of Emotions from Facial
Expressions and Physiological Processes from the Heart and Skin. Journal of Emerging
Forensic Sciences Research. 1(1), 61-77.
Apple (2019). Human Interface guidelines. Retrieved from:
https://developer.apple.com/design/human-interface-guidelines/ios/overview/themes/
Baker, J. (2018, April 09). Red Routes - Critical Design Paths That Make or Break Your App.
Retrieved from https://medium.muz.li/red-routes-critical-design-paths-that-make-or-
break-your-app-a642ebe0940a
Bergstrom, J., Schall, A., Dunkerley, M., Scherer, H., & Studholme, A. (2014). Eye tracking in
user experience design. Waltham, Massachusetts: Morgan Kaufmann.
Bernard, H. (2002). Research methods in anthropology: Qualitative and quantitative methods.
AltaMira Press.
Brown, T. (2009). Change by Design: How Design Thinking Transforms Organizations and
Inspires Innovation. New York: HarperCollins.
Burch, M. (2018). Which Symbols, Features, and Regions Are Visually Attended in Metro
Maps?
Burroughs, Edgar Rice, (1916). The Beasts of Tarzan. New York: A.L. Burt
Calvo, R., D'Mello, S., Gratch, J., Kappas, A., & Picard, R. (2015). The Promise of Affective
Computing. In The Oxford Handbook of Affective Computing (p. The Oxford Handbook of
Affective Computing, Chapter 013). Oxford University Press.
Carver, Charles S. and Scheier, Michael F. (2001): On the Self-Regulation of
Behavior.Cambridge University Press

126
Carroll, John M. (1997). Human-computer interaction: Psychology as a science of
design. Annual Review of Psychology, 48, 61.
Chinchilla, R. (2012). Ethical and Social Consequences of Biometric Technologies in the US:
Implementation in Engineering Curriculum. American Society for Engineering
Education. Pp. 00816-11. 2012., 00816-00811.
Christian P., Crane, E., Fabri, M., Agius, H., & Axelrod, L. (2008). Emotion in HCI: designing
for people.. 189-190. 10.1145/1531826.1531883.
Creswell, J., & Plano Clark, Vicki L. (2011). Designing and conducting mixed methods research
(2nd ed.).
Craig, A., Tran, Y., Wijesuriya, N., Nguyen, H. (2012). Regional brain wave activity changes
associated with fatigue. Psychophysiology 49:574–582
Czarnowski, R. J. Howlett, & L. C. Jain (Eds.), Intelligent Decision Technologies 2017:
Proceedings of the 9th KES International Conference on Intelligent Decision
Technologies (KES-IDT 2017) – Part II (pp. 237–246). Cham: Springer International
Publishing. https://doi.org/10.1007/978-3-319-59424-8_22
Colman, A. (2015). A dictionary of psychology. Oxford: Oxford University Press.
DeLeeuw, Krista E., & Mayer, Richard E. (2008). A Comparison of Three Measures of
Cognitive Load: Evidence for Separable Measures of Intrinsic, Extraneous, and Germane
Load. Journal of Educational Psychology, 100(1), 223-234.
Ekman, P. & Rosenberg, E. (2005). What the face reveals : basic and applied studies of
spontaneous expression using the facial action coding system (FACS. Oxford New York:
Oxford University Press. DOI:10.1093/acprof:oso/9780195179644.001.0001
127
Eysenck, H., & Martin, I. (1987). Theoretical foundations of behavior therapy (Perspectives on
individual differences). New York: Plenum Press.
Farnsworth, B. (2018). What is EEG (Electroencephalography) and How Does it Work?
Retrieved April 9, 2019, from https://imotions.com/blog/what-is-eeg/
Forrester, D. (2019, February 22). What Is Dwell Time & Why It Matters for SEO. Retrieved
from https://www.searchenginejournal.com/dwell-time-seo/294471/
Gruber, J. (2012). On the Behavior of the iPhone Mute Switch. Daring Fireball. Retrieved from:
https://daringfireball.net/2012/01/iphone_mute_switch_design
Grudin, J. (2012). A Moving Target: The evolution of Human-computer Interaction. In J. Jacko
(Ed.), Human-computer interaction handbook: Fundamentals, evolving technologies, and
emerging applications. (3rd edition). Taylor & Francis.
Gwizdka, J. (2018). Inferring Web Page Relevance Using Pupillometry and Single Channel
EEG. In F. D. Davis, R. Riedl, J. vom Brocke, P.-M. Léger, & A. B. Randolph
(Eds.), Information Systems and Neuroscience (Vol. 25, pp. 175–183). Cham: Springer
International Publishing. https://doi.org/10.1007/978-3-319-67431-5_20
Harmon-Jones, E., & Winkielman, P. (Eds.). (2007). Social neuroscience : Integrating biological
and psychological explanations of social behavior. Retrieved from https://ebookcentral-
proquest-com.ezp-prod1.hul.harvard.edu
Harmon-Jones, E., & Beer, J. (2009). Methods in social neuroscience. New York: Guilford
Press.
Harmony, T. (2013). The functional significance of delta oscillations in cognitive
processing. Frontiers in Integrative Neuroscience.7:83 10.3389/fnint.2013.00083

128
Hassenzahl, Marc (2006): Hedonic, Emotional, and Experiential Perspectives on Product
Quality. In: Ghaoui, Claude (ed.). “Encyclopedia of human computer interaction”. Idea
Group Referencepp. 266-272
Henia, B., Wiem, M., & Lachiri, Z. (2017). Emotion sensing from physiological signals using
three defined areas in arousal-valence model. 2017 International Conference on Control,
Automation and Diagnosis (ICCAD), 219-223.
Howard, T. (2014). Journey mapping: A brief overview. Communication Design Quarterly,
2(3),10‐12.
iMotions Global. (2016). Facial Expression Analysis Solutions. Retrieved March 28, 2018, from
https://imotions.com/facial-expressions/
iMotions Biometric Research Platform 7.2, iMotions A/S, Copenhagen, Denmark, 2019.
Institute for the Future and Omidyar Network (2018). Risk Mitigation Checklist. Retrieved from
https://ethicalos.org/wp-content/uploads/2018/08/EthicalOS_Check-List_080618.pdf
ISO 9241-210:2010(en) (2010). Ergonomics of human-system interaction – Part 210: Human-
centred design for interactive systems. Standard. International Organization for
Standardization, Brussels.
Ioannidou, F., Hermens, F., & Hodgson, T. L. (2017). Mind Your Step: the Effects of Mobile
Phone Use on Gaze Behavior in Stair Climbing. Journal of Technology in Behavioral
Science. https://doi.org/10.1007/s41347-017-0022-6
Jain, A., Flynn, P., & Ross, A. (2008). Handbook of Biometrics. Boston, MA: Springer US.
Jang, E., Park, B., Park, M., Kim, S., & Sohn, J. (2015). Analysis of physiological signals for
recognition of boredom, pain, and surprise emotions. Journal of Physiological
Anthropology, 34(1).
129
Jia, X., Kohn, A. (2011). Gamma Rhythms in the Brain. PLOS Biology. 9(4):e1001045 doi:
10.1371/journal.pbio.1001045
Joyce, A. (2018). Microinteractions in User Experience. Retrieved April 1, 2019, from
https://www.nngroup.com/articles/microinteractions/
King, R., Churchill, E., & Tan, C. (2017). Designing with data : Improving the user experience
with A/B testing (First ed.). Sebastopol, CA: O'Reilly.
Kaptelinin, Victor and Nardi, Bonnie A. (2007): Acting with technology: Activity theory and
interaction design. InFirst Monday, 12 (4)
King, R., Churchill, E., & Tan, C. (2017). Designing with data: Improving the user experience
with A/B testing (First ed.). Sebastopol, CA: O'Reilly.
Klimesch, W. (2012). Alpha-band oscilaltions, attention, and controlled access to stored
information. Trends Cogn Sci.16(12):606–17. 10.1016/j.tics.2012.10.007
Komninos, A. (2018). How Emotions Impact Cognition. Retrieved from https://www.interaction-
design.org/literature/article/how-emotions-impact-cognition
Kortelainen, J., Tiinanen, S., Huang, X., Li, X., Laukka, S., Pietikainen, M., & Seppanen, T.
(2012). Multimodal emotion recognition by combining physiological signals and facial
expressions: A preliminary study. 2012 Annual International Conference of the IEEE
Engineering in Medicine and Biology Society.
Krueger, R., Koch, S.,& Ertl, T. (2016). Saccade Lenses: Interactive Exploratory Faltering of
Eye Tracking Trajectories. 31-34. 10.1109/ETVIS.2016.7851162.
Lajante, M., Droulers, O., & Amarantini, D. (2017). How reliable are "state-of-the-art" facial
EMG processing methods?: Guidelines for improving the assessment of emotional
valence in advertising research. Journal of Advertising Research, 57(1), 28.

130
Law, E.L.-C & Schaik, Paul. (2012). To measure or not to measure UX: An interview study. 922.
58-63.
Lee, N., Broderick, A., J., & Chamberlain, L. (2007). What is ‘neuromarketing’? A discussion
and agenda for future research. International Journal of Psychophysiology, 63(2), 199-
204. https://doi.org/10.1016/j.ijpsycho.2006.03.007
Lee, J., & Kirlik, A. (2013). The Oxford handbook of cognitive engineering (Oxford library of
psychology). New York, NY: Oxford University Press.
Lindgaard, G. et al. (2006) ‘Attention web designers: You have 50 milliseconds to make a good
first impression!’, Behaviour & Information Technology, 25(2), pp. 115–126. doi:
10.1080/01449290500330448.
Lindquist, K. A., Wager, T. D., Kober, H., Bliss-Moreau, E., & Barrett, L. F. (2012). The brain
basis of emotion: a meta-analytic review. The Behavioral and brain sciences, 35(3), 121–
143. doi:10.1017/S0140525X11000446
Loureiro, S. M. C., Ruediger, K. H., & Demetris, V. (2012). Brand emotional connection and
loyalty. Journal of Brand Management, 20(1), 13-27.
Lottridge, Danielle & Chignell, Mark & Jovicic, Aleksandra. (2011). Affective Interaction
Understanding, Evaluating, and Designing for Human Emotion. doi.
10.1177/1557234X11410385.
Markand, O. (2014). Electroencephalogram (EEG). In Encyclopedia of the Neurological
Sciences (pp. 1084-1091).
Mellor, J. (2017). Opening Keynote. Adobe Summit EMEA, ExCel Centre, London. Adobe
Momentum Worldwide. (2017, August 01). THE DRUM: How brands are tapping into
consumers' faces – and brains. Retrieved from

131
https://www.momentumww.com/news/2017/8/1/the-drum-how-brands-are-tapping-into-
consumers-faces-and-brains
Morville, P., & Rosenfeld, L. (2007). Information Architecture for the World Wide Web.
Sebastopol, CA: OʹReilly.
Myers, B. (1998). A brief history of human-computer interaction technology. Interactions, 5(2),
44-54.
Nielsen, J. (2012). Thinking Aloud: The #1 Usability Tool. Retrieved from
https://www.nngroup.com/articles/thinking-aloud-the-1-usability-tool/
Patton, M. (2002). Qualitative research and evaluation methods.
Perez, S. (2013, March 12). Users Have Low Tolerance For Buggy Apps – Only 16% Will Try A
Failing App More Than Twice. Retrieved from https://techcrunch.com/2013/03/12/users-
have-low-tolerance-for-buggy-apps-only-16-will-try-a-failing-app-more-than-twice/
Picard, R. (1997). Affective computing. Cambridge, Mass.: MIT Press.
Picard, R. (2010). Emotion Research by the People, for the People. Emotion Review, 2(3), 250-
254.
Plano Clark, V. L., & Ivankova, N. (2016). Mixed methods research: A guide to the field. Los
Angeles: Sage.
Posner, J., Russell, J. A., & Peterson, B. S. (2005). The circumplex model of affect: An
integrative approach to affective neuroscience, cognitive development, and
psychopathology. Development and Psychopathology; Dev Psychopathol, 17(3), 715-
734. doi: 10.1017/S0954579405050340
Rams, D. (1980). Dieter Rams in conversation with Rido Busse, reprinted in Design: Dieter
Rams & (1981).
132
Rotolo, T. (2017, November 16). Mouse movement patterns and user frustration. Retrieved from
https://www.trymyui.com/blog/2016/10/28/mouse-movement-patterns-and-user-
frustration/
Russell, J. (2003): Core Affect and the Psychological Construction of Emotion. In Psychological
Review, 110 (1) p. 145–172
Saffer, D. (2014). Microinteractions: Designing with Details. Sebastopol, CA: OʹReilly Media,
Inc.
Salvucci, D., & Goldberg, J. (2000). Identifying fixations and saccades in eye-tracking protocols.
Proceedings of the 2000 Symposium on Eye Tracking Research & Applications, 71-78.
San José-Cabezudo, R., Gutiérrez-Cillán, J., & Gutiérrez-Arranz, A. (2008). The moderating role
of user motivation in Internet access and individuals' responses to a Website. Internet
Research, 18(4), 393-404. https://doi.org/10.1108/10662240810897808
Sauro, J. (2015) The Importance of Evaluating UX. MeasuringU. Retrieved from
https://measuringu.com/evaluating-ux
Scherer, K. R., & Shorr, A., & Johnstone, T. (Ed.). (2001). Appraisal processes in emotion:
theory, methods, research. Canary, NC: Oxford University Press. p. 21
Scherer, K. R. (2005). What are emotions? And how can they be measured? Social Science
Information, 44(4), 695-729.
Shaikh, A. (n.d.). Ethical Issues in the Use of Biometric Technology. retrieved from:
https://www.bcs.org/upload/pdf/ashaikh.pdf
Shamonsky, D. (2018). Developing a Code of Ethics for UX Design: What We Can Learn from
the Field of Architecture. User Experience Magazine, 18(4).
Retrieved from http://uxpamagazine.org/developing-a-code-of-ethics/
133
Shen, Y. (2019). Intelligent Infrastructure, Ubiquitous Mobility, and Smart Libraries–Innovate
for the Future. Data Science Journal, 18(1).
Shepard, D. (2013). Practical approaches for designing usable websites. Freiburg, Germany:
Smashing Media GmbH.
Soegaard, M., Dam, R. (2018.). “The Encyclopedia of Human-Computer Interaction, 2nd Ed.”.
Aarhus, Denmark: The Interaction Design Foundation.
Soehn, A. (2017). Measuring the Heart - How Does ECG and PPG Work? Retrieved April 9,
2019, from https://imotions.com/blog/measuring-the-heart-how-does-ecg-and-ppg-work/
Spradley, J. (1979). The ethnographic interview.
Svetieva, E., & Frank, M. (2016). Empathy, emotion dysregulation, and enhanced
microexpression recognition ability. Motivation and Emotion, 40(2), 309-320.
doi: 10.1007/s11031-015-9528-4
Takahashi, K., Saleh, M., Penn, R. D., Hatsopoulos, N. G. (2011). Propagating waves in human
motor cortex. Front Hum Neurosci. 5(40):40
Tullis, T., & Albert, B. (2013). Measuring the user experience :collecting, analyzing, and
presenting usability metrics (2nd ed., Interactive Technologies). Amsterdam,
Netherlands: Elsevier.
Turner, J. (2007). Human emotions : A sociological theory. London ; New York: Routledge.
Utkutug Bozoklu, C. P., & Alkibay, S. (2016). Neuroscience in marketing: Assessment of
advertisement memory by means of facial muscles movement analysis. Journal of
Neurological Sciences-Turkish; J.Neurol.Sci.-Turk., 33(1), 76-88.
User Experience Basics (2018). Retrieved March, 2018 from: https://www.usability.gov/what-
and-why/user-experience.html

134
Verganti, R. (2009). Design Driven Innovation – Changing the Rules of Competition by
Radically Innovating what Things Mean. Boston, MA: Harvard Business Press.
Vitale, A. (2017, May 17). The experience is the differentiator. Retrieved March 19, 2019, from
https://www.3mhisinsideangle.com/blog-post/the-experience-is-the-differentiator/
Westerink, J.,H., Van den Broek, E., Schut, M., H., Van Herk, J., Tuinenbreijer, K., Ouwerkerk,
M. (2008). Human Media Interaction. Computing emotion awareness through galvanic
skin response and facial electromyography. In (pp. 149-162).
Wilson, C. (2014). Interview techniques for UX practitioners: A user-centered design method.
Waltham, MA: Morgan Kaufmann.
Wilson, K., M., Helton W., S., Wiggins, M. (2012) https://doi.org/10.1002/wcs.1204
World Bank Group (2019). 2018 Information and communications for development: Data-driven
development. (2019). Washington, DC: World Bank Group.
Xiang, X. & Tran, D. (2017). Linear Disentangled Representation Learning For Facial Actions.
IEEE Transactions on Circuits and Systems for Video Technology. PP.
10.1109/TCSVT.2017.2771150.
Yarbus, A. L. (1967). Eye Movements and Vision. New York: Plenum Press
Young, A. (2016). Facial expression recognition: The selected works of Andy Young (World
library of psychologists). London; New York: Routledge, Taylor & Francis Group.
Yuval-Greenberg, S., Tomer, O., Keren, A. S., Nelken, I., Deouell, L. Y. (2008). Transient
induced gamma-band response in EEG as a manifestation of miniature saccades. Neuron.
58: 429–41. doi: 10.1016/j.neuron.2008.03.027

135
APPENDIX A: IRB Study Approval
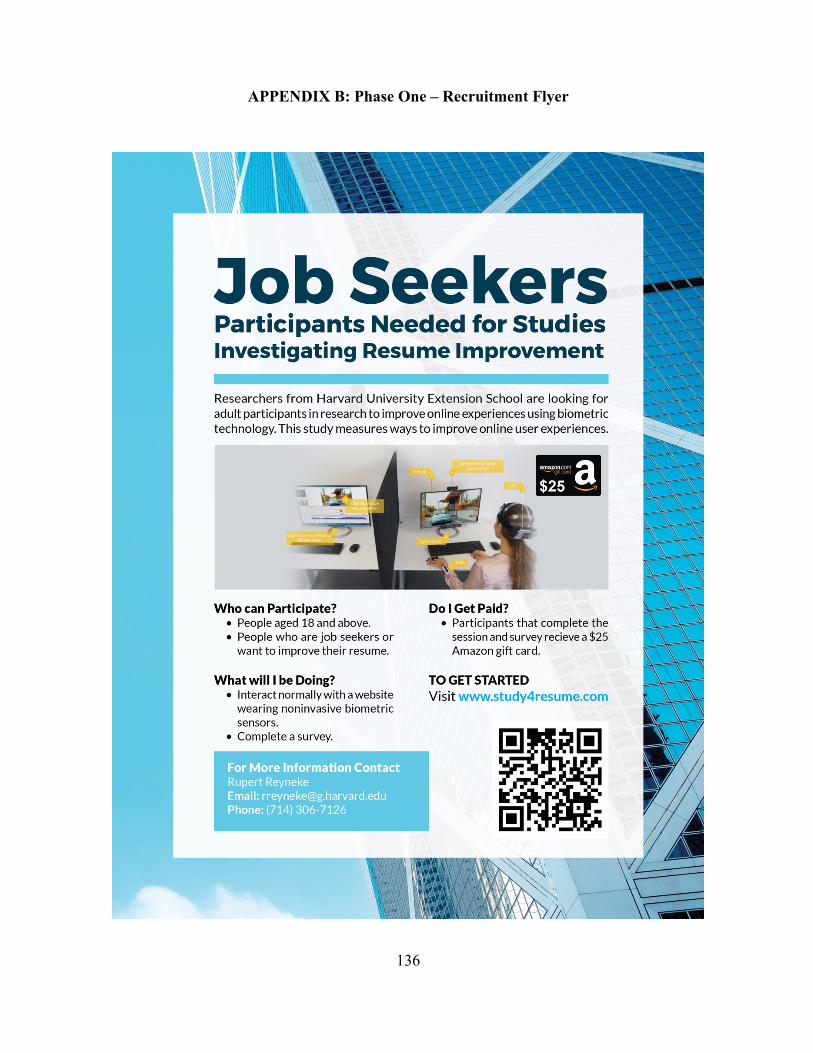
136
APPENDIX B: Phase One – Recruitment Flyer

137
APPENDIX C: Phase On – Eligibility Screening
Instructions: Thank you for your interest in participating in this research study. Please complete this short survey to find out whether you are eligible to participate in this study. 1. Please indicate your year of birth (yyyy). [ ] (requirement: greater or equal 2001) 2. What is your current employment status (Pick the answer that best applies):
a. Employed, full-time (if applies, proceed) b. Employed, part-time (if applies, proceed) c. Unemployed, looking for work (if applies, proceed) d. Unemployed, not looking for work (if applies, not eligible, end screening) e. Self-employed, full-time (if applies, proceed) f. Self-employed, part-time (if applies, proceed) g. Student, full-time (if applies, end screening) h. Student, part-time (if applies, end screening)
4. Please indicate your current academic level a. High School Degree or equivalent b. Some College c. None of the above (if applies not eligible, end screening)
5. Do you access the internet daily? a. Yes (proceed to sub questions)
i. Please indicate your average time spent online on across all devices 1. Less than 1 hour/day 2. More than 1 hour/day
b. No (proceed to sub questions) i. Please indicate your average time spent online on across all devices
1. Less than 1 hour/week 2. More than 1 hour/week

138
APPENDIX D: Phase One – Demographic Survey
Instructions: Thank you for participating in this research study. Please provide some basic demographic information below. If you do not wish to continue, you may stop the survey at any time. 1. What is your gender?
a. Female b. Male c. Other (please specify) d. Prefer not to say
2. What is your age? a. 18-24 years b. 25-34 years c. 35-44 years d. 45-54 years e. Over 55 years
3. What is your ethnicity? a. White b. Hispanic or Latino c. Black or African American d. Native American or American Indian e. Asian/Pacific Islander f. Other
4. What is the highest degree or level of school you have completed? a. Less than a high school diploma b. High school diploma or equivalent c. Bachelor’s degree (e.g. BA, BS) d. Master’s degree (e.g. MA, MS, Med) e. Doctorate (e.g. PhD, EdD)
5. What is your current employment status? a. Employed full-time (40+ hours per week) b. Employed part-time (less than 40 hours a week) c. Unemployed (currently looking for work) d. Student (employed part-time) e. Student (currently looking for work) f. Self-employed (currently looking for work)
6. What sector do you work in? a. Private sector b. Public sector c. Academia d. Not for profit

139
e. Government f. Other
7. What zip code do you reside in? a. [open field]
8. Marital Status a. Single (never Married) b. Married c. In a Domestic Partnership d. Divorced e. Widowed
9. Household income a. Below $10K b. $10K – $50K c. $50K – $100K d. $100K – $150K e. Over $150K

140
APPENDIX E: Phase One – Adult Consent Form
Study Title: Improving interactive user experience with microinteractions: an application of biometric and affect detection systems on landing pages.
Researcher: Rupert Reyneke
Faculty Advisor: Andrew Engelward
Key Information
The following is a short summary of this study to help you decide whether or not to be a part of this study. More detailed information is listed later on in this form.
This project aims to identify ways to improve online interactions and user experiences. The study uses biometric sensors to indicate whether integrate biometrics into human-centered design to improve user experience in interactive systems and strengthen the overall brand. User experience is defined as a person's perceptions and responses resulting from the use and/or anticipated use of a product, system or service
Why am I being invited to take part in a research study? We invite you to take part in a research study because you indicated that you are an adult over 18 years, a job seeker, and/or an individual interested in improving your resume.
What should I know about a research study? • Someone will explain this research study to you. • Whether or not you take part is up to you. • Your participation is completely voluntary. • You can choose not to take part. • You can agree to take part and later change your mind. • Your decision will not be held against you. • Your refusal to participate will not result in any consequences or any loss of benefits that you are otherwise entitled to receive.
• You can ask all the questions you want before you decide.
Why is this research being done? The research is being conducted to determine how to best integrate biometrics into the design process to validate creative assets and improve interactive user experiences. This helps determine how to measure content for relevance, engagement, trust and strengthening the overall brand. It will also help to identify what ethical guidelines and consideration can be incorporated into the design process to safeguard and respect users’ privacy. How long will the research last and what will I need to do? We expect that you will be in this research study for up to 75 minutes in 1 session.
141
You will be asked to interact with a website and review it for relevance, trust, how engaging it is and rank the overall brand of the site. You will be wearing non-invasive biometric sensors that are gently placed on the skin.
Is there any way being in this study could be bad for me? We don’t believe there are any risks from participating in this research.
Will being in this study help me in any way? There are no benefits to you from your taking part in this research. We cannot promise any benefits to others from your taking part in this research. However, possible benefits to others include better performing websites and online experiences for job seekers.
Detailed Information
The following is more detailed information about this study in addition to the information listed above.
What is the purpose of this research? This project aims to identify ways to integrate biometrics into human-centered design to improve user experience in interactive systems and strengthen the overall brand. User experience is defined as a person's perceptions and responses resulting from the use and/or anticipated use of a product, system or service. User experience includes all the users' emotions, beliefs, preferences, perceptions, physical and psychological responses, behaviors and accomplishments that occur before, during and after use. Since the advent of smart devices and improved access to the internet in the palms of our hands, users have access to more information than ever before to make informed choices. Users are now actively engaged in sharing their ideas and opinions and are becoming more centrally collaborative in the design process. This study will also aim to identify some of the most common microinteractions that mostly go unnoticed but have a significant impact on the overall perceived value of the interface and brand. Additionally, the study will prioritize current issues and ethical guidelines for UX research development. It is anticipated that from the data collected, a clearer more deeper understanding of the issues can be acquired. This will inform the development of a framework which will provide clarity and direction for the overall body of knowledge. Furthermore, it will make recommendations as to how best UX research development can be leveraged in the industry based on sound evidence derived from the population to which it concerns. The use of a web-based survey consisting of agencies and designers will help to acquire a valid data set which is expected to make a substantial and effective contribution to answering the research questions. The results and recommendations will be disseminated through a variety of appropriate channels. How long will I take part in this research? The research will be conducted in a single session that lasts up to 75 min. What can I expect if I take part in this research? The research will be conducted in a single session that lasts up to 75 min.
• You will be interacting with Rupert Reyneke, the Principle Investigator.

142
• Research will be conducted at the Human Behavior Lab at Texas A&M
What happens if I say yes, but I change my mind later? You can leave the research at any time it will not be held against you.
If I take part in this research, how will my privacy be protected? What happens to the information you collect? Efforts will be made to limit the use and disclosure of your Personal Information, including research study and medical records, to people who have a need to review this information. We cannot promise complete secrecy. Organizations that may inspect and copy your information include the IRB and other representatives of this organization. Your information or samples that are collected as part of this research will not be used or distributed for future research studies, even if all of your identifiers are removed.
Who can I talk to? If you have questions, concerns, or complaints, or think the research has hurt you, talk to the research team. Rupert Reyneke (714) 306-7126 or [email protected]
This research has been reviewed and approved by the Harvard University Area Institutional Review Board (“IRB”). You may talk to them at (617) 496-2847 or [email protected] if:
• Your questions, concerns, or complaints are not being answered by the research team. • You cannot reach the research team. • You want to talk to someone besides the research team. • You have questions about your rights as a research subject. • You want to get information or provide input about this research.
Signature Block for Adult subject Your signature documents your permission to take part in this research.
Signature of Subject
Printed Name of Subject Date

143
APPENDIX F: Phase One Post-Scenario Survey
In this survey, we ask questions about your demographic background and experience relates to online shopping. Please remember that these data are collected anonymously and will not be linked to your name or other identifying details. Please answer honestly. There are no right or wrong answers. When you are ready to begin, type your study ID below and start your responses. Please indicate your level of agreement with the statements below. 1) The website layout is visually appealing ( ) ( ) ( ) ( ) ( ) ( ) ( ) 1 2 3 4 5 6 7
Strongly Disagree
Neutral Strongly Agree
2) The website layout is visually appealing ( ) ( ) ( ) ( ) ( ) ( ) ( ) 1 2 3 4 5 6 7
Strongly Disagree
Neutral Strongly Agree
3) The website layout is visually appealing ( ) ( ) ( ) ( ) ( ) ( ) ( ) 1 2 3 4 5 6 7
Strongly Disagree
Neutral Strongly Agree
4) The website layout is visually appealing ( ) ( ) ( ) ( ) ( ) ( ) ( ) 1 2 3 4 5 6 7
Strongly Disagree
Neutral Strongly Agree
5) The website layout is visually appealing ( ) ( ) ( ) ( ) ( ) ( ) ( ) 1 2 3 4 5 6 7
Strongly Disagree
Neutral Strongly Agree

144
6) The website layout is visually appealing ( ) ( ) ( ) ( ) ( ) ( ) ( ) 1 2 3 4 5 6 7
Strongly Disagree
Neutral Strongly Agree
7) The website layout is visually appealing ( ) ( ) ( ) ( ) ( ) ( ) ( ) 1 2 3 4 5 6 7
Strongly Disagree
Neutral Strongly Agree
8) The website layout is visually appealing ( ) ( ) ( ) ( ) ( ) ( ) ( ) 1 2 3 4 5 6 7
Strongly Disagree
Neutral Strongly Agree
9) The website layout is visually appealing ( ) ( ) ( ) ( ) ( ) ( ) ( ) 1 2 3 4 5 6 7
Strongly Disagree
Neutral Strongly Agree
10) The website layout is visually appealing ( ) ( ) ( ) ( ) ( ) ( ) ( ) 1 2 3 4 5 6 7
Strongly Disagree
Neutral Strongly Agree
11) The website layout is visually appealing ( ) ( ) ( ) ( ) ( ) ( ) ( ) 1 2 3 4 5 6 7
Strongly Disagree
Neutral Strongly Agree
12) The website layout is visually appealing ( ) ( ) ( ) ( ) ( ) ( ) ( ) 1 2 3 4 5 6 7
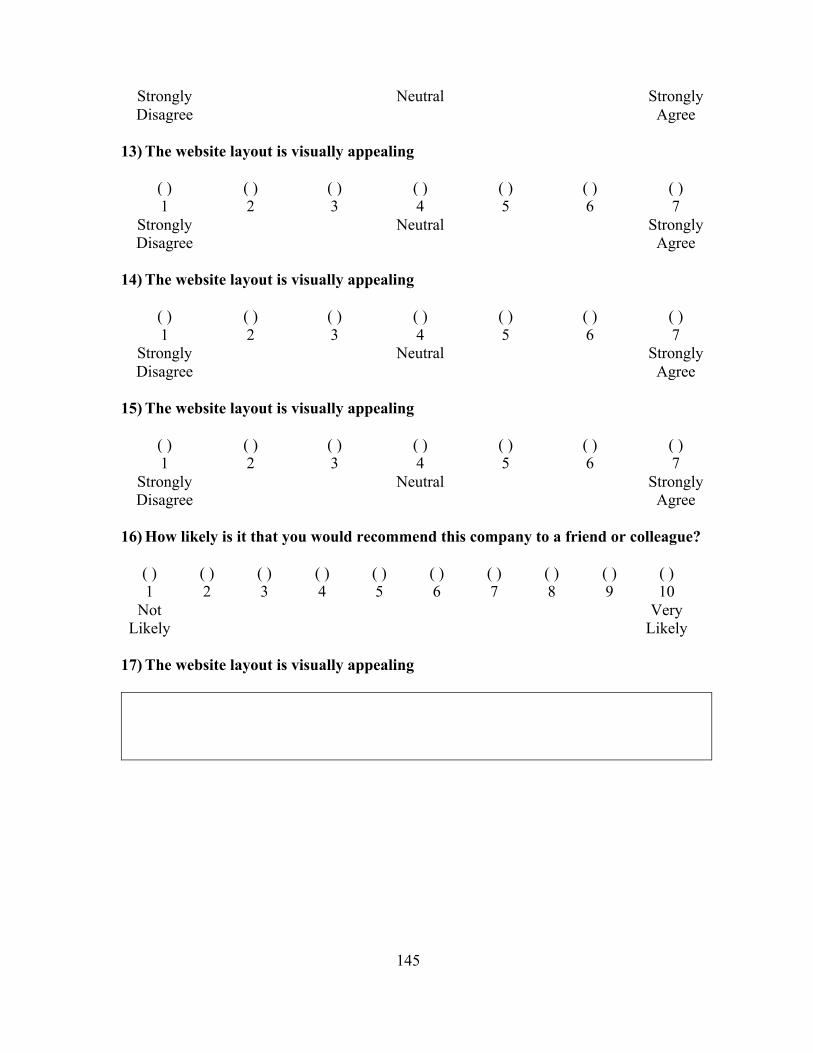
145
Strongly Disagree
Neutral Strongly Agree
13) The website layout is visually appealing ( ) ( ) ( ) ( ) ( ) ( ) ( ) 1 2 3 4 5 6 7
Strongly Disagree
Neutral Strongly Agree
14) The website layout is visually appealing ( ) ( ) ( ) ( ) ( ) ( ) ( ) 1 2 3 4 5 6 7
Strongly Disagree
Neutral Strongly Agree
15) The website layout is visually appealing ( ) ( ) ( ) ( ) ( ) ( ) ( ) 1 2 3 4 5 6 7
Strongly Disagree
Neutral Strongly Agree
16) How likely is it that you would recommend this company to a friend or colleague? ( ) ( ) ( ) ( ) ( ) ( ) ( ) ( ) ( ) ( ) 1 2 3 4 5 6 7 8 9 10 Not Likely
Very Likely
17) The website layout is visually appealing
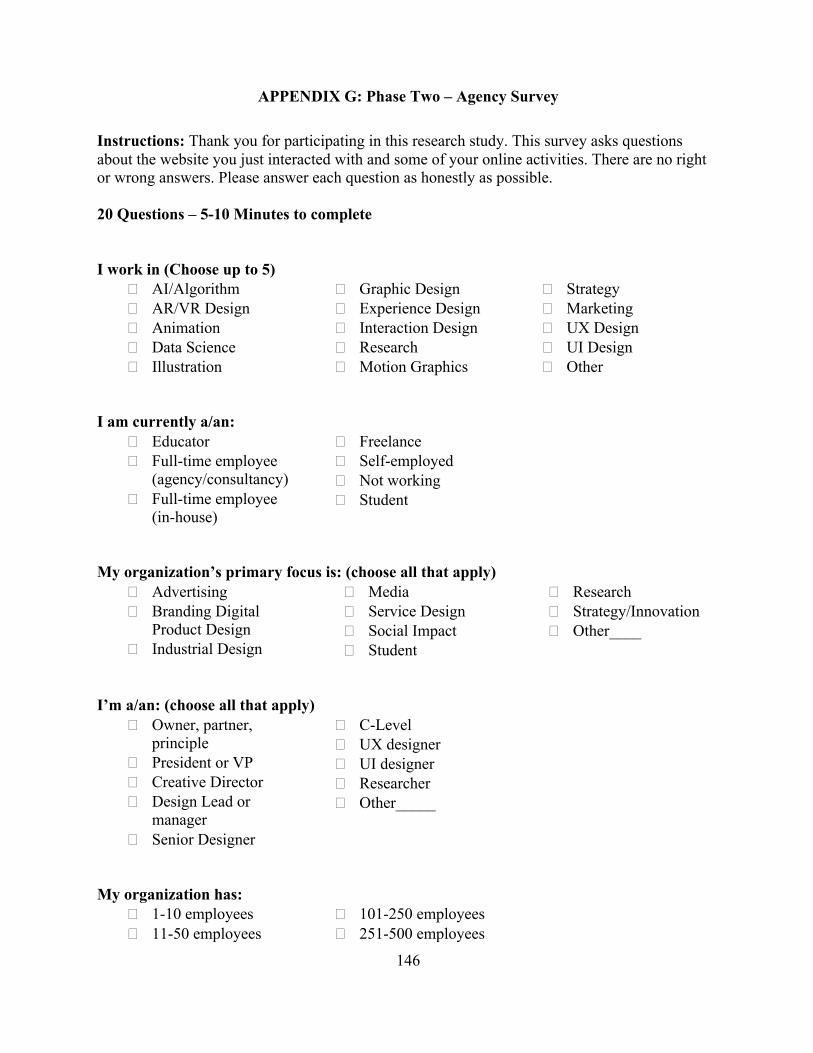
146
APPENDIX G: Phase Two – Agency Survey
Instructions: Thank you for participating in this research study. This survey asks questions about the website you just interacted with and some of your online activities. There are no right or wrong answers. Please answer each question as honestly as possible. 20 Questions – 5-10 Minutes to complete I work in (Choose up to 5)
� AI/Algorithm � AR/VR Design � Animation � Data Science � Illustration
� Graphic Design � Experience Design � Interaction Design � Research � Motion Graphics
� Strategy � Marketing � UX Design � UI Design � Other
I am currently a/an:
� Educator � Full-time employee (agency/consultancy)
� Full-time employee (in-house)
� Freelance � Self-employed � Not working � Student
My organization’s primary focus is: (choose all that apply)
� Advertising � Branding Digital Product Design
� Industrial Design
� Media � Service Design � Social Impact � Student
� Research � Strategy/Innovation � Other____
I’m a/an: (choose all that apply)
� Owner, partner, principle
� President or VP � Creative Director � Design Lead or manager
� Senior Designer
� C-Level � UX designer � UI designer � Researcher � Other_____
My organization has:
� 1-10 employees � 11-50 employees
� 101-250 employees � 251-500 employees

147
� 51-100 employees
� 1,000+ employees
Country:_________ I identify as:
� Female � Male
� Trans � Intersex
� Other____
I am:
� Asian � Bi/Multi-racial � Black/African-American
� Latina/Latino/Latinx/Hispanic � Native American/First Nations/First People
� Native Hawaiian/ other Pacific Islander
� White/Caucasian � Prefer not to stay � Other____
My organizations annual revenue is: � Under $499K � $500K - $999K � $1M-$4.9M � $5M – $90M
� $10M-$49M � $50-$99M � $100-$249M � Over $250M
Do you currently use biometrics or neuromarketing in your user research? 1. Yes 2. No
Which of the following tools do you use in UX testing and research? 1. Eye tracking 2. Biometrics (GSR, EEG, fEMG, ECG, FACS) 3. Facial Recognition/Affect Detection 4. Other______
What is your preferred tool/platform for UX testing? Do you have a formal ethical framework in place for UX testing? 1. Yes 2. No
Which Ethic frameworks are you familiar with? 1. Ethical OS 2. ACM Code of Ethics 3. UXPA Code of Professional Conduct 4. AIGA Standards of Professional Practice

148
5. Ethics for Designer 6. Other_________
UX Ethics
Strongly Disagree Disagree
Somewhat Disagree
Neither Agree nor
Disagree
Somewhat Agree Agree
Strongly Agree
I feel confident that our UX testing helps us build better product/solutions
I feel confident anticipating, and recognizing potential malicious use of products/services built
I feel confident that the business model behind the products/solutions we build won’t cause harm to an individual or group of people
I feel confident that our organization lives up to the best version of itself?
How confident are you that your team and business model choices can actively safeguard users, communities, society, and your company from future risk?
( ) ( ) ( ) ( ) ( ) ( ) ( ) ( ) ( ) ( ) 1 2 3 4 5 6 7 8 9 10 Not
Confident Very
Confident What is your biggest challenge or concern in UX testing & Research?

149
APPENDIX D: Sample Biometric Data from Phase One

150
#Study: Rupert Test A #Date: 20190705 03:09:14 #Version: 7.2.15327.0 #TestRunDate: 20190613 11:32:34.640 (-05:00) #Tracker: Model-Tobii Pro Spectrum, Freq-600Hz, Screen Size(cms)-{Width=59.8, Height=33.6}, Screen Res-{Width=1920, Height=1080}, Distance(Resp)-70cm
StudyName ExportDate Name Age Gender StimulusName SlideType EventSource Timestamp Rupert Test A 20190705 11 19 FEMALE WebSiteRecording-2 TestImage ET 20190613_113237058 Rupert Test A 20190705 11 19 FEMALE WebSiteRecording-2 TestImage ET 20190613_113237076 Rupert Test A 20190705 11 19 FEMALE WebSiteRecording-2 TestImage Shimmer Shimmer 20190613_113237081 Rupert Test A 20190705 11 19 FEMALE WebSiteRecording-2 TestImage Shimmer Shimmer 20190613_113237083 Rupert Test A 20190705 11 19 FEMALE WebSiteRecording-2 TestImage Shimmer Shimmer 20190613_113237083 Rupert Test A 20190705 11 19 FEMALE WebSiteRecording-2 TestImage Shimmer Shimmer 20190613_113237083 Rupert Test A 20190705 11 19 FEMALE WebSiteRecording-2 TestImage ET 20190613_113237091 Rupert Test A 20190705 11 19 FEMALE WebSiteRecording-2 TestImage Shimmer Shimmer 20190613_113237107 Rupert Test A 20190705 11 19 FEMALE WebSiteRecording-2 TestImage ET|Shimmer Shimmer 20190613_113237108 Rupert Test A 20190705 11 19 FEMALE WebSiteRecording-2 TestImage Shimmer Shimmer 20190613_113237109 Rupert Test A 20190705 11 19 FEMALE WebSiteRecording-2 TestImage Shimmer Shimmer 20190613_113237109 Rupert Test A 20190705 11 19 FEMALE WebSiteRecording-2 TestImage AffRaw 20190613_113237118 Rupert Test A 20190705 11 19 FEMALE WebSiteRecording-2 TestImage AffRaw 20190613_113237120 Rupert Test A 20190705 11 19 FEMALE WebSiteRecording-2 TestImage AffRaw 20190613_113237121 Rupert Test A 20190705 11 19 FEMALE WebSiteRecording-2 TestImage ET 20190613_113237124 Rupert Test A 20190705 11 19 FEMALE WebSiteRecording-2 TestImage AffRaw 20190613_113237129 Rupert Test A 20190705 11 19 FEMALE WebSiteRecording-2 TestImage AffRaw 20190613_113237130 Rupert Test A 20190705 11 19 FEMALE WebSiteRecording-2 TestImage Shimmer Shimmer 20190613_113237132 Rupert Test A 20190705 11 19 FEMALE WebSiteRecording-2 TestImage Shimmer Shimmer 20190613_113237133
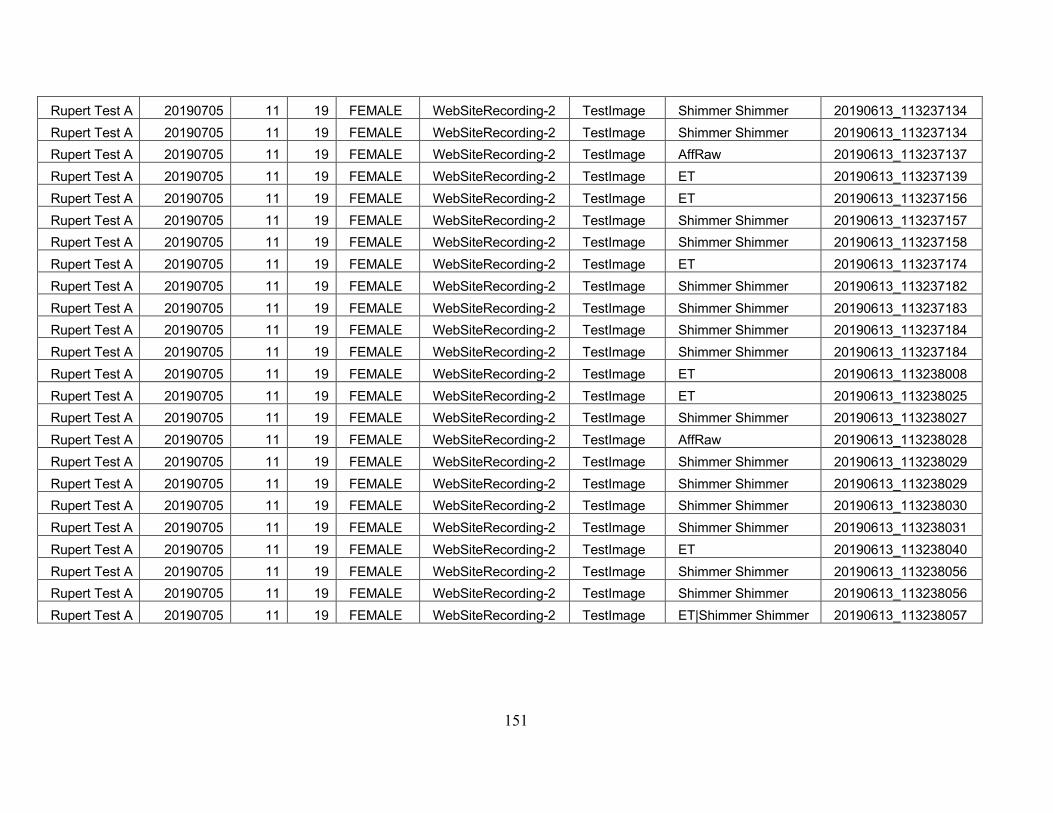
151
Rupert Test A 20190705 11 19 FEMALE WebSiteRecording-2 TestImage Shimmer Shimmer 20190613_113237134 Rupert Test A 20190705 11 19 FEMALE WebSiteRecording-2 TestImage Shimmer Shimmer 20190613_113237134 Rupert Test A 20190705 11 19 FEMALE WebSiteRecording-2 TestImage AffRaw 20190613_113237137 Rupert Test A 20190705 11 19 FEMALE WebSiteRecording-2 TestImage ET 20190613_113237139 Rupert Test A 20190705 11 19 FEMALE WebSiteRecording-2 TestImage ET 20190613_113237156 Rupert Test A 20190705 11 19 FEMALE WebSiteRecording-2 TestImage Shimmer Shimmer 20190613_113237157 Rupert Test A 20190705 11 19 FEMALE WebSiteRecording-2 TestImage Shimmer Shimmer 20190613_113237158 Rupert Test A 20190705 11 19 FEMALE WebSiteRecording-2 TestImage ET 20190613_113237174 Rupert Test A 20190705 11 19 FEMALE WebSiteRecording-2 TestImage Shimmer Shimmer 20190613_113237182 Rupert Test A 20190705 11 19 FEMALE WebSiteRecording-2 TestImage Shimmer Shimmer 20190613_113237183 Rupert Test A 20190705 11 19 FEMALE WebSiteRecording-2 TestImage Shimmer Shimmer 20190613_113237184 Rupert Test A 20190705 11 19 FEMALE WebSiteRecording-2 TestImage Shimmer Shimmer 20190613_113237184 Rupert Test A 20190705 11 19 FEMALE WebSiteRecording-2 TestImage ET 20190613_113238008 Rupert Test A 20190705 11 19 FEMALE WebSiteRecording-2 TestImage ET 20190613_113238025 Rupert Test A 20190705 11 19 FEMALE WebSiteRecording-2 TestImage Shimmer Shimmer 20190613_113238027 Rupert Test A 20190705 11 19 FEMALE WebSiteRecording-2 TestImage AffRaw 20190613_113238028 Rupert Test A 20190705 11 19 FEMALE WebSiteRecording-2 TestImage Shimmer Shimmer 20190613_113238029 Rupert Test A 20190705 11 19 FEMALE WebSiteRecording-2 TestImage Shimmer Shimmer 20190613_113238029 Rupert Test A 20190705 11 19 FEMALE WebSiteRecording-2 TestImage Shimmer Shimmer 20190613_113238030 Rupert Test A 20190705 11 19 FEMALE WebSiteRecording-2 TestImage Shimmer Shimmer 20190613_113238031 Rupert Test A 20190705 11 19 FEMALE WebSiteRecording-2 TestImage ET 20190613_113238040 Rupert Test A 20190705 11 19 FEMALE WebSiteRecording-2 TestImage Shimmer Shimmer 20190613_113238056 Rupert Test A 20190705 11 19 FEMALE WebSiteRecording-2 TestImage Shimmer Shimmer 20190613_113238056 Rupert Test A 20190705 11 19 FEMALE WebSiteRecording-2 TestImage ET|Shimmer Shimmer 20190613_113238057

152
MediaTime TimeSignal GazeLeftx GazeLefty GazeRightx GazeRighty PupilLeft PupilRight DistanceLeft DistanceRight 339 2377 864 433 891 445 4.062531 4.116379 616.1665 630.2923 357 2394 864 448 883 440 4.072021 4.046249 616.4691 630.3758 362 2394 864 448 883 440 4.072021 4.046249 616.4691 630.3758 364 2394 864 448 883 440 4.072021 4.046249 616.4691 630.3758 364 2394 864 448 883 440 4.072021 4.046249 616.4691 630.3758 364 2394 864 448 883 440 4.072021 4.046249 616.4691 630.3758 372 2411 879 453 894 448 3.987183 4.003403 616.6678 630.434 388 2411 879 453 894 448 3.987183 4.003403 616.6678 630.434 389 2427 880 449 880 451 3.932693 3.969894 616.8167 630.4927 390 2427 880 449 880 451 3.932693 3.969894 616.8167 630.4927 390 2427 880 449 880 451 3.932693 3.969894 616.8167 630.4927 399 2427 880 449 880 451 3.932693 3.969894 616.8167 630.4927 401 2427 880 449 880 451 3.932693 3.969894 616.8167 630.4927 402 2427 880 449 880 451 3.932693 3.969894 616.8167 630.4927 405 2444 870 452 886 464 3.913483 3.91362 616.9816 630.3543 410 2444 870 452 886 464 3.913483 3.91362 616.9816 630.3543 411 2444 870 452 886 464 3.913483 3.91362 616.9816 630.3543 413 2444 870 452 886 464 3.913483 3.91362 616.9816 630.3543 414 2444 870 452 886 464 3.913483 3.91362 616.9816 630.3543 415 2444 870 452 886 464 3.913483 3.91362 616.9816 630.3543 415 2444 870 452 886 464 3.913483 3.91362 616.9816 630.3543 418 2444 870 452 886 464 3.913483 3.91362 616.9816 630.3543 420 2461 890 454 857 461 3.838821 4.095306 617.0843 630.3278 437 2477 885 461 883 460 3.808807 3.856323 617.2889 630.2547 438 2477 885 461 883 460 3.808807 3.856323 617.2889 630.2547 439 2477 885 461 883 460 3.808807 3.856323 617.2889 630.2547
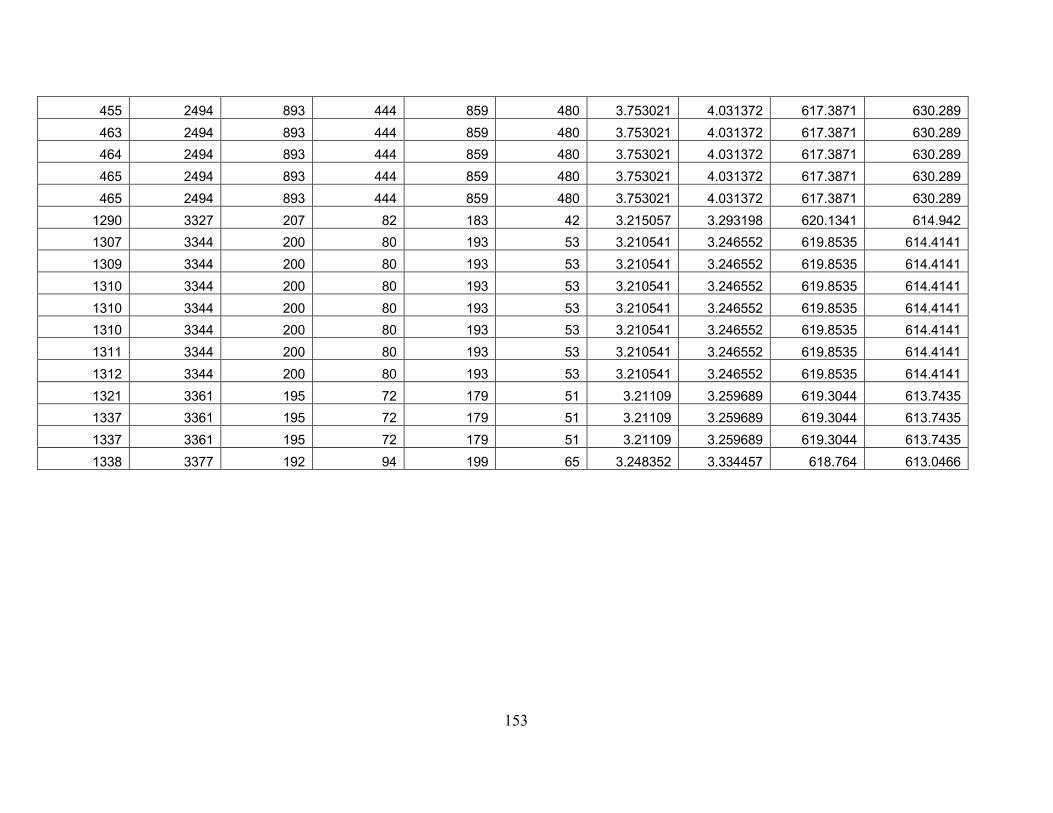
153
455 2494 893 444 859 480 3.753021 4.031372 617.3871 630.289 463 2494 893 444 859 480 3.753021 4.031372 617.3871 630.289 464 2494 893 444 859 480 3.753021 4.031372 617.3871 630.289 465 2494 893 444 859 480 3.753021 4.031372 617.3871 630.289 465 2494 893 444 859 480 3.753021 4.031372 617.3871 630.289 1290 3327 207 82 183 42 3.215057 3.293198 620.1341 614.942 1307 3344 200 80 193 53 3.210541 3.246552 619.8535 614.4141 1309 3344 200 80 193 53 3.210541 3.246552 619.8535 614.4141 1310 3344 200 80 193 53 3.210541 3.246552 619.8535 614.4141 1310 3344 200 80 193 53 3.210541 3.246552 619.8535 614.4141 1310 3344 200 80 193 53 3.210541 3.246552 619.8535 614.4141 1311 3344 200 80 193 53 3.210541 3.246552 619.8535 614.4141 1312 3344 200 80 193 53 3.210541 3.246552 619.8535 614.4141 1321 3361 195 72 179 51 3.21109 3.259689 619.3044 613.7435 1337 3361 195 72 179 51 3.21109 3.259689 619.3044 613.7435 1337 3361 195 72 179 51 3.21109 3.259689 619.3044 613.7435 1338 3377 192 94 199 65 3.248352 3.334457 618.764 613.0466

154
CameraLeftX CameraLeftY CameraRightX CameraRightY ValidityLeft ValidityRight GazeX GazeY GazeAOI InterpolatedGazeX 0.51863 0.5412052 0.3857997 0.5586001 0 0 878 439 AOI 1 878
0.5180996 0.5407388 0.3851122 0.5580816 0 0 874 444 AOI 1 874 0.5180996 0.5407388 0.3851122 0.5580816 0 0 874 444 AOI 1 874 0.5180996 0.5407388 0.3851122 0.5580816 0 0 874 444 AOI 1 874 0.5180996 0.5407388 0.3851122 0.5580816 0 0 874 444 AOI 1 874 0.5180996 0.5407388 0.3851122 0.5580816 0 0 874 444 AOI 1 874 0.5177571 0.5401918 0.3846058 0.5575013 0 0 886 450 AOI 1 886 0.5177571 0.5401918 0.3846058 0.5575013 0 0 886 450 AOI 1 886 0.5175642 0.5396523 0.3841872 0.5569538 0 0 880 450 AOI 1 880 0.5175642 0.5396523 0.3841872 0.5569538 0 0 880 450 AOI 1 880 0.5175642 0.5396523 0.3841872 0.5569538 0 0 880 450 AOI 1 880 0.5175642 0.5396523 0.3841872 0.5569538 0 0 880 450 AOI 1 880 0.5175642 0.5396523 0.3841872 0.5569538 0 0 880 450 AOI 1 880 0.5175642 0.5396523 0.3841872 0.5569538 0 0 880 450 AOI 1 880 0.5173625 0.5391658 0.383882 0.5565234 0 0 878 458 AOI 1 878 0.5173625 0.5391658 0.383882 0.5565234 0 0 878 458 AOI 1 878 0.5173625 0.5391658 0.383882 0.5565234 0 0 878 458 AOI 1 878 0.5173625 0.5391658 0.383882 0.5565234 0 0 878 458 AOI 1 878 0.5173625 0.5391658 0.383882 0.5565234 0 0 878 458 AOI 1 878 0.5173625 0.5391658 0.383882 0.5565234 0 0 878 458 AOI 1 878 0.5173625 0.5391658 0.383882 0.5565234 0 0 878 458 AOI 1 878 0.5173625 0.5391658 0.383882 0.5565234 0 0 878 458 AOI 1 878 0.5172294 0.5390392 0.3835518 0.5564875 0 0 874 458 AOI 1 874 0.5170538 0.5391117 0.3832326 0.5566009 0 0 884 460 AOI 1 884 0.5170538 0.5391117 0.3832326 0.5566009 0 0 884 460 AOI 1 884 0.5170538 0.5391117 0.3832326 0.5566009 0 0 884 460 AOI 1 884

155
0.5167055 0.5391133 0.3828231 0.5567348 0 0 876 462 AOI 1 876 0.5167055 0.5391133 0.3828231 0.5567348 0 0 876 462 AOI 1 876 0.5167055 0.5391133 0.3828231 0.5567348 0 0 876 462 AOI 1 876 0.5167055 0.5391133 0.3828231 0.5567348 0 0 876 462 AOI 1 876 0.5167055 0.5391133 0.3828231 0.5567348 0 0 876 462 AOI 1 876 0.6160849 0.5581433 0.4766582 0.5489767 0 0 195 62 195 0.6175781 0.5584729 0.4772815 0.5556772 0 0 196 66 196 0.6175781 0.5584729 0.4772815 0.5556772 0 0 196 66 196 0.6175781 0.5584729 0.4772815 0.5556772 0 0 196 66 196 0.6175781 0.5584729 0.4772815 0.5556772 0 0 196 66 196 0.6175781 0.5584729 0.4772815 0.5556772 0 0 196 66 196 0.6175781 0.5584729 0.4772815 0.5556772 0 0 196 66 196 0.6175781 0.5584729 0.4772815 0.5556772 0 0 196 66 196 0.6188443 0.5589231 0.4785117 0.5555121 0 0 187 62 187 0.6188443 0.5589231 0.4785117 0.5555121 0 0 187 62 187 0.6188443 0.5589231 0.4785117 0.5555121 0 0 187 62 187 0.6198654 0.5593605 0.4795012 0.5554304 0 0 196 80 196
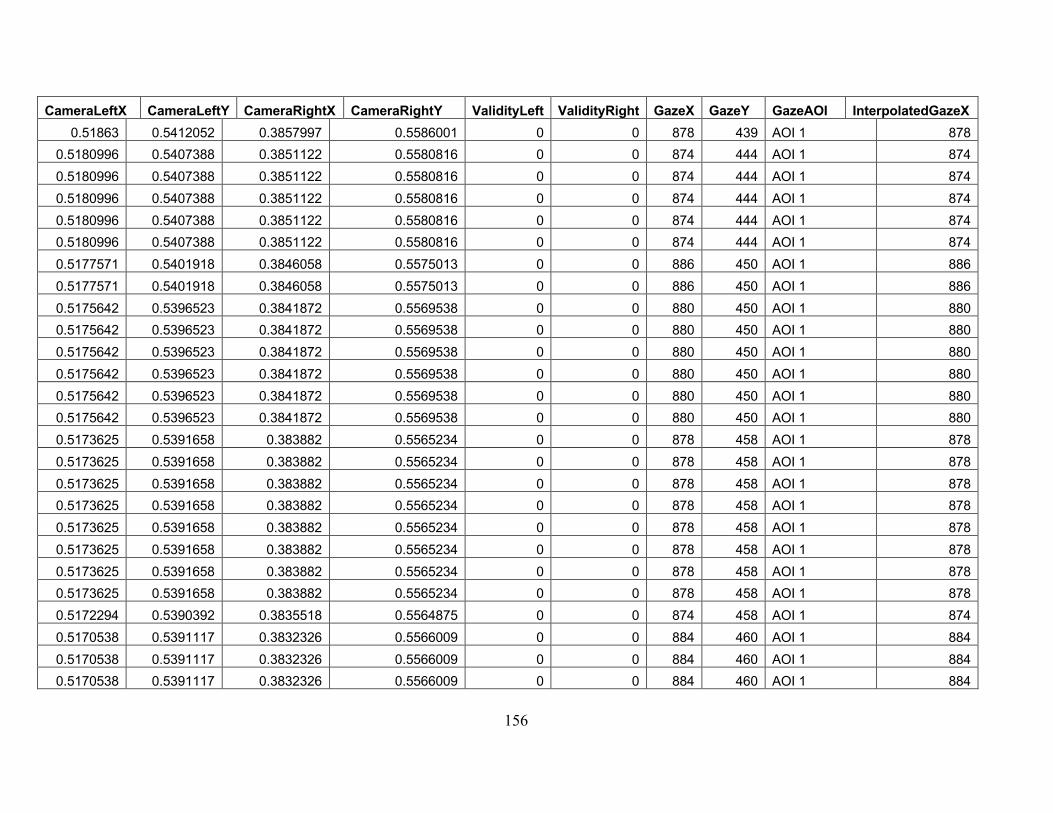
156
CameraLeftX CameraLeftY CameraRightX CameraRightY ValidityLeft ValidityRight GazeX GazeY GazeAOI InterpolatedGazeX 0.51863 0.5412052 0.3857997 0.5586001 0 0 878 439 AOI 1 878
0.5180996 0.5407388 0.3851122 0.5580816 0 0 874 444 AOI 1 874 0.5180996 0.5407388 0.3851122 0.5580816 0 0 874 444 AOI 1 874 0.5180996 0.5407388 0.3851122 0.5580816 0 0 874 444 AOI 1 874 0.5180996 0.5407388 0.3851122 0.5580816 0 0 874 444 AOI 1 874 0.5180996 0.5407388 0.3851122 0.5580816 0 0 874 444 AOI 1 874 0.5177571 0.5401918 0.3846058 0.5575013 0 0 886 450 AOI 1 886 0.5177571 0.5401918 0.3846058 0.5575013 0 0 886 450 AOI 1 886 0.5175642 0.5396523 0.3841872 0.5569538 0 0 880 450 AOI 1 880 0.5175642 0.5396523 0.3841872 0.5569538 0 0 880 450 AOI 1 880 0.5175642 0.5396523 0.3841872 0.5569538 0 0 880 450 AOI 1 880 0.5175642 0.5396523 0.3841872 0.5569538 0 0 880 450 AOI 1 880 0.5175642 0.5396523 0.3841872 0.5569538 0 0 880 450 AOI 1 880 0.5175642 0.5396523 0.3841872 0.5569538 0 0 880 450 AOI 1 880 0.5173625 0.5391658 0.383882 0.5565234 0 0 878 458 AOI 1 878 0.5173625 0.5391658 0.383882 0.5565234 0 0 878 458 AOI 1 878 0.5173625 0.5391658 0.383882 0.5565234 0 0 878 458 AOI 1 878 0.5173625 0.5391658 0.383882 0.5565234 0 0 878 458 AOI 1 878 0.5173625 0.5391658 0.383882 0.5565234 0 0 878 458 AOI 1 878 0.5173625 0.5391658 0.383882 0.5565234 0 0 878 458 AOI 1 878 0.5173625 0.5391658 0.383882 0.5565234 0 0 878 458 AOI 1 878 0.5173625 0.5391658 0.383882 0.5565234 0 0 878 458 AOI 1 878 0.5172294 0.5390392 0.3835518 0.5564875 0 0 874 458 AOI 1 874 0.5170538 0.5391117 0.3832326 0.5566009 0 0 884 460 AOI 1 884 0.5170538 0.5391117 0.3832326 0.5566009 0 0 884 460 AOI 1 884 0.5170538 0.5391117 0.3832326 0.5566009 0 0 884 460 AOI 1 884

157
0.5167055 0.5391133 0.3828231 0.5567348 0 0 876 462 AOI 1 876 0.5167055 0.5391133 0.3828231 0.5567348 0 0 876 462 AOI 1 876 0.5167055 0.5391133 0.3828231 0.5567348 0 0 876 462 AOI 1 876 0.5167055 0.5391133 0.3828231 0.5567348 0 0 876 462 AOI 1 876 0.5167055 0.5391133 0.3828231 0.5567348 0 0 876 462 AOI 1 876 0.6160849 0.5581433 0.4766582 0.5489767 0 0 195 62 195 0.6175781 0.5584729 0.4772815 0.5556772 0 0 196 66 196 0.6175781 0.5584729 0.4772815 0.5556772 0 0 196 66 196 0.6175781 0.5584729 0.4772815 0.5556772 0 0 196 66 196 0.6175781 0.5584729 0.4772815 0.5556772 0 0 196 66 196 0.6175781 0.5584729 0.4772815 0.5556772 0 0 196 66 196 0.6175781 0.5584729 0.4772815 0.5556772 0 0 196 66 196 0.6175781 0.5584729 0.4772815 0.5556772 0 0 196 66 196 0.6188443 0.5589231 0.4785117 0.5555121 0 0 187 62 187 0.6188443 0.5589231 0.4785117 0.5555121 0 0 187 62 187 0.6188443 0.5589231 0.4785117 0.5555121 0 0 187 62 187 0.6198654 0.5593605 0.4795012 0.5554304 0 0 196 80 196
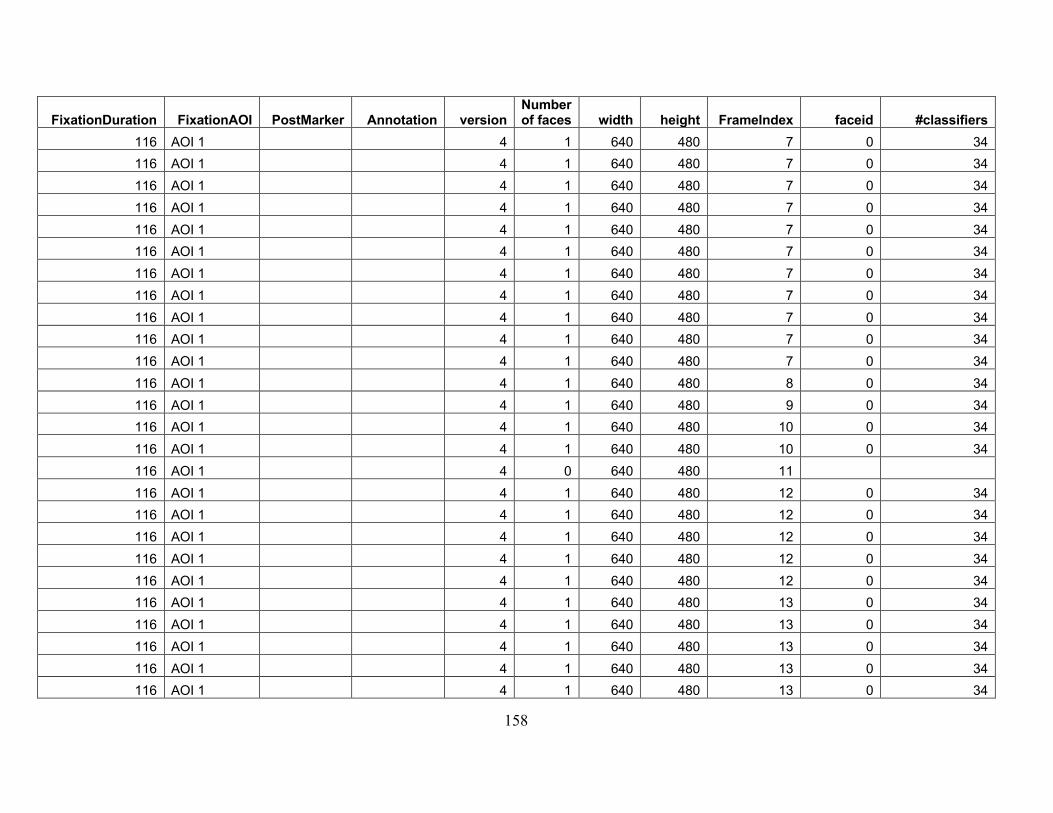
158
FixationDuration FixationAOI PostMarker Annotation version Number of faces width height FrameIndex faceid #classifiers
116 AOI 1 4 1 640 480 7 0 34 116 AOI 1 4 1 640 480 7 0 34 116 AOI 1 4 1 640 480 7 0 34 116 AOI 1 4 1 640 480 7 0 34 116 AOI 1 4 1 640 480 7 0 34 116 AOI 1 4 1 640 480 7 0 34 116 AOI 1 4 1 640 480 7 0 34 116 AOI 1 4 1 640 480 7 0 34 116 AOI 1 4 1 640 480 7 0 34 116 AOI 1 4 1 640 480 7 0 34 116 AOI 1 4 1 640 480 7 0 34 116 AOI 1 4 1 640 480 8 0 34 116 AOI 1 4 1 640 480 9 0 34 116 AOI 1 4 1 640 480 10 0 34 116 AOI 1 4 1 640 480 10 0 34 116 AOI 1 4 0 640 480 11 116 AOI 1 4 1 640 480 12 0 34 116 AOI 1 4 1 640 480 12 0 34 116 AOI 1 4 1 640 480 12 0 34 116 AOI 1 4 1 640 480 12 0 34 116 AOI 1 4 1 640 480 12 0 34 116 AOI 1 4 1 640 480 13 0 34 116 AOI 1 4 1 640 480 13 0 34 116 AOI 1 4 1 640 480 13 0 34 116 AOI 1 4 1 640 480 13 0 34 116 AOI 1 4 1 640 480 13 0 34
159
116 AOI 1 4 1 640 480 13 0 34 116 AOI 1 4 1 640 480 13 0 34 116 AOI 1 4 1 640 480 13 0 34 116 AOI 1 4 1 640 480 13 0 34 116 AOI 1 4 1 640 480 13 0 34 181 4 1 640 480 39 0 34 181 4 1 640 480 39 0 34 181 4 1 640 480 39 0 34 181 4 1 640 480 40 0 34 181 4 1 640 480 40 0 34 181 4 1 640 480 40 0 34 181 4 1 640 480 40 0 34 181 4 1 640 480 40 0 34 181 4 1 640 480 40 0 34 181 4 1 640 480 40 0 34 181 4 1 640 480 40 0 34 181 4 1 640 480 40 0 34

160
Brow Furrow
Brow Raise Engagement
Lip Corner Depressor Smile Valence Attention
Interocular Distance Pitch Yaw Roll
0.00036226 65.18327 7.731947 0.00053128 0.105693 0 87.56915 74.37169 -18.0348 12.23876 10.77546 0.00036226 65.18327 7.731947 0.00053128 0.105693 0 87.56915 74.37169 -18.0348 12.23876 10.77546 0.00036226 65.18327 7.731947 0.00053128 0.105693 0 87.56915 74.37169 -18.0348 12.23876 10.77546 0.00036226 65.18327 7.731947 0.00053128 0.105693 0 87.56915 74.37169 -18.0348 12.23876 10.77546 0.00036226 65.18327 7.731947 0.00053128 0.105693 0 87.56915 74.37169 -18.0348 12.23876 10.77546 0.00036226 65.18327 7.731947 0.00053128 0.105693 0 87.56915 74.37169 -18.0348 12.23876 10.77546 0.00036226 65.18327 7.731947 0.00053128 0.105693 0 87.56915 74.37169 -18.0348 12.23876 10.77546 0.00036226 65.18327 7.731947 0.00053128 0.105693 0 87.56915 74.37169 -18.0348 12.23876 10.77546 0.00036226 65.18327 7.731947 0.00053128 0.105693 0 87.56915 74.37169 -18.0348 12.23876 10.77546 0.00036226 65.18327 7.731947 0.00053128 0.105693 0 87.56915 74.37169 -18.0348 12.23876 10.77546 0.00036226 65.18327 7.731947 0.00053128 0.105693 0 87.56915 74.37169 -18.0348 12.23876 10.77546 0.00045833 58.37612 4.913522 0.00082948 0.07647576 0 84.21948 73.41109 -16.62514 13.62675 10.60822 0.00035198 51.54284 3.075912 0.00088966 0.0710143 0 82.52133 72.2669 -14.99686 14.23962 7.960211 0.00021327 49.10648 2.588946 0.00104689 0.05063344 0 84.62656 71.1518 -14.27854 13.47197 8.383314 0.00021327 49.10648 2.588946 0.00104689 0.05063344 0 84.62656 71.1518 -14.27854 13.47197 8.383314
0.00039148 26.52421 0.5257165 0.00186313 0.03284656 0 69.09459 68.2051 -11.70352 17.97727 7.630301 0.00039148 26.52421 0.5257165 0.00186313 0.03284656 0 69.09459 68.2051 -11.70352 17.97727 7.630301 0.00039148 26.52421 0.5257165 0.00186313 0.03284656 0 69.09459 68.2051 -11.70352 17.97727 7.630301 0.00039148 26.52421 0.5257165 0.00186313 0.03284656 0 69.09459 68.2051 -11.70352 17.97727 7.630301 0.00039148 26.52421 0.5257165 0.00186313 0.03284656 0 69.09459 68.2051 -11.70352 17.97727 7.630301 0.00062738 18.33616 0.29362 0.00328642 0.02873183 0 55.03924 70.35961 -10.48325 20.98872 7.496552 0.00062738 18.33616 0.29362 0.00328642 0.02873183 0 55.03924 70.35961 -10.48325 20.98872 7.496552 0.00062738 18.33616 0.29362 0.00328642 0.02873183 0 55.03924 70.35961 -10.48325 20.98872 7.496552 0.00062738 18.33616 0.29362 0.00328642 0.02873183 0 55.03924 70.35961 -10.48325 20.98872 7.496552 0.00062738 18.33616 0.29362 0.00328642 0.02873183 0 55.03924 70.35961 -10.48325 20.98872 7.496552
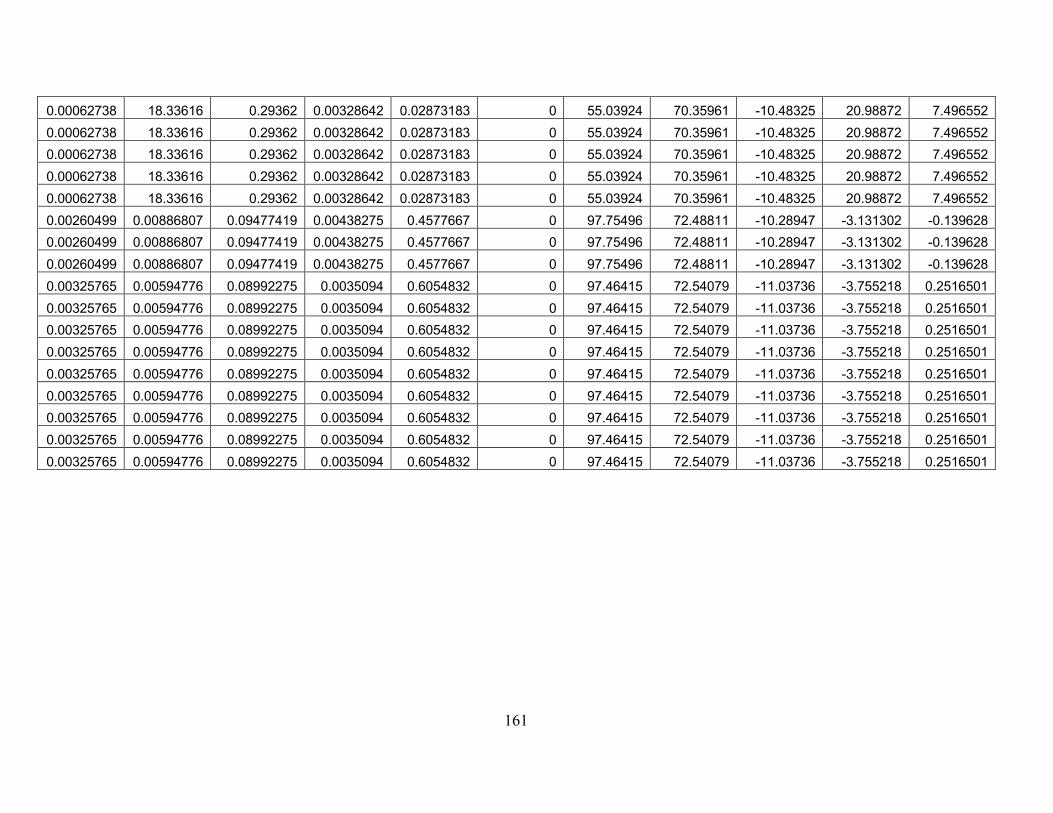
161
0.00062738 18.33616 0.29362 0.00328642 0.02873183 0 55.03924 70.35961 -10.48325 20.98872 7.496552 0.00062738 18.33616 0.29362 0.00328642 0.02873183 0 55.03924 70.35961 -10.48325 20.98872 7.496552 0.00062738 18.33616 0.29362 0.00328642 0.02873183 0 55.03924 70.35961 -10.48325 20.98872 7.496552 0.00062738 18.33616 0.29362 0.00328642 0.02873183 0 55.03924 70.35961 -10.48325 20.98872 7.496552 0.00062738 18.33616 0.29362 0.00328642 0.02873183 0 55.03924 70.35961 -10.48325 20.98872 7.496552 0.00260499 0.00886807 0.09477419 0.00438275 0.4577667 0 97.75496 72.48811 -10.28947 -3.131302 -0.139628 0.00260499 0.00886807 0.09477419 0.00438275 0.4577667 0 97.75496 72.48811 -10.28947 -3.131302 -0.139628 0.00260499 0.00886807 0.09477419 0.00438275 0.4577667 0 97.75496 72.48811 -10.28947 -3.131302 -0.139628 0.00325765 0.00594776 0.08992275 0.0035094 0.6054832 0 97.46415 72.54079 -11.03736 -3.755218 0.2516501 0.00325765 0.00594776 0.08992275 0.0035094 0.6054832 0 97.46415 72.54079 -11.03736 -3.755218 0.2516501 0.00325765 0.00594776 0.08992275 0.0035094 0.6054832 0 97.46415 72.54079 -11.03736 -3.755218 0.2516501 0.00325765 0.00594776 0.08992275 0.0035094 0.6054832 0 97.46415 72.54079 -11.03736 -3.755218 0.2516501 0.00325765 0.00594776 0.08992275 0.0035094 0.6054832 0 97.46415 72.54079 -11.03736 -3.755218 0.2516501 0.00325765 0.00594776 0.08992275 0.0035094 0.6054832 0 97.46415 72.54079 -11.03736 -3.755218 0.2516501 0.00325765 0.00594776 0.08992275 0.0035094 0.6054832 0 97.46415 72.54079 -11.03736 -3.755218 0.2516501 0.00325765 0.00594776 0.08992275 0.0035094 0.6054832 0 97.46415 72.54079 -11.03736 -3.755218 0.2516501 0.00325765 0.00594776 0.08992275 0.0035094 0.6054832 0 97.46415 72.54079 -11.03736 -3.755218 0.2516501
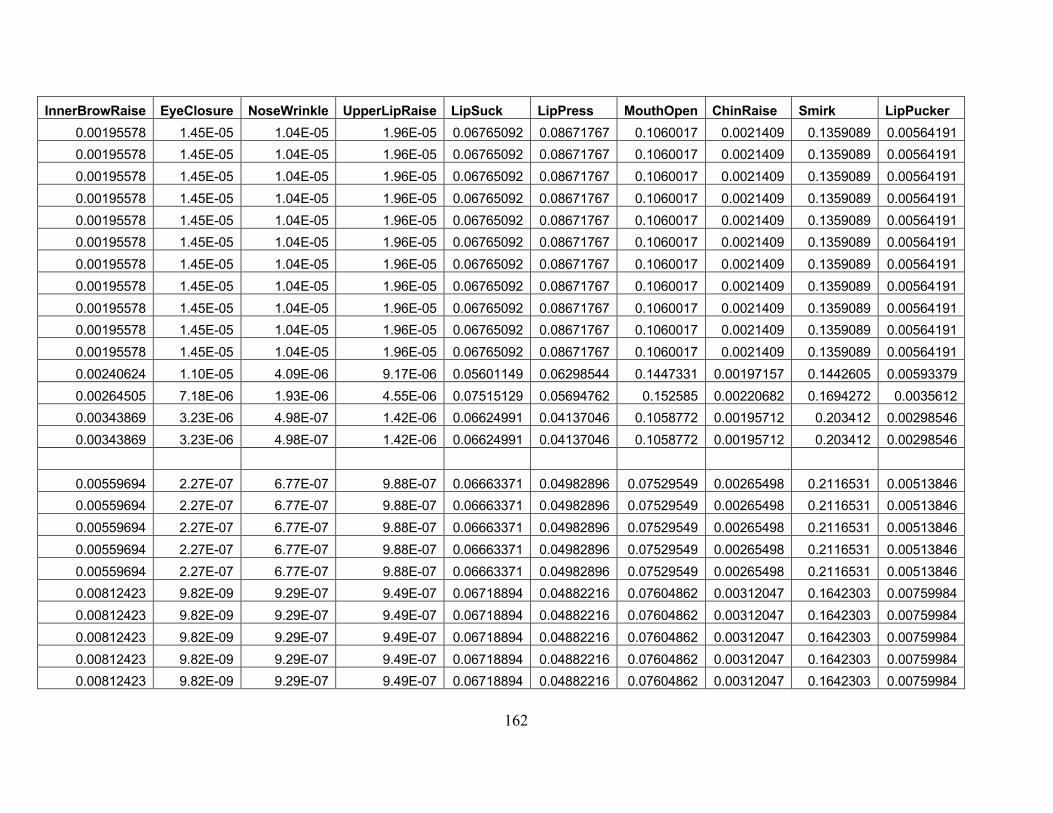
162
InnerBrowRaise EyeClosure NoseWrinkle UpperLipRaise LipSuck LipPress MouthOpen ChinRaise Smirk LipPucker 0.00195578 1.45E-05 1.04E-05 1.96E-05 0.06765092 0.08671767 0.1060017 0.0021409 0.1359089 0.00564191 0.00195578 1.45E-05 1.04E-05 1.96E-05 0.06765092 0.08671767 0.1060017 0.0021409 0.1359089 0.00564191 0.00195578 1.45E-05 1.04E-05 1.96E-05 0.06765092 0.08671767 0.1060017 0.0021409 0.1359089 0.00564191 0.00195578 1.45E-05 1.04E-05 1.96E-05 0.06765092 0.08671767 0.1060017 0.0021409 0.1359089 0.00564191 0.00195578 1.45E-05 1.04E-05 1.96E-05 0.06765092 0.08671767 0.1060017 0.0021409 0.1359089 0.00564191 0.00195578 1.45E-05 1.04E-05 1.96E-05 0.06765092 0.08671767 0.1060017 0.0021409 0.1359089 0.00564191 0.00195578 1.45E-05 1.04E-05 1.96E-05 0.06765092 0.08671767 0.1060017 0.0021409 0.1359089 0.00564191 0.00195578 1.45E-05 1.04E-05 1.96E-05 0.06765092 0.08671767 0.1060017 0.0021409 0.1359089 0.00564191 0.00195578 1.45E-05 1.04E-05 1.96E-05 0.06765092 0.08671767 0.1060017 0.0021409 0.1359089 0.00564191 0.00195578 1.45E-05 1.04E-05 1.96E-05 0.06765092 0.08671767 0.1060017 0.0021409 0.1359089 0.00564191 0.00195578 1.45E-05 1.04E-05 1.96E-05 0.06765092 0.08671767 0.1060017 0.0021409 0.1359089 0.00564191 0.00240624 1.10E-05 4.09E-06 9.17E-06 0.05601149 0.06298544 0.1447331 0.00197157 0.1442605 0.00593379 0.00264505 7.18E-06 1.93E-06 4.55E-06 0.07515129 0.05694762 0.152585 0.00220682 0.1694272 0.0035612 0.00343869 3.23E-06 4.98E-07 1.42E-06 0.06624991 0.04137046 0.1058772 0.00195712 0.203412 0.00298546 0.00343869 3.23E-06 4.98E-07 1.42E-06 0.06624991 0.04137046 0.1058772 0.00195712 0.203412 0.00298546
0.00559694 2.27E-07 6.77E-07 9.88E-07 0.06663371 0.04982896 0.07529549 0.00265498 0.2116531 0.00513846 0.00559694 2.27E-07 6.77E-07 9.88E-07 0.06663371 0.04982896 0.07529549 0.00265498 0.2116531 0.00513846 0.00559694 2.27E-07 6.77E-07 9.88E-07 0.06663371 0.04982896 0.07529549 0.00265498 0.2116531 0.00513846 0.00559694 2.27E-07 6.77E-07 9.88E-07 0.06663371 0.04982896 0.07529549 0.00265498 0.2116531 0.00513846 0.00559694 2.27E-07 6.77E-07 9.88E-07 0.06663371 0.04982896 0.07529549 0.00265498 0.2116531 0.00513846 0.00812423 9.82E-09 9.29E-07 9.49E-07 0.06718894 0.04882216 0.07604862 0.00312047 0.1642303 0.00759984 0.00812423 9.82E-09 9.29E-07 9.49E-07 0.06718894 0.04882216 0.07604862 0.00312047 0.1642303 0.00759984 0.00812423 9.82E-09 9.29E-07 9.49E-07 0.06718894 0.04882216 0.07604862 0.00312047 0.1642303 0.00759984 0.00812423 9.82E-09 9.29E-07 9.49E-07 0.06718894 0.04882216 0.07604862 0.00312047 0.1642303 0.00759984 0.00812423 9.82E-09 9.29E-07 9.49E-07 0.06718894 0.04882216 0.07604862 0.00312047 0.1642303 0.00759984
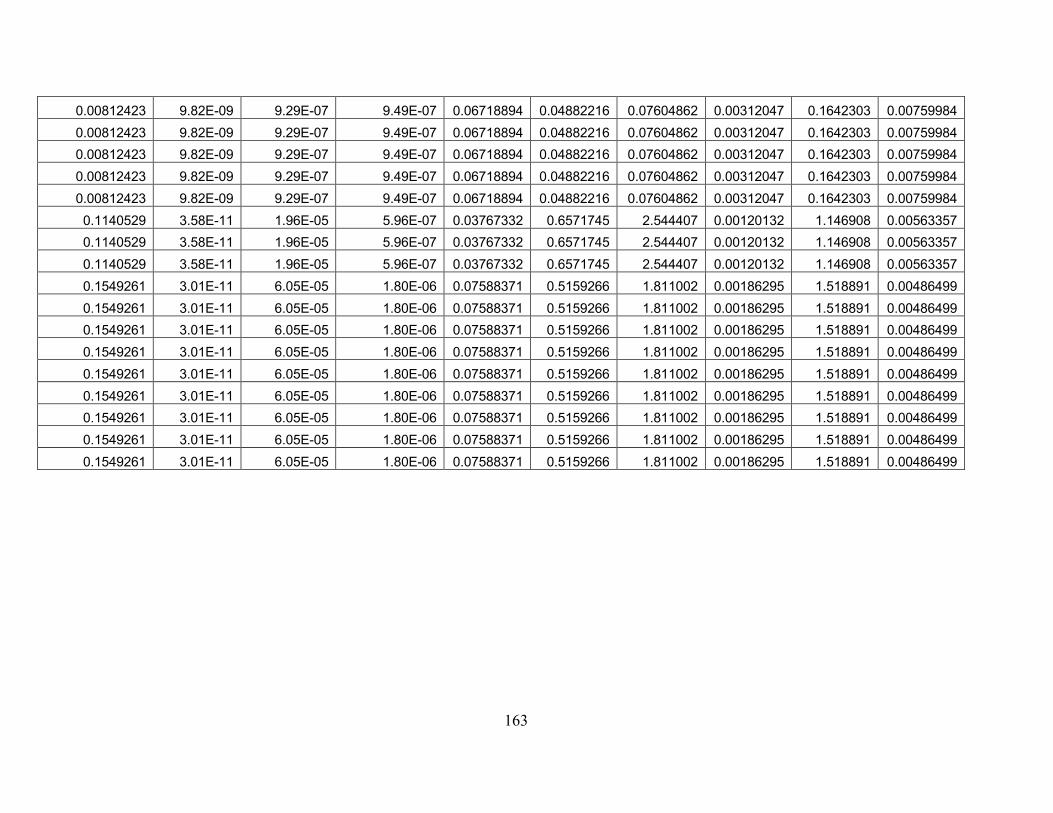
163
0.00812423 9.82E-09 9.29E-07 9.49E-07 0.06718894 0.04882216 0.07604862 0.00312047 0.1642303 0.00759984 0.00812423 9.82E-09 9.29E-07 9.49E-07 0.06718894 0.04882216 0.07604862 0.00312047 0.1642303 0.00759984 0.00812423 9.82E-09 9.29E-07 9.49E-07 0.06718894 0.04882216 0.07604862 0.00312047 0.1642303 0.00759984 0.00812423 9.82E-09 9.29E-07 9.49E-07 0.06718894 0.04882216 0.07604862 0.00312047 0.1642303 0.00759984 0.00812423 9.82E-09 9.29E-07 9.49E-07 0.06718894 0.04882216 0.07604862 0.00312047 0.1642303 0.00759984 0.1140529 3.58E-11 1.96E-05 5.96E-07 0.03767332 0.6571745 2.544407 0.00120132 1.146908 0.00563357 0.1140529 3.58E-11 1.96E-05 5.96E-07 0.03767332 0.6571745 2.544407 0.00120132 1.146908 0.00563357 0.1140529 3.58E-11 1.96E-05 5.96E-07 0.03767332 0.6571745 2.544407 0.00120132 1.146908 0.00563357 0.1549261 3.01E-11 6.05E-05 1.80E-06 0.07588371 0.5159266 1.811002 0.00186295 1.518891 0.00486499 0.1549261 3.01E-11 6.05E-05 1.80E-06 0.07588371 0.5159266 1.811002 0.00186295 1.518891 0.00486499 0.1549261 3.01E-11 6.05E-05 1.80E-06 0.07588371 0.5159266 1.811002 0.00186295 1.518891 0.00486499 0.1549261 3.01E-11 6.05E-05 1.80E-06 0.07588371 0.5159266 1.811002 0.00186295 1.518891 0.00486499 0.1549261 3.01E-11 6.05E-05 1.80E-06 0.07588371 0.5159266 1.811002 0.00186295 1.518891 0.00486499 0.1549261 3.01E-11 6.05E-05 1.80E-06 0.07588371 0.5159266 1.811002 0.00186295 1.518891 0.00486499 0.1549261 3.01E-11 6.05E-05 1.80E-06 0.07588371 0.5159266 1.811002 0.00186295 1.518891 0.00486499 0.1549261 3.01E-11 6.05E-05 1.80E-06 0.07588371 0.5159266 1.811002 0.00186295 1.518891 0.00486499 0.1549261 3.01E-11 6.05E-05 1.80E-06 0.07588371 0.5159266 1.811002 0.00186295 1.518891 0.00486499
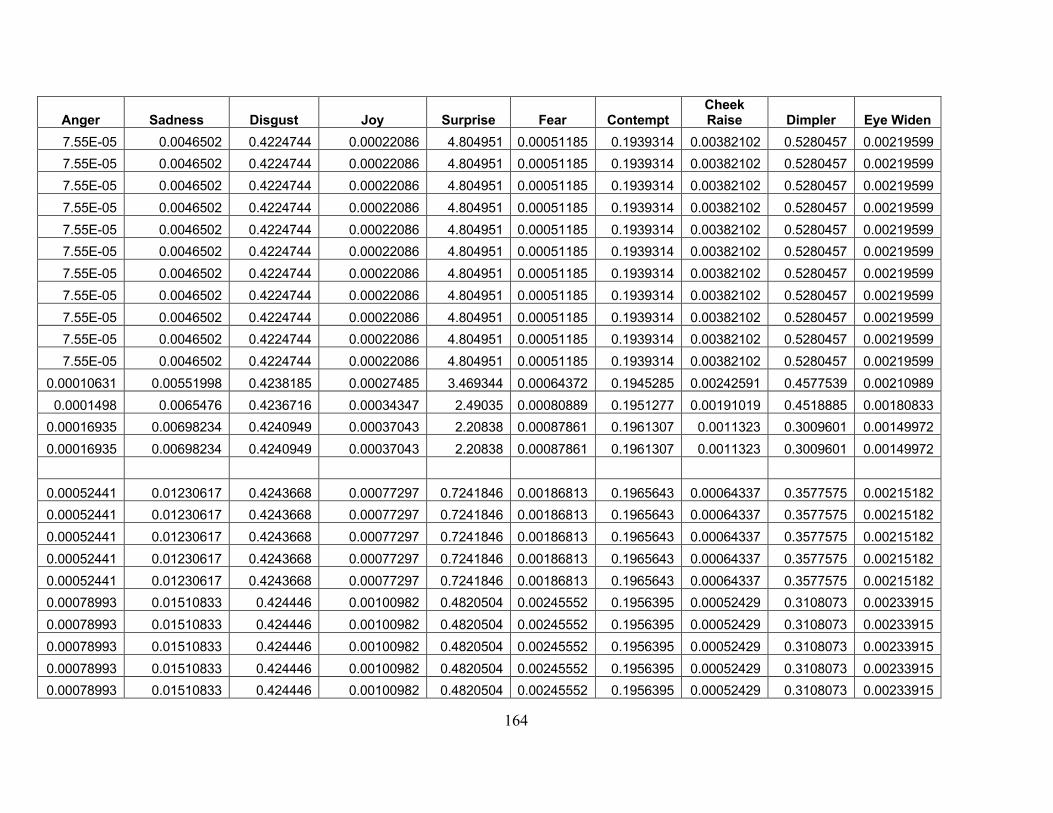
164
Anger Sadness Disgust Joy Surprise Fear Contempt Cheek Raise Dimpler Eye Widen
7.55E-05 0.0046502 0.4224744 0.00022086 4.804951 0.00051185 0.1939314 0.00382102 0.5280457 0.00219599 7.55E-05 0.0046502 0.4224744 0.00022086 4.804951 0.00051185 0.1939314 0.00382102 0.5280457 0.00219599 7.55E-05 0.0046502 0.4224744 0.00022086 4.804951 0.00051185 0.1939314 0.00382102 0.5280457 0.00219599 7.55E-05 0.0046502 0.4224744 0.00022086 4.804951 0.00051185 0.1939314 0.00382102 0.5280457 0.00219599 7.55E-05 0.0046502 0.4224744 0.00022086 4.804951 0.00051185 0.1939314 0.00382102 0.5280457 0.00219599 7.55E-05 0.0046502 0.4224744 0.00022086 4.804951 0.00051185 0.1939314 0.00382102 0.5280457 0.00219599 7.55E-05 0.0046502 0.4224744 0.00022086 4.804951 0.00051185 0.1939314 0.00382102 0.5280457 0.00219599 7.55E-05 0.0046502 0.4224744 0.00022086 4.804951 0.00051185 0.1939314 0.00382102 0.5280457 0.00219599 7.55E-05 0.0046502 0.4224744 0.00022086 4.804951 0.00051185 0.1939314 0.00382102 0.5280457 0.00219599 7.55E-05 0.0046502 0.4224744 0.00022086 4.804951 0.00051185 0.1939314 0.00382102 0.5280457 0.00219599 7.55E-05 0.0046502 0.4224744 0.00022086 4.804951 0.00051185 0.1939314 0.00382102 0.5280457 0.00219599
0.00010631 0.00551998 0.4238185 0.00027485 3.469344 0.00064372 0.1945285 0.00242591 0.4577539 0.00210989 0.0001498 0.0065476 0.4236716 0.00034347 2.49035 0.00080889 0.1951277 0.00191019 0.4518885 0.00180833 0.00016935 0.00698234 0.4240949 0.00037043 2.20838 0.00087861 0.1961307 0.0011323 0.3009601 0.00149972 0.00016935 0.00698234 0.4240949 0.00037043 2.20838 0.00087861 0.1961307 0.0011323 0.3009601 0.00149972
0.00052441 0.01230617 0.4243668 0.00077297 0.7241846 0.00186813 0.1965643 0.00064337 0.3577575 0.00215182 0.00052441 0.01230617 0.4243668 0.00077297 0.7241846 0.00186813 0.1965643 0.00064337 0.3577575 0.00215182 0.00052441 0.01230617 0.4243668 0.00077297 0.7241846 0.00186813 0.1965643 0.00064337 0.3577575 0.00215182 0.00052441 0.01230617 0.4243668 0.00077297 0.7241846 0.00186813 0.1965643 0.00064337 0.3577575 0.00215182 0.00052441 0.01230617 0.4243668 0.00077297 0.7241846 0.00186813 0.1965643 0.00064337 0.3577575 0.00215182 0.00078993 0.01510833 0.424446 0.00100982 0.4820504 0.00245552 0.1956395 0.00052429 0.3108073 0.00233915 0.00078993 0.01510833 0.424446 0.00100982 0.4820504 0.00245552 0.1956395 0.00052429 0.3108073 0.00233915 0.00078993 0.01510833 0.424446 0.00100982 0.4820504 0.00245552 0.1956395 0.00052429 0.3108073 0.00233915 0.00078993 0.01510833 0.424446 0.00100982 0.4820504 0.00245552 0.1956395 0.00052429 0.3108073 0.00233915 0.00078993 0.01510833 0.424446 0.00100982 0.4820504 0.00245552 0.1956395 0.00052429 0.3108073 0.00233915

165
0.00078993 0.01510833 0.424446 0.00100982 0.4820504 0.00245552 0.1956395 0.00052429 0.3108073 0.00233915 0.00078993 0.01510833 0.424446 0.00100982 0.4820504 0.00245552 0.1956395 0.00052429 0.3108073 0.00233915 0.00078993 0.01510833 0.424446 0.00100982 0.4820504 0.00245552 0.1956395 0.00052429 0.3108073 0.00233915 0.00078993 0.01510833 0.424446 0.00100982 0.4820504 0.00245552 0.1956395 0.00052429 0.3108073 0.00233915 0.00078993 0.01510833 0.424446 0.00100982 0.4820504 0.00245552 0.1956395 0.00052429 0.3108073 0.00233915 0.00207295 0.02132782 0.4320713 0.00206375 0.2064991 0.00438908 0.2102707 0.00461228 0.02212598 0.00424433 0.00207295 0.02132782 0.4320713 0.00206375 0.2064991 0.00438908 0.2102707 0.00461228 0.02212598 0.00424433 0.00207295 0.02132782 0.4320713 0.00206375 0.2064991 0.00438908 0.2102707 0.00461228 0.02212598 0.00424433 0.0020001 0.02173771 0.4214997 0.00208634 0.2028219 0.00435336 0.2163272 0.00627207 0.02566641 0.00728846 0.0020001 0.02173771 0.4214997 0.00208634 0.2028219 0.00435336 0.2163272 0.00627207 0.02566641 0.00728846 0.0020001 0.02173771 0.4214997 0.00208634 0.2028219 0.00435336 0.2163272 0.00627207 0.02566641 0.00728846 0.0020001 0.02173771 0.4214997 0.00208634 0.2028219 0.00435336 0.2163272 0.00627207 0.02566641 0.00728846 0.0020001 0.02173771 0.4214997 0.00208634 0.2028219 0.00435336 0.2163272 0.00627207 0.02566641 0.00728846 0.0020001 0.02173771 0.4214997 0.00208634 0.2028219 0.00435336 0.2163272 0.00627207 0.02566641 0.00728846 0.0020001 0.02173771 0.4214997 0.00208634 0.2028219 0.00435336 0.2163272 0.00627207 0.02566641 0.00728846 0.0020001 0.02173771 0.4214997 0.00208634 0.2028219 0.00435336 0.2163272 0.00627207 0.02566641 0.00728846 0.0020001 0.02173771 0.4214997 0.00208634 0.2028219 0.00435336 0.2163272 0.00627207 0.02566641 0.00728846

166
Lid Tighten Lip Stretch Jaw Drop
Timestamp RAW (no units) (Shimmer)
Timestamp CAL (mSecs) (Shimmer)
System Timestamp CAL (mSecs) (Shimmer)
Wide Range Accelerometer X RAW (no units) (Shimmer)
Wide Range Accelerometer X CAL (m/(sec^2)) (Shimmer)
Wide Range Accelerometer Y RAW (no units) (Shimmer)
Wide Range Accelerometer Y CAL (m/(sec^2)) (Shimmer)
0.0076899 0.00145108 0.09326635 9984 5446296.88 1.5604E+12 -14368 8.80931944 5632 3.45309626 0.0076899 0.00145108 0.09326635 9984 5446296.88 1.5604E+12 -14368 8.80931944 5632 3.45309626 0.0076899 0.00145108 0.09326635 10240 5446304.69 1.5604E+12 -14000 8.58369099 5712 3.50214592 0.0076899 0.00145108 0.09326635 10496 5446312.5 1.5604E+12 -13712 8.4071122 5728 3.51195586 0.0076899 0.00145108 0.09326635 10752 5446320.31 1.5604E+12 -13184 8.08338443 5760 3.53157572 0.0076899 0.00145108 0.09326635 11008 5446328.13 1.5604E+12 -12784 7.83813611 5744 3.52176579 0.0076899 0.00145108 0.09326635 11008 5446328.13 1.5604E+12 -12784 7.83813611 5744 3.52176579 0.0076899 0.00145108 0.09326635 11264 5446335.94 1.5604E+12 -12704 7.78908645 5728 3.51195586 0.0076899 0.00145108 0.09326635 11520 5446343.75 1.5604E+12 -12784 7.83813611 5680 3.48252606 0.0076899 0.00145108 0.09326635 11776 5446351.56 1.5604E+12 -12816 7.85775598 5616 3.44328633 0.0076899 0.00145108 0.09326635 12032 5446359.38 1.5604E+12 -12928 7.92642551 5568 3.41385653 0.00854414 0.00121923 0.08193253 12032 5446359.38 1.5604E+12 -12928 7.92642551 5568 3.41385653 0.00962399 0.0014262 0.07326189 12032 5446359.38 1.5604E+12 -12928 7.92642551 5568 3.41385653 0.01094169 0.00118757 0.06892633 12032 5446359.38 1.5604E+12 -12928 7.92642551 5568 3.41385653 0.01094169 0.00118757 0.06892633 12032 5446359.38 1.5604E+12 -12928 7.92642551 5568 3.41385653
12032 5446359.38 1.5604E+12 -12928 7.92642551 5568 3.41385653 0.01222109 0.00183255 0.05929456 12032 5446359.38 1.5604E+12 -12928 7.92642551 5568 3.41385653 0.01222109 0.00183255 0.05929456 12288 5446367.19 1.5604E+12 -12944 7.93623544 5680 3.48252606 0.01222109 0.00183255 0.05929456 12544 5446375 1.5604E+12 -13152 8.06376456 5920 3.62967505 0.01222109 0.00183255 0.05929456 12800 5446382.81 1.5604E+12 -13168 8.07357449 6112 3.74739424 0.01222109 0.00183255 0.05929456 13056 5446390.63 1.5604E+12 -13472 8.25996321 6528 4.00245248 0.01196391 0.00212852 0.05488794 13056 5446390.63 1.5604E+12 -13472 8.25996321 6528 4.00245248 0.01196391 0.00212852 0.05488794 13056 5446390.63 1.5604E+12 -13472 8.25996321 6528 4.00245248 0.01196391 0.00212852 0.05488794 13056 5446390.63 1.5604E+12 -13472 8.25996321 6528 4.00245248

167
0.01196391 0.00212852 0.05488794 13312 5446398.44 1.5604E+12 -13568 8.31882281 6816 4.17903127 0.01196391 0.00212852 0.05488794 13568 5446406.25 1.5604E+12 -13504 8.27958308 6752 4.13979154 0.01196391 0.00212852 0.05488794 13568 5446406.25 1.5604E+12 -13504 8.27958308 6752 4.13979154 0.01196391 0.00212852 0.05488794 13824 5446414.06 1.5604E+12 -13216 8.10300429 6352 3.89454323 0.01196391 0.00212852 0.05488794 14080 5446421.88 1.5604E+12 -12928 7.92642551 6048 3.70815451 0.01196391 0.00212852 0.05488794 14336 5446429.69 1.5604E+12 -12512 7.67136726 5776 3.54138565 0.01196391 0.00212852 0.05488794 14592 5446437.5 1.5604E+12 -12480 7.65174739 5648 3.46290619 0.00257551 0.00297724 0.1608267 40704 5447234.38 1.5604E+12 -13904 8.52483139 -448 -0.2746781 0.00257551 0.00297724 0.1608267 40704 5447234.38 1.5604E+12 -13904 8.52483139 -448 -0.2746781 0.00257551 0.00297724 0.1608267 40960 5447242.19 1.5604E+12 -14000 8.58369099 896 0.54935622 0.00263386 0.00306775 0.1442331 40960 5447242.19 1.5604E+12 -14000 8.58369099 896 0.54935622 0.00263386 0.00306775 0.1442331 41216 5447250 1.5604E+12 -14240 8.73083998 2048 1.25567137 0.00263386 0.00306775 0.1442331 41472 5447257.81 1.5604E+12 -14464 8.86817903 2384 1.46167995 0.00263386 0.00306775 0.1442331 41728 5447265.63 1.5604E+12 -14656 8.98589822 2592 1.58920907 0.00263386 0.00306775 0.1442331 41984 5447273.44 1.5604E+12 -14576 8.93684856 2560 1.56958921 0.00263386 0.00306775 0.1442331 41984 5447273.44 1.5604E+12 -14576 8.93684856 2560 1.56958921 0.00263386 0.00306775 0.1442331 42240 5447281.25 1.5604E+12 -14688 9.00551809 2432 1.49110975 0.00263386 0.00306775 0.1442331 42496 5447289.06 1.5604E+12 -14976 9.18209687 2400 1.47148988 0.00263386 0.00306775 0.1442331 42752 5447296.88 1.5604E+12 -15584 9.55487431 2336 1.43225015

168
Wide Range Accelerometer Z RAW (no units) (Shimmer)
Wide Range Accelerometer Z CAL
(m/(sec^2)) (Shimmer)
VSenseBatt RAW (no units) (Shimmer)
VSenseBatt CAL (mVolts) (Shimmer)
Internal ADC A13 PPG RAW (no units) (Shimmer)
Internal ADC A13 PPG CAL (mVolts) (Shimmer)
GSR RAW (no units) (Shimmer)
GSR CAL (kOhms) (Shimmer)
-10256 6.28816677 2826 4115.81538 1965 1439.56044 35454 331.928171 -10256 6.28816677 2826 4115.81538 1965 1439.56044 35454 331.928171 -9888 6.06253832 2811 4093.96923 1959 1435.16484 35457 331.433117 -9760 5.98405886 2808 4089.6 1953 1430.76923 35457 331.433117 -9600 5.88595953 2818 4104.1641 1944 1424.17582 35458 331.268427 -9600 5.88595953 2816 4101.25128 1935 1417.58242 35458 331.268427 -9600 5.88595953 2816 4101.25128 1935 1417.58242 35458 331.268427 -9648 5.91538933 2813 4096.88205 1927 1411.72161 35459 331.1039 -9648 5.91538933 2808 4089.6 1919 1405.86081 35460 330.939537 -9584 5.8761496 2808 4089.6 1914 1402.1978 35462 330.6113 -9584 5.8761496 2819 4105.62051 1908 1397.8022 35462 330.6113 -9584 5.8761496 2819 4105.62051 1908 1397.8022 35462 330.6113 -9584 5.8761496 2819 4105.62051 1908 1397.8022 35462 330.6113 -9584 5.8761496 2819 4105.62051 1908 1397.8022 35462 330.6113 -9584 5.8761496 2819 4105.62051 1908 1397.8022 35462 330.6113 -9584 5.8761496 2819 4105.62051 1908 1397.8022 35462 330.6113 -9584 5.8761496 2819 4105.62051 1908 1397.8022 35462 330.6113 -9536 5.8467198 2815 4099.79487 1903 1394.13919 35463 330.447426 -9312 5.70938075 2819 4105.62051 1899 1391.20879 35464 330.283714 -9200 5.64071122 2809 4091.05641 1896 1389.01099 35466 329.956776 -8928 5.47394237 2820 4107.07692 1893 1386.81319 35465 330.120164 -8928 5.47394237 2820 4107.07692 1893 1386.81319 35465 330.120164 -8928 5.47394237 2820 4107.07692 1893 1386.81319 35465 330.120164 -8928 5.47394237 2820 4107.07692 1893 1386.81319 35465 330.120164 -8848 5.4248927 2815 4099.79487 1892 1386.08059 35466 329.956776

169
-8944 5.4837523 2816 4101.25128 1889 1383.88278 35468 329.630484 -8944 5.4837523 2816 4101.25128 1889 1383.88278 35468 329.630484 -9008 5.52299203 2819 4105.62051 1886 1381.68498 35468 329.630484 -9104 5.58185162 2820 4107.07692 1884 1380.21978 35469 329.46758 -9408 5.76824034 2810 4092.51282 1884 1380.21978 35471 329.142255 -9504 5.82709994 2817 4102.70769 1883 1379.48718 35471 329.142255 -8656 5.30717351 2820 4107.07692 1915 1402.9304 35570 313.804249 -8656 5.30717351 2820 4107.07692 1915 1402.9304 35570 313.804249 -8496 5.20907419 2815 4099.79487 1915 1402.9304 35571 313.656609 -8496 5.20907419 2815 4099.79487 1915 1402.9304 35571 313.656609 -8384 5.14040466 2815 4099.79487 1915 1402.9304 35572 313.509107 -8240 5.05211527 2804 4083.77436 1915 1402.9304 35572 313.509107 -8080 4.95401594 2820 4107.07692 1915 1402.9304 35573 313.361745 -7952 4.87553648 2815 4099.79487 1915 1402.9304 35574 313.214521 -7952 4.87553648 2815 4099.79487 1915 1402.9304 35574 313.214521 -7776 4.76762722 2815 4099.79487 1915 1402.9304 35574 313.214521 -7632 4.67933783 2820 4107.07692 1914 1402.1978 35575 313.067435 -7616 4.6695279 2822 4109.98974 1914 1402.1978 35576 312.920487
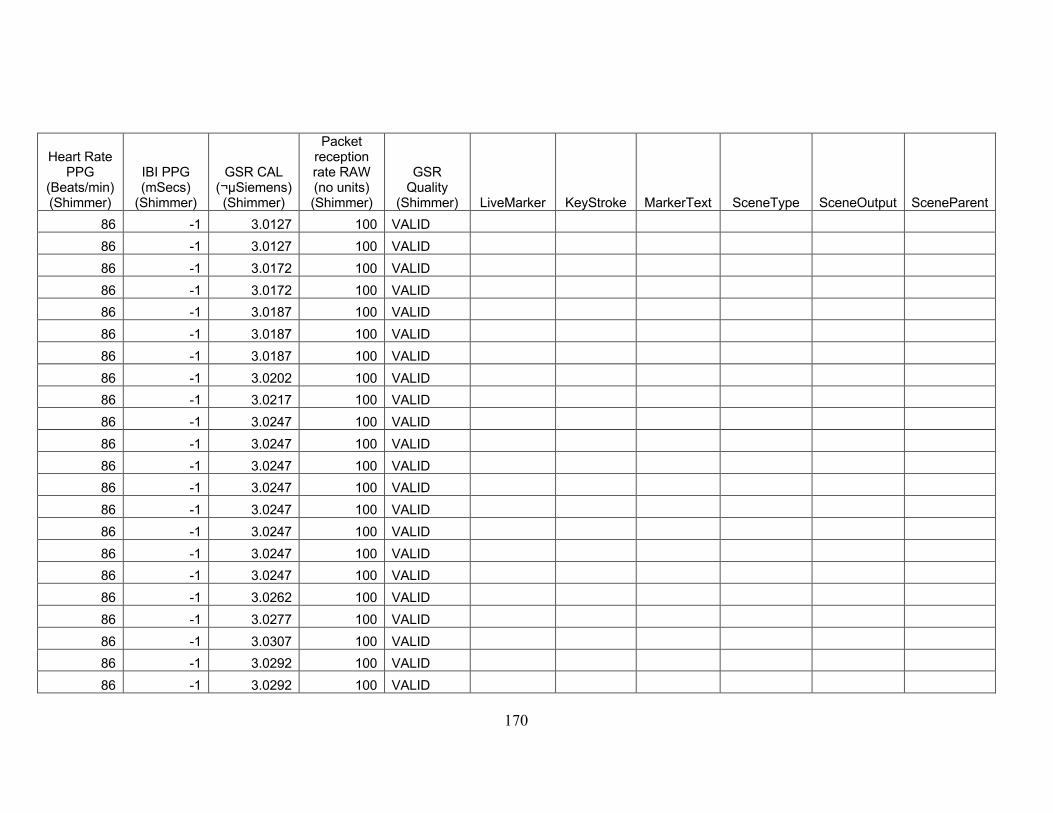
170
Heart Rate PPG
(Beats/min) (Shimmer)
IBI PPG (mSecs) (Shimmer)
GSR CAL (µSiemens) (Shimmer)
Packet reception rate RAW (no units) (Shimmer)
GSR Quality
(Shimmer) LiveMarker KeyStroke MarkerText SceneType SceneOutput SceneParent 86 -1 3.0127 100 VALID 86 -1 3.0127 100 VALID 86 -1 3.0172 100 VALID 86 -1 3.0172 100 VALID 86 -1 3.0187 100 VALID 86 -1 3.0187 100 VALID 86 -1 3.0187 100 VALID 86 -1 3.0202 100 VALID 86 -1 3.0217 100 VALID 86 -1 3.0247 100 VALID 86 -1 3.0247 100 VALID 86 -1 3.0247 100 VALID 86 -1 3.0247 100 VALID 86 -1 3.0247 100 VALID 86 -1 3.0247 100 VALID 86 -1 3.0247 100 VALID 86 -1 3.0247 100 VALID 86 -1 3.0262 100 VALID 86 -1 3.0277 100 VALID 86 -1 3.0307 100 VALID 86 -1 3.0292 100 VALID 86 -1 3.0292 100 VALID

171
86 -1 3.0292 100 VALID 86 -1 3.0292 100 VALID 86 -1 3.0307 100 VALID 86 -1 3.0337 100 VALID 86 -1 3.0337 100 VALID 86 -1 3.0337 100 VALID 86 -1 3.0352 100 VALID 86 -1 3.0382 100 VALID 86 -1 3.0382 100 VALID 87 -1 3.1867 100 VALID 87 -1 3.1867 100 VALID 87 -1 3.1882 100 VALID 87 -1 3.1882 100 VALID 87 -1 3.1897 100 VALID 87 -1 3.1897 100 VALID 87 -1 3.1912 100 VALID 87 -1 3.1927 100 VALID 87 -1 3.1927 100 VALID 87 -1 3.1927 100 VALID 87 -1 3.1942 100 VALID 87 -1 3.1957 100 VALID

172
APPENDIX E: Facial Expression Analysis Dashboard (participant pixelated to protect anonymity)

173
APPENDIX F: Galvanic Skin Response Dashboard (Shimmer3)
Top Related