


Languages
Pages
Legal

Improving Effectiveness and Utilisation of Funds for Selected Schemes through Suitable Changes in Timing and Pattern of Releases by the Centre
A Report of Research Project sponsored by the Planning
Commission of India
Manish Gupta Anit Mukherjee Tapas K. Sen R. Srinivasan
October 2011
National Institute of Public Finance and Policy New Delhi
Preface
This study was sponsored by the Planning Commission under the scheme of
Socio Economic Research (SER). The study team was led by Professor Tapas K. Sen.
Other members of the team were Dr. Anit Mukherjee, Dr. Manish Gupta and Mr. R.
Srinivasan.
The members of the Governing Body of the National Institute of Public
Finance and Policy are in no way responsible for the opinions expressed in this report.
The authors alone are responsible for the views expressed here.
M. Govinda Rao Director
i
Contents
Preface 1. Introduction
2. General Observations
3. Examination of Selected Schemes
3.1. The Mahatma Gandhi National Rural Employment Guarantee
Act (MGNREGA)
3.2. Pradhan Mantri Gram Sadak Yojana (PMGSY)
3.3. Indira Awaas Yojana (IAY)
3.4. National Rural Drinking Water Programme (NRDWP)
3.5. Rashtriya Krishi Vikas Yojana (RKVY)
3.6. Technology Mission for Integrated Development of Horticulture in North
Eastern States, Sikkim, Jammu & Kashmir, Himachal Pradesh and
Uttarakhand (TMIDH)
3.7. Accelerated Irrigation Benefit Programme (AIBP)
3.8. Backward Region Grant Fund (BRGF)
3.9. National Rural Health Mission (NRHM)
3.10. Sarva Shiksha Abhiyan (SSA)
3.11. Mid-day Meal Programme (MDM)
3.12. Integrated Child Development Services (ICDS)
3.13. Jawaharlal Nehru National Urban Renewal Mission (JNNURM)
3.14. Non-Lapsable Central Pool of Resources (NLCPR)
3.15. Transfers from North-Eastern Council (NEC)
3.16. Prime Minister’s Reconstruction Plan (PMRP) for Jammu & Kashmir
4. Observations and Recommendations
4.1. Design of the Schemes
4.2. Flow of Funds
1 2 3
3
8
14
18
25
31
32
36
42
47
51
55
59
64
66
67
67
68
70
ii
List of Tables Table 1.1 Central Grants to States in 2009-10 (RE) 1 Table 3.1.1 Utilisation of NREGA Funds in Selected States 5 Table 3.1.2 Utilisation of NREGA Funds in Other States and UTs 6 Table 3.2.1 Utilisation of Funds under PMGSY in Selected States 10 Table 3.2.2 Central allocation and release, and Utilisation of Funds under
PMGSY during 2008-09 & 2009-10 - Other States 12
Table 3.3.1 Utilisation of Funds under IA 15 Table 3.3.2 State-wise Central Allocation and Release, and Utilisation of
Releases under IAY 17
Table 3.4.1 Financial Provisions - NRDWP 19 Table 3.4.2 Utilisation of Funds under NRDWP 23 Table 3.5.1 Salient Features of Financial Provisions for RKVY 25 Table 3.7.1 Salient Features of AIBP Framework 33 Table 3.7.2 AIBP releases (2008-09, 2009-10) 35 Table 3.8.1 Salient features of BRGF 36 Table 3.8.2 Releases to Entitlement Ratio (2007-10) 40 Table 3.9.1 Key Features of Transfer System under NRHM 43 Table 3.9.2 Utilisation of NRHM Funds by Selected States 44 Table 3.9.3 NRHM Flow of Funds - Key Ratios of Other States 45 Table 3.10.1 Key Features of Central Transfers under SSA 48 Table 3.10.2 Utilisation of Funds under SSA 49 Table 3.10.3 Utilisation of Funds under SSA in ‘Other’ States 50 Table 3.11.1 Salient Features of Financial Flows under MDM 52 Table 3.12.1 Releases and Expenditure under ICDS in 2008-09 56 Table 3.12.2 Central Release and Expenditure of ‘Other’ States under
ICDS Programme in 2008-09 58
Table 3.13.1 Financial Provisions under JNNURM 60 Table 3.13.2 Cumulative Release of Funds for Projects Sanctioned under
UI&G 62
Table 3.13.3 Allocation, Commitment and Release (in Rs. Crore) 63 Table 3.14.1 Funds Released for Projects under NLCPR 65
iii
List of Figures Figure 3.1.1 Quarterly releases under NREGA in 2008-09 (%) 5 Figure 3.1.2 Quarterly Releases under NREGA, 2008-09 7 Figure 3.1.3 Quarterly Releases under NREGA, 2009-10 7 Figure 3.2.1 Quarterly Releases under PMGSY in 2008-09 11 Figure 3.2.2 Quarterly Releases under PMGSY 2008-09 (%) 13 Figure 3.2.3 Quarterly Releases under PMGSY 2009-10 (%) 13 Figure 3.3.1 Quarterly Releases under IAY 2008-09 (%) 16 Figure 3.3.2 Quarterly Releases under IAY 2008-09 17 Figure 3.3.3 Quarterly Releases under IAY 2009-10 18 Figure 3.4.1 NRDWP - Allocation, Releases and Expenditures in 2008-09 21 Figure 3.4.2 NRDWP Releases (2008-09) 21 Figure 3.4.3 NRDWP Releases/Allocation ratio (%) 22 Figure 3.4.4 Quarterly Releases of NRDWP funds (%) 24 Figure 3.5.1 RKVY - Allocation, Releases and Expenditures in 2008-09 28 Figure 3.5.2 RKVY Releases (2008-09) 28 Figure 3.5.3 RKVY: R/A ratio and E/R ratio (2008-09) (%) 29 Figure 3.5.4 RKVY: R/A ratio and E/R ratio (2009-10) (%) 29 Figure 3.5.5 Quarterly release of funds (2008-09, 2009-10) (%) 30 Figure 3.5.6a RKVY Quarterly Releases (2009-10) 30 Figure 3.5.6b RKVY Quarterly Releases (2008-09) 30 Figure 3.6.1 TMIDH- Allocation, Releases and Expenditures (2008-09) 31 Figure 3.6.2 TMIDH Releases (2008-09) 32 Figure 3.7.1 Quarterly Releases (2009-10) 35 Figure 3.8.1 Utilisation of BRGF Funds, 2007-08 to 2009-10 37 Figure 3.8.2 BRGF Releases (2008-09) 38 Figure 3.8.2 Utilisation of BRGF Funds (2007-08 to 2009-10) 39 Figure 3.8.3 Quarterly Releases (2008-09) (2009-10) (%) 41 Figure 3.9.1 Releases Under NRHM 44 Figure 3.9.2 Time Pattern of Release of Funds - 2009-10 46 Figure 3.10.1 Quarterly Releases under SSA in 2009-10 49 Figure 3.10.2 Time Pattern of Releases under SSA - Other States - 2009-10 51 Figure 3.11.1 Quarterly Releases under Mid-day Meal in 2009-10 53 Figure 3.11.2 Release of Central Funds for Mid-day Meals in 'Other'
States, 2009-10, 2010-11 54
Figure 3.12.1 Quarterly Releases under ICDS in 2009-10 57 Figure 3.12.2 Releases under ICDS for 'Other' States, 2009-10, 2010-11 59
1
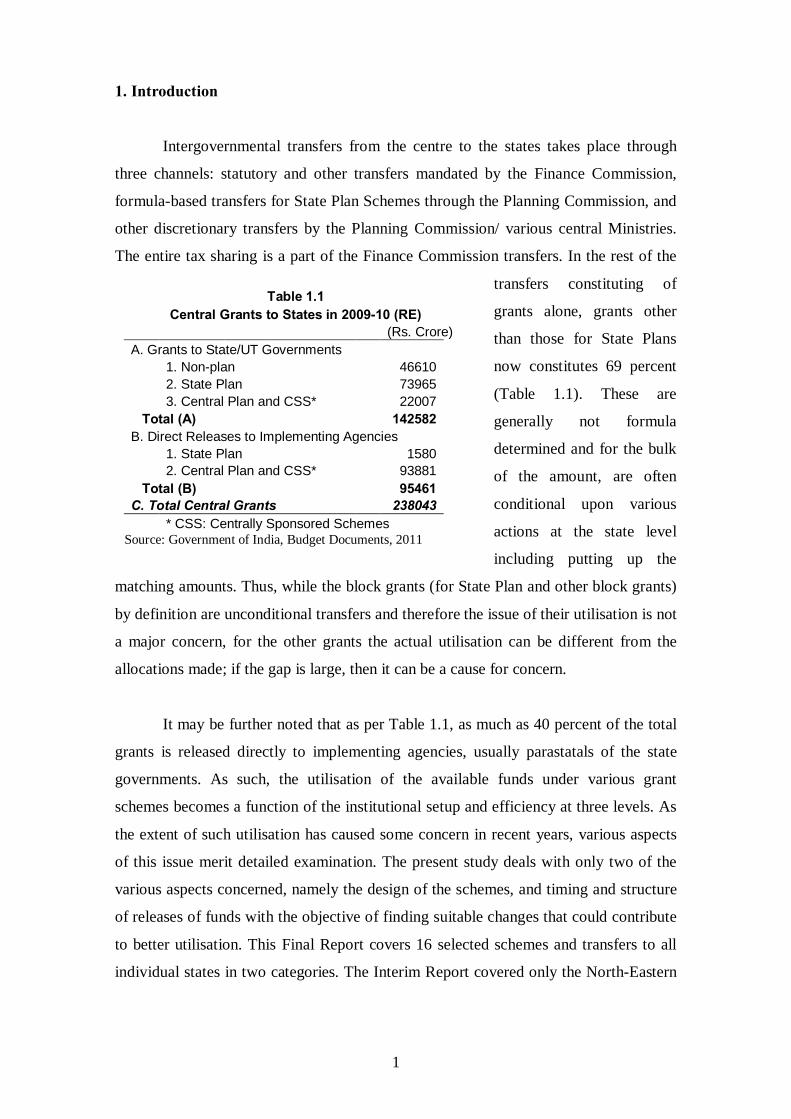
Table 1.1 Central Grants to States in 2009-10 (RE)
(Rs. Crore) A. Grants to State/UT Governments 1. Non-plan 46610 2. State Plan 73965 3. Central Plan and CSS* 22007 Total (A) 142582 B. Direct Releases to Implementing Agencies 1. State Plan 1580 2. Central Plan and CSS* 93881 Total (B) 95461 C. Total Central Grants 238043 * CSS: Centrally Sponsored Schemes
Source: Government of India, Budget Documents, 2011
1. Introduction
Intergovernmental transfers from the centre to the states takes place through
three channels: statutory and other transfers mandated by the Finance Commission,
formula-based transfers for State Plan Schemes through the Planning Commission, and
other discretionary transfers by the Planning Commission/ various central Ministries.
The entire tax sharing is a part of the Finance Commission transfers. In the rest of the
transfers constituting of
grants alone, grants other
than those for State Plans
now constitutes 69 percent
(Table 1.1). These are
generally not formula
determined and for the bulk
of the amount, are often
conditional upon various
actions at the state level
including putting up the
matching amounts. Thus, while the block grants (for State Plan and other block grants)
by definition are unconditional transfers and therefore the issue of their utilisation is not
a major concern, for the other grants the actual utilisation can be different from the
allocations made; if the gap is large, then it can be a cause for concern.
It may be further noted that as per Table 1.1, as much as 40 percent of the total
grants is released directly to implementing agencies, usually parastatals of the state
governments. As such, the utilisation of the available funds under various grant
schemes becomes a function of the institutional setup and efficiency at three levels. As
the extent of such utilisation has caused some concern in recent years, various aspects
of this issue merit detailed examination. The present study deals with only two of the
various aspects concerned, namely the design of the schemes, and timing and structure
of releases of funds with the objective of finding suitable changes that could contribute
to better utilisation. This Final Report covers 16 selected schemes and transfers to all
individual states in two categories. The Interim Report covered only the North-Eastern
2
states including Sikkim, and Jammu & Kashmir1, and these continue to be a distinct
group in this report as well, called ‘Selected States’. The remainder of the states are
covered as ‘Other States’ in this report.
2. General Observations
In terms of facilitating utilisation, a grantor agency has limited tools in its
hands. These include, inter alia, the design of the scheme (to eliminate disincentives
for utilisation), the actual transfer mechanism, and the timing. In terms of design, when
one is considering conditional transfers which all the schemes under examination are, it
is almost tautological to observe that the more conditions there are, and the more
difficult they are to meet, the less would be the utilisation. For example, a specific-
purpose transfer without any matching requirement is likely to be utilised to a higher
extent than one with such a requirement. Similarly, the transfer mechanism can also
influence utilisation; in times of resource constraints, grants on a reimbursable basis
have less chance of high utilisation than those provided at least partly on advance basis.
The importance of timing of transfers hardly needs an explanation: it is sufficient to
state that grants received at the fag end of the year have little chance of getting spent
usefully within that year. In the selected special category states that this report
separately covers, there is also a seasonal dimension to the issue of timing. All the
special category states in India have the problem of extreme weather; in the north-
eastern states it is the monsoon season that is characterised by heavy rainfall and in the
states of Jammu & Kashmir (excluding the relatively lower areas of Jammu), Sikkim
and northern parts of Arunachal Pradesh, it is the winter with heavy snowfall. During
these months of extreme weather, developmental work is substantially hampered, and
funds received cannot be gainfully employed.
In what follows, we examine available data with respect to the selected schemes
to draw inferences about the suitability or otherwise of present arrangements. But
before examining the data, we conduct below an a priori analysis of the design of the
scheme and the structure of the transfer. This broad method of analysis is followed for
each of the schemes analysed, with some variations due primarily to availability of data
and sometimes the nature of the scheme. The schemes are organised by the concerned
1 It also covered 15 of the 16 selected schemes.
3
Ministries. Comments about the possible improvements are in the final section of this
report.
3. Examination of Selected Schemes
3.1. The Mahatma Gandhi National Rural Employment Guarantee Act (MGNREGA) (Ministry of Rural Development) This scheme is the largest rural employment programme designed in India,
following up on and subsuming other rural employment programmes like SGRY with
the ultimate objective of alleviating rural poverty through job creation. It entitles all
persons – below poverty line or not – to at least 100 days of guaranteed wage
employment. It was introduced through the notification of the Act first in 200 districts
of the country, subsequently extended to another 130 districts. The Act is now
applicable to the entire country except fully urban districts.
This is a cost sharing scheme with the centre bearing the full cost of wages of
unskilled labour, 75 percent of the cost of material and wages for skilled/semi-skilled
labour, and a part of the administrative expenses. The state governments have to bear
the remaining costs of material and wages, and administrative costs, along with the
costs of unemployment allowance payable to those who cannot be provided wage
employment within 15 days of application.
As this is an entitlement programme, there is no predetermined amount of
expenditure, either nationally or in any state. The nature of the scheme demands
flexibility in the system of financing, and such flexibility is sought to be imparted
through first release of the year based on an annual labour budget at the beginning of
the year and subsequent release of funds on the basis of subsequent demand on
expenditure of at least 60 percent of the first instalment (plus opening balance). The
district level labour budgets and follow-up demands are channelled through the state
government. Normally the releases are in two tranches, the first not more than 50
percent of the total approved labour budget after adjusting unspent balances. The first
instalment is released subject to submission of the Audit report of the year before last.
Releases are subject to physical, financial, administrative and accountability conditions.
Utilisation certificate for the previous year is due before second instalment is released,
4
as also certificate regarding the release and receipt of the state share supported by
authenticated bank statement.
The flow of funds hinges crucially on the labour budget, the preparation of
which is an elaborate decentralised exercise. Starting from the village level, the
proposed works have to be costed, checked for conformity with guidelines (e.g.,
permitted types of works, and approved ratio of materials and wages), conveyed for
approval, and aggregated at the next higher level. The process is expected to start on
October 2 every year and the state has to provide the detailed labour budget by end-
January. Given the essential characteristic of the decentralised nature of this
programme, this process of formulating the labour budget is perhaps ideal; however,
the uneven administrative capacity of Panchayati Raj institutions (particularly at the
block and village level) can create difficulties in the nature of trade-offs between timely
submission and quality of the budget. The system would also encourage a tendency of
inflating the annual labour budget to obtain larger amounts up front, ending up with
unspent balances every year, so that post facto utilisation of funds would appear lower
than expected. It would be entirely up to the Ministry of Rural Development to curb
this tendency while assessing the annual labour budgets.
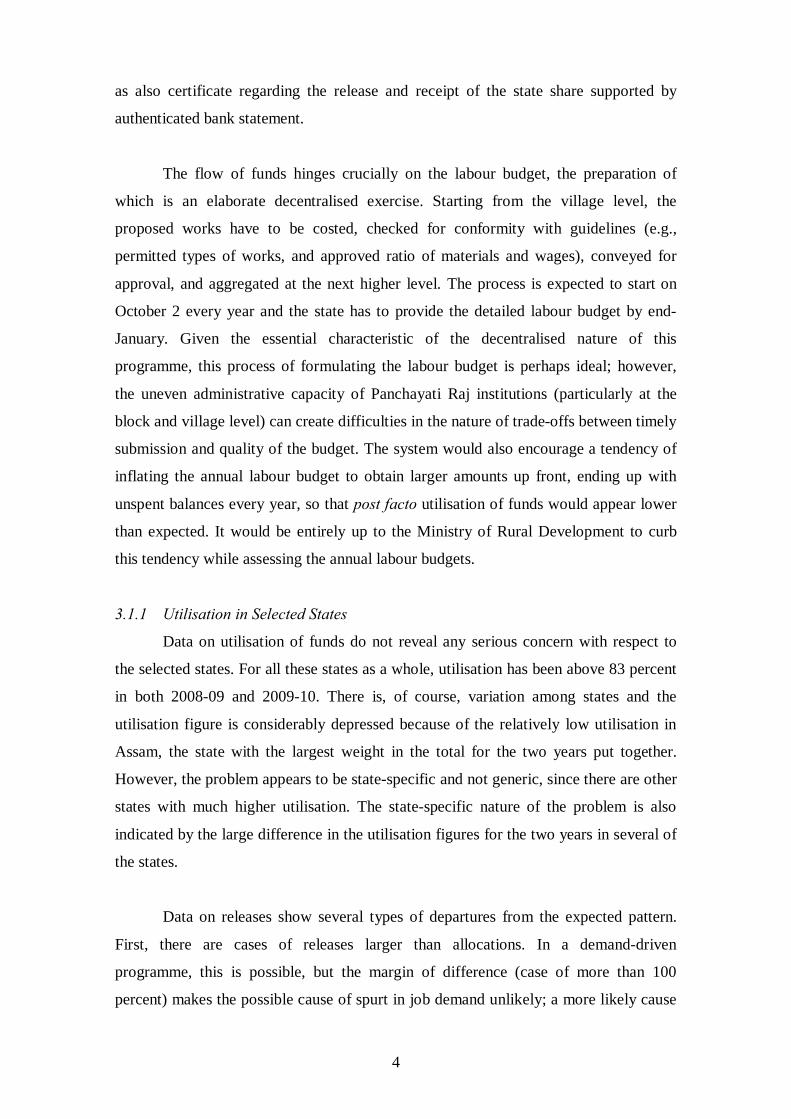
3.1.1 Utilisation in Selected States
Data on utilisation of funds do not reveal any serious concern with respect to
the selected states. For all these states as a whole, utilisation has been above 83 percent
in both 2008-09 and 2009-10. There is, of course, variation among states and the
utilisation figure is considerably depressed because of the relatively low utilisation in
Assam, the state with the largest weight in the total for the two years put together.
However, the problem appears to be state-specific and not generic, since there are other
states with much higher utilisation. The state-specific nature of the problem is also
indicated by the large difference in the utilisation figures for the two years in several of
the states.
Data on releases show several types of departures from the expected pattern.
First, there are cases of releases larger than allocations. In a demand-driven
programme, this is possible, but the margin of difference (case of more than 100
percent) makes the possible cause of spurt in job demand unlikely; a more likely cause
5
is releases relating to previous year(s). If that is indeed so, then it is perhaps a pointer
towards conditionalities that may be difficult to meet.
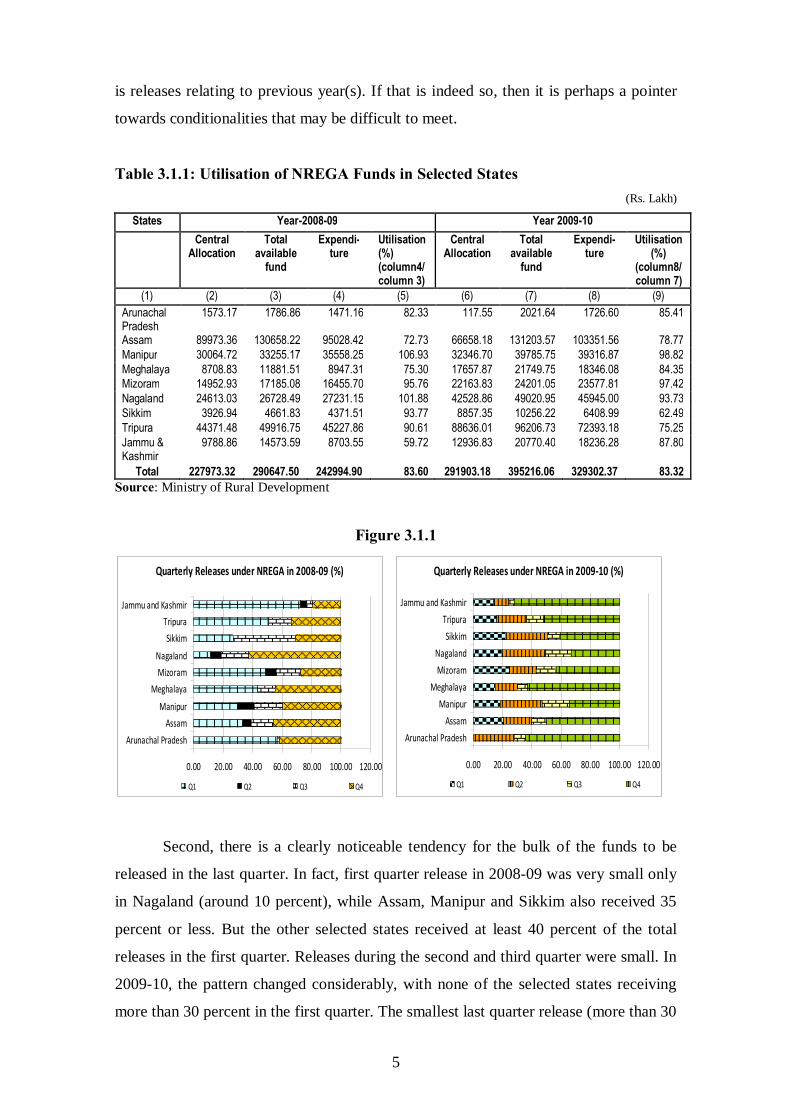
Table 3.1.1: Utilisation of NREGA Funds in Selected States (Rs. Lakh)
States Year-2008-09 Year 2009-10 Central
Allocation Total
available fund
Expendi-ture
Utilisation (%) (column4/ column 3)
Central Allocation
Total available
fund
Expendi-ture
Utilisation (%)
(column8/ column 7)
(1) (2) (3) (4) (5) (6) (7) (8) (9) Arunachal Pradesh
1573.17 1786.86 1471.16 82.33 117.55 2021.64 1726.60 85.41
Assam 89973.36 130658.22 95028.42 72.73 66658.18 131203.57 103351.56 78.77 Manipur 30064.72 33255.17 35558.25 106.93 32346.70 39785.75 39316.87 98.82 Meghalaya 8708.83 11881.51 8947.31 75.30 17657.87 21749.75 18346.08 84.35 Mizoram 14952.93 17185.08 16455.70 95.76 22163.83 24201.05 23577.81 97.42 Nagaland 24613.03 26728.49 27231.15 101.88 42528.86 49020.95 45945.00 93.73 Sikkim 3926.94 4661.83 4371.51 93.77 8857.35 10256.22 6408.99 62.49 Tripura 44371.48 49916.75 45227.86 90.61 88636.01 96206.73 72393.18 75.25 Jammu & Kashmir
9788.86 14573.59 8703.55 59.72 12936.83 20770.40 18236.28 87.80
Total 227973.32 290647.50 242994.90 83.60 291903.18 395216.06 329302.37 83.32 Source: Ministry of Rural Development
Figure 3.1.1
Quarterly Releases under NREGA in 2008-09 (%)
0.00 20.00 40.00 60.00 80.00 100.00 120.00
Arunachal PradeshAssam
ManipurMeghalaya
MizoramNagaland
SikkimTripura
Jammu and Kashmir
Q1 Q2 Q3 Q4
Quarterly Releases under NREGA in 2009-10 (%)
0.00 20.00 40.00 60.00 80.00 100.00 120.00
Arunachal PradeshAssam
ManipurMeghalaya
MizoramNagaland
SikkimTripura
Jammu and Kashmir
Q1 Q2 Q3 Q4
Second, there is a clearly noticeable tendency for the bulk of the funds to be
released in the last quarter. In fact, first quarter release in 2008-09 was very small only
in Nagaland (around 10 percent), while Assam, Manipur and Sikkim also received 35
percent or less. But the other selected states received at least 40 percent of the total
releases in the first quarter. Releases during the second and third quarter were small. In
2009-10, the pattern changed considerably, with none of the selected states receiving
more than 30 percent in the first quarter. The smallest last quarter release (more than 30
6
percent) was in Nagaland, with Jammu and Kashmir receiving around 70 percent of its
total releases in the last quarter. The pattern clearly indicates difficulties with the
system of flow of funds.
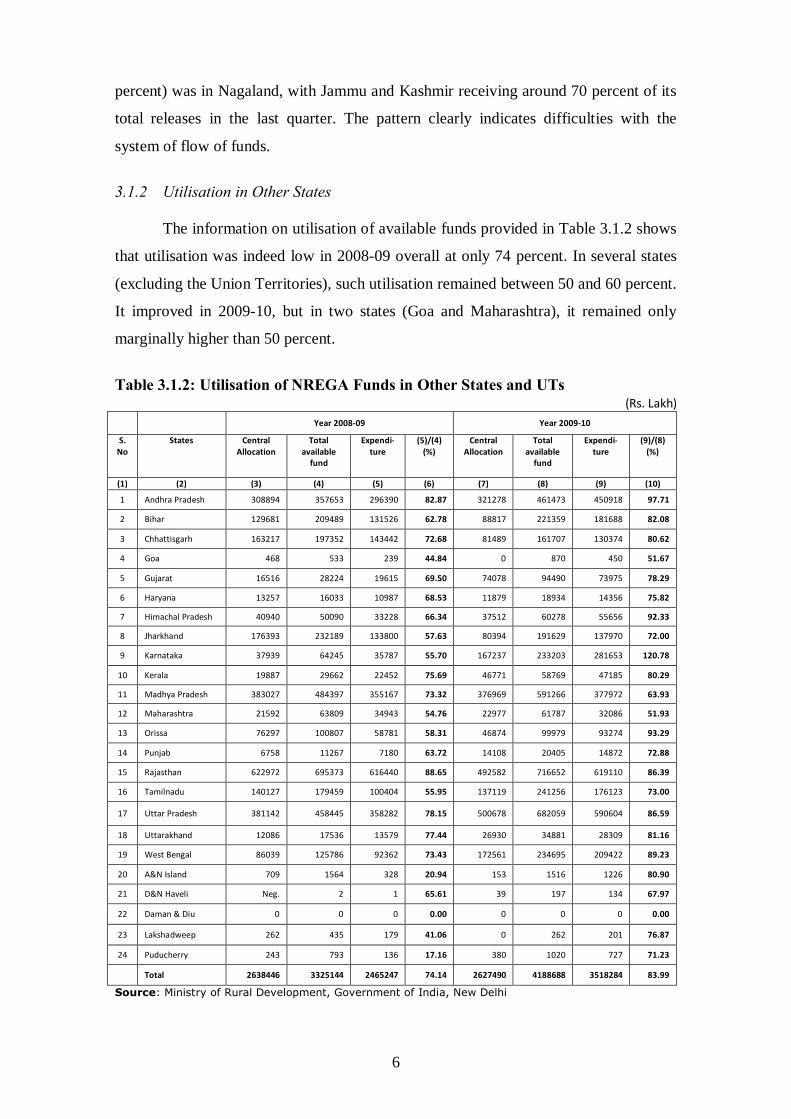
3.1.2 Utilisation in Other States The information on utilisation of available funds provided in Table 3.1.2 shows
that utilisation was indeed low in 2008-09 overall at only 74 percent. In several states
(excluding the Union Territories), such utilisation remained between 50 and 60 percent.
It improved in 2009-10, but in two states (Goa and Maharashtra), it remained only
marginally higher than 50 percent.
Table 3.1.2: Utilisation of NREGA Funds in Other States and UTs
(Rs. Lakh) Year 2008-09 Year 2009-10
S. No
States Central Allocation
Total available
fund
Expendi-ture
(5)/(4) (%)
Central Allocation
Total available
fund
Expendi-ture
(9)/(8) (%)
(1) (2) (3) (4) (5) (6) (7) (8) (9) (10)
1 Andhra Pradesh 308894 357653 296390 82.87 321278 461473 450918 97.71
2 Bihar 129681 209489 131526 62.78 88817 221359 181688 82.08
3 Chhattisgarh 163217 197352 143442 72.68 81489 161707 130374 80.62
4 Goa 468 533 239 44.84 0 870 450 51.67
5 Gujarat 16516 28224 19615 69.50 74078 94490 73975 78.29
6 Haryana 13257 16033 10987 68.53 11879 18934 14356 75.82
7 Himachal Pradesh 40940 50090 33228 66.34 37512 60278 55656 92.33
8 Jharkhand 176393 232189 133800 57.63 80394 191629 137970 72.00
9 Karnataka 37939 64245 35787 55.70 167237 233203 281653 120.78
10 Kerala 19887 29662 22452 75.69 46771 58769 47185 80.29
11 Madhya Pradesh 383027 484397 355167 73.32 376969 591266 377972 63.93
12 Maharashtra 21592 63809 34943 54.76 22977 61787 32086 51.93
13 Orissa 76297 100807 58781 58.31 46874 99979 93274 93.29
14 Punjab 6758 11267 7180 63.72 14108 20405 14872 72.88
15 Rajasthan 622972 695373 616440 88.65 492582 716652 619110 86.39
16 Tamilnadu 140127 179459 100404 55.95 137119 241256 176123 73.00
17 Uttar Pradesh 381142 458445 358282 78.15 500678 682059 590604 86.59
18 Uttarakhand 12086 17536 13579 77.44 26930 34881 28309 81.16
19 West Bengal 86039 125786 92362 73.43 172561 234695 209422 89.23
20 A&N Island 709 1564 328 20.94 153 1516 1226 80.90
21 D&N Haveli Neg. 2 1 65.61 39 197 134 67.97
22 Daman & Diu 0 0 0 0.00 0 0 0 0.00
23 Lakshadweep 262 435 179 41.06 0 262 201 76.87
24 Puducherry 243 793 136 17.16 380 1020 727 71.23
Total 2638446 3325144 2465247 74.14 2627490 4188688 3518284 83.99
Source: Ministry of Rural Development, Government of India, New Delhi
7
Quarterly Releases under NREGA, 2008-09
0%
10%
20%
30%
40%
50%
60%
70%
80%
90%
100%
ANDHRA PRADESH
BIHAR
GOA
GUJARAT
HARYANA
HIMACHAL P
RADESH
KARNATAKA
KERALA
MADHYA PRADESH
MAHARASHTRA
ORISSA
PUNJAB
RAJASTHAN
TAMILNADU
UTTAR PRADESH
WEST BENGAL
UTTARANCHAL
CHHATTISGARH
JHARKHAND
Quarter 4Quarter 3Quarter 2Quarter1
Quarterly Releases under NREGA, 2009-10
0%
20%
40%
60%
80%
100%
ANDHRA PRADESH
BIHAR
GOA
GUJARAT
HARYANA
HIMACHAL P
RADESH
KARNATAKA
KERALA
MADHYA PRADESH
MAHARASHTRA
ORISSA
PUNJAB
RAJASTHAN
TAMILNADU
UTTAR PRADESH
WEST BENGAL
UTTARANCHAL
CHHATTISGARH
JHARKHAND
Quarter 4Quarter 3Quarter 2Quarter1
States like Andhra Pradesh, Rajasthan, Uttar Pradesh, Uttarakhand, and West
Bengal exhibit high levels of utilisation in both the years. In the case of some of the
states like Bihar, Chhattisgarh, Gujarat, Haryana, Himachal Pradesh, Karnataka, and
Orissa, utilisation of available funds during the year 2009-10 improved vastly as
compared to the earlier year 2008-09. A few states like Goa, Maharashtra, and
Tamilnadu have been spending much below the national average. As the scheme is
basically demand driven, while the relatively high per capita income and low poverty
level in Goa may explain the lukewarm performance in Goa to some extent, the low
utilisation in Maharashtra in both years does not admit of such an explanation, given
the relatively high incidence of poverty in the state.
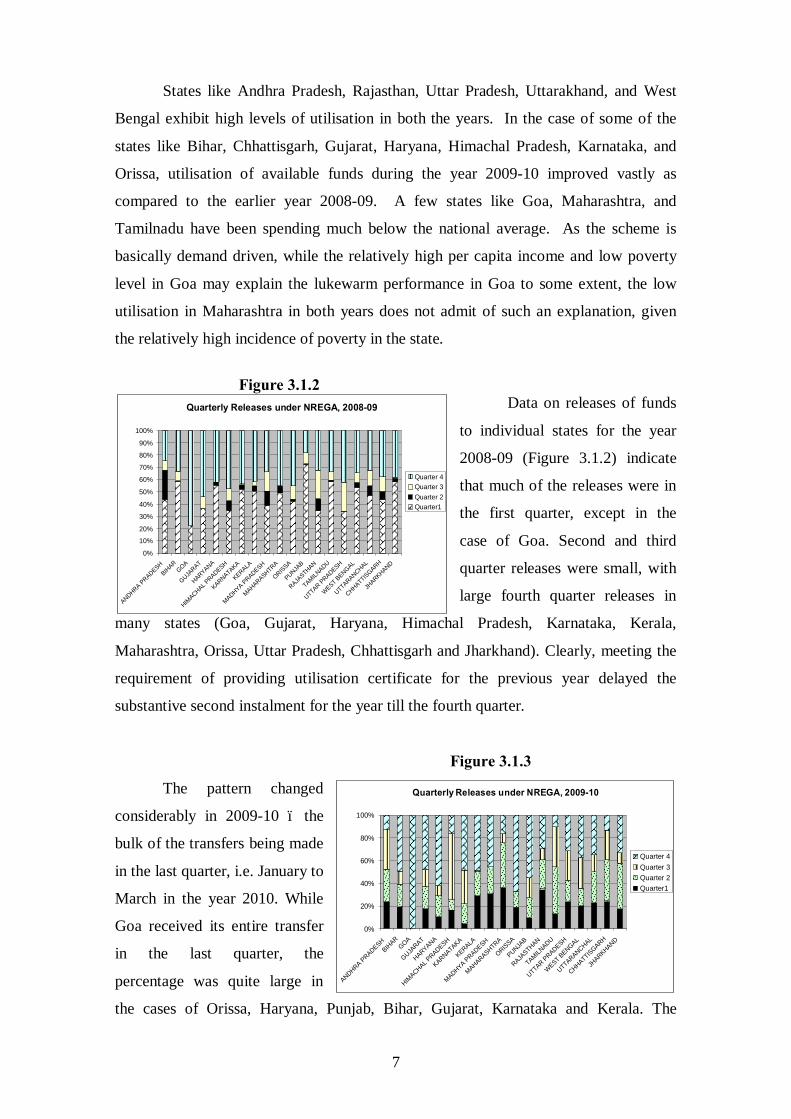
Figure 3.1.2
Data on releases of funds
to individual states for the year
2008-09 (Figure 3.1.2) indicate
that much of the releases were in
the first quarter, except in the
case of Goa. Second and third
quarter releases were small, with
large fourth quarter releases in
many states (Goa, Gujarat, Haryana, Himachal Pradesh, Karnataka, Kerala,
Maharashtra, Orissa, Uttar Pradesh, Chhattisgarh and Jharkhand). Clearly, meeting the
requirement of providing utilisation certificate for the previous year delayed the
substantive second instalment for the year till the fourth quarter.
Figure 3.1.3
The pattern changed
considerably in 2009-10 – the
bulk of the transfers being made
in the last quarter, i.e. January to
March in the year 2010. While
Goa received its entire transfer
in the last quarter, the
percentage was quite large in
the cases of Orissa, Haryana, Punjab, Bihar, Gujarat, Karnataka and Kerala. The
8
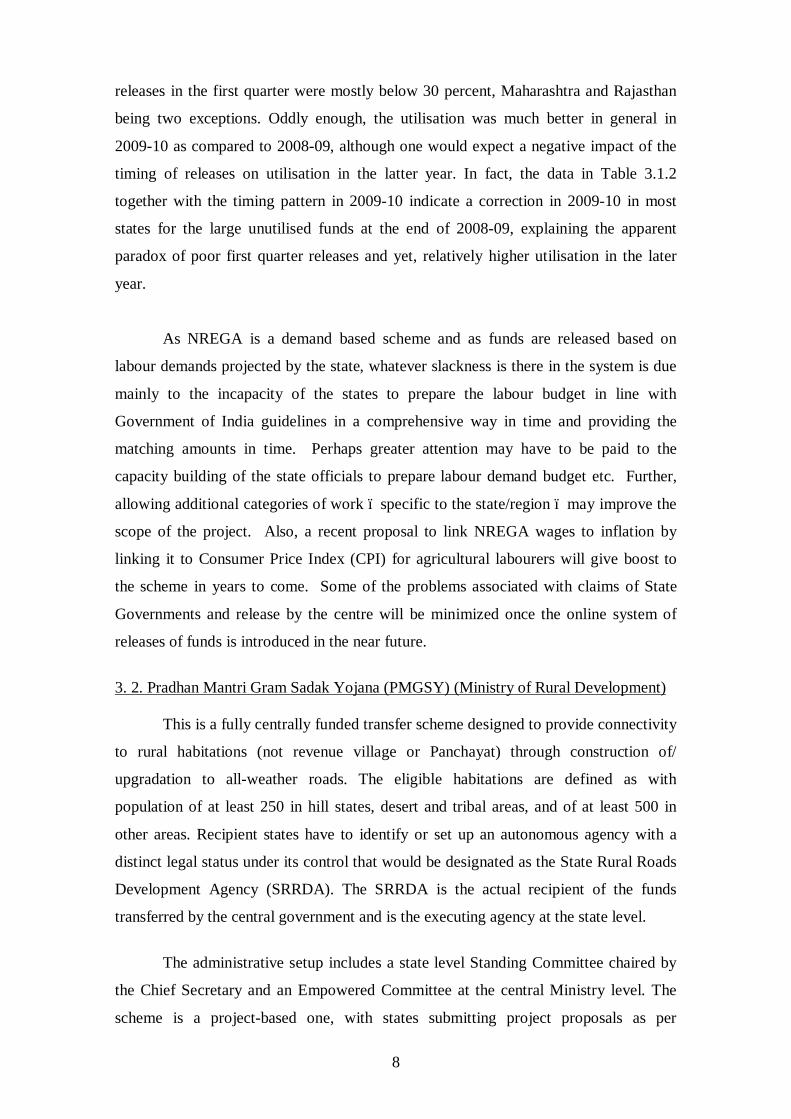
releases in the first quarter were mostly below 30 percent, Maharashtra and Rajasthan
being two exceptions. Oddly enough, the utilisation was much better in general in
2009-10 as compared to 2008-09, although one would expect a negative impact of the
timing of releases on utilisation in the latter year. In fact, the data in Table 3.1.2
together with the timing pattern in 2009-10 indicate a correction in 2009-10 in most
states for the large unutilised funds at the end of 2008-09, explaining the apparent
paradox of poor first quarter releases and yet, relatively higher utilisation in the later
year.
As NREGA is a demand based scheme and as funds are released based on
labour demands projected by the state, whatever slackness is there in the system is due
mainly to the incapacity of the states to prepare the labour budget in line with
Government of India guidelines in a comprehensive way in time and providing the
matching amounts in time. Perhaps greater attention may have to be paid to the
capacity building of the state officials to prepare labour demand budget etc. Further,
allowing additional categories of work – specific to the state/region – may improve the
scope of the project. Also, a recent proposal to link NREGA wages to inflation by
linking it to Consumer Price Index (CPI) for agricultural labourers will give boost to
the scheme in years to come. Some of the problems associated with claims of State
Governments and release by the centre will be minimized once the online system of
releases of funds is introduced in the near future.
3. 2. Pradhan Mantri Gram Sadak Yojana (PMGSY) (Ministry of Rural Development) This is a fully centrally funded transfer scheme designed to provide connectivity
to rural habitations (not revenue village or Panchayat) through construction of/
upgradation to all-weather roads. The eligible habitations are defined as with
population of at least 250 in hill states, desert and tribal areas, and of at least 500 in
other areas. Recipient states have to identify or set up an autonomous agency with a
distinct legal status under its control that would be designated as the State Rural Roads
Development Agency (SRRDA). The SRRDA is the actual recipient of the funds
transferred by the central government and is the executing agency at the state level.
The administrative setup includes a state level Standing Committee chaired by
the Chief Secretary and an Empowered Committee at the central Ministry level. The
scheme is a project-based one, with states submitting project proposals as per
9
guidelines and vetted by the Standing Committee, and approved by the Empowered
Committee. PMGSY is funded mainly from the accruals of diesel cess in the Central
Road Fund – 50 percent share of the cess on High Speed Diesel. The allocation of the
original Re. 1/- per litre cess to the states/Union Territories is based on, inter alia, a
weightage of 75 percent for ‘Need’ (share of unconnected habitations in the total
unconnected habitations of the country) and 25 percent for ‘Coverage’ (share of
connected habitations in the total connected habitations of the country). From the year
2003-04, the cess on HSD was hiked by 0.50 per litre. 50 percent of the additional
diesel cess had been made available from 2005-06 onwards. The distribution of
additional cess of Rs. 0.50 per litre is being targeted to the states primarily on the basis
of proportion of road length to be covered under Bharat Nirman Programmes. The state
government has the responsibility of providing funds for the proper functioning of the
SRRDA, funds for administration of maintenance contracts of PMGSY roads, funds to
meet works related expenses not found eligible to be funded by the Ministry under the
PMGSY, and to meet cost escalation, tender premium and other programme expenses.
The transfers are made available to the SRRDAs normally in two instalments.
However, the entire annual assistance may be provided in a single tranche for some
specified districts (Lahaul-Spiti, Leh and Kargil). Otherwise, the first instalment
amounts to 50 percent of the cleared value of projects or annual allocation, whichever
is lower. Apart from meeting the general conditionalities of the programme, the release
of the first instalment does not have any prerequisite. However, for single tranche
releases and for the second instalment, several conditions regarding utilisation of
available funds, physical progress, utilisation certificates, audited statement of accounts
for the previous year (if the second instalment is after October), and certificate of the
Bank Manager (where relevant accounts are maintained) have to be met. The second
instalment is normally equal to the balance due on the approved cost of awarded works.
Works cleared but not awarded by the time the second instalment is provided are
considered as lapsed. Given the above, the transfers should be substantially front-
loaded, i.e. bulk of the transfers should be at the beginning of the year. The
conditionalities are by no means excessive and constitute normal precautions to prevent
undue accumulation of funds at the state level and to ensure proper utilisation for the
intended purposes.
10
3.2.1 Utilisation in Selected States
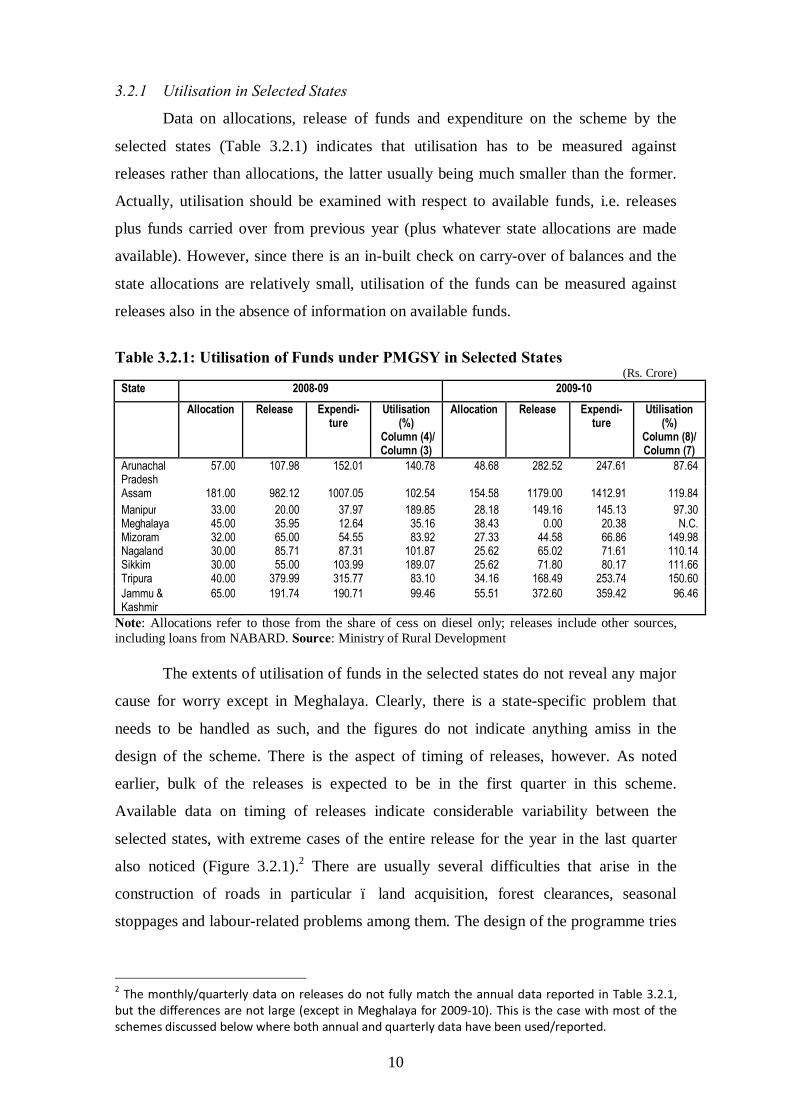
Data on allocations, release of funds and expenditure on the scheme by the
selected states (Table 3.2.1) indicates that utilisation has to be measured against
releases rather than allocations, the latter usually being much smaller than the former.
Actually, utilisation should be examined with respect to available funds, i.e. releases
plus funds carried over from previous year (plus whatever state allocations are made
available). However, since there is an in-built check on carry-over of balances and the
state allocations are relatively small, utilisation of the funds can be measured against
releases also in the absence of information on available funds.
Table 3.2.1: Utilisation of Funds under PMGSY in Selected States
(Rs. Crore) State 2008-09 2009-10 Allocation Release Expendi-
ture Utilisation
(%) Column (4)/ Column (3)
Allocation Release Expendi-ture
Utilisation (%)
Column (8)/ Column (7)
Arunachal Pradesh
57.00 107.98 152.01 140.78 48.68 282.52 247.61 87.64
Assam 181.00 982.12 1007.05 102.54 154.58 1179.00 1412.91 119.84 Manipur 33.00 20.00 37.97 189.85 28.18 149.16 145.13 97.30 Meghalaya 45.00 35.95 12.64 35.16 38.43 0.00 20.38 N.C. Mizoram 32.00 65.00 54.55 83.92 27.33 44.58 66.86 149.98 Nagaland 30.00 85.71 87.31 101.87 25.62 65.02 71.61 110.14 Sikkim 30.00 55.00 103.99 189.07 25.62 71.80 80.17 111.66 Tripura 40.00 379.99 315.77 83.10 34.16 168.49 253.74 150.60 Jammu & Kashmir
65.00 191.74 190.71 99.46 55.51 372.60 359.42 96.46
Note: Allocations refer to those from the share of cess on diesel only; releases include other sources, including loans from NABARD. Source: Ministry of Rural Development The extents of utilisation of funds in the selected states do not reveal any major
cause for worry except in Meghalaya. Clearly, there is a state-specific problem that
needs to be handled as such, and the figures do not indicate anything amiss in the
design of the scheme. There is the aspect of timing of releases, however. As noted
earlier, bulk of the releases is expected to be in the first quarter in this scheme.
Available data on timing of releases indicate considerable variability between the
selected states, with extreme cases of the entire release for the year in the last quarter
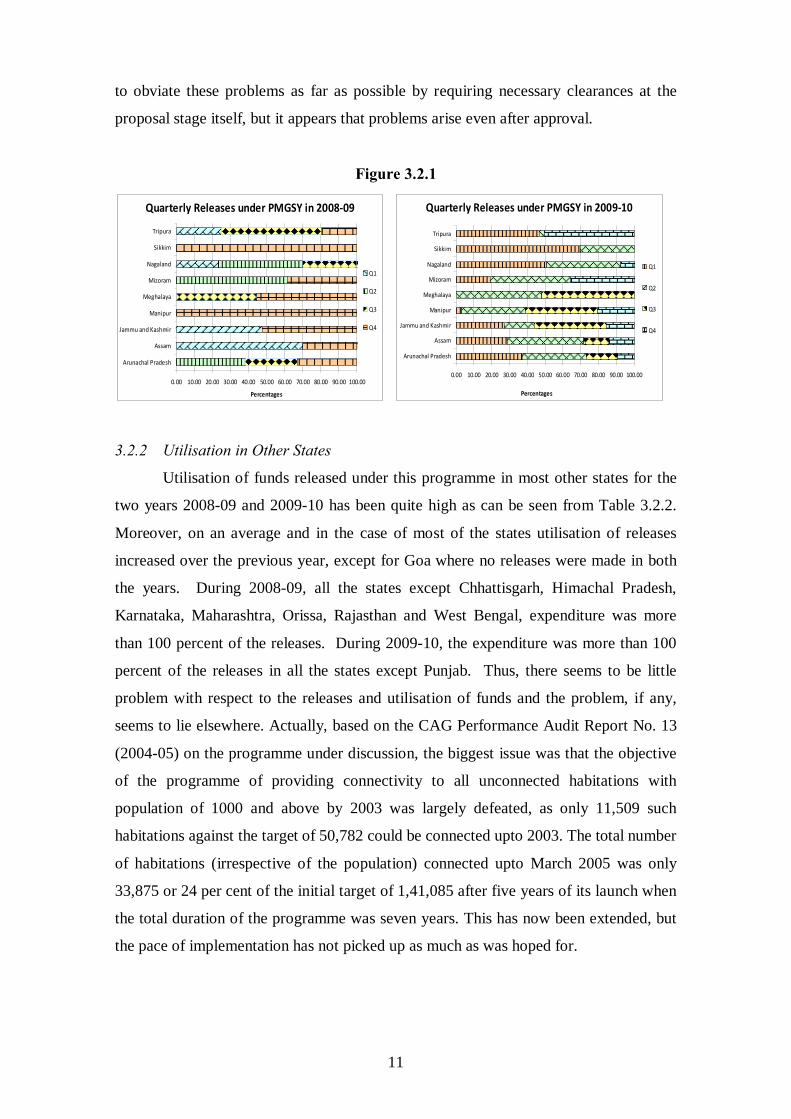
also noticed (Figure 3.2.1).2 There are usually several difficulties that arise in the
construction of roads in particular – land acquisition, forest clearances, seasonal
stoppages and labour-related problems among them. The design of the programme tries
2 The monthly/quarterly data on releases do not fully match the annual data reported in Table 3.2.1, but the differences are not large (except in Meghalaya for 2009-10). This is the case with most of the schemes discussed below where both annual and quarterly data have been used/reported.
11
to obviate these problems as far as possible by requiring necessary clearances at the
proposal stage itself, but it appears that problems arise even after approval.
Figure 3.2.1
Quarterly Releases under PMGSY in 2008-09
0.00 10.00 20.00 30.00 40.00 50.00 60.00 70.00 80.00 90.00 100.00
Arunachal Pradesh
Assam
Jammu and Kashmir
Manipur
Meghalaya
Mizoram
Nagaland
Sikkim
Tripura
Percentages
Q1
Q2
Q3
Q4
Quarterly Releases under PMGSY in 2009-10
0.00 10.00 20.00 30.00 40.00 50.00 60.00 70.00 80.00 90.00 100.00
Arunachal Pradesh
Assam
Jammu and Kashmir
Manipur
Meghalaya
Mizoram
Nagaland
Sikkim
Tripura
Percentages
Q1
Q2
Q3
Q4
3.2.2 Utilisation in Other States
Utilisation of funds released under this programme in most other states for the
two years 2008-09 and 2009-10 has been quite high as can be seen from Table 3.2.2.
Moreover, on an average and in the case of most of the states utilisation of releases
increased over the previous year, except for Goa where no releases were made in both
the years. During 2008-09, all the states except Chhattisgarh, Himachal Pradesh,
Karnataka, Maharashtra, Orissa, Rajasthan and West Bengal, expenditure was more
than 100 percent of the releases. During 2009-10, the expenditure was more than 100
percent of the releases in all the states except Punjab. Thus, there seems to be little
problem with respect to the releases and utilisation of funds and the problem, if any,
seems to lie elsewhere. Actually, based on the CAG Performance Audit Report No. 13
(2004-05) on the programme under discussion, the biggest issue was that the objective
of the programme of providing connectivity to all unconnected habitations with
population of 1000 and above by 2003 was largely defeated, as only 11,509 such
habitations against the target of 50,782 could be connected upto 2003. The total number
of habitations (irrespective of the population) connected upto March 2005 was only
33,875 or 24 per cent of the initial target of 1,41,085 after five years of its launch when
the total duration of the programme was seven years. This has now been extended, but
the pace of implementation has not picked up as much as was hoped for.
12
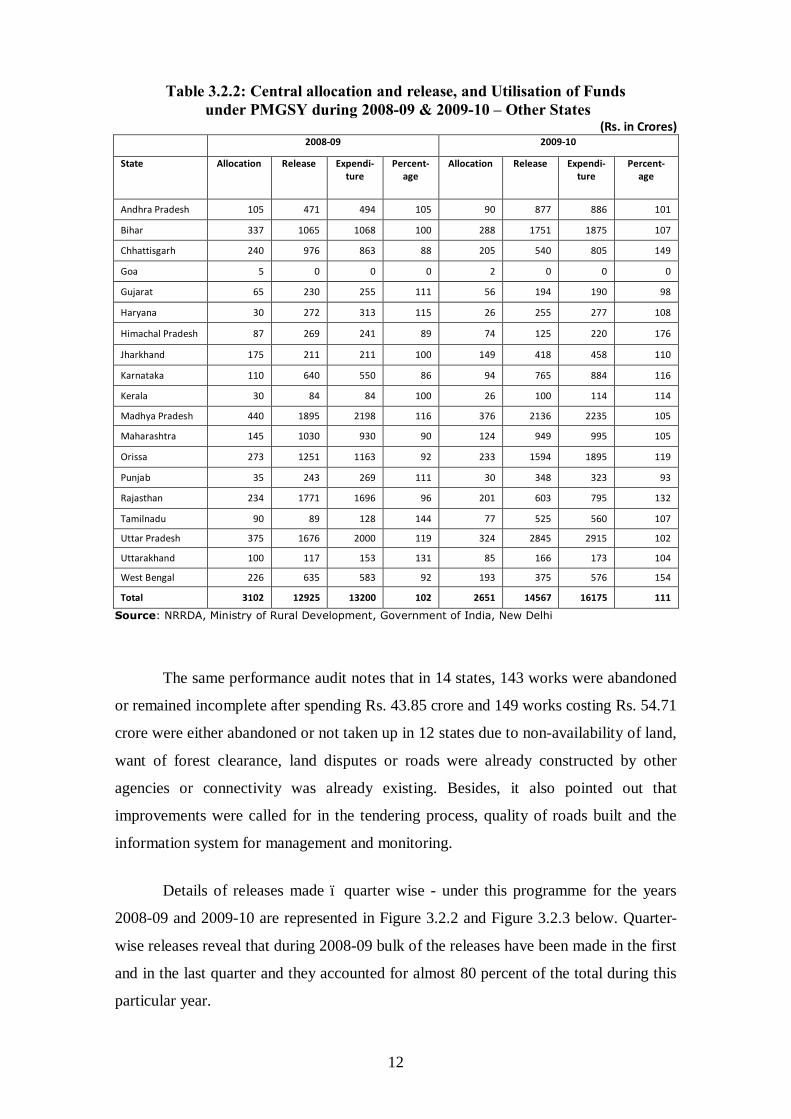
Table 3.2.2: Central allocation and release, and Utilisation of Funds under PMGSY during 2008-09 & 2009-10 – Other States
(Rs. in Crores)
2008-09 2009-10
State Allocation Release Expendi-ture
Percent- age
Allocation Release Expendi- ture
Percent- age
Andhra Pradesh 105 471 494 105 90 877 886 101
Bihar 337 1065 1068 100 288 1751 1875 107
Chhattisgarh 240 976 863 88 205 540 805 149
Goa 5 0 0 0 2 0 0 0
Gujarat 65 230 255 111 56 194 190 98
Haryana 30 272 313 115 26 255 277 108
Himachal Pradesh 87 269 241 89 74 125 220 176
Jharkhand 175 211 211 100 149 418 458 110
Karnataka 110 640 550 86 94 765 884 116
Kerala 30 84 84 100 26 100 114 114
Madhya Pradesh 440 1895 2198 116 376 2136 2235 105
Maharashtra 145 1030 930 90 124 949 995 105
Orissa 273 1251 1163 92 233 1594 1895 119
Punjab 35 243 269 111 30 348 323 93
Rajasthan 234 1771 1696 96 201 603 795 132
Tamilnadu 90 89 128 144 77 525 560 107
Uttar Pradesh 375 1676 2000 119 324 2845 2915 102
Uttarakhand 100 117 153 131 85 166 173 104
West Bengal 226 635 583 92 193 375 576 154
Total 3102 12925 13200 102 2651 14567 16175 111
Source: NRRDA, Ministry of Rural Development, Government of India, New Delhi
The same performance audit notes that in 14 states, 143 works were abandoned
or remained incomplete after spending Rs. 43.85 crore and 149 works costing Rs. 54.71
crore were either abandoned or not taken up in 12 states due to non-availability of land,
want of forest clearance, land disputes or roads were already constructed by other
agencies or connectivity was already existing. Besides, it also pointed out that
improvements were called for in the tendering process, quality of roads built and the
information system for management and monitoring.
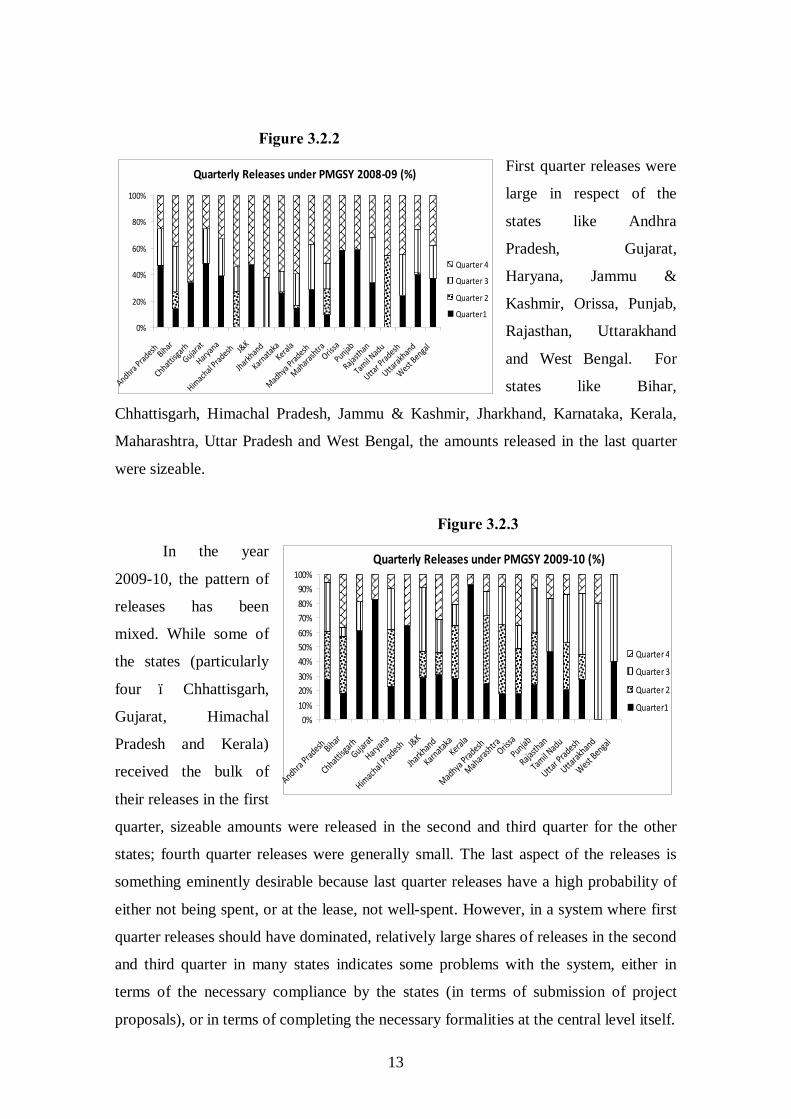
Details of releases made – quarter wise - under this programme for the years
2008-09 and 2009-10 are represented in Figure 3.2.2 and Figure 3.2.3 below. Quarter-
wise releases reveal that during 2008-09 bulk of the releases have been made in the first
and in the last quarter and they accounted for almost 80 percent of the total during this
particular year.
13
Quarterly Releases under PMGSY 2008-09 (%)
0%
20%
40%
60%
80%
100%
Andhra Prad
esh Bihar
Chhattisg
arhGujar
at
Haryan
a
Himach
al Prad
esh J&K
Jharkhan
d
Karnata
kaKeral
a
Madhya
Pradesh
Mahara
shtraOriss
aPunjab
Rajasth
an
Tamil N
adu
Uttar P
radesh
Uttarak
hand
West Bengal
Quarter 4
Quarter 3
Quarter 2
Quarter1
Quarterly Releases under PMGSY 2009-10 (%)
0%10%20%30%40%50%60%70%80%90%
100%
Andhra Prad
esh Bihar
Chhattisg
arhGujar
at
Haryana
Himachal P
radesh J&K
Jharkhand
Karnata
kaKeral
a
Madhya Prad
esh
MaharashtraOriss
aPunjab
Rajasth
an
Tamil N
adu
Uttar P
radesh
Uttarak
hand
West Bengal
Quarter 4
Quarter 3
Quarter 2
Quarter1
Figure 3.2.2
First quarter releases were
large in respect of the
states like Andhra
Pradesh, Gujarat,
Haryana, Jammu &
Kashmir, Orissa, Punjab,
Rajasthan, Uttarakhand
and West Bengal. For
states like Bihar,
Chhattisgarh, Himachal Pradesh, Jammu & Kashmir, Jharkhand, Karnataka, Kerala,
Maharashtra, Uttar Pradesh and West Bengal, the amounts released in the last quarter
were sizeable.
Figure 3.2.3
In the year
2009-10, the pattern of
releases has been
mixed. While some of
the states (particularly
four – Chhattisgarh,
Gujarat, Himachal
Pradesh and Kerala)
received the bulk of
their releases in the first
quarter, sizeable amounts were released in the second and third quarter for the other
states; fourth quarter releases were generally small. The last aspect of the releases is
something eminently desirable because last quarter releases have a high probability of
either not being spent, or at the lease, not well-spent. However, in a system where first
quarter releases should have dominated, relatively large shares of releases in the second
and third quarter in many states indicates some problems with the system, either in
terms of the necessary compliance by the states (in terms of submission of project
proposals), or in terms of completing the necessary formalities at the central level itself.
14
3.3. Indira Awaas Yojana (IAY) (Ministry of Rural Development) IAY, the scheme for construction and upgradation of houses for the rural poor
with special focus on SC/ST, is a cost-shared scheme between the centre and the states
in the ratio of 75:25 (90:10 for the North-Eastern states and Sikkim). It is implemented
through the District Panchayat or District Rural Development Agency (DRDA), and
central funds are made available directly to the district-level agencies. It is designed to
provide cash assistance and a (optional) loan at a low rate of interest to each of the
beneficiaries. This is primarily an allocation-based scheme, with state shares
determined by the factors of rural housing deficit (75 percent weight) and poverty ratio
(25 percent weight). Intra-state allocation by districts is based on housing deficit with
the same weight and SC/ST population (25 percent weight). Allocations below the
district level are also determined on the basis of the same set of factors. The
beneficiaries receive the assistance on a staggered basis linked to progress of
construction.
The centre releases the assistance allocated to the district level agencies in two
instalments except in the cases of districts with special problems like limited working
season; in the latter cases, the entire annual assistance is released in one go. Single
instalment releases are conditional upon at least 60 percent utilisation of available
funds in the previous year, actual disbursement of the state share in the previous year,
audited accounts for the year before last, bank reconciliation statements, and block-
wise expenditure statements (or certificate from a Chartered Accountant that funds are
directly transferred to beneficiaries’ bank accounts from the DRDA). In other cases, 50
percent of the annual allocation is released in the first instalment provided conditions
imposed while releasing second instalment of the previous year, if any, are met.
Though the assistance to districts is based on allocations, the release of the second
instalment is conditional upon a proposal for the same and fulfilment of several other
conditions including at least 60 percent utilisation of total available funds, full release
of state share in the previous years and due for the current year to date, appropriate
budget allocation in the current year for the matching state share, submission of audit
report for the last year along with action taken report, utilisation certificates for the
previous year, approved Annual Plan and all pending progress/monitoring reports. The
15
proposals have to be submitted latest by December 31 every year. Late submission
invites progressive cuts in allocated amount.
The provisions summarised above indicate that the conditions imposed are
primarily at the time of the second instalment and hence there ought to be little delay in
releasing the first instalment. However, in the cases where the decentralised system is
fully articulated, the sheer number of agencies involved increases the probability of
default in providing some document or the other, which can hold up the proposals.
Block-wise expenditure statements are called for, but it is an enormous task to actually
sift through this large number of statements with any degree of necessary attention at
the central level. Some of these requirements may perhaps be curtailed and the task of
monitoring may also be decentralised to some extent.
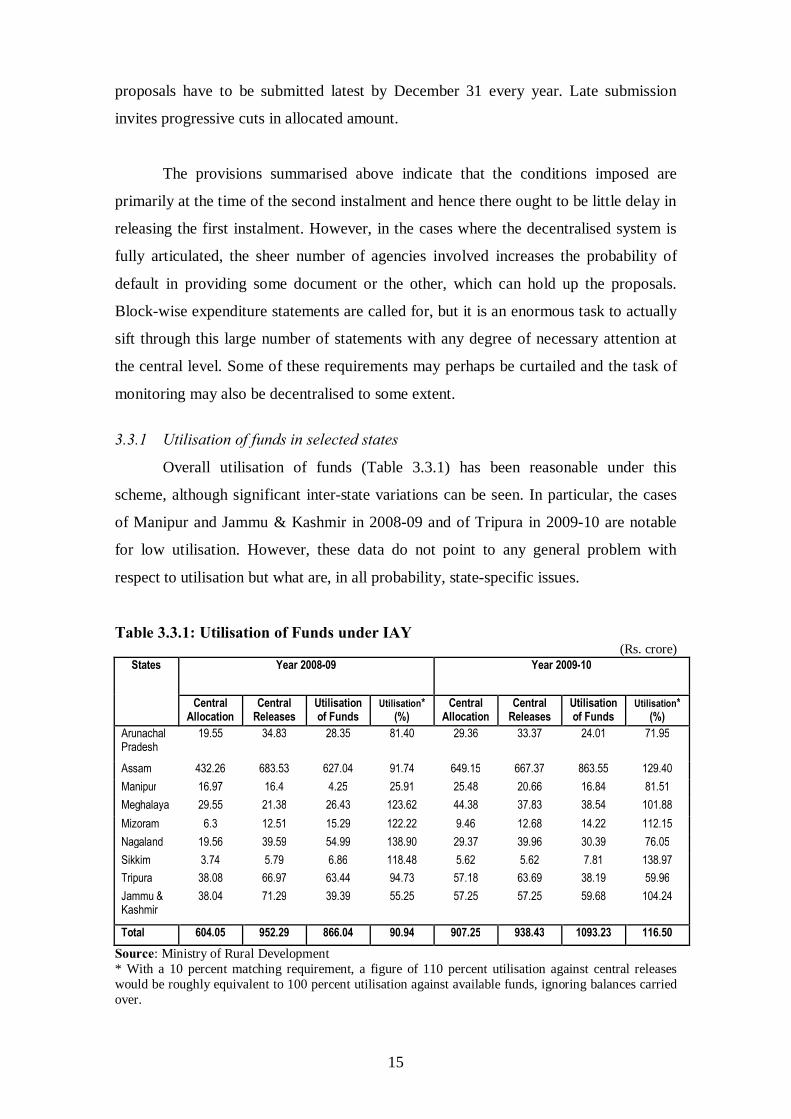
3.3.1 Utilisation of funds in selected states
Overall utilisation of funds (Table 3.3.1) has been reasonable under this
scheme, although significant inter-state variations can be seen. In particular, the cases
of Manipur and Jammu & Kashmir in 2008-09 and of Tripura in 2009-10 are notable
for low utilisation. However, these data do not point to any general problem with
respect to utilisation but what are, in all probability, state-specific issues.
Table 3.3.1: Utilisation of Funds under IAY (Rs. crore)
States
Year 2008-09 Year 2009-10
Central Allocation
Central Releases
Utilisation of Funds
Utilisation* (%)
Central Allocation
Central Releases
Utilisation of Funds
Utilisation* (%)
Arunachal Pradesh
19.55 34.83 28.35 81.40 29.36 33.37 24.01 71.95
Assam 432.26 683.53 627.04 91.74 649.15 667.37 863.55 129.40 Manipur 16.97 16.4 4.25 25.91 25.48 20.66 16.84 81.51 Meghalaya 29.55 21.38 26.43 123.62 44.38 37.83 38.54 101.88 Mizoram 6.3 12.51 15.29 122.22 9.46 12.68 14.22 112.15 Nagaland 19.56 39.59 54.99 138.90 29.37 39.96 30.39 76.05 Sikkim 3.74 5.79 6.86 118.48 5.62 5.62 7.81 138.97 Tripura 38.08 66.97 63.44 94.73 57.18 63.69 38.19 59.96 Jammu & Kashmir
38.04 71.29 39.39 55.25 57.25 57.25 59.68 104.24
Total 604.05 952.29 866.04 90.94 907.25 938.43 1093.23 116.50 Source: Ministry of Rural Development * With a 10 percent matching requirement, a figure of 110 percent utilisation against central releases would be roughly equivalent to 100 percent utilisation against available funds, ignoring balances carried over.
16
Figure 3.3.1
0.00 20.00 40.00 60.00 80.00 100.00
Arunachal Pradesh
Assam
Jammu and Kashmir
Manipur
Meghalaya
Mizoram
Nagaland
Sikkim
Tripura
Quarterly Releases under IAY 2008-09 (%)
Q1
Q2
Q3
Q4
0.00 20.00 40.00 60.00 80.00 100.00
Arunachal PradeshAssam
Jammu and KashmirManipur
MeghalayaMizoram
NagalandSikkimTripura
Quarterly Releases under IAY 2009-10 (%)
Q1
Q2
Q3
Q4
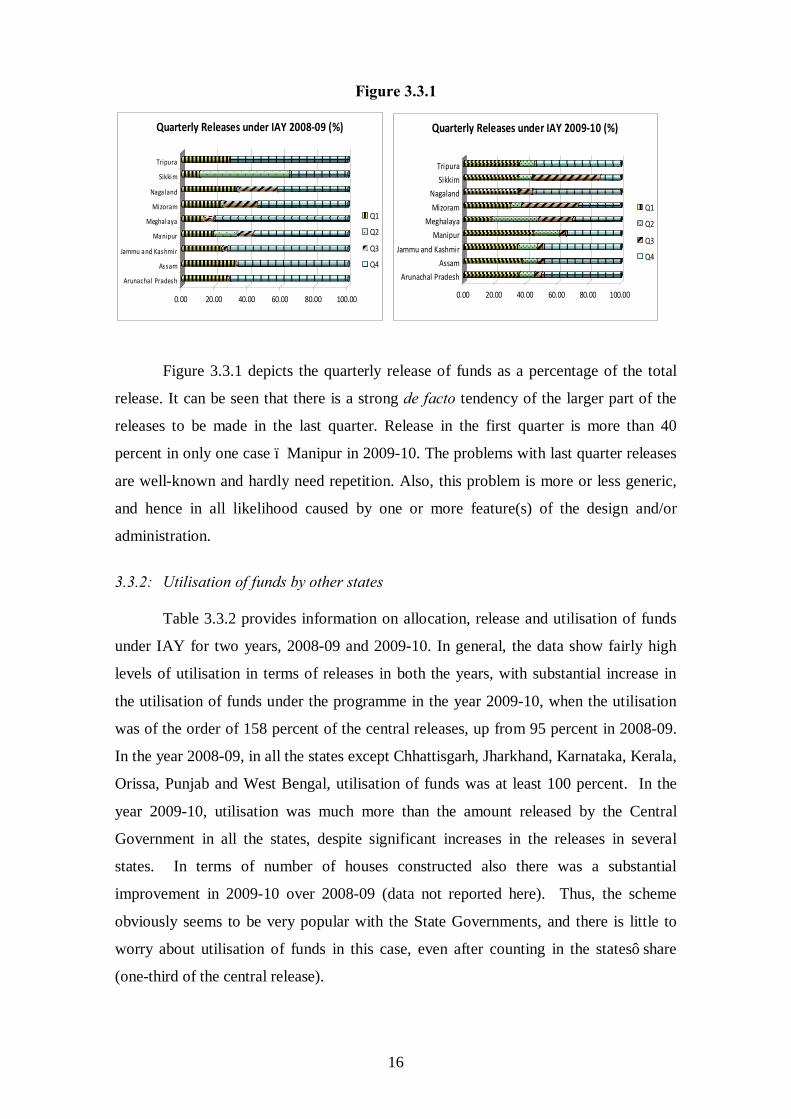
Figure 3.3.1 depicts the quarterly release of funds as a percentage of the total
release. It can be seen that there is a strong de facto tendency of the larger part of the
releases to be made in the last quarter. Release in the first quarter is more than 40
percent in only one case – Manipur in 2009-10. The problems with last quarter releases
are well-known and hardly need repetition. Also, this problem is more or less generic,
and hence in all likelihood caused by one or more feature(s) of the design and/or
administration.
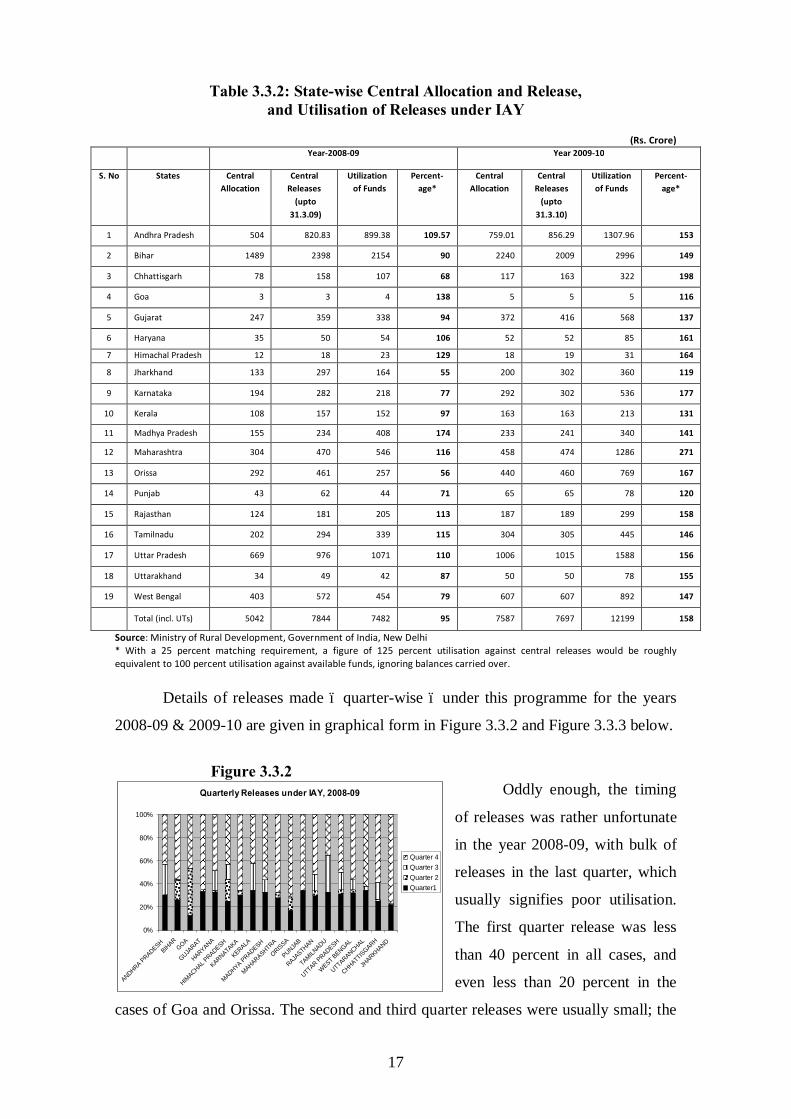
3.3.2: Utilisation of funds by other states Table 3.3.2 provides information on allocation, release and utilisation of funds
under IAY for two years, 2008-09 and 2009-10. In general, the data show fairly high
levels of utilisation in terms of releases in both the years, with substantial increase in
the utilisation of funds under the programme in the year 2009-10, when the utilisation
was of the order of 158 percent of the central releases, up from 95 percent in 2008-09.
In the year 2008-09, in all the states except Chhattisgarh, Jharkhand, Karnataka, Kerala,
Orissa, Punjab and West Bengal, utilisation of funds was at least 100 percent. In the
year 2009-10, utilisation was much more than the amount released by the Central
Government in all the states, despite significant increases in the releases in several
states. In terms of number of houses constructed also there was a substantial
improvement in 2009-10 over 2008-09 (data not reported here). Thus, the scheme
obviously seems to be very popular with the State Governments, and there is little to
worry about utilisation of funds in this case, even after counting in the states’ share
(one-third of the central release).
17
Quarterly Releases under IAY, 2008-09
0%
20%
40%
60%
80%
100%
ANDHRA PRADESH
BIHAR
GOA
GUJARAT
HARYANA
HIMACHAL P
RADESH
KARNATAKA
KERALA
MADHYA PRADESH
MAHARASHTRA
ORISSA
PUNJAB
RAJASTHAN
TAMILNADU
UTTAR PRADESH
WEST BENGAL
UTTARANCHAL
CHHATTISGARH
JHARKHAND
Quarter 4Quarter 3Quarter 2Quarter1
Table 3.3.2: State-wise Central Allocation and Release, and Utilisation of Releases under IAY
(Rs. Crore)
Year-2008-09 Year 2009-10
S. No States Central Allocation
Central Releases
(upto 31.3.09)
Utilization of Funds
Percent- age*
Central Allocation
Central Releases
(upto 31.3.10)
Utilization of Funds
Percent- age*
1 Andhra Pradesh 504 820.83 899.38 109.57 759.01 856.29 1307.96 153
2 Bihar 1489 2398 2154 90 2240 2009 2996 149
3 Chhattisgarh 78 158 107 68 117 163 322 198
4 Goa 3 3 4 138 5 5 5 116
5 Gujarat 247 359 338 94 372 416 568 137
6 Haryana 35 50 54 106 52 52 85 161
7 Himachal Pradesh 12 18 23 129 18 19 31 164
8 Jharkhand 133 297 164 55 200 302 360 119
9 Karnataka 194 282 218 77 292 302 536 177
10 Kerala 108 157 152 97 163 163 213 131
11 Madhya Pradesh 155 234 408 174 233 241 340 141
12 Maharashtra 304 470 546 116 458 474 1286 271
13 Orissa 292 461 257 56 440 460 769 167
14 Punjab 43 62 44 71 65 65 78 120
15 Rajasthan 124 181 205 113 187 189 299 158
16 Tamilnadu 202 294 339 115 304 305 445 146
17 Uttar Pradesh 669 976 1071 110 1006 1015 1588 156
18 Uttarakhand 34 49 42 87 50 50 78 155
19 West Bengal 403 572 454 79 607 607 892 147
Total (incl. UTs) 5042 7844 7482 95 7587 7697 12199 158
Source: Ministry of Rural Development, Government of India, New Delhi * With a 25 percent matching requirement, a figure of 125 percent utilisation against central releases would be roughly equivalent to 100 percent utilisation against available funds, ignoring balances carried over.
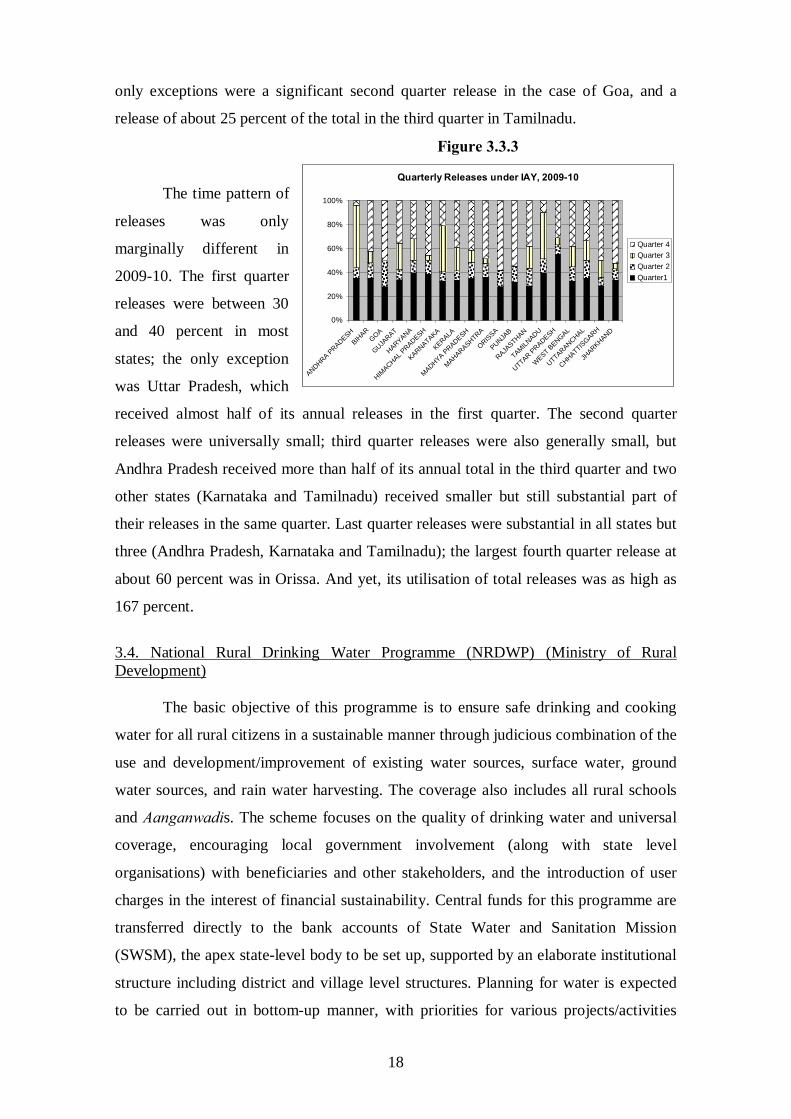
Details of releases made – quarter-wise – under this programme for the years
2008-09 & 2009-10 are given in graphical form in Figure 3.3.2 and Figure 3.3.3 below.
Figure 3.3.2
Oddly enough, the timing
of releases was rather unfortunate
in the year 2008-09, with bulk of
releases in the last quarter, which
usually signifies poor utilisation.
The first quarter release was less
than 40 percent in all cases, and
even less than 20 percent in the
cases of Goa and Orissa. The second and third quarter releases were usually small; the
18
Quarterly Releases under IAY, 2009-10
0%
20%
40%
60%
80%
100%
ANDHRA PRADESH
BIHAR
GOA
GUJARAT
HARYANA
HIMACHAL P
RADESH
KARNATAKA
KERALA
MADHYA PRADESH
MAHARASHTRA
ORISSA
PUNJAB
RAJASTHAN
TAMILNADU
UTTAR PRADESH
WEST B
ENGAL
UTTARANCHAL
CHHATTISGARH
JHARKHAND
Quarter 4Quarter 3Quarter 2Quarter1
only exceptions were a significant second quarter release in the case of Goa, and a
release of about 25 percent of the total in the third quarter in Tamilnadu.
Figure 3.3.3
The time pattern of
releases was only
marginally different in
2009-10. The first quarter
releases were between 30
and 40 percent in most
states; the only exception
was Uttar Pradesh, which
received almost half of its annual releases in the first quarter. The second quarter
releases were universally small; third quarter releases were also generally small, but
Andhra Pradesh received more than half of its annual total in the third quarter and two
other states (Karnataka and Tamilnadu) received smaller but still substantial part of
their releases in the same quarter. Last quarter releases were substantial in all states but
three (Andhra Pradesh, Karnataka and Tamilnadu); the largest fourth quarter release at
about 60 percent was in Orissa. And yet, its utilisation of total releases was as high as
167 percent.
3.4. National Rural Drinking Water Programme (NRDWP) (Ministry of Rural Development) The basic objective of this programme is to ensure safe drinking and cooking
water for all rural citizens in a sustainable manner through judicious combination of the
use and development/improvement of existing water sources, surface water, ground
water sources, and rain water harvesting. The coverage also includes all rural schools
and Aanganwadis. The scheme focuses on the quality of drinking water and universal
coverage, encouraging local government involvement (along with state level
organisations) with beneficiaries and other stakeholders, and the introduction of user
charges in the interest of financial sustainability. Central funds for this programme are
transferred directly to the bank accounts of State Water and Sanitation Mission
(SWSM), the apex state-level body to be set up, supported by an elaborate institutional
structure including district and village level structures. Planning for water is expected
to be carried out in bottom-up manner, with priorities for various projects/activities
19
suggested in the programme guidelines. Salient features of the financial aspects of the
programme are given in Table 3.4.1. The system of transfers is driven by the
allocations, and the state annual plan has to fit within the guidelines and the envelope
of available funds.
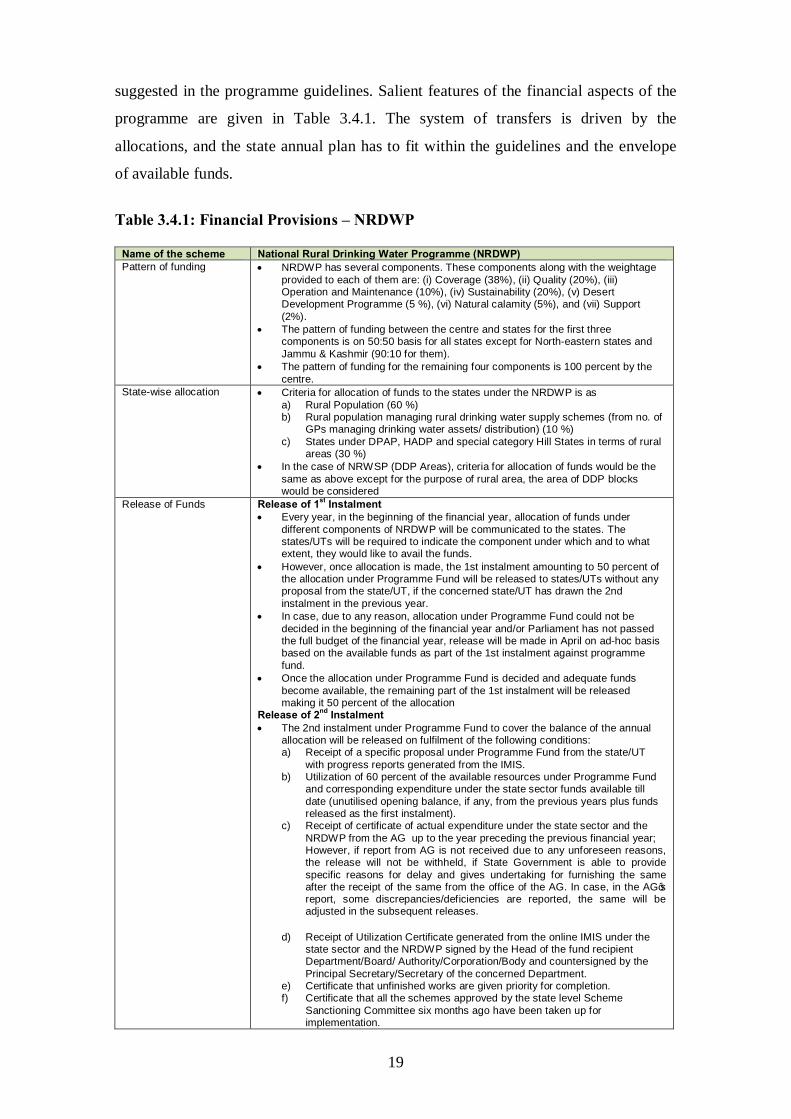
Table 3.4.1: Financial Provisions – NRDWP
Name of the scheme National Rural Drinking Water Programme (NRDWP) Pattern of funding • NRDWP has several components. These components along with the weightage
provided to each of them are: (i) Coverage (38%), (ii) Quality (20%), (iii) Operation and Maintenance (10%), (iv) Sustainability (20%), (v) Desert Development Programme (5 %), (vi) Natural calamity (5%), and (vii) Support (2%).
• The pattern of funding between the centre and states for the first three components is on 50:50 basis for all states except for North-eastern states and Jammu & Kashmir (90:10 for them).
• The pattern of funding for the remaining four components is 100 percent by the centre.
State-wise allocation • Criteria for allocation of funds to the states under the NRDWP is as a) Rural Population (60 %) b) Rural population managing rural drinking water supply schemes (from no. of
GPs managing drinking water assets/ distribution) (10 %) c) States under DPAP, HADP and special category Hill States in terms of rural
areas (30 %) • In the case of NRWSP (DDP Areas), criteria for allocation of funds would be the
same as above except for the purpose of rural area, the area of DDP blocks would be considered
Release of Funds Release of 1st Instalment • Every year, in the beginning of the financial year, allocation of funds under
different components of NRDWP will be communicated to the states. The states/UTs will be required to indicate the component under which and to what extent, they would like to avail the funds.
• However, once allocation is made, the 1st instalment amounting to 50 percent of the allocation under Programme Fund will be released to states/UTs without any proposal from the state/UT, if the concerned state/UT has drawn the 2nd instalment in the previous year.
• In case, due to any reason, allocation under Programme Fund could not be decided in the beginning of the financial year and/or Parliament has not passed the full budget of the financial year, release will be made in April on ad-hoc basis based on the available funds as part of the 1st instalment against programme fund.
• Once the allocation under Programme Fund is decided and adequate funds become available, the remaining part of the 1st instalment will be released making it 50 percent of the allocation
Release of 2nd Instalment • The 2nd instalment under Programme Fund to cover the balance of the annual
allocation will be released on fulfilment of the following conditions: a) Receipt of a specific proposal under Programme Fund from the state/UT
with progress reports generated from the IMIS. b) Utilization of 60 percent of the available resources under Programme Fund
and corresponding expenditure under the state sector funds available till date (unutilised opening balance, if any, from the previous years plus funds released as the first instalment).
c) Receipt of certificate of actual expenditure under the state sector and the NRDWP from the AG up to the year preceding the previous financial year; However, if report from AG is not received due to any unforeseen reasons, the release will not be withheld, if State Government is able to provide specific reasons for delay and gives undertaking for furnishing the same after the receipt of the same from the office of the AG. In case, in the AG’s report, some discrepancies/deficiencies are reported, the same will be adjusted in the subsequent releases.
d) Receipt of Utilization Certificate generated from the online IMIS under the state sector and the NRDWP signed by the Head of the fund recipient Department/Board/ Authority/Corporation/Body and countersigned by the Principal Secretary/Secretary of the concerned Department.
e) Certificate that unfinished works are given priority for completion. f) Certificate that all the schemes approved by the state level Scheme
Sanctioning Committee six months ago have been taken up for implementation.
20
Name of the scheme National Rural Drinking Water Programme (NRDWP) g) Proposal for release of the second instalment of funds under the
Programme Fund, complete in all respects as indicated above, should reach to the RGNDWM by the 31st December of the financial year. Proposals received after 31st December will be subjected to progressive cuts as indicated below: Month of receipt of proposal Cut on the total allocated amount
Up to December Nil
January 10%
February 20%
March 30%
• Support Fund which is 100 percent grant in aid, will also be released in two instalments based on certain criteria and release of 2nd instalment will be based on submission of activity-wise Physical and Financial progress and Utilization Certificate generated from the IMIS.
• The expenditure on O&M part of the fund should not exceed 10 percent of the total funds released in the previous year under NRDWP. Excess expenditure in the previous year, if any, will be deducted at the time of release of the 2nd instalment of funds;
• Funds will be released based on the specific proposals from the State Governments indicating the actual requirement during the remaining part of the year and utilization of prescribed percentage of funds already released.
• While releasing the central share, the quantum of unutilised funds available with the states/UTs in relation to the total allocation for the financial year will be kept in view.
• Carry over funds in the next financial year will be allowed to the extent of 10 percent of the total amount released.
• However, if any amount has been released in the month of March and or amount could not be transferred to the state/UT in the financial year, the same will not be accounted as carry forward amount.
• While releasing the second instalment, the excess amount over and above the prescribed limit, will be deducted. However, if the state/UT has utilized more than 75 percent of the total available fund in the current financial year, the excess carry over amount may not be deducted while releasing the 2nd instalment.
• The states/UTs shall release the entire amount of central allocation received along with the matching state share to the implementing agency (s) without any delay and in any case not later than 15 days after its receipt.
Utilisation certificate /audited statement of expenditure
• The SWSM will ensure that the accounts are audited by a CA approved by the CAG, within 6 months of the close of the financial year. This account will be supported by a statement of reconciliation with the accounts of PHED and a certificate of the CA on its accuracy.
• Additionally the works under this Programme would be subject to audit by the Office of the C&AG.
Source: Document on Framework for implementation of the programme 3.4.1 Utilisation in Selected States
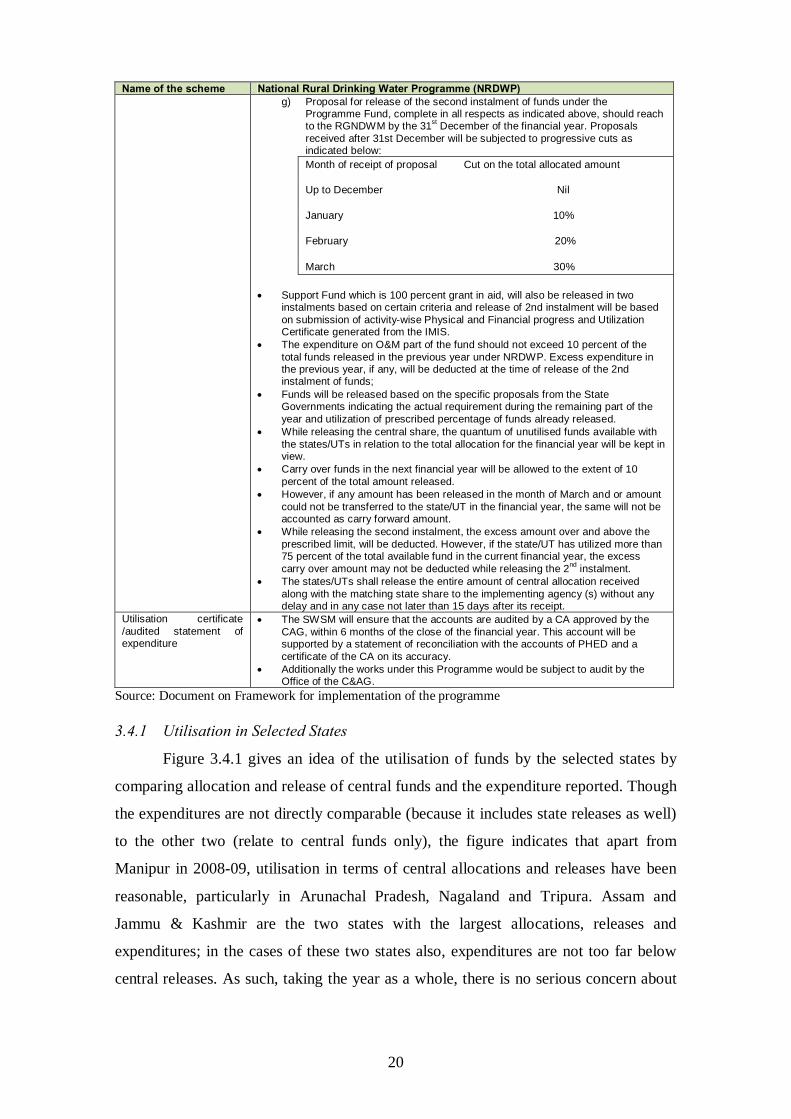
Figure 3.4.1 gives an idea of the utilisation of funds by the selected states by
comparing allocation and release of central funds and the expenditure reported. Though
the expenditures are not directly comparable (because it includes state releases as well)
to the other two (relate to central funds only), the figure indicates that apart from
Manipur in 2008-09, utilisation in terms of central allocations and releases have been
reasonable, particularly in Arunachal Pradesh, Nagaland and Tripura. Assam and
Jammu & Kashmir are the two states with the largest allocations, releases and
expenditures; in the cases of these two states also, expenditures are not too far below
central releases. As such, taking the year as a whole, there is no serious concern about
21
utilisation, unless state releases were relatively large in some or all of the selected
states.3
Figure 3.4.1
NRDWP - Allocation, Releases and Expenditures in 2008-09
050
100150200250300350400450
Arunachal P
radesh Assa
m
Jammu & Kash
mirManipur
Meghalaya
Mizoram
Nagalan
dSik
kimTrip
ura
Rs. c
rore
Allocation
Releases
Expenditure
NRDWP - Allocation, Releases and Expenditures in 2009-10
050
100150200250300350400450500
Arunachal P
radesh Assa
m
Jammu & Kash
mirManipur
Meghalaya
Mizoram
Nagalan
dSik
kimTrip
ura
Rs. c
rore
Allocation
Releases
Expenditure
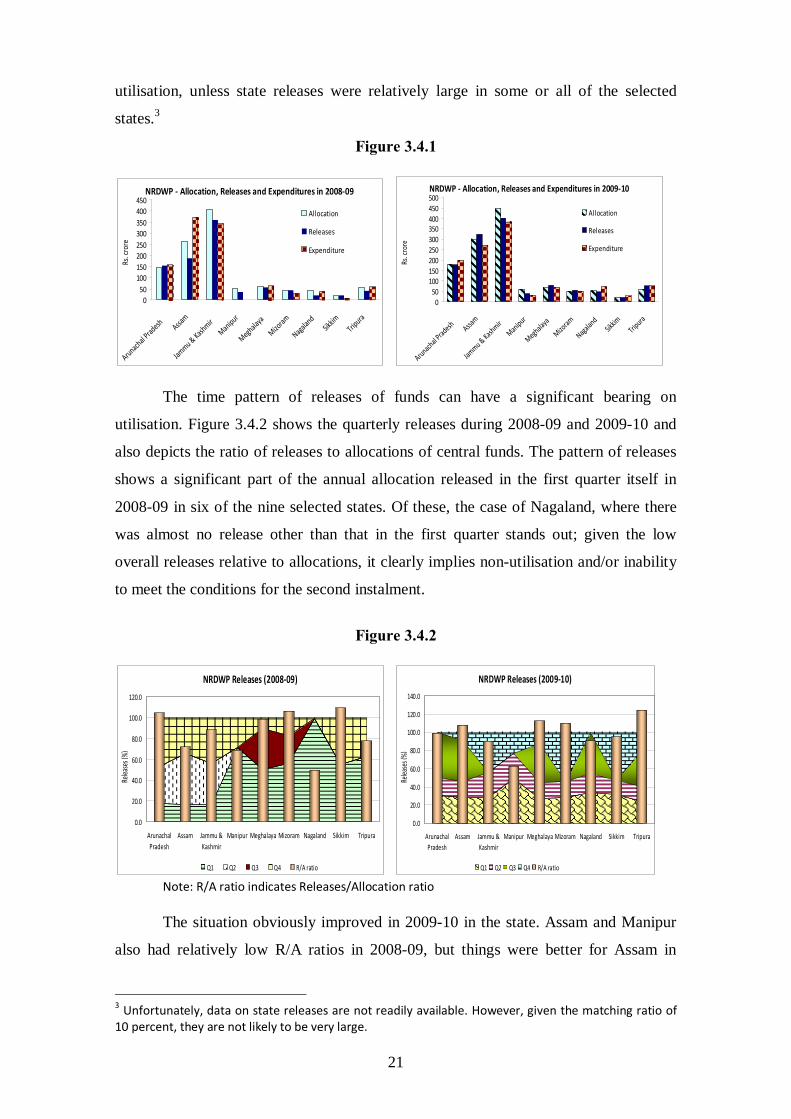
The time pattern of releases of funds can have a significant bearing on
utilisation. Figure 3.4.2 shows the quarterly releases during 2008-09 and 2009-10 and
also depicts the ratio of releases to allocations of central funds. The pattern of releases
shows a significant part of the annual allocation released in the first quarter itself in
2008-09 in six of the nine selected states. Of these, the case of Nagaland, where there
was almost no release other than that in the first quarter stands out; given the low
overall releases relative to allocations, it clearly implies non-utilisation and/or inability
to meet the conditions for the second instalment.
Figure 3.4.2
NRDWP Releases (2008-09)
0.0
20.0
40.0
60.0
80.0
100.0
120.0
ArunachalPradesh
Assam Jammu &Kashmir
Manipur Meghalaya Mizoram Nagaland Sikkim Tripura
Relea
ses (%
)
Q1 Q2 Q3 Q4 R/A ratio
NRDWP Releases (2009-10)
0.0
20.0
40.0
60.0
80.0
100.0
120.0
140.0
ArunachalPradesh
Assam Jammu &Kashmir
Manipur Meghalaya Mizoram Nagaland Sikkim Tripura
Relea
ses (
%)
Q1 Q2 Q3 Q4 R/A ratio Note: R/A ratio indicates Releases/Allocation ratio The situation obviously improved in 2009-10 in the state. Assam and Manipur
also had relatively low R/A ratios in 2008-09, but things were better for Assam in
3 Unfortunately, data on state releases are not readily available. However, given the matching ratio of 10 percent, they are not likely to be very large.
22
2009-10 while Manipur continued to have low R/A ratio probably as fallout of its poor
utilisation in 2008-09. The noticeable feature of the pattern of releases in 2009-10 is the
uniformly low share of releases in the first quarter. This is somewhat surprising
because the first instalment under this scheme is almost unconditional. However, all
states received at least 40 percent of their total releases by the end of the second
quarter. Last quarter releases were relatively large for only 3 states in 2009-10.
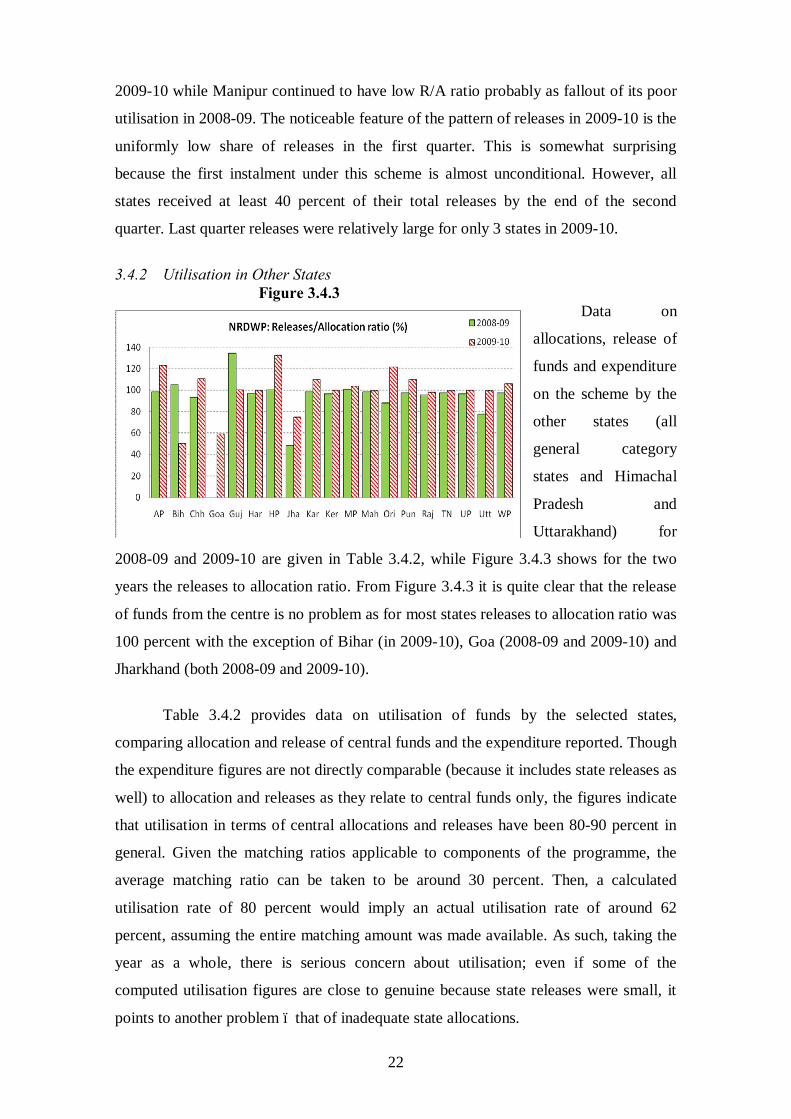
3.4.2 Utilisation in Other States Figure 3.4.3
Data on
allocations, release of
funds and expenditure
on the scheme by the
other states (all
general category
states and Himachal
Pradesh and
Uttarakhand) for
2008-09 and 2009-10 are given in Table 3.4.2, while Figure 3.4.3 shows for the two
years the releases to allocation ratio. From Figure 3.4.3 it is quite clear that the release
of funds from the centre is no problem as for most states releases to allocation ratio was
100 percent with the exception of Bihar (in 2009-10), Goa (2008-09 and 2009-10) and
Jharkhand (both 2008-09 and 2009-10).
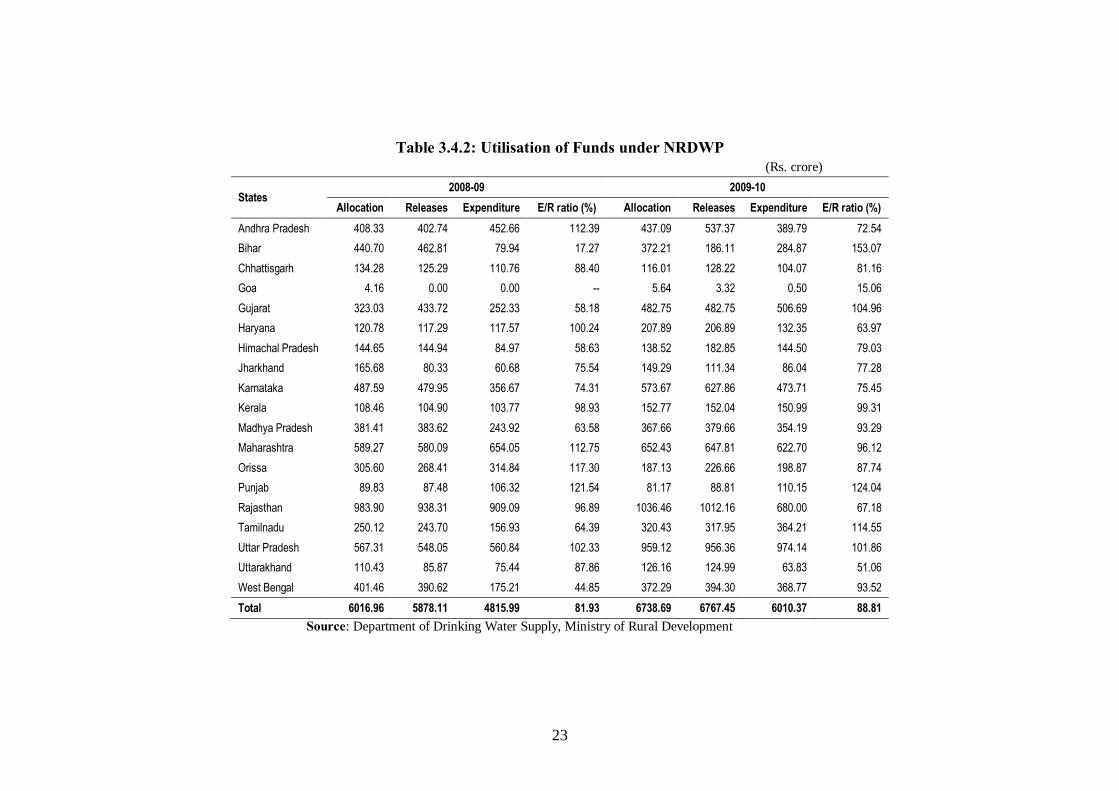
Table 3.4.2 provides data on utilisation of funds by the selected states,
comparing allocation and release of central funds and the expenditure reported. Though
the expenditure figures are not directly comparable (because it includes state releases as
well) to allocation and releases as they relate to central funds only, the figures indicate
that utilisation in terms of central allocations and releases have been 80-90 percent in
general. Given the matching ratios applicable to components of the programme, the
average matching ratio can be taken to be around 30 percent. Then, a calculated
utilisation rate of 80 percent would imply an actual utilisation rate of around 62
percent, assuming the entire matching amount was made available. As such, taking the
year as a whole, there is serious concern about utilisation; even if some of the
computed utilisation figures are close to genuine because state releases were small, it
points to another problem – that of inadequate state allocations.
23
Table 3.4.2: Utilisation of Funds under NRDWP (Rs. crore)
States 2008-09 2009-10
Allocation Releases Expenditure E/R ratio (%) Allocation Releases Expenditure E/R ratio (%) Andhra Pradesh 408.33 402.74 452.66 112.39 437.09 537.37 389.79 72.54 Bihar 440.70 462.81 79.94 17.27 372.21 186.11 284.87 153.07 Chhattisgarh 134.28 125.29 110.76 88.40 116.01 128.22 104.07 81.16 Goa 4.16 0.00 0.00 -- 5.64 3.32 0.50 15.06 Gujarat 323.03 433.72 252.33 58.18 482.75 482.75 506.69 104.96 Haryana 120.78 117.29 117.57 100.24 207.89 206.89 132.35 63.97 Himachal Pradesh 144.65 144.94 84.97 58.63 138.52 182.85 144.50 79.03 Jharkhand 165.68 80.33 60.68 75.54 149.29 111.34 86.04 77.28 Karnataka 487.59 479.95 356.67 74.31 573.67 627.86 473.71 75.45 Kerala 108.46 104.90 103.77 98.93 152.77 152.04 150.99 99.31 Madhya Pradesh 381.41 383.62 243.92 63.58 367.66 379.66 354.19 93.29 Maharashtra 589.27 580.09 654.05 112.75 652.43 647.81 622.70 96.12 Orissa 305.60 268.41 314.84 117.30 187.13 226.66 198.87 87.74 Punjab 89.83 87.48 106.32 121.54 81.17 88.81 110.15 124.04 Rajasthan 983.90 938.31 909.09 96.89 1036.46 1012.16 680.00 67.18 Tamilnadu 250.12 243.70 156.93 64.39 320.43 317.95 364.21 114.55 Uttar Pradesh 567.31 548.05 560.84 102.33 959.12 956.36 974.14 101.86 Uttarakhand 110.43 85.87 75.44 87.86 126.16 124.99 63.83 51.06 West Bengal 401.46 390.62 175.21 44.85 372.29 394.30 368.77 93.52 Total 6016.96 5878.11 4815.99 81.93 6738.69 6767.45 6010.37 88.81
Source: Department of Drinking Water Supply, Ministry of Rural Development
24
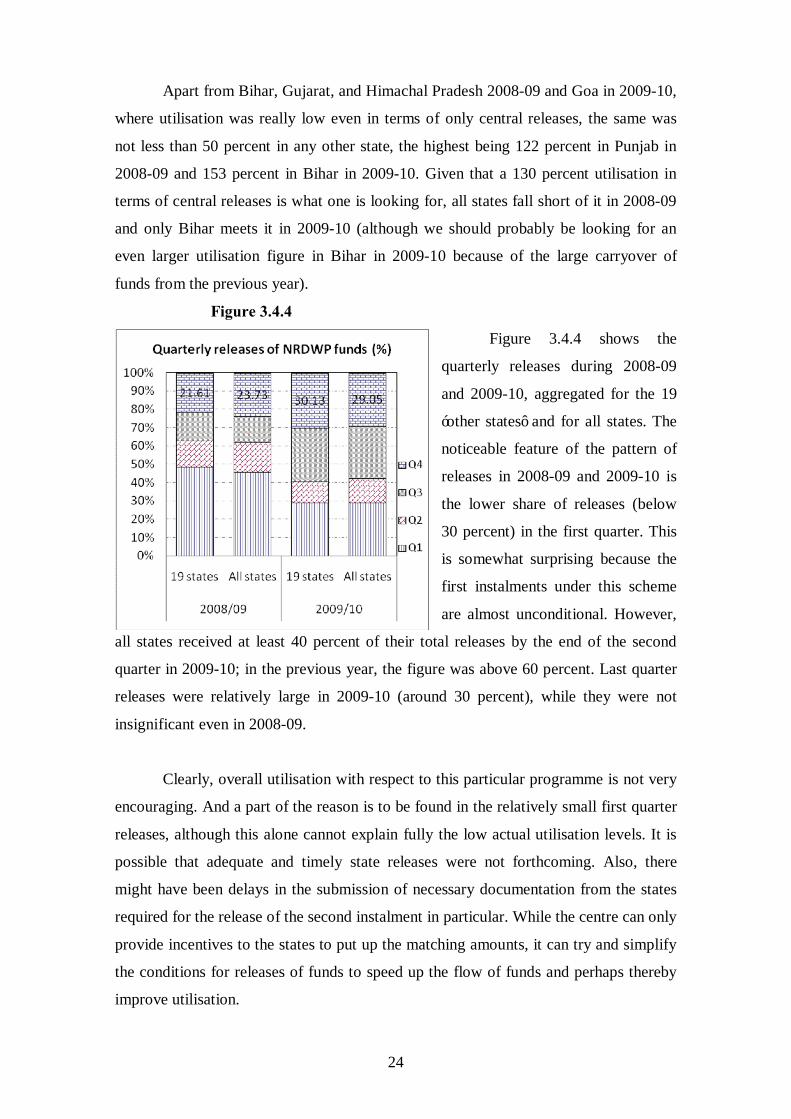
Apart from Bihar, Gujarat, and Himachal Pradesh 2008-09 and Goa in 2009-10,
where utilisation was really low even in terms of only central releases, the same was
not less than 50 percent in any other state, the highest being 122 percent in Punjab in
2008-09 and 153 percent in Bihar in 2009-10. Given that a 130 percent utilisation in
terms of central releases is what one is looking for, all states fall short of it in 2008-09
and only Bihar meets it in 2009-10 (although we should probably be looking for an
even larger utilisation figure in Bihar in 2009-10 because of the large carryover of
funds from the previous year).
Figure 3.4.4
Figure 3.4.4 shows the
quarterly releases during 2008-09
and 2009-10, aggregated for the 19
‘other states’ and for all states. The
noticeable feature of the pattern of
releases in 2008-09 and 2009-10 is
the lower share of releases (below
30 percent) in the first quarter. This
is somewhat surprising because the
first instalments under this scheme
are almost unconditional. However,
all states received at least 40 percent of their total releases by the end of the second
quarter in 2009-10; in the previous year, the figure was above 60 percent. Last quarter
releases were relatively large in 2009-10 (around 30 percent), while they were not
insignificant even in 2008-09.
Clearly, overall utilisation with respect to this particular programme is not very
encouraging. And a part of the reason is to be found in the relatively small first quarter
releases, although this alone cannot explain fully the low actual utilisation levels. It is
possible that adequate and timely state releases were not forthcoming. Also, there
might have been delays in the submission of necessary documentation from the states
required for the release of the second instalment in particular. While the centre can only
provide incentives to the states to put up the matching amounts, it can try and simplify
the conditions for releases of funds to speed up the flow of funds and perhaps thereby
improve utilisation.
25
3.5. Rashtriya Krishi Vikas Yojana (RKVY) (Ministry of Agriculture) This is a special additional central assistance (ACA) scheme under the state
plan mooted by the National Development Council (NDC) in 2007. The main objective
is to provide a boost to the agriculture and allied sector by incentivising the states to
maintain and raise their investment in agriculture. The scheme is based on
comprehensive district level agricultural plans (C-DAP), which are expected to take
into consideration local needs and preferences, as well as constraints (agro-climatic and
technical). It encourages convergence with other schemes wherever possible.
The system is driven by eligibility (conditional upon at least maintaining
baseline allocation to agriculture and allied sectors in state plan) and formula-based
allocations. Fixed proportions of allocations are available for funding specific projects
and for supplementary funding in existing schemes/projects. Details are provided in
Table 3.5.1.
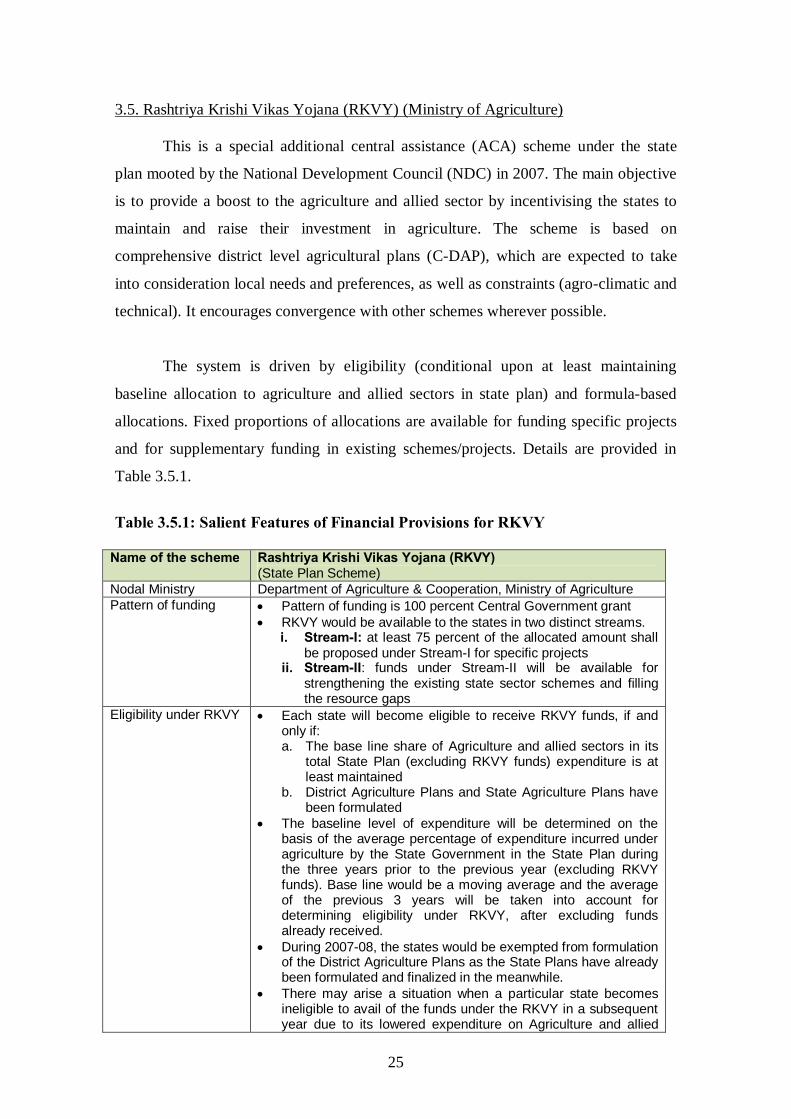
Table 3.5.1: Salient Features of Financial Provisions for RKVY
Name of the scheme Rashtriya Krishi Vikas Yojana (RKVY) (State Plan Scheme)
Nodal Ministry Department of Agriculture & Cooperation, Ministry of Agriculture Pattern of funding • Pattern of funding is 100 percent Central Government grant
• RKVY would be available to the states in two distinct streams. i. Stream-I: at least 75 percent of the allocated amount shall
be proposed under Stream-I for specific projects ii. Stream-II: funds under Stream-II will be available for
strengthening the existing state sector schemes and filling the resource gaps
Eligibility under RKVY • Each state will become eligible to receive RKVY funds, if and only if: a. The base line share of Agriculture and allied sectors in its
total State Plan (excluding RKVY funds) expenditure is at least maintained
b. District Agriculture Plans and State Agriculture Plans have been formulated
• The baseline level of expenditure will be determined on the basis of the average percentage of expenditure incurred under agriculture by the State Government in the State Plan during the three years prior to the previous year (excluding RKVY funds). Base line would be a moving average and the average of the previous 3 years will be taken into account for determining eligibility under RKVY, after excluding funds already received.
• During 2007-08, the states would be exempted from formulation of the District Agriculture Plans as the State Plans have already been formulated and finalized in the meanwhile.
• There may arise a situation when a particular state becomes ineligible to avail of the funds under the RKVY in a subsequent year due to its lowered expenditure on Agriculture and allied
26
Name of the scheme Rashtriya Krishi Vikas Yojana (RKVY) (State Plan Scheme)
sectors. If this were to happen, the states shall be required to commit their own resources for completing the sanctioned projects/schemes under the RKVY
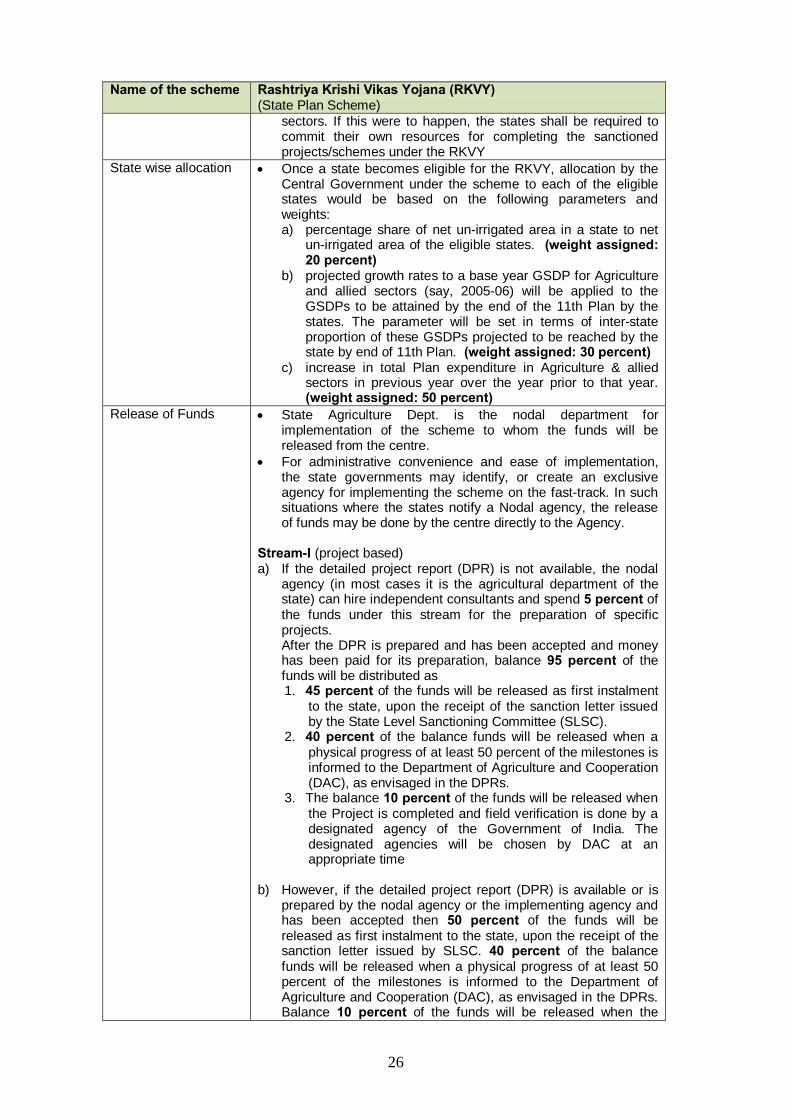
State wise allocation • Once a state becomes eligible for the RKVY, allocation by the Central Government under the scheme to each of the eligible states would be based on the following parameters and weights: a) percentage share of net un-irrigated area in a state to net
un-irrigated area of the eligible states. (weight assigned: 20 percent)
b) projected growth rates to a base year GSDP for Agriculture and allied sectors (say, 2005-06) will be applied to the GSDPs to be attained by the end of the 11th Plan by the states. The parameter will be set in terms of inter-state proportion of these GSDPs projected to be reached by the state by end of 11th Plan. (weight assigned: 30 percent)
c) increase in total Plan expenditure in Agriculture & allied sectors in previous year over the year prior to that year. (weight assigned: 50 percent)
Release of Funds • State Agriculture Dept. is the nodal department for implementation of the scheme to whom the funds will be released from the centre.
• For administrative convenience and ease of implementation, the state governments may identify, or create an exclusive agency for implementing the scheme on the fast-track. In such situations where the states notify a Nodal agency, the release of funds may be done by the centre directly to the Agency.
Stream-I (project based) a) If the detailed project report (DPR) is not available, the nodal
agency (in most cases it is the agricultural department of the state) can hire independent consultants and spend 5 percent of the funds under this stream for the preparation of specific projects. After the DPR is prepared and has been accepted and money has been paid for its preparation, balance 95 percent of the funds will be distributed as 1. 45 percent of the funds will be released as first instalment
to the state, upon the receipt of the sanction letter issued by the State Level Sanctioning Committee (SLSC).
2. 40 percent of the balance funds will be released when a physical progress of at least 50 percent of the milestones is informed to the Department of Agriculture and Cooperation (DAC), as envisaged in the DPRs.
3. The balance 10 percent of the funds will be released when the Project is completed and field verification is done by a designated agency of the Government of India. The designated agencies will be chosen by DAC at an appropriate time
b) However, if the detailed project report (DPR) is available or is
prepared by the nodal agency or the implementing agency and has been accepted then 50 percent of the funds will be released as first instalment to the state, upon the receipt of the sanction letter issued by SLSC. 40 percent of the balance funds will be released when a physical progress of at least 50 percent of the milestones is informed to the Department of Agriculture and Cooperation (DAC), as envisaged in the DPRs. Balance 10 percent of the funds will be released when the
27
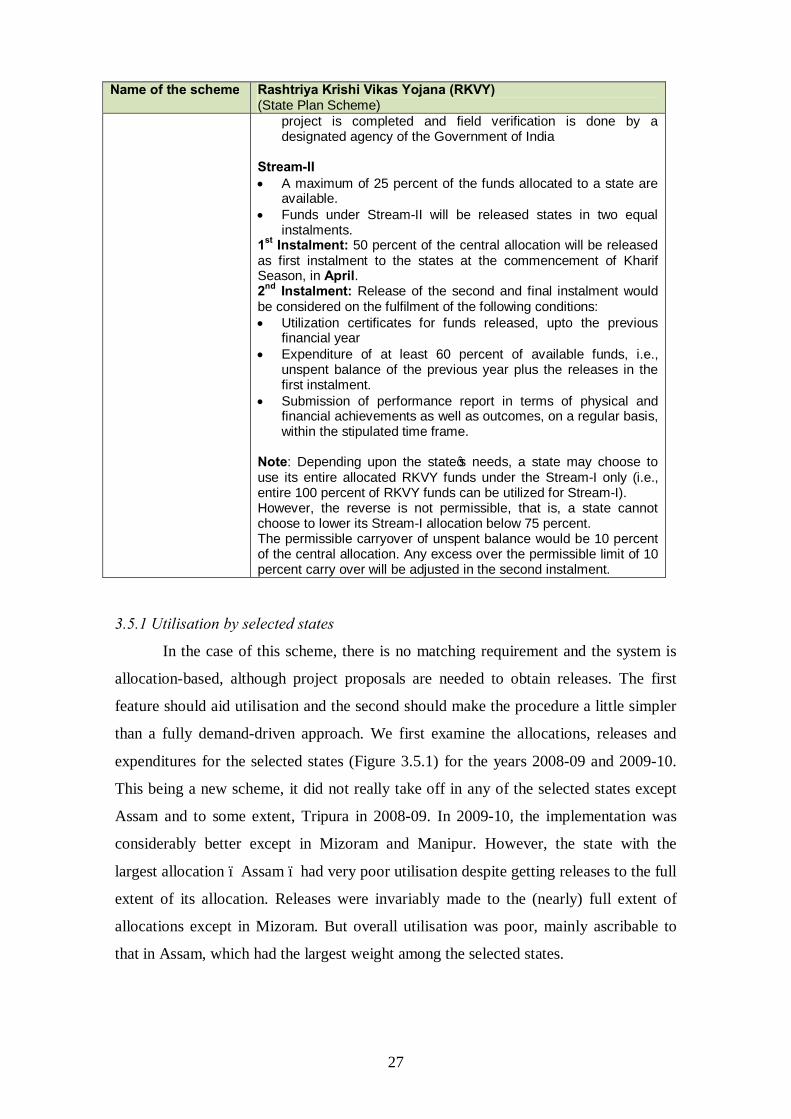
Name of the scheme Rashtriya Krishi Vikas Yojana (RKVY) (State Plan Scheme)
project is completed and field verification is done by a designated agency of the Government of India
Stream-II • A maximum of 25 percent of the funds allocated to a state are
available. • Funds under Stream-II will be released states in two equal
instalments. 1st Instalment: 50 percent of the central allocation will be released as first instalment to the states at the commencement of Kharif Season, in April. 2nd Instalment: Release of the second and final instalment would be considered on the fulfilment of the following conditions: • Utilization certificates for funds released, upto the previous
financial year • Expenditure of at least 60 percent of available funds, i.e.,
unspent balance of the previous year plus the releases in the first instalment.
• Submission of performance report in terms of physical and financial achievements as well as outcomes, on a regular basis, within the stipulated time frame.
Note: Depending upon the state’s needs, a state may choose to use its entire allocated RKVY funds under the Stream-I only (i.e., entire 100 percent of RKVY funds can be utilized for Stream-I). However, the reverse is not permissible, that is, a state cannot choose to lower its Stream-I allocation below 75 percent. The permissible carryover of unspent balance would be 10 percent of the central allocation. Any excess over the permissible limit of 10 percent carry over will be adjusted in the second instalment.
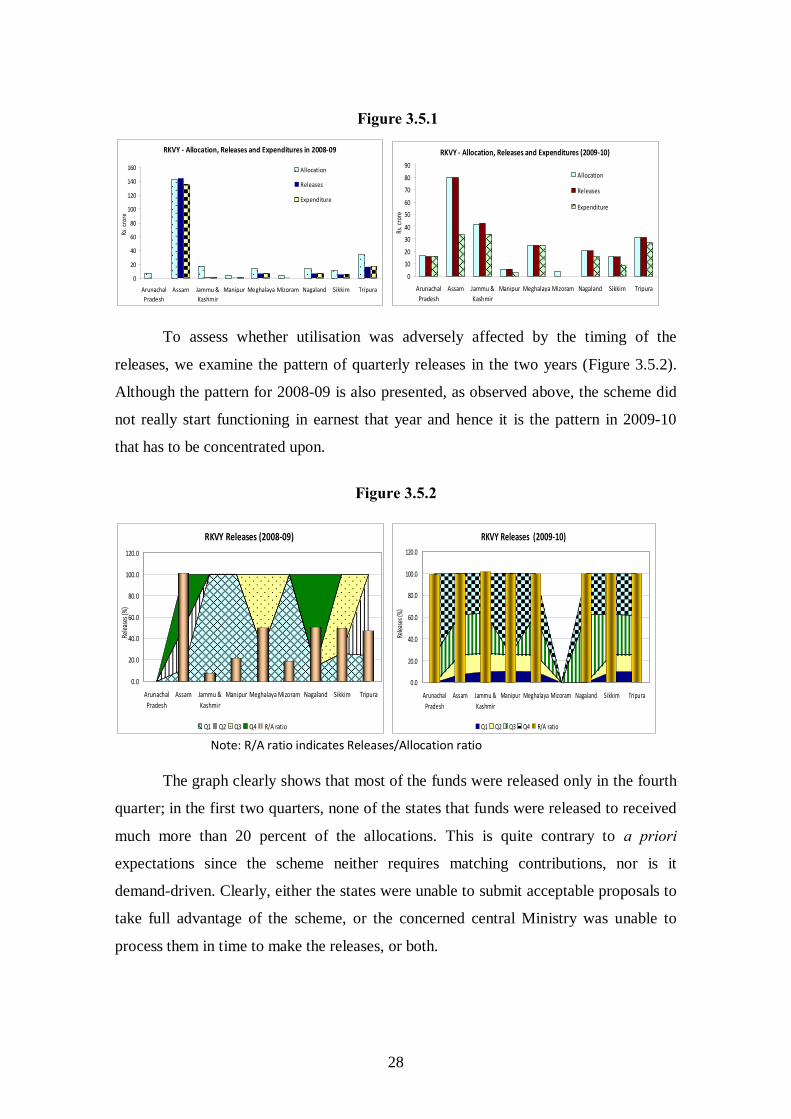
3.5.1 Utilisation by selected states
In the case of this scheme, there is no matching requirement and the system is
allocation-based, although project proposals are needed to obtain releases. The first
feature should aid utilisation and the second should make the procedure a little simpler
than a fully demand-driven approach. We first examine the allocations, releases and
expenditures for the selected states (Figure 3.5.1) for the years 2008-09 and 2009-10.
This being a new scheme, it did not really take off in any of the selected states except
Assam and to some extent, Tripura in 2008-09. In 2009-10, the implementation was
considerably better except in Mizoram and Manipur. However, the state with the
largest allocation – Assam – had very poor utilisation despite getting releases to the full
extent of its allocation. Releases were invariably made to the (nearly) full extent of
allocations except in Mizoram. But overall utilisation was poor, mainly ascribable to
that in Assam, which had the largest weight among the selected states.
28
Figure 3.5.1
RKVY - Allocation, Releases and Expenditures in 2008-09
0
20
40
60
80
100
120
140
160
ArunachalPradesh
Assam Jammu &Kashmir
Manipur Meghalaya Mizoram Nagaland Sikkim Tripura
Rs. c
rore
Allocation
Releases
Expenditure
RKVY - Allocation, Releases and Expenditures (2009-10)
0
10
20
30
40
5060
70
80
90
ArunachalPradesh
Assam Jammu &Kashmir
Manipur Meghalaya Mizoram Nagaland Sikkim Tripura
Rs. c
rore
Allocation
Releases
Expenditure
To assess whether utilisation was adversely affected by the timing of the
releases, we examine the pattern of quarterly releases in the two years (Figure 3.5.2).
Although the pattern for 2008-09 is also presented, as observed above, the scheme did
not really start functioning in earnest that year and hence it is the pattern in 2009-10
that has to be concentrated upon.
Figure 3.5.2
RKVY Releases (2008-09)
0.0
20.0
40.0
60.0
80.0
100.0
120.0
ArunachalPradesh
Assam Jammu &Kashmir
Manipur Meghalaya Mizoram Nagaland Sikkim Tripura
Relea
ses (
%)
Q1 Q2 Q3 Q4 R/A ratio
RKVY Releases (2009-10)
0.0
20.0
40.0
60.0
80.0
100.0
120.0
ArunachalPradesh
Assam Jammu &Kashmir
Manipur Meghalaya Mizoram Nagaland Sikkim Tripura
Relea
ses (%
)
Q1 Q2 Q3 Q4 R/A ratio Note: R/A ratio indicates Releases/Allocation ratio The graph clearly shows that most of the funds were released only in the fourth
quarter; in the first two quarters, none of the states that funds were released to received
much more than 20 percent of the allocations. This is quite contrary to a priori
expectations since the scheme neither requires matching contributions, nor is it
demand-driven. Clearly, either the states were unable to submit acceptable proposals to
take full advantage of the scheme, or the concerned central Ministry was unable to
process them in time to make the releases, or both.
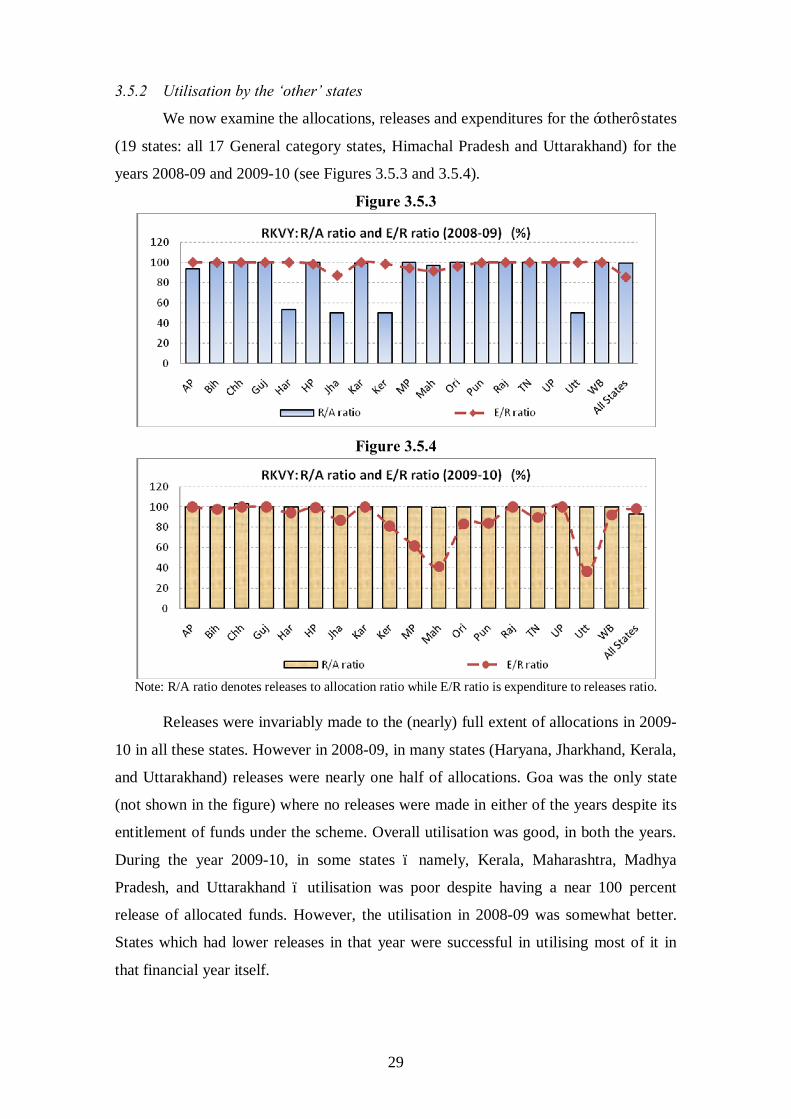
29
3.5.2 Utilisation by the ‘other’ states
We now examine the allocations, releases and expenditures for the ‘other’ states
(19 states: all 17 General category states, Himachal Pradesh and Uttarakhand) for the
years 2008-09 and 2009-10 (see Figures 3.5.3 and 3.5.4).
Figure 3.5.3
Figure 3.5.4
Note: R/A ratio denotes releases to allocation ratio while E/R ratio is expenditure to releases ratio.
Releases were invariably made to the (nearly) full extent of allocations in 2009-
10 in all these states. However in 2008-09, in many states (Haryana, Jharkhand, Kerala,
and Uttarakhand) releases were nearly one half of allocations. Goa was the only state
(not shown in the figure) where no releases were made in either of the years despite its
entitlement of funds under the scheme. Overall utilisation was good, in both the years.
During the year 2009-10, in some states – namely, Kerala, Maharashtra, Madhya
Pradesh, and Uttarakhand – utilisation was poor despite having a near 100 percent
release of allocated funds. However, the utilisation in 2008-09 was somewhat better.
States which had lower releases in that year were successful in utilising most of it in
that financial year itself.
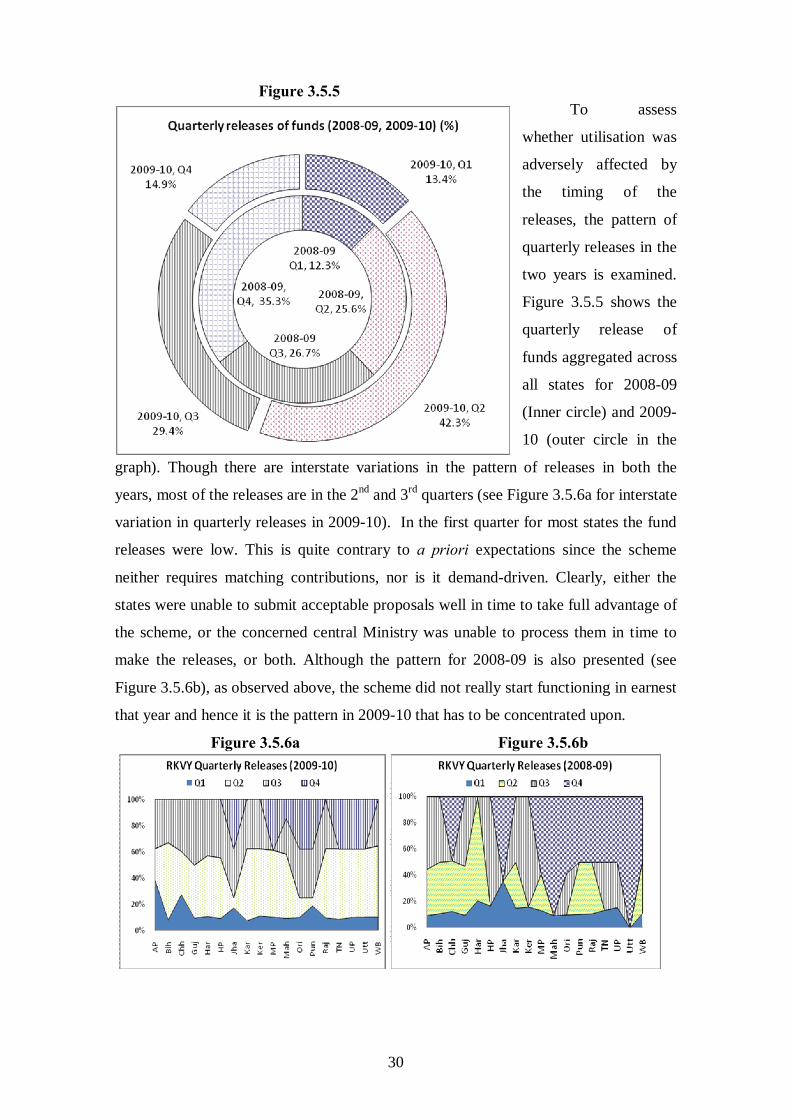
30
Figure 3.5.5 To assess
whether utilisation was
adversely affected by
the timing of the
releases, the pattern of
quarterly releases in the
two years is examined.
Figure 3.5.5 shows the
quarterly release of
funds aggregated across
all states for 2008-09
(Inner circle) and 2009-
10 (outer circle in the
graph). Though there are interstate variations in the pattern of releases in both the
years, most of the releases are in the 2nd and 3rd quarters (see Figure 3.5.6a for interstate
variation in quarterly releases in 2009-10). In the first quarter for most states the fund
releases were low. This is quite contrary to a priori expectations since the scheme
neither requires matching contributions, nor is it demand-driven. Clearly, either the
states were unable to submit acceptable proposals well in time to take full advantage of
the scheme, or the concerned central Ministry was unable to process them in time to
make the releases, or both. Although the pattern for 2008-09 is also presented (see
Figure 3.5.6b), as observed above, the scheme did not really start functioning in earnest
that year and hence it is the pattern in 2009-10 that has to be concentrated upon.
Figure 3.5.6a Figure 3.5.6b
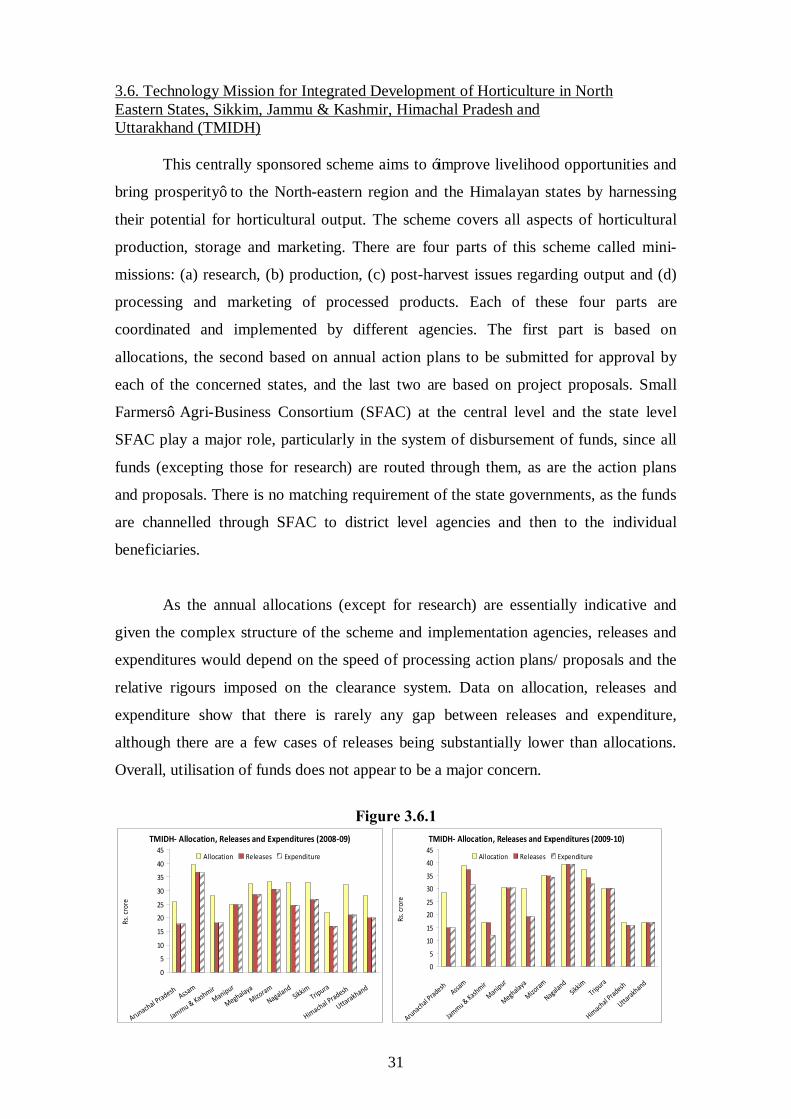
31
3.6. Technology Mission for Integrated Development of Horticulture in North Eastern States, Sikkim, Jammu & Kashmir, Himachal Pradesh and Uttarakhand (TMIDH) This centrally sponsored scheme aims to ‘improve livelihood opportunities and
bring prosperity’ to the North-eastern region and the Himalayan states by harnessing
their potential for horticultural output. The scheme covers all aspects of horticultural
production, storage and marketing. There are four parts of this scheme called mini-
missions: (a) research, (b) production, (c) post-harvest issues regarding output and (d)
processing and marketing of processed products. Each of these four parts are
coordinated and implemented by different agencies. The first part is based on
allocations, the second based on annual action plans to be submitted for approval by
each of the concerned states, and the last two are based on project proposals. Small
Farmers’ Agri-Business Consortium (SFAC) at the central level and the state level
SFAC play a major role, particularly in the system of disbursement of funds, since all
funds (excepting those for research) are routed through them, as are the action plans
and proposals. There is no matching requirement of the state governments, as the funds
are channelled through SFAC to district level agencies and then to the individual
beneficiaries.
As the annual allocations (except for research) are essentially indicative and
given the complex structure of the scheme and implementation agencies, releases and
expenditures would depend on the speed of processing action plans/ proposals and the
relative rigours imposed on the clearance system. Data on allocation, releases and
expenditure show that there is rarely any gap between releases and expenditure,
although there are a few cases of releases being substantially lower than allocations.
Overall, utilisation of funds does not appear to be a major concern.
Figure 3.6.1
TMIDH- Allocation, Releases and Expenditures (2008-09)
0
5
10
15
20
25
30
35
40
45
Arunachal Pradesh Assam
Jammu & KashmirManipur
MeghalayaMizoram
NagalandSikkim
Tripura
Himachal Pradesh
Uttarakhand
Rs. c
rore
Allocation Releases Expenditure
TMIDH- Allocation, Releases and Expenditures (2009-10)
0
5
10
15
2025
30
35
40
45
Arunachal PradeshAssa
m
Jammu & KashmirManipur
Meghalaya
Mizoram
NagalandSikk
imTrip
ura
Himachal Pradesh
Uttarakhand
Rs. c
rore
Allocation Releases Expenditure
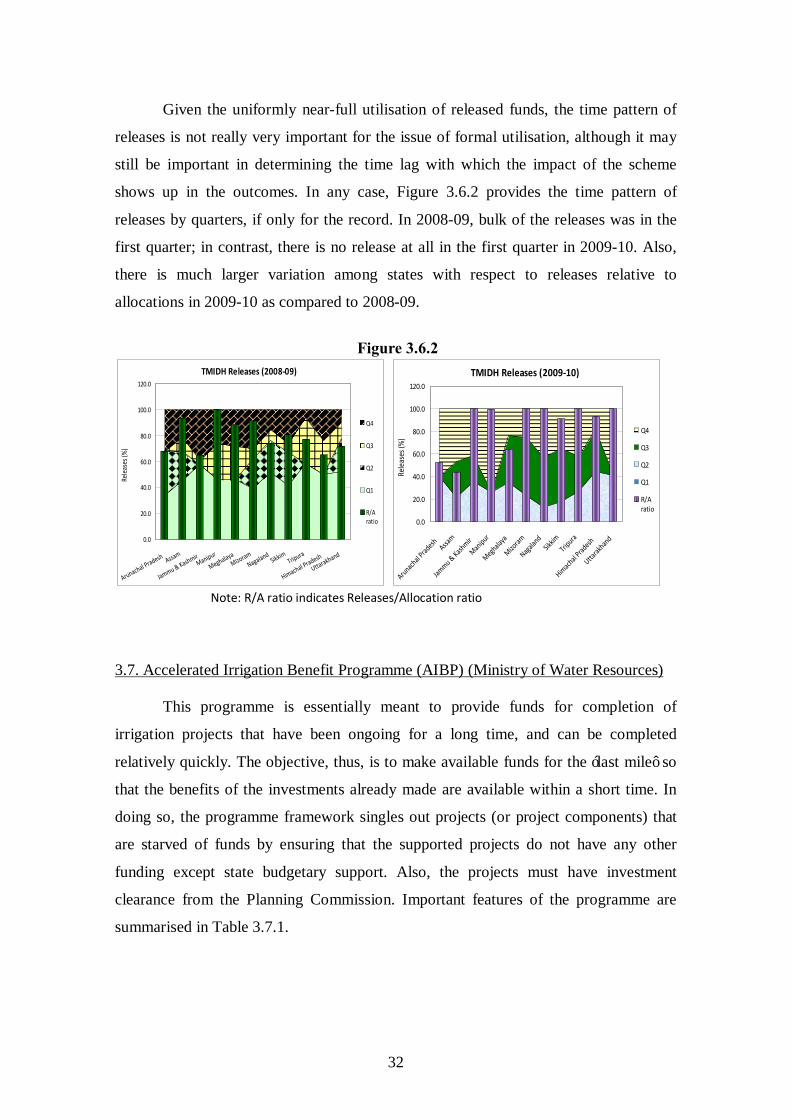
32
Given the uniformly near-full utilisation of released funds, the time pattern of
releases is not really very important for the issue of formal utilisation, although it may
still be important in determining the time lag with which the impact of the scheme
shows up in the outcomes. In any case, Figure 3.6.2 provides the time pattern of
releases by quarters, if only for the record. In 2008-09, bulk of the releases was in the
first quarter; in contrast, there is no release at all in the first quarter in 2009-10. Also,
there is much larger variation among states with respect to releases relative to
allocations in 2009-10 as compared to 2008-09.
Figure 3.6.2
TMIDH Releases (2008-09)
0.0
20.0
40.0
60.0
80.0
100.0
120.0
Arunachal Pradesh Assam
Jammu & KashmirManipur
MeghalayaMizoram
NagalandSikkim
Tripura
Himachal Pradesh
Uttarakhand
Relea
ses (
%)
Q4
Q3
Q2
Q1
R/Aratio
TMIDH Releases (2009-10)
0.0
20.0
40.0
60.0
80.0
100.0
120.0Arunach
al Prad
esh Assam
Jammu & Kash
mirManipur
Meghalaya
Mizoram
Nagalan
dSik
kimTri
pura
Himach
al Prad
eshUtta
rakhand
Relea
ses (
%)
Q4
Q3
Q2
Q1
R/Aratio
Note: R/A ratio indicates Releases/Allocation ratio 3.7. Accelerated Irrigation Benefit Programme (AIBP) (Ministry of Water Resources) This programme is essentially meant to provide funds for completion of
irrigation projects that have been ongoing for a long time, and can be completed
relatively quickly. The objective, thus, is to make available funds for the ‘last mile’ so
that the benefits of the investments already made are available within a short time. In
doing so, the programme framework singles out projects (or project components) that
are starved of funds by ensuring that the supported projects do not have any other
funding except state budgetary support. Also, the projects must have investment
clearance from the Planning Commission. Important features of the programme are
summarised in Table 3.7.1.
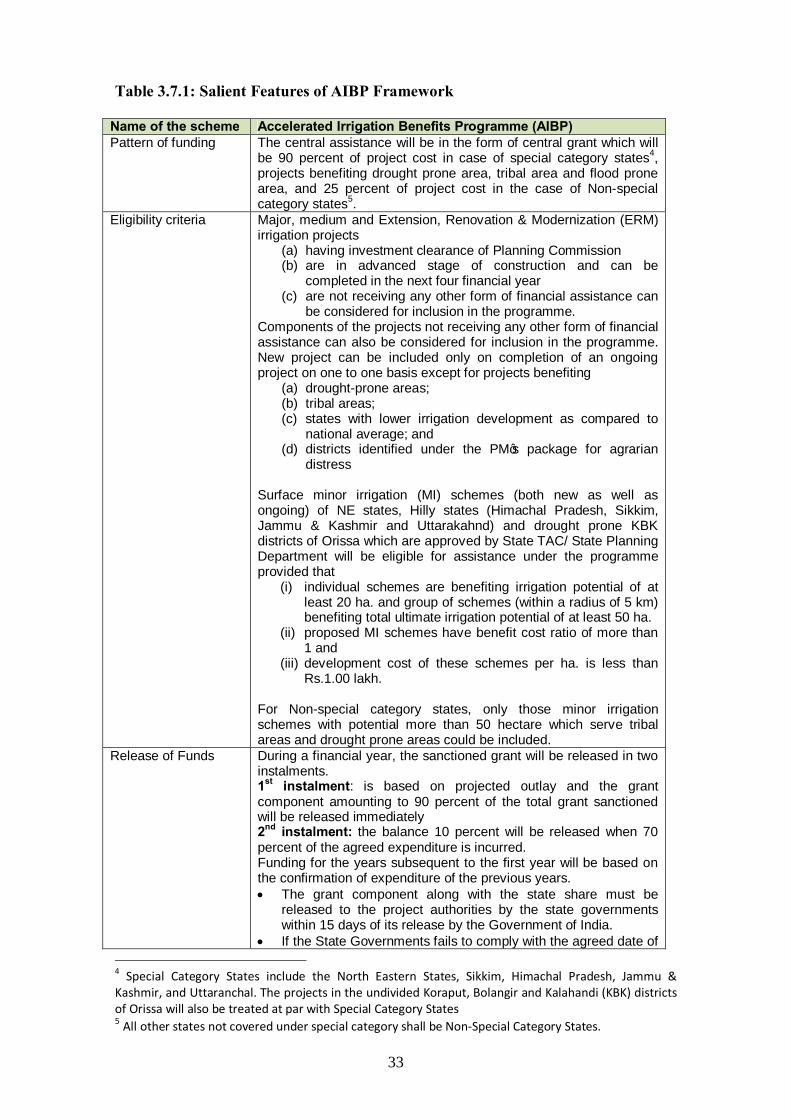
33
Table 3.7.1: Salient Features of AIBP Framework
Name of the scheme Accelerated Irrigation Benefits Programme (AIBP) Pattern of funding The central assistance will be in the form of central grant which will
be 90 percent of project cost in case of special category states4, projects benefiting drought prone area, tribal area and flood prone area, and 25 percent of project cost in the case of Non-special category states5.
Eligibility criteria Major, medium and Extension, Renovation & Modernization (ERM) irrigation projects
(a) having investment clearance of Planning Commission (b) are in advanced stage of construction and can be
completed in the next four financial year (c) are not receiving any other form of financial assistance can
be considered for inclusion in the programme. Components of the projects not receiving any other form of financial assistance can also be considered for inclusion in the programme. New project can be included only on completion of an ongoing project on one to one basis except for projects benefiting
(a) drought-prone areas; (b) tribal areas; (c) states with lower irrigation development as compared to
national average; and (d) districts identified under the PM’s package for agrarian
distress Surface minor irrigation (MI) schemes (both new as well as ongoing) of NE states, Hilly states (Himachal Pradesh, Sikkim, Jammu & Kashmir and Uttarakahnd) and drought prone KBK districts of Orissa which are approved by State TAC/ State Planning Department will be eligible for assistance under the programme provided that
(i) individual schemes are benefiting irrigation potential of at least 20 ha. and group of schemes (within a radius of 5 km) benefiting total ultimate irrigation potential of at least 50 ha.
(ii) proposed MI schemes have benefit cost ratio of more than 1 and
(iii) development cost of these schemes per ha. is less than Rs.1.00 lakh.
For Non-special category states, only those minor irrigation schemes with potential more than 50 hectare which serve tribal areas and drought prone areas could be included.
Release of Funds During a financial year, the sanctioned grant will be released in two instalments. 1st instalment: is based on projected outlay and the grant component amounting to 90 percent of the total grant sanctioned will be released immediately 2nd instalment: the balance 10 percent will be released when 70 percent of the agreed expenditure is incurred. Funding for the years subsequent to the first year will be based on the confirmation of expenditure of the previous years. • The grant component along with the state share must be
released to the project authorities by the state governments within 15 days of its release by the Government of India.
• If the State Governments fails to comply with the agreed date of 4 Special Category States include the North Eastern States, Sikkim, Himachal Pradesh, Jammu & Kashmir, and Uttaranchal. The projects in the undivided Koraput, Bolangir and Kalahandi (KBK) districts of Orissa will also be treated at par with Special Category States 5 All other states not covered under special category shall be Non-Special Category States.
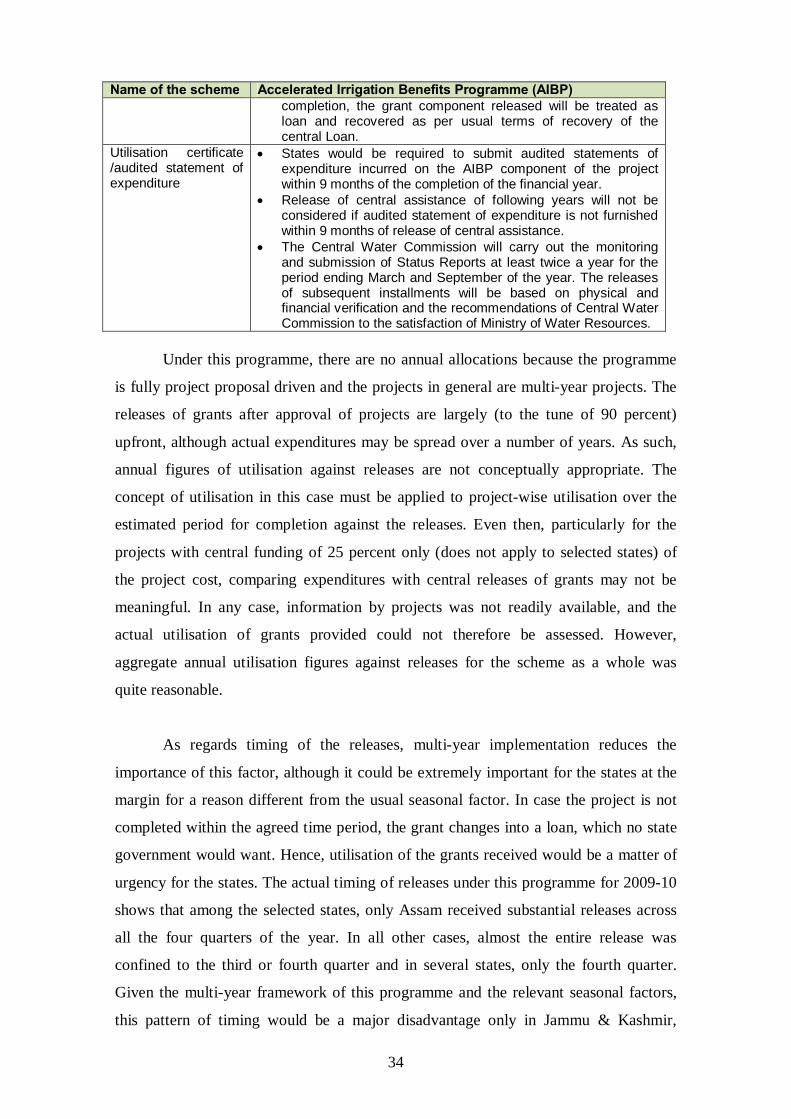
34
Name of the scheme Accelerated Irrigation Benefits Programme (AIBP) completion, the grant component released will be treated as loan and recovered as per usual terms of recovery of the central Loan.
Utilisation certificate /audited statement of expenditure
• States would be required to submit audited statements of expenditure incurred on the AIBP component of the project within 9 months of the completion of the financial year.
• Release of central assistance of following years will not be considered if audited statement of expenditure is not furnished within 9 months of release of central assistance.
• The Central Water Commission will carry out the monitoring and submission of Status Reports at least twice a year for the period ending March and September of the year. The releases of subsequent installments will be based on physical and financial verification and the recommendations of Central Water Commission to the satisfaction of Ministry of Water Resources.
Under this programme, there are no annual allocations because the programme
is fully project proposal driven and the projects in general are multi-year projects. The
releases of grants after approval of projects are largely (to the tune of 90 percent)
upfront, although actual expenditures may be spread over a number of years. As such,
annual figures of utilisation against releases are not conceptually appropriate. The
concept of utilisation in this case must be applied to project-wise utilisation over the
estimated period for completion against the releases. Even then, particularly for the
projects with central funding of 25 percent only (does not apply to selected states) of
the project cost, comparing expenditures with central releases of grants may not be
meaningful. In any case, information by projects was not readily available, and the
actual utilisation of grants provided could not therefore be assessed. However,
aggregate annual utilisation figures against releases for the scheme as a whole was
quite reasonable.
As regards timing of the releases, multi-year implementation reduces the
importance of this factor, although it could be extremely important for the states at the
margin for a reason different from the usual seasonal factor. In case the project is not
completed within the agreed time period, the grant changes into a loan, which no state
government would want. Hence, utilisation of the grants received would be a matter of
urgency for the states. The actual timing of releases under this programme for 2009-10
shows that among the selected states, only Assam received substantial releases across
all the four quarters of the year. In all other cases, almost the entire release was
confined to the third or fourth quarter and in several states, only the fourth quarter.
Given the multi-year framework of this programme and the relevant seasonal factors,
this pattern of timing would be a major disadvantage only in Jammu & Kashmir,
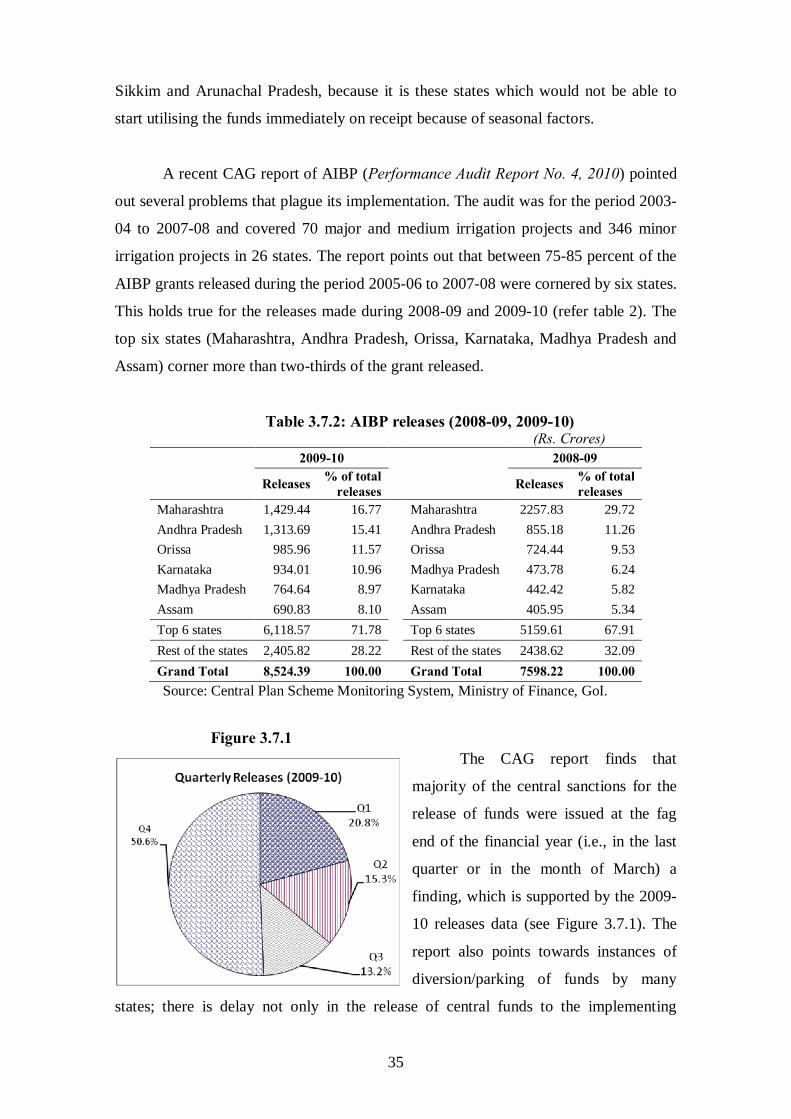
35
Sikkim and Arunachal Pradesh, because it is these states which would not be able to
start utilising the funds immediately on receipt because of seasonal factors.
A recent CAG report of AIBP (Performance Audit Report No. 4, 2010) pointed
out several problems that plague its implementation. The audit was for the period 2003-
04 to 2007-08 and covered 70 major and medium irrigation projects and 346 minor
irrigation projects in 26 states. The report points out that between 75-85 percent of the
AIBP grants released during the period 2005-06 to 2007-08 were cornered by six states.
This holds true for the releases made during 2008-09 and 2009-10 (refer table 2). The
top six states (Maharashtra, Andhra Pradesh, Orissa, Karnataka, Madhya Pradesh and
Assam) corner more than two-thirds of the grant released.
Table 3.7.2: AIBP releases (2008-09, 2009-10) (Rs. Crores)
2009-10 2008-09
Releases % of total releases Releases % of total
releases Maharashtra 1,429.44 16.77 Maharashtra 2257.83 29.72 Andhra Pradesh 1,313.69 15.41 Andhra Pradesh 855.18 11.26 Orissa 985.96 11.57 Orissa 724.44 9.53 Karnataka 934.01 10.96 Madhya Pradesh 473.78 6.24 Madhya Pradesh 764.64 8.97 Karnataka 442.42 5.82 Assam 690.83 8.10 Assam 405.95 5.34 Top 6 states 6,118.57 71.78 Top 6 states 5159.61 67.91 Rest of the states 2,405.82 28.22 Rest of the states 2438.62 32.09 Grand Total 8,524.39 100.00 Grand Total 7598.22 100.00 Source: Central Plan Scheme Monitoring System, Ministry of Finance, GoI.
Figure 3.7.1
The CAG report finds that
majority of the central sanctions for the
release of funds were issued at the fag
end of the financial year (i.e., in the last
quarter or in the month of March) a
finding, which is supported by the 2009-
10 releases data (see Figure 3.7.1). The
report also points towards instances of
diversion/parking of funds by many
states; there is delay not only in the release of central funds to the implementing
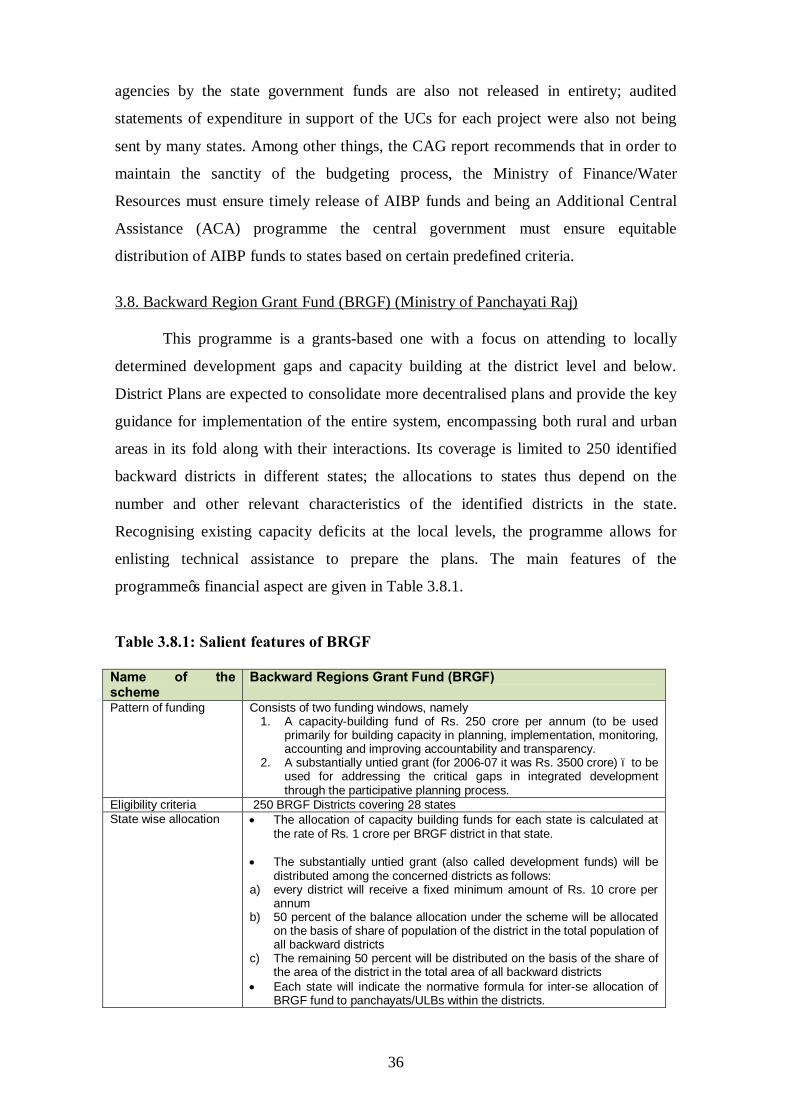
36
agencies by the state government funds are also not released in entirety; audited
statements of expenditure in support of the UCs for each project were also not being
sent by many states. Among other things, the CAG report recommends that in order to
maintain the sanctity of the budgeting process, the Ministry of Finance/Water
Resources must ensure timely release of AIBP funds and being an Additional Central
Assistance (ACA) programme the central government must ensure equitable
distribution of AIBP funds to states based on certain predefined criteria.
3.8. Backward Region Grant Fund (BRGF) (Ministry of Panchayati Raj) This programme is a grants-based one with a focus on attending to locally
determined development gaps and capacity building at the district level and below.
District Plans are expected to consolidate more decentralised plans and provide the key
guidance for implementation of the entire system, encompassing both rural and urban
areas in its fold along with their interactions. Its coverage is limited to 250 identified
backward districts in different states; the allocations to states thus depend on the
number and other relevant characteristics of the identified districts in the state.
Recognising existing capacity deficits at the local levels, the programme allows for
enlisting technical assistance to prepare the plans. The main features of the
programme’s financial aspect are given in Table 3.8.1.
Table 3.8.1: Salient features of BRGF
Name of the scheme
Backward Regions Grant Fund (BRGF)
Pattern of funding Consists of two funding windows, namely 1. A capacity-building fund of Rs. 250 crore per annum (to be used
primarily for building capacity in planning, implementation, monitoring, accounting and improving accountability and transparency.
2. A substantially untied grant (for 2006-07 it was Rs. 3500 crore) – to be used for addressing the critical gaps in integrated development through the participative planning process.
Eligibility criteria 250 BRGF Districts covering 28 states State wise allocation • The allocation of capacity building funds for each state is calculated at
the rate of Rs. 1 crore per BRGF district in that state. • The substantially untied grant (also called development funds) will be
distributed among the concerned districts as follows: a) every district will receive a fixed minimum amount of Rs. 10 crore per
annum b) 50 percent of the balance allocation under the scheme will be allocated
on the basis of share of population of the district in the total population of all backward districts
c) The remaining 50 percent will be distributed on the basis of the share of the area of the district in the total area of all backward districts
• Each state will indicate the normative formula for inter-se allocation of BRGF fund to panchayats/ULBs within the districts.
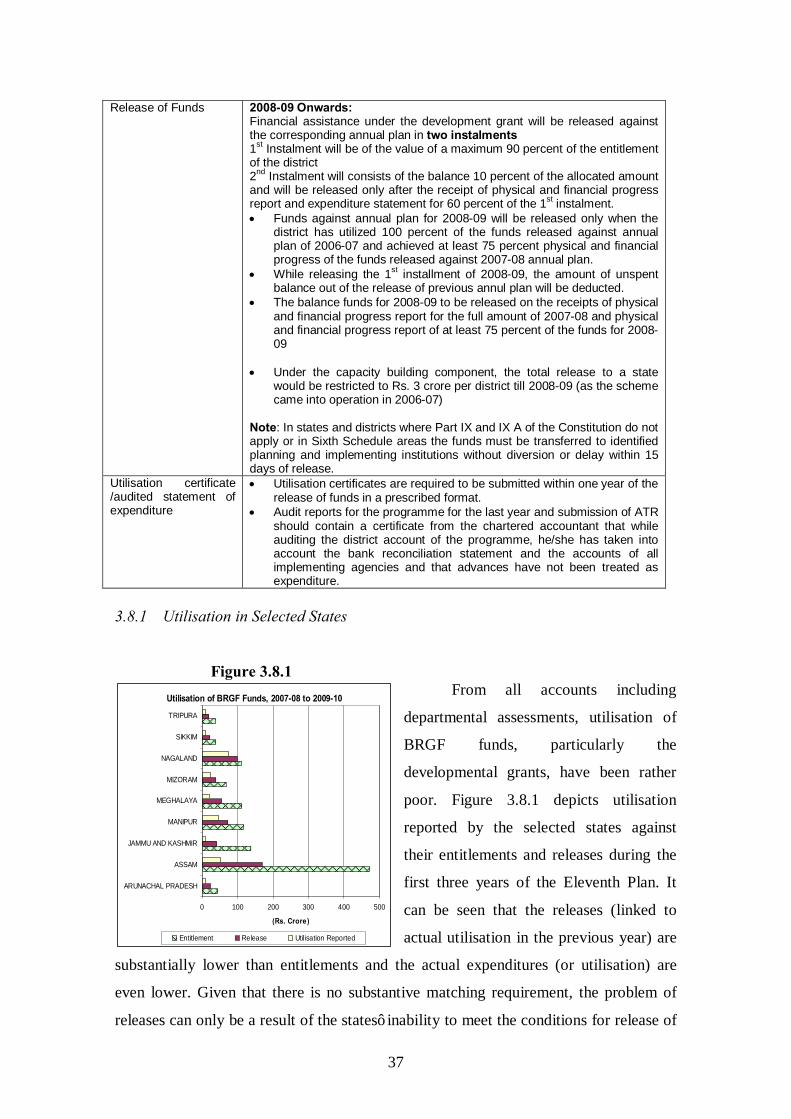
37
Utilisation of BRGF Funds, 2007-08 to 2009-10
0 100 200 300 400 500
ARUNACHAL PRADESH
ASSAM
JAMMU AND KASHMIR
MANIPUR
MEGHALAYA
MIZORAM
NAGALAND
SIKKIM
TRIPURA
(Rs. Crore)
Entitlement Release Utilisation Reported
Release of Funds 2008-09 Onwards:
Financial assistance under the development grant will be released against the corresponding annual plan in two instalments 1st Instalment will be of the value of a maximum 90 percent of the entitlement of the district 2nd Instalment will consists of the balance 10 percent of the allocated amount and will be released only after the receipt of physical and financial progress report and expenditure statement for 60 percent of the 1st instalment. • Funds against annual plan for 2008-09 will be released only when the
district has utilized 100 percent of the funds released against annual plan of 2006-07 and achieved at least 75 percent physical and financial progress of the funds released against 2007-08 annual plan.
• While releasing the 1st installment of 2008-09, the amount of unspent balance out of the release of previous annul plan will be deducted.
• The balance funds for 2008-09 to be released on the receipts of physical and financial progress report for the full amount of 2007-08 and physical and financial progress report of at least 75 percent of the funds for 2008-09
• Under the capacity building component, the total release to a state
would be restricted to Rs. 3 crore per district till 2008-09 (as the scheme came into operation in 2006-07)
Note: In states and districts where Part IX and IX A of the Constitution do not apply or in Sixth Schedule areas the funds must be transferred to identified planning and implementing institutions without diversion or delay within 15 days of release.
Utilisation certificate /audited statement of expenditure
• Utilisation certificates are required to be submitted within one year of the release of funds in a prescribed format.
• Audit reports for the programme for the last year and submission of ATR should contain a certificate from the chartered accountant that while auditing the district account of the programme, he/she has taken into account the bank reconciliation statement and the accounts of all implementing agencies and that advances have not been treated as expenditure.
3.8.1 Utilisation in Selected States Figure 3.8.1
From all accounts including
departmental assessments, utilisation of
BRGF funds, particularly the
developmental grants, have been rather
poor. Figure 3.8.1 depicts utilisation
reported by the selected states against
their entitlements and releases during the
first three years of the Eleventh Plan. It
can be seen that the releases (linked to
actual utilisation in the previous year) are
substantially lower than entitlements and the actual expenditures (or utilisation) are
even lower. Given that there is no substantive matching requirement, the problem of
releases can only be a result of the states’ inability to meet the conditions for release of
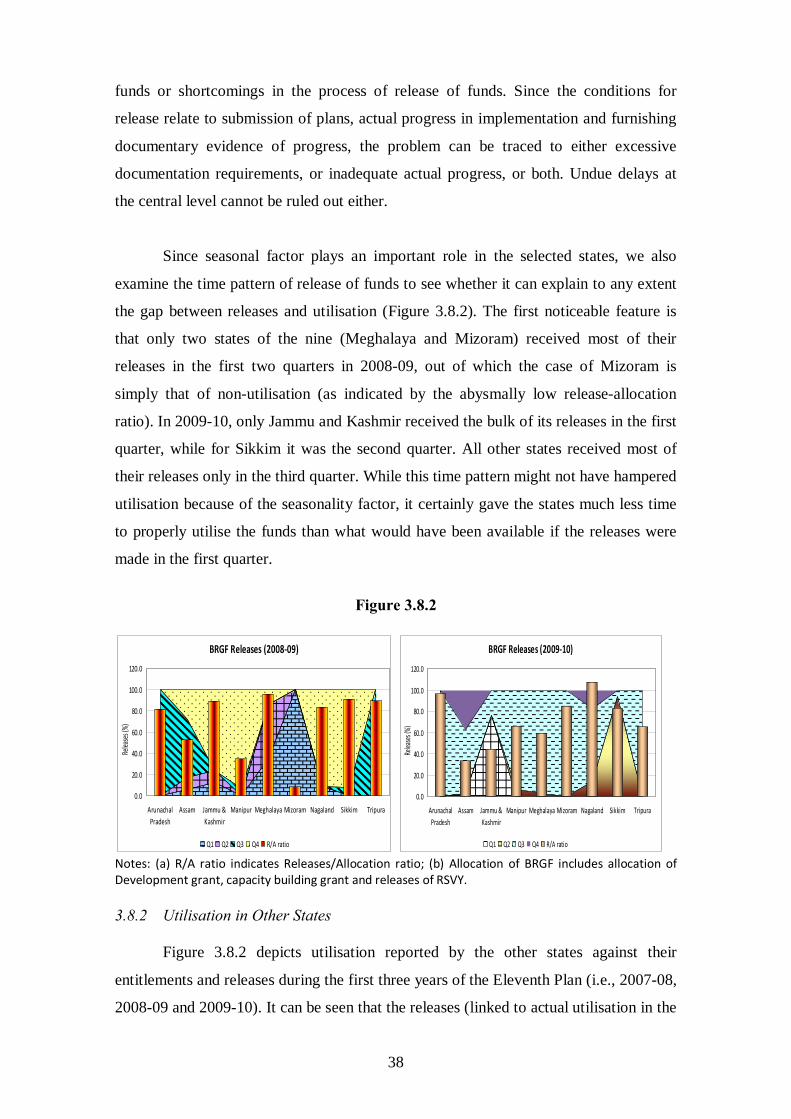
38
funds or shortcomings in the process of release of funds. Since the conditions for
release relate to submission of plans, actual progress in implementation and furnishing
documentary evidence of progress, the problem can be traced to either excessive
documentation requirements, or inadequate actual progress, or both. Undue delays at
the central level cannot be ruled out either.
Since seasonal factor plays an important role in the selected states, we also
examine the time pattern of release of funds to see whether it can explain to any extent
the gap between releases and utilisation (Figure 3.8.2). The first noticeable feature is
that only two states of the nine (Meghalaya and Mizoram) received most of their
releases in the first two quarters in 2008-09, out of which the case of Mizoram is
simply that of non-utilisation (as indicated by the abysmally low release-allocation
ratio). In 2009-10, only Jammu and Kashmir received the bulk of its releases in the first
quarter, while for Sikkim it was the second quarter. All other states received most of
their releases only in the third quarter. While this time pattern might not have hampered
utilisation because of the seasonality factor, it certainly gave the states much less time
to properly utilise the funds than what would have been available if the releases were
made in the first quarter.
Figure 3.8.2
BRGF Releases (2008-09)
0.0
20.0
40.0
60.0
80.0
100.0
120.0
ArunachalPradesh
Assam Jammu &Kashmir
Manipur Meghalaya Mizoram Nagaland Sikkim Tripura
Relea
ses (%
)
Q1 Q2 Q3 Q4 R/A ratio
BRGF Releases (2009-10)
0.0
20.0
40.0
60.0
80.0
100.0
120.0
ArunachalPradesh
Assam Jammu &Kashmir
Manipur Meghalaya Mizoram Nagaland Sikkim Tripura
Relea
ses (%
)
Q1 Q2 Q3 Q4 R/A ratio Notes: (a) R/A ratio indicates Releases/Allocation ratio; (b) Allocation of BRGF includes allocation of Development grant, capacity building grant and releases of RSVY. 3.8.2 Utilisation in Other States
Figure 3.8.2 depicts utilisation reported by the other states against their
entitlements and releases during the first three years of the Eleventh Plan (i.e., 2007-08,
2008-09 and 2009-10). It can be seen that the releases (linked to actual utilisation in the
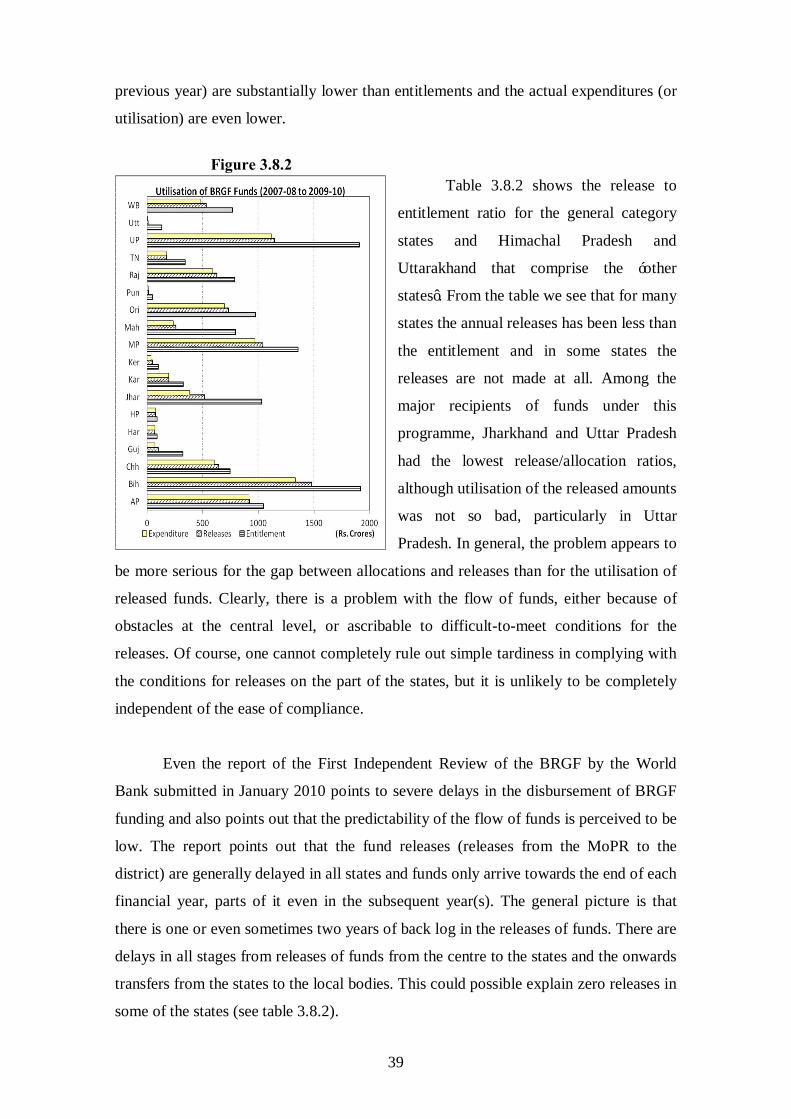
39
previous year) are substantially lower than entitlements and the actual expenditures (or
utilisation) are even lower.
Figure 3.8.2
Table 3.8.2 shows the release to
entitlement ratio for the general category
states and Himachal Pradesh and
Uttarakhand that comprise the ‘other
states’. From the table we see that for many
states the annual releases has been less than
the entitlement and in some states the
releases are not made at all. Among the
major recipients of funds under this
programme, Jharkhand and Uttar Pradesh
had the lowest release/allocation ratios,
although utilisation of the released amounts
was not so bad, particularly in Uttar
Pradesh. In general, the problem appears to
be more serious for the gap between allocations and releases than for the utilisation of
released funds. Clearly, there is a problem with the flow of funds, either because of
obstacles at the central level, or ascribable to difficult-to-meet conditions for the
releases. Of course, one cannot completely rule out simple tardiness in complying with
the conditions for releases on the part of the states, but it is unlikely to be completely
independent of the ease of compliance.
Even the report of the First Independent Review of the BRGF by the World
Bank submitted in January 2010 points to severe delays in the disbursement of BRGF
funding and also points out that the predictability of the flow of funds is perceived to be
low. The report points out that the fund releases (releases from the MoPR to the
district) are generally delayed in all states and funds only arrive towards the end of each
financial year, parts of it even in the subsequent year(s). The general picture is that
there is one or even sometimes two years of back log in the releases of funds. There are
delays in all stages from releases of funds from the centre to the states and the onwards
transfers from the states to the local bodies. This could possible explain zero releases in
some of the states (see table 3.8.2).
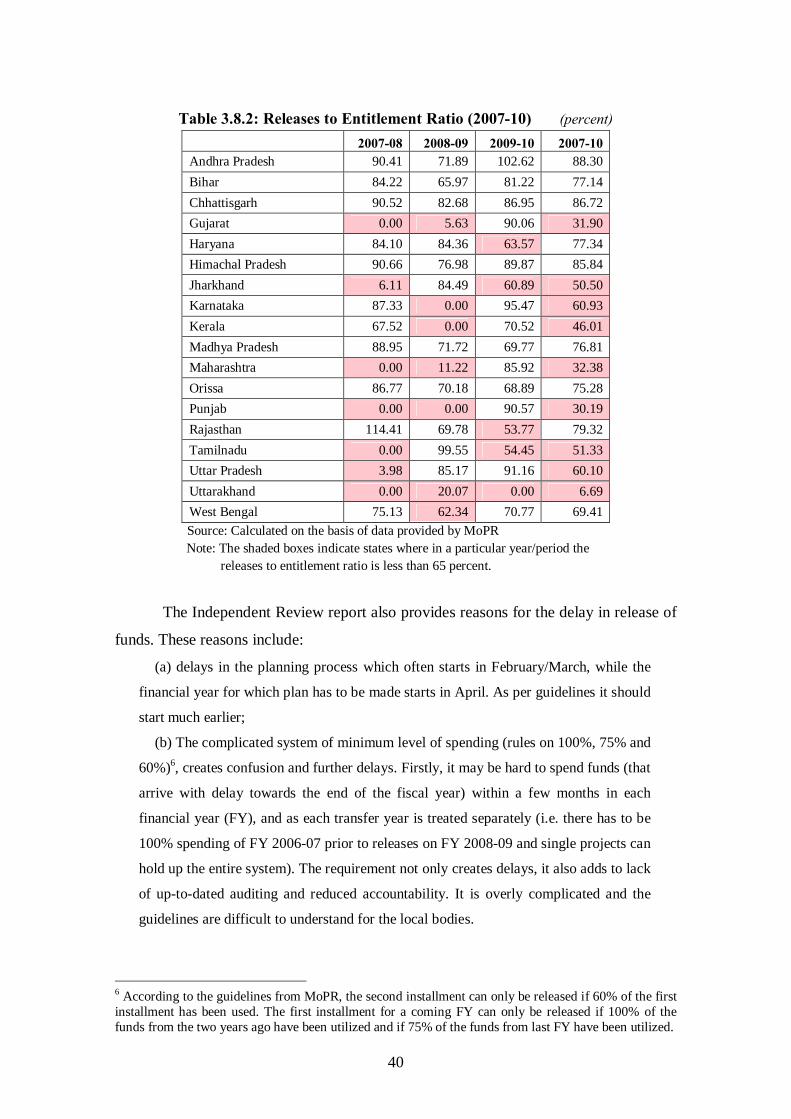
40
Table 3.8.2: Releases to Entitlement Ratio (2007-10) (percent) 2007-08 2008-09 2009-10 2007-10 Andhra Pradesh 90.41 71.89 102.62 88.30 Bihar 84.22 65.97 81.22 77.14 Chhattisgarh 90.52 82.68 86.95 86.72 Gujarat 0.00 5.63 90.06 31.90 Haryana 84.10 84.36 63.57 77.34 Himachal Pradesh 90.66 76.98 89.87 85.84 Jharkhand 6.11 84.49 60.89 50.50 Karnataka 87.33 0.00 95.47 60.93 Kerala 67.52 0.00 70.52 46.01 Madhya Pradesh 88.95 71.72 69.77 76.81 Maharashtra 0.00 11.22 85.92 32.38 Orissa 86.77 70.18 68.89 75.28 Punjab 0.00 0.00 90.57 30.19 Rajasthan 114.41 69.78 53.77 79.32 Tamilnadu 0.00 99.55 54.45 51.33 Uttar Pradesh 3.98 85.17 91.16 60.10 Uttarakhand 0.00 20.07 0.00 6.69 West Bengal 75.13 62.34 70.77 69.41
Source: Calculated on the basis of data provided by MoPR Note: The shaded boxes indicate states where in a particular year/period the
releases to entitlement ratio is less than 65 percent.
The Independent Review report also provides reasons for the delay in release of
funds. These reasons include:
(a) delays in the planning process which often starts in February/March, while the
financial year for which plan has to be made starts in April. As per guidelines it should
start much earlier;
(b) The complicated system of minimum level of spending (rules on 100%, 75% and
60%)6, creates confusion and further delays. Firstly, it may be hard to spend funds (that
arrive with delay towards the end of the fiscal year) within a few months in each
financial year (FY), and as each transfer year is treated separately (i.e. there has to be
100% spending of FY 2006-07 prior to releases on FY 2008-09 and single projects can
hold up the entire system). The requirement not only creates delays, it also adds to lack
of up-to-dated auditing and reduced accountability. It is overly complicated and the
guidelines are difficult to understand for the local bodies.
6 According to the guidelines from MoPR, the second installment can only be released if 60% of the first installment has been used. The first installment for a coming FY can only be released if 100% of the funds from the two years ago have been utilized and if 75% of the funds from last FY have been utilized.
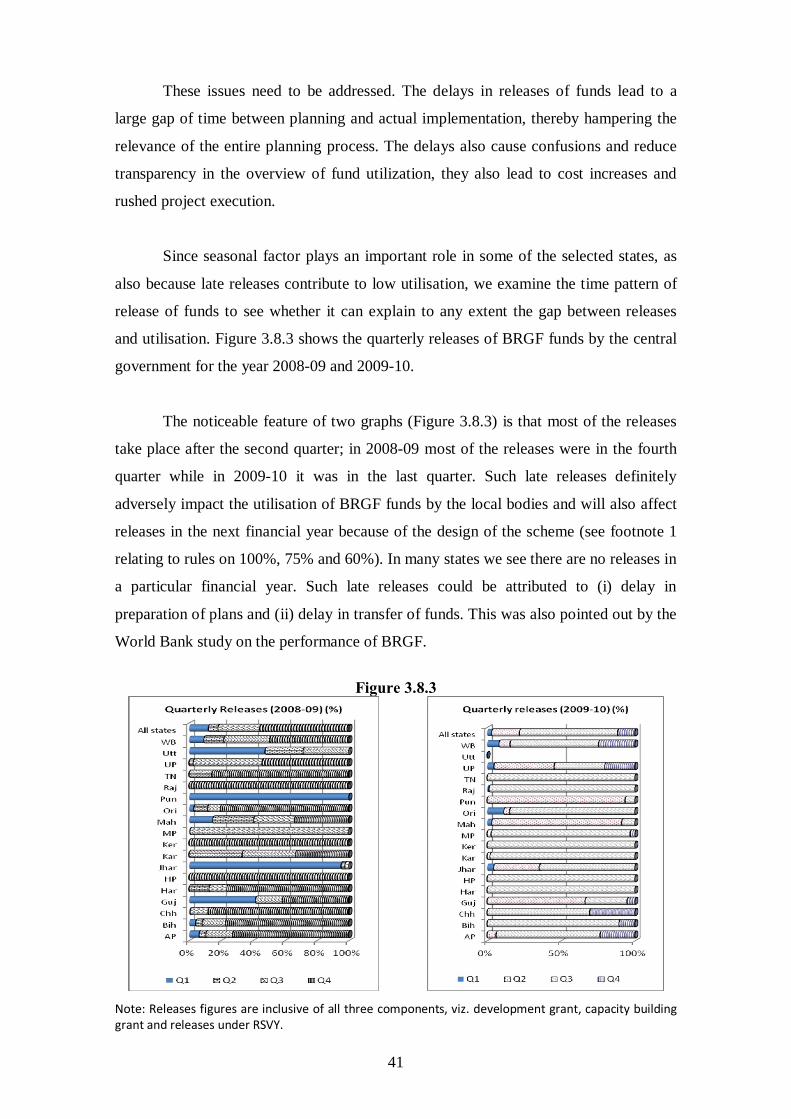
41
These issues need to be addressed. The delays in releases of funds lead to a
large gap of time between planning and actual implementation, thereby hampering the
relevance of the entire planning process. The delays also cause confusions and reduce
transparency in the overview of fund utilization, they also lead to cost increases and
rushed project execution.
Since seasonal factor plays an important role in some of the selected states, as
also because late releases contribute to low utilisation, we examine the time pattern of
release of funds to see whether it can explain to any extent the gap between releases
and utilisation. Figure 3.8.3 shows the quarterly releases of BRGF funds by the central
government for the year 2008-09 and 2009-10.
The noticeable feature of two graphs (Figure 3.8.3) is that most of the releases
take place after the second quarter; in 2008-09 most of the releases were in the fourth
quarter while in 2009-10 it was in the last quarter. Such late releases definitely
adversely impact the utilisation of BRGF funds by the local bodies and will also affect
releases in the next financial year because of the design of the scheme (see footnote 1
relating to rules on 100%, 75% and 60%). In many states we see there are no releases in
a particular financial year. Such late releases could be attributed to (i) delay in
preparation of plans and (ii) delay in transfer of funds. This was also pointed out by the
World Bank study on the performance of BRGF.
Figure 3.8.3
Note: Releases figures are inclusive of all three components, viz. development grant, capacity building grant and releases under RSVY.
42
On the strength of the admittedly limited examination of the issue at hand, it is
suggested that the process of preparing Annual plans for a financial year (say 2011-12,
which starts from 1 April 2011) should begin by July of the previous financial year
(i.e., July 2010) so that by the end of February 2011 these are approved and the funds
can be transferred and reach the bank accounts of the local bodies by end-May 2011
(i.e., in the 1st quarter). This will not only give adequate time for the local bodies to
utilise these funds efficiently but would also result in better utilisation of the available
BRGF funds, thereby addressing the development needs of the local bodies and
contributing to their capacity building.
The other suggestion pertains to the guidelines relating to release and utilisation
of funds. The whole issue of release of second installment only after 60 percent of the
funds released in the first installment has been used, and subsequent release first
installment for a coming fiscal year only after 100 percent utilization of funds released
two years ago and 75 percent utilization of the funds released in the last fiscal year
have created a lot of complication and confusion. It has affected the release of funds
and its utilization. It is recommended that this rule should be simplified in consultation
with all the stakeholders.
3.9. National Rural Health Mission (NRHM) (Ministry of Health and Family Welfare) This Mission is a central initiative to support and restructure health services in
such a way as to make it more effective, simultaneously broadening its coverage. Apart
from putting together a number of disease-specific programmes, the Mission has
several other components like strengthening healthcare infrastructure, making basic
health services available at the household level through female health workers,
promoting decentralisation of the system while maintaining a vertically integrated
structure, improving health services management and financing, and streamlining
health-related policy making. It envisages setting up of state and district level ‘Health
Missions’.
Central transfers are made to the state health missions, which are assisted every
year on the basis of approved annual work plan and budget (AWPB). The state level
AWPB in turn incorporates the district level AWPBs. The state level health mission is
43
expected to convey to the district missions their share of central assistance. All the nine
selected states considered in this report are among the special focus states under
NRHM. The key features of the transfer system under NRHM are given in Table 3.9.1.
Table 3.9.1: Key Features of Transfer System under NRHM
Name of Scheme
Centre – State Sharing Ratio
1st Instalment as per Guidelines
2nd Instalment as per Guidelines
Utilization Certificate Due Date
National Rural Health Mission
Current ratio: 85:15 Proposed in XII Plan – 75:25
By 15th May if plan is approved and less than 6 months’ balances remain in the SHC account; In addition, the state has to fulfil the Financial Management Indicators, including the sending of Financial Reports, Audit Reports and UCs, as also progress in achieving institutional process targets
By 15th November if audited accounts and UCs are submitted for the previous year and Statement of Expenditures for the first two quarters are provided
1st November of the following financial year
A priori examination of the system reveals that apart from the conditionalities to
be met by the recipient states, there are some possibilities of delays at the central level.
First, the system is crucially dependent upon approval of AWPB in time. Given the
right timeline for submissions and discussions, this would normally not be a problem,
but there can be cases requiring further details, disputes, procedural problems which
could derail the flow of funds. This is particularly probable because the quantum of
transfer is to be determined on the basis of achievement of output targets also. There is
clearly a possible trade-off between monitoring requirements and timeliness of releases.
3.9.1 Release of Funds and Utilisation in Selected States
Releases of funds under NRHM, on the whole, have been higher than initially
approved amounts for all the selected states during 2009-10, for which we obtained
data on quarterly releases. Figure 3.9.1 shows the pattern of releases by quarters during
the year along with the ratio of releases to approvals for the selected states. It is to be
noticed, however, that for some of the states, more than 40 percent of the releases were
made in the last quarter. For Assam, Manipur and Meghalaya this was the case, while
for Tripura, close to 40 percent was released only in the last quarter. In Meghalaya,
about half the releases were in the last quarter. As per the system, 50 percent of the
total releases should be in the first quarter; in none of the states, the releases are much
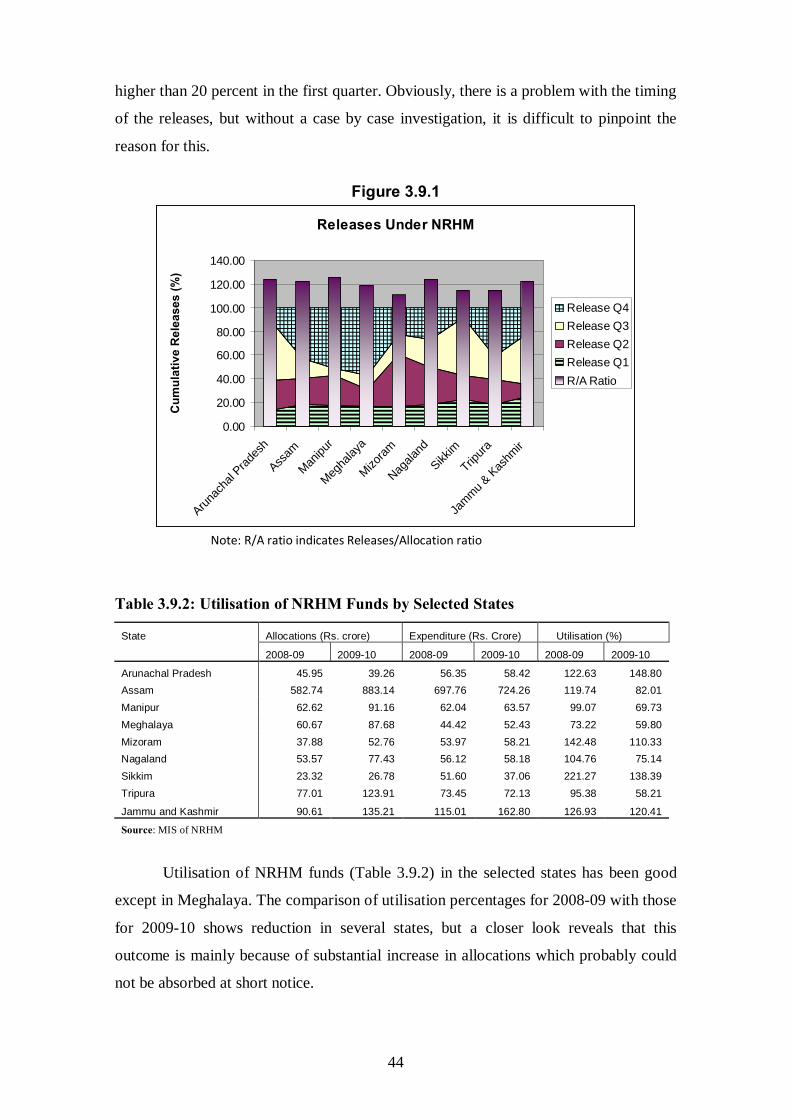
44
higher than 20 percent in the first quarter. Obviously, there is a problem with the timing
of the releases, but without a case by case investigation, it is difficult to pinpoint the
reason for this.
Figure 3.9.1
Releases Under NRHM
0.00
20.00
40.00
60.00
80.00
100.00
120.00
140.00
Arunac
hal P
rades
h
Assam
Manipu
r
Megha
laya
Mizoram
Nagala
nd
Sikkim
Tripura
Jammu &
Kas
hmir
Cum
ulat
ive
Rel
ease
s (%
)
Release Q4Release Q3Release Q2Release Q1R/A Ratio
Note: R/A ratio indicates Releases/Allocation ratio
Table 3.9.2: Utilisation of NRHM Funds by Selected States
State Allocations (Rs. crore) Expenditure (Rs. Crore) Utilisation (%)
2008-09 2009-10 2008-09 2009-10 2008-09 2009-10
Arunachal Pradesh 45.95 39.26 56.35 58.42 122.63 148.80 Assam 582.74 883.14 697.76 724.26 119.74 82.01 Manipur 62.62 91.16 62.04 63.57 99.07 69.73 Meghalaya 60.67 87.68 44.42 52.43 73.22 59.80 Mizoram 37.88 52.76 53.97 58.21 142.48 110.33 Nagaland 53.57 77.43 56.12 58.18 104.76 75.14 Sikkim 23.32 26.78 51.60 37.06 221.27 138.39 Tripura 77.01 123.91 73.45 72.13 95.38 58.21
Jammu and Kashmir 90.61 135.21 115.01 162.80 126.93 120.41
Source: MIS of NRHM
Utilisation of NRHM funds (Table 3.9.2) in the selected states has been good
except in Meghalaya. The comparison of utilisation percentages for 2008-09 with those
for 2009-10 shows reduction in several states, but a closer look reveals that this
outcome is mainly because of substantial increase in allocations which probably could
not be absorbed at short notice.
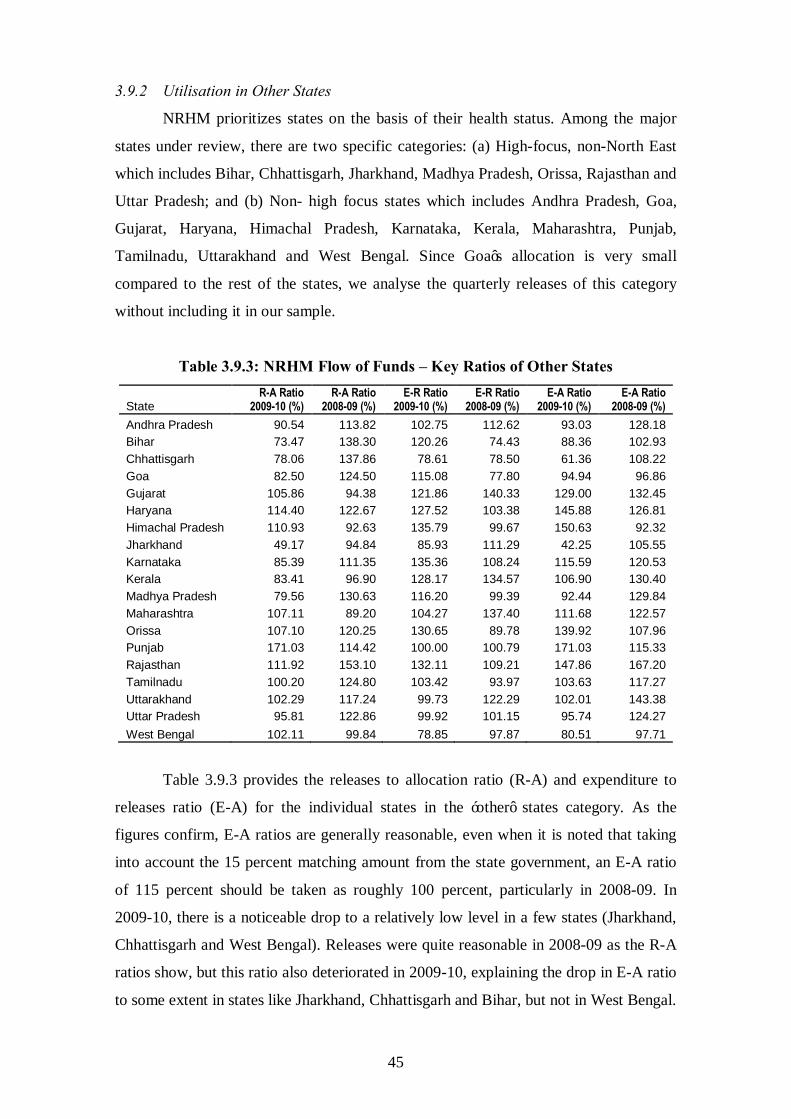
45
3.9.2 Utilisation in Other States
NRHM prioritizes states on the basis of their health status. Among the major
states under review, there are two specific categories: (a) High-focus, non-North East
which includes Bihar, Chhattisgarh, Jharkhand, Madhya Pradesh, Orissa, Rajasthan and
Uttar Pradesh; and (b) Non- high focus states which includes Andhra Pradesh, Goa,
Gujarat, Haryana, Himachal Pradesh, Karnataka, Kerala, Maharashtra, Punjab,
Tamilnadu, Uttarakhand and West Bengal. Since Goa’s allocation is very small
compared to the rest of the states, we analyse the quarterly releases of this category
without including it in our sample.
Table 3.9.3: NRHM Flow of Funds – Key Ratios of Other States
State R-A Ratio
2009-10 (%) R-A Ratio
2008-09 (%) E-R Ratio
2009-10 (%) E-R Ratio
2008-09 (%) E-A Ratio
2009-10 (%) E-A Ratio
2008-09 (%) Andhra Pradesh 90.54 113.82 102.75 112.62 93.03 128.18 Bihar 73.47 138.30 120.26 74.43 88.36 102.93 Chhattisgarh 78.06 137.86 78.61 78.50 61.36 108.22 Goa 82.50 124.50 115.08 77.80 94.94 96.86 Gujarat 105.86 94.38 121.86 140.33 129.00 132.45 Haryana 114.40 122.67 127.52 103.38 145.88 126.81 Himachal Pradesh 110.93 92.63 135.79 99.67 150.63 92.32 Jharkhand 49.17 94.84 85.93 111.29 42.25 105.55 Karnataka 85.39 111.35 135.36 108.24 115.59 120.53 Kerala 83.41 96.90 128.17 134.57 106.90 130.40 Madhya Pradesh 79.56 130.63 116.20 99.39 92.44 129.84 Maharashtra 107.11 89.20 104.27 137.40 111.68 122.57 Orissa 107.10 120.25 130.65 89.78 139.92 107.96 Punjab 171.03 114.42 100.00 100.79 171.03 115.33 Rajasthan 111.92 153.10 132.11 109.21 147.86 167.20 Tamilnadu 100.20 124.80 103.42 93.97 103.63 117.27 Uttarakhand 102.29 117.24 99.73 122.29 102.01 143.38 Uttar Pradesh 95.81 122.86 99.92 101.15 95.74 124.27 West Bengal 102.11 99.84 78.85 97.87 80.51 97.71
Table 3.9.3 provides the releases to allocation ratio (R-A) and expenditure to
releases ratio (E-A) for the individual states in the ‘other’ states category. As the
figures confirm, E-A ratios are generally reasonable, even when it is noted that taking
into account the 15 percent matching amount from the state government, an E-A ratio
of 115 percent should be taken as roughly 100 percent, particularly in 2008-09. In
2009-10, there is a noticeable drop to a relatively low level in a few states (Jharkhand,
Chhattisgarh and West Bengal). Releases were quite reasonable in 2008-09 as the R-A
ratios show, but this ratio also deteriorated in 2009-10, explaining the drop in E-A ratio
to some extent in states like Jharkhand, Chhattisgarh and Bihar, but not in West Bengal.
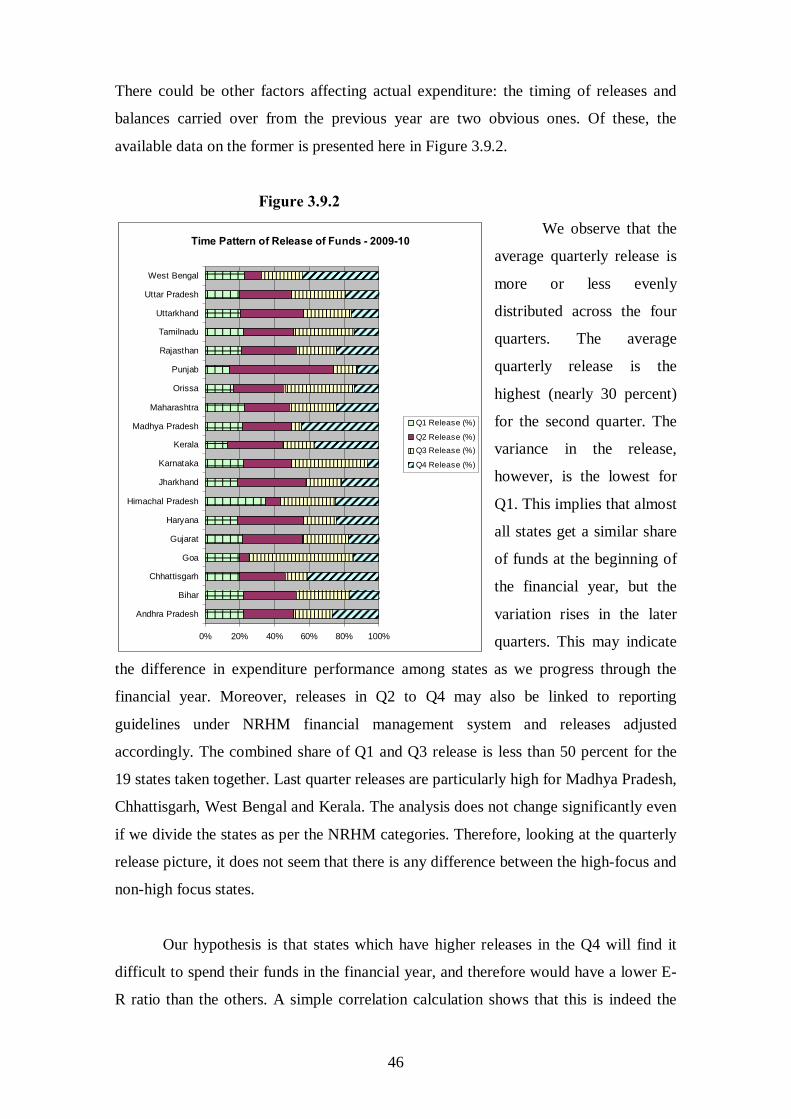
46
Time Pattern of Release of Funds - 2009-10
0% 20% 40% 60% 80% 100%
Andhra Pradesh
Bihar
Chhattisgarh
Goa
Gujarat
Haryana
Himachal Pradesh
Jharkhand
Karnataka
Kerala
Madhya Pradesh
Maharashtra
Orissa
Punjab
Rajasthan
Tamilnadu
Uttarkhand
Uttar Pradesh
West Bengal
Q1 Release (%)
Q2 Release (%)Q3 Release (%)
Q4 Release (%)
There could be other factors affecting actual expenditure: the timing of releases and
balances carried over from the previous year are two obvious ones. Of these, the
available data on the former is presented here in Figure 3.9.2.
Figure 3.9.2
We observe that the
average quarterly release is
more or less evenly
distributed across the four
quarters. The average
quarterly release is the
highest (nearly 30 percent)
for the second quarter. The
variance in the release,
however, is the lowest for
Q1. This implies that almost
all states get a similar share
of funds at the beginning of
the financial year, but the
variation rises in the later
quarters. This may indicate
the difference in expenditure performance among states as we progress through the
financial year. Moreover, releases in Q2 to Q4 may also be linked to reporting
guidelines under NRHM financial management system and releases adjusted
accordingly. The combined share of Q1 and Q3 release is less than 50 percent for the
19 states taken together. Last quarter releases are particularly high for Madhya Pradesh,
Chhattisgarh, West Bengal and Kerala. The analysis does not change significantly even
if we divide the states as per the NRHM categories. Therefore, looking at the quarterly
release picture, it does not seem that there is any difference between the high-focus and
non-high focus states.
Our hypothesis is that states which have higher releases in the Q4 will find it
difficult to spend their funds in the financial year, and therefore would have a lower E-
R ratio than the others. A simple correlation calculation shows that this is indeed the
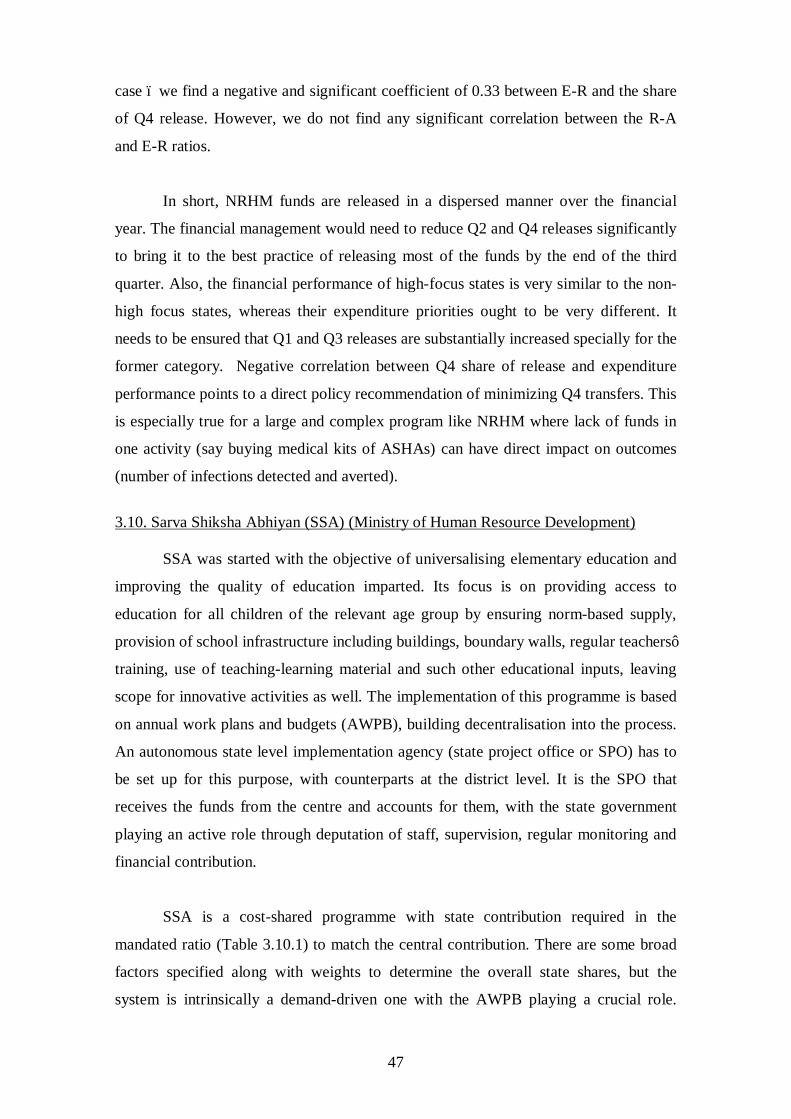
47
case – we find a negative and significant coefficient of 0.33 between E-R and the share
of Q4 release. However, we do not find any significant correlation between the R-A
and E-R ratios.
In short, NRHM funds are released in a dispersed manner over the financial
year. The financial management would need to reduce Q2 and Q4 releases significantly
to bring it to the best practice of releasing most of the funds by the end of the third
quarter. Also, the financial performance of high-focus states is very similar to the non-
high focus states, whereas their expenditure priorities ought to be very different. It
needs to be ensured that Q1 and Q3 releases are substantially increased specially for the
former category. Negative correlation between Q4 share of release and expenditure
performance points to a direct policy recommendation of minimizing Q4 transfers. This
is especially true for a large and complex program like NRHM where lack of funds in
one activity (say buying medical kits of ASHAs) can have direct impact on outcomes
(number of infections detected and averted).
3.10. Sarva Shiksha Abhiyan (SSA) (Ministry of Human Resource Development) SSA was started with the objective of universalising elementary education and
improving the quality of education imparted. Its focus is on providing access to
education for all children of the relevant age group by ensuring norm-based supply,
provision of school infrastructure including buildings, boundary walls, regular teachers’
training, use of teaching-learning material and such other educational inputs, leaving
scope for innovative activities as well. The implementation of this programme is based
on annual work plans and budgets (AWPB), building decentralisation into the process.
An autonomous state level implementation agency (state project office or SPO) has to
be set up for this purpose, with counterparts at the district level. It is the SPO that
receives the funds from the centre and accounts for them, with the state government
playing an active role through deputation of staff, supervision, regular monitoring and
financial contribution.
SSA is a cost-shared programme with state contribution required in the
mandated ratio (Table 3.10.1) to match the central contribution. There are some broad
factors specified along with weights to determine the overall state shares, but the
system is intrinsically a demand-driven one with the AWPB playing a crucial role.
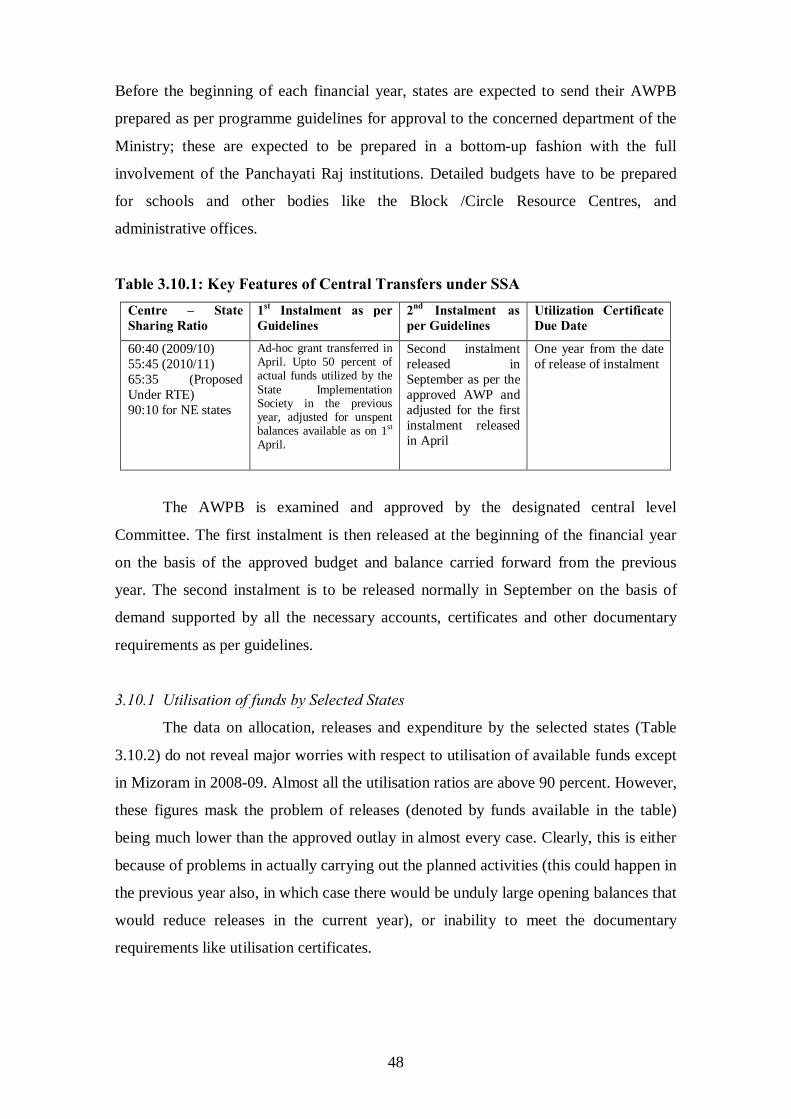
48
Before the beginning of each financial year, states are expected to send their AWPB
prepared as per programme guidelines for approval to the concerned department of the
Ministry; these are expected to be prepared in a bottom-up fashion with the full
involvement of the Panchayati Raj institutions. Detailed budgets have to be prepared
for schools and other bodies like the Block /Circle Resource Centres, and
administrative offices.
Table 3.10.1: Key Features of Central Transfers under SSA
The AWPB is examined and approved by the designated central level
Committee. The first instalment is then released at the beginning of the financial year
on the basis of the approved budget and balance carried forward from the previous
year. The second instalment is to be released normally in September on the basis of
demand supported by all the necessary accounts, certificates and other documentary
requirements as per guidelines.
3.10.1 Utilisation of funds by Selected States
The data on allocation, releases and expenditure by the selected states (Table
3.10.2) do not reveal major worries with respect to utilisation of available funds except
in Mizoram in 2008-09. Almost all the utilisation ratios are above 90 percent. However,
these figures mask the problem of releases (denoted by funds available in the table)
being much lower than the approved outlay in almost every case. Clearly, this is either
because of problems in actually carrying out the planned activities (this could happen in
the previous year also, in which case there would be unduly large opening balances that
would reduce releases in the current year), or inability to meet the documentary
requirements like utilisation certificates.
Centre – State Sharing Ratio
1st Instalment as per Guidelines
2nd Instalment as per Guidelines
Utilization Certificate Due Date
60:40 (2009/10) 55:45 (2010/11) 65:35 (Proposed Under RTE) 90:10 for NE states
Ad-hoc grant transferred in April. Upto 50 percent of actual funds utilized by the State Implementation Society in the previous year, adjusted for unspent balances available as on 1st April.
Second instalment released in September as per the approved AWP and adjusted for the first instalment released in April
One year from the date of release of instalment
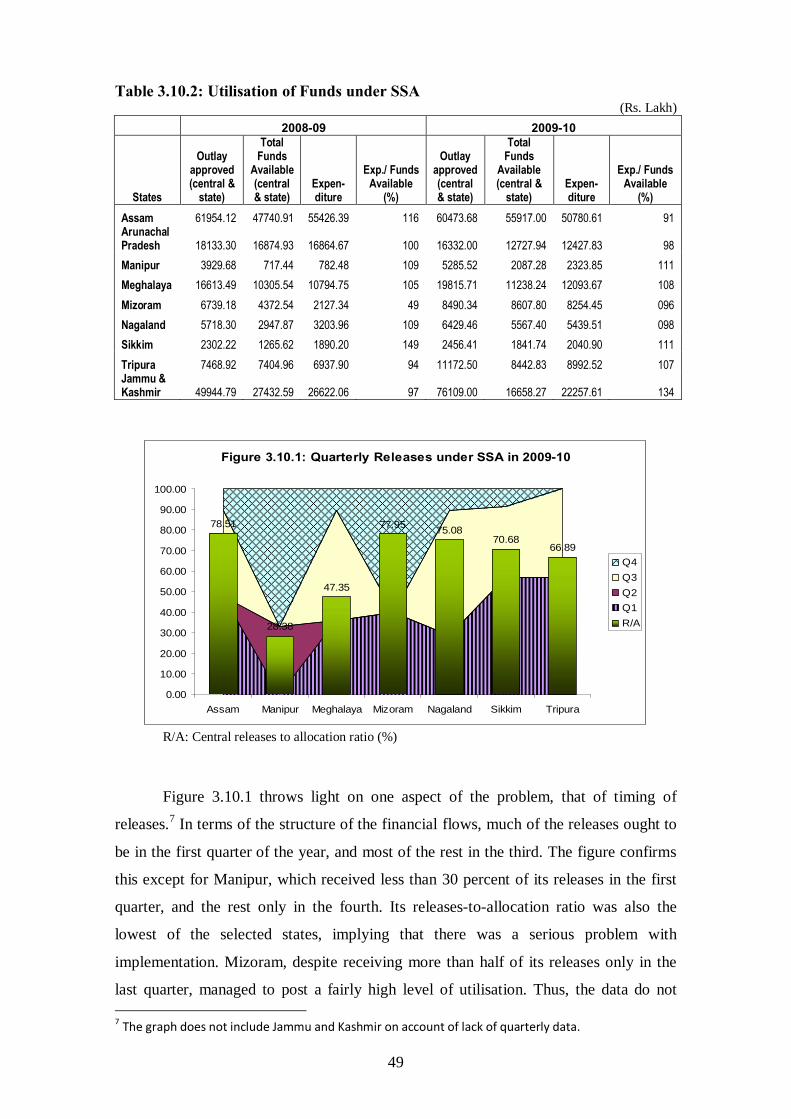
49
Table 3.10.2: Utilisation of Funds under SSA (Rs. Lakh)
2008-09 2009-10
States
Outlay approved (central &
state)
Total Funds
Available (central & state)
Expen-diture
Exp./ Funds Available
(%)
Outlay approved (central & state)
Total Funds
Available (central &
state) Expen-diture
Exp./ Funds Available
(%) Assam 61954.12 47740.91 55426.39 116 60473.68 55917.00 50780.61 91 Arunachal Pradesh 18133.30 16874.93 16864.67 100 16332.00 12727.94 12427.83 98 Manipur 3929.68 717.44 782.48 109 5285.52 2087.28 2323.85 111 Meghalaya 16613.49 10305.54 10794.75 105 19815.71 11238.24 12093.67 108 Mizoram 6739.18 4372.54 2127.34 49 8490.34 8607.80 8254.45 096 Nagaland 5718.30 2947.87 3203.96 109 6429.46 5567.40 5439.51 098 Sikkim 2302.22 1265.62 1890.20 149 2456.41 1841.74 2040.90 111 Tripura 7468.92 7404.96 6937.90 94 11172.50 8442.83 8992.52 107 Jammu & Kashmir 49944.79 27432.59 26622.06 97 76109.00 16658.27 22257.61 134
Figure 3.10.1: Quarterly Releases under SSA in 2009-10
78.51
28.38
47.35
77.95 75.0870.68
66.89
0.00
10.00
20.00
30.00
40.00
50.00
60.00
70.00
80.00
90.00
100.00
Assam Manipur Meghalaya Mizoram Nagaland Sikkim Tripura
Q4Q3Q2Q1R/A
R/A: Central releases to allocation ratio (%)
Figure 3.10.1 throws light on one aspect of the problem, that of timing of
releases.7 In terms of the structure of the financial flows, much of the releases ought to
be in the first quarter of the year, and most of the rest in the third. The figure confirms
this except for Manipur, which received less than 30 percent of its releases in the first
quarter, and the rest only in the fourth. Its releases-to-allocation ratio was also the
lowest of the selected states, implying that there was a serious problem with
implementation. Mizoram, despite receiving more than half of its releases only in the
last quarter, managed to post a fairly high level of utilisation. Thus, the data do not 7 The graph does not include Jammu and Kashmir on account of lack of quarterly data.
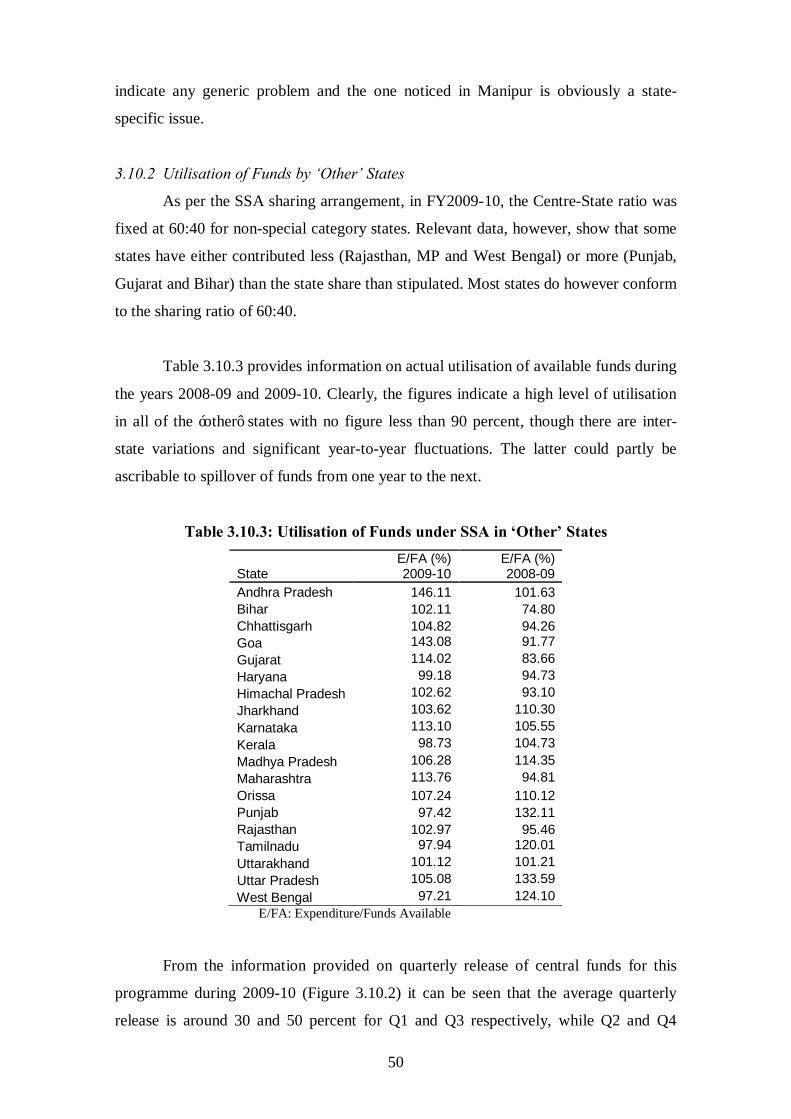
50
indicate any generic problem and the one noticed in Manipur is obviously a state-
specific issue.
3.10.2 Utilisation of Funds by ‘Other’ States
As per the SSA sharing arrangement, in FY2009-10, the Centre-State ratio was
fixed at 60:40 for non-special category states. Relevant data, however, show that some
states have either contributed less (Rajasthan, MP and West Bengal) or more (Punjab,
Gujarat and Bihar) than the state share than stipulated. Most states do however conform
to the sharing ratio of 60:40.
Table 3.10.3 provides information on actual utilisation of available funds during
the years 2008-09 and 2009-10. Clearly, the figures indicate a high level of utilisation
in all of the ‘other’ states with no figure less than 90 percent, though there are inter-
state variations and significant year-to-year fluctuations. The latter could partly be
ascribable to spillover of funds from one year to the next.
Table 3.10.3: Utilisation of Funds under SSA in ‘Other’ States
State E/FA (%) 2009-10
E/FA (%) 2008-09
Andhra Pradesh 146.11 101.63 Bihar 102.11 74.80 Chhattisgarh 104.82 94.26 Goa 143.08 91.77 Gujarat 114.02 83.66 Haryana 99.18 94.73 Himachal Pradesh 102.62 93.10 Jharkhand 103.62 110.30 Karnataka 113.10 105.55 Kerala 98.73 104.73 Madhya Pradesh 106.28 114.35 Maharashtra 113.76 94.81 Orissa 107.24 110.12 Punjab 97.42 132.11 Rajasthan 102.97 95.46 Tamilnadu 97.94 120.01 Uttarakhand 101.12 101.21 Uttar Pradesh 105.08 133.59 West Bengal 97.21 124.10
E/FA: Expenditure/Funds Available
From the information provided on quarterly release of central funds for this
programme during 2009-10 (Figure 3.10.2) it can be seen that the average quarterly
release is around 30 and 50 percent for Q1 and Q3 respectively, while Q2 and Q4
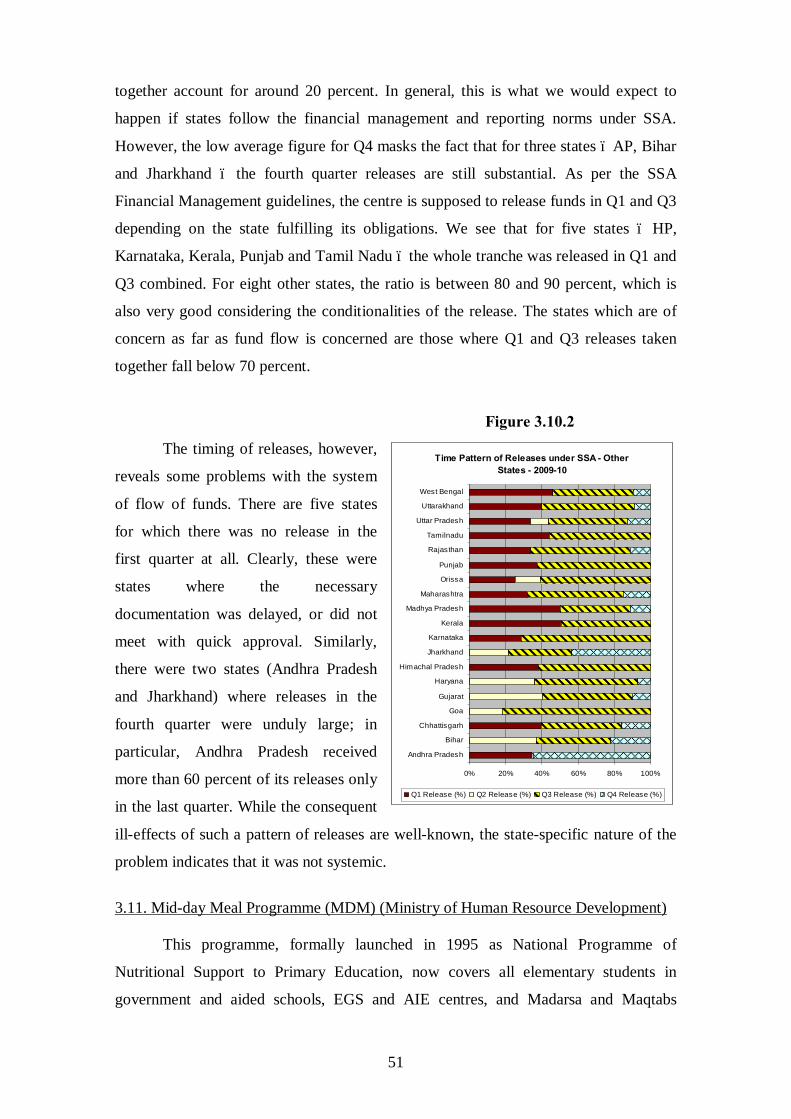
51
Time Pattern of Releases under SSA - Other States - 2009-10
0% 20% 40% 60% 80% 100%
Andhra Pradesh
Bihar
Chhattisgarh
Goa
Gujarat
Haryana
Himachal Pradesh
Jharkhand
Karnataka
Kerala
Madhya Pradesh
Maharashtra
Orissa
Punjab
Rajasthan
Tamilnadu
Uttar Pradesh
Uttarakhand
West Bengal
Q1 Release (%) Q2 Release (%) Q3 Release (%) Q4 Release (%)
together account for around 20 percent. In general, this is what we would expect to
happen if states follow the financial management and reporting norms under SSA.
However, the low average figure for Q4 masks the fact that for three states – AP, Bihar
and Jharkhand – the fourth quarter releases are still substantial. As per the SSA
Financial Management guidelines, the centre is supposed to release funds in Q1 and Q3
depending on the state fulfilling its obligations. We see that for five states – HP,
Karnataka, Kerala, Punjab and Tamil Nadu – the whole tranche was released in Q1 and
Q3 combined. For eight other states, the ratio is between 80 and 90 percent, which is
also very good considering the conditionalities of the release. The states which are of
concern as far as fund flow is concerned are those where Q1 and Q3 releases taken
together fall below 70 percent.
Figure 3.10.2
The timing of releases, however,
reveals some problems with the system
of flow of funds. There are five states
for which there was no release in the
first quarter at all. Clearly, these were
states where the necessary
documentation was delayed, or did not
meet with quick approval. Similarly,
there were two states (Andhra Pradesh
and Jharkhand) where releases in the
fourth quarter were unduly large; in
particular, Andhra Pradesh received
more than 60 percent of its releases only
in the last quarter. While the consequent
ill-effects of such a pattern of releases are well-known, the state-specific nature of the
problem indicates that it was not systemic.
3.11. Mid-day Meal Programme (MDM) (Ministry of Human Resource Development) This programme, formally launched in 1995 as National Programme of
Nutritional Support to Primary Education, now covers all elementary students in
government and aided schools, EGS and AIE centres, and Madarsa and Maqtabs
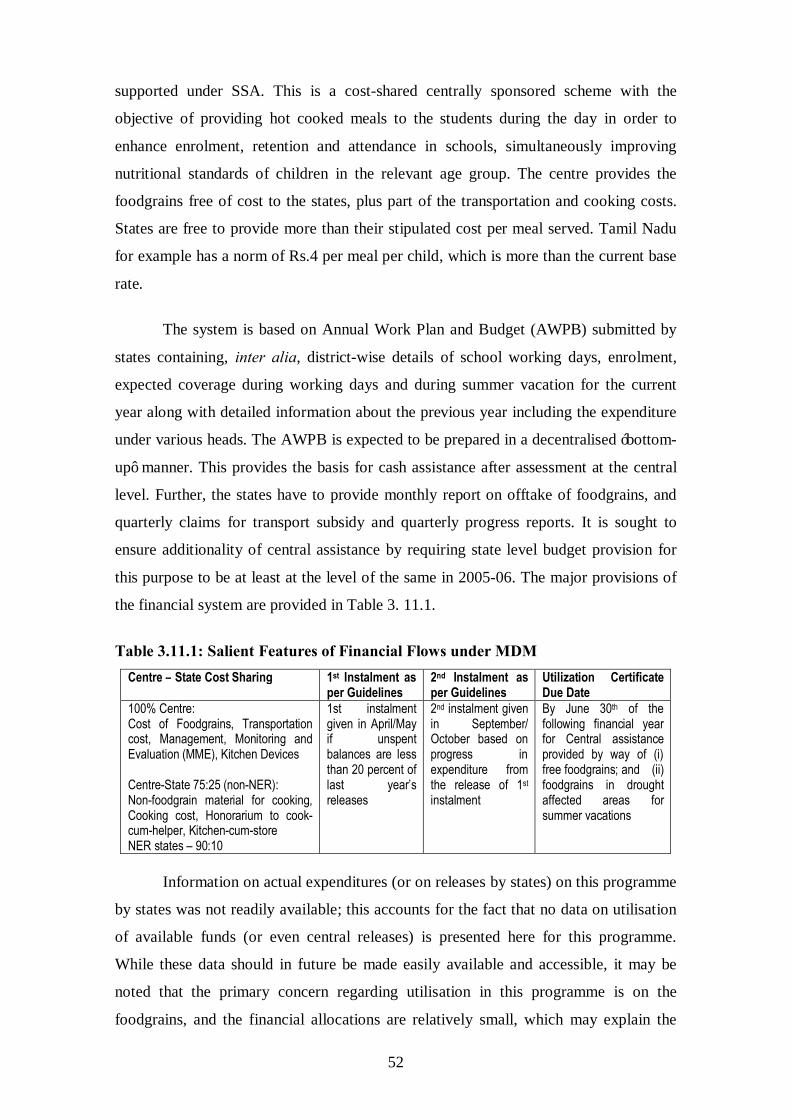
52
supported under SSA. This is a cost-shared centrally sponsored scheme with the
objective of providing hot cooked meals to the students during the day in order to
enhance enrolment, retention and attendance in schools, simultaneously improving
nutritional standards of children in the relevant age group. The centre provides the
foodgrains free of cost to the states, plus part of the transportation and cooking costs.
States are free to provide more than their stipulated cost per meal served. Tamil Nadu
for example has a norm of Rs.4 per meal per child, which is more than the current base
rate.
The system is based on Annual Work Plan and Budget (AWPB) submitted by
states containing, inter alia, district-wise details of school working days, enrolment,
expected coverage during working days and during summer vacation for the current
year along with detailed information about the previous year including the expenditure
under various heads. The AWPB is expected to be prepared in a decentralised ‘bottom-
up’ manner. This provides the basis for cash assistance after assessment at the central
level. Further, the states have to provide monthly report on offtake of foodgrains, and
quarterly claims for transport subsidy and quarterly progress reports. It is sought to
ensure additionality of central assistance by requiring state level budget provision for
this purpose to be at least at the level of the same in 2005-06. The major provisions of
the financial system are provided in Table 3. 11.1.
Table 3.11.1: Salient Features of Financial Flows under MDM
Information on actual expenditures (or on releases by states) on this programme
by states was not readily available; this accounts for the fact that no data on utilisation
of available funds (or even central releases) is presented here for this programme.
While these data should in future be made easily available and accessible, it may be
noted that the primary concern regarding utilisation in this programme is on the
foodgrains, and the financial allocations are relatively small, which may explain the
Centre – State Cost Sharing 1st Instalment as per Guidelines
2nd Instalment as per Guidelines
Utilization Certificate Due Date
100% Centre: Cost of Foodgrains, Transportation cost, Management, Monitoring and Evaluation (MME), Kitchen Devices Centre-State 75:25 (non-NER): Non-foodgrain material for cooking, Cooking cost, Honorarium to cook-cum-helper, Kitchen-cum-store NER states – 90:10
1st instalment given in April/May if unspent balances are less than 20 percent of last year’s releases
2nd instalment given in September/ October based on progress in expenditure from the release of 1st instalment
By June 30th of the following financial year for Central assistance provided by way of (i) free foodgrains; and (ii) foodgrains in drought affected areas for summer vacations
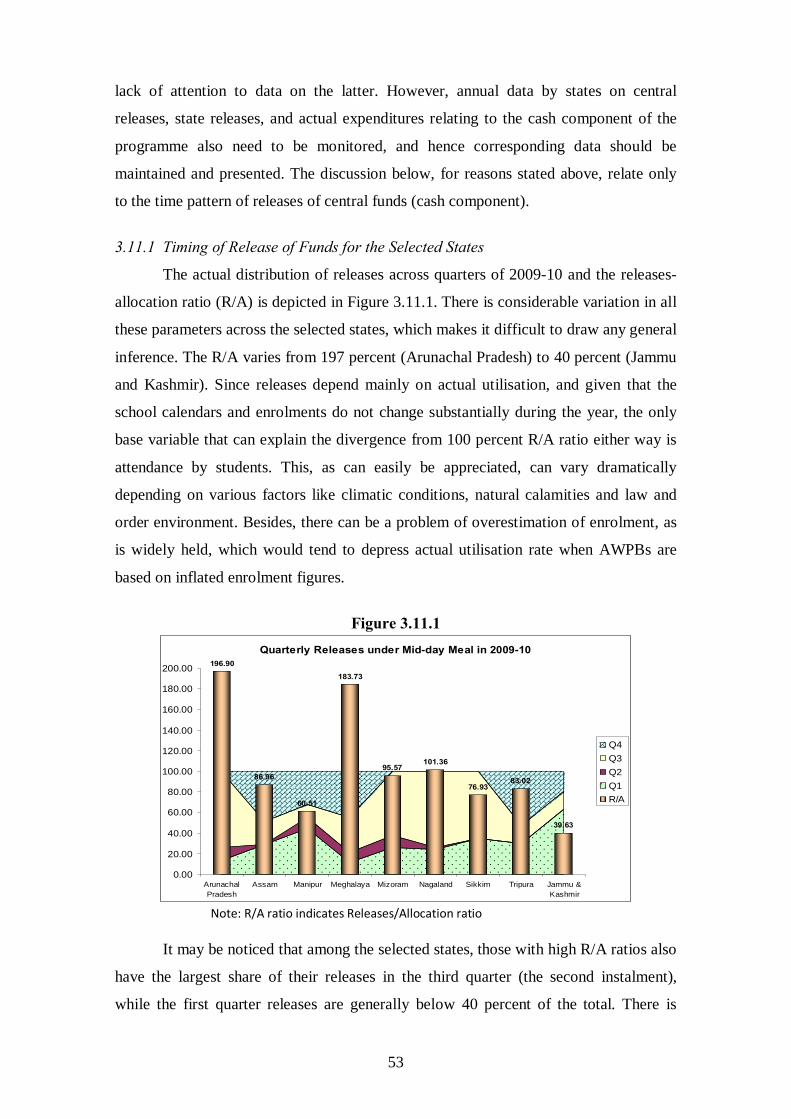
53
lack of attention to data on the latter. However, annual data by states on central
releases, state releases, and actual expenditures relating to the cash component of the
programme also need to be monitored, and hence corresponding data should be
maintained and presented. The discussion below, for reasons stated above, relate only
to the time pattern of releases of central funds (cash component).
3.11.1 Timing of Release of Funds for the Selected States
The actual distribution of releases across quarters of 2009-10 and the releases-
allocation ratio (R/A) is depicted in Figure 3.11.1. There is considerable variation in all
these parameters across the selected states, which makes it difficult to draw any general
inference. The R/A varies from 197 percent (Arunachal Pradesh) to 40 percent (Jammu
and Kashmir). Since releases depend mainly on actual utilisation, and given that the
school calendars and enrolments do not change substantially during the year, the only
base variable that can explain the divergence from 100 percent R/A ratio either way is
attendance by students. This, as can easily be appreciated, can vary dramatically
depending on various factors like climatic conditions, natural calamities and law and
order environment. Besides, there can be a problem of overestimation of enrolment, as
is widely held, which would tend to depress actual utilisation rate when AWPBs are
based on inflated enrolment figures.
Figure 3.11.1
Quarterly Releases under Mid-day Meal in 2009-10196.90
86.96
60.51
183.73
95.57101.36
76.9383.02
39.63
0.00
20.00
40.00
60.00
80.00
100.00
120.00
140.00
160.00
180.00
200.00
ArunachalPradesh
Assam Manipur Meghalaya Mizoram Nagaland Sikkim Tripura Jammu &Kashmir
Q4Q3Q2Q1R/A
Note: R/A ratio indicates Releases/Allocation ratio It may be noticed that among the selected states, those with high R/A ratios also
have the largest share of their releases in the third quarter (the second instalment),
while the first quarter releases are generally below 40 percent of the total. There is
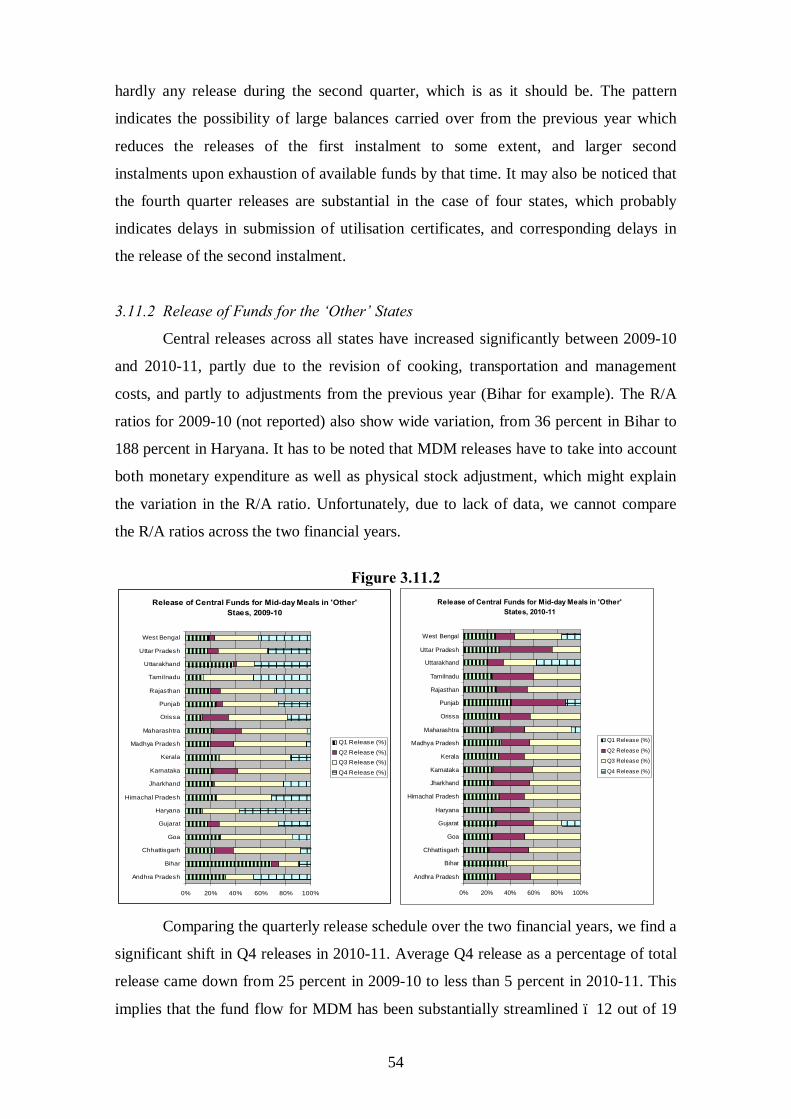
54
hardly any release during the second quarter, which is as it should be. The pattern
indicates the possibility of large balances carried over from the previous year which
reduces the releases of the first instalment to some extent, and larger second
instalments upon exhaustion of available funds by that time. It may also be noticed that
the fourth quarter releases are substantial in the case of four states, which probably
indicates delays in submission of utilisation certificates, and corresponding delays in
the release of the second instalment.
3.11.2 Release of Funds for the ‘Other’ States
Central releases across all states have increased significantly between 2009-10
and 2010-11, partly due to the revision of cooking, transportation and management
costs, and partly to adjustments from the previous year (Bihar for example). The R/A
ratios for 2009-10 (not reported) also show wide variation, from 36 percent in Bihar to
188 percent in Haryana. It has to be noted that MDM releases have to take into account
both monetary expenditure as well as physical stock adjustment, which might explain
the variation in the R/A ratio. Unfortunately, due to lack of data, we cannot compare
the R/A ratios across the two financial years.
Figure 3.11.2
Release of Central Funds for Mid-day Meals in 'Other' Staes, 2009-10
0% 20% 40% 60% 80% 100%
Andhra Pradesh
Bihar
Chhattisgarh
Goa
Gujarat
Haryana
Himachal Pradesh
Jharkhand
Karnataka
Kerala
Madhya Pradesh
Maharashtra
Orissa
Punjab
Rajasthan
Tamilnadu
Uttarakhand
Uttar Pradesh
West Bengal
Q1 Release (%)
Q2 Release (%)Q3 Release (%)
Q4 Release (%)
Release of Central Funds for Mid-day Meals in 'Other' States, 2010-11
0% 20% 40% 60% 80% 100%
Andhra Pradesh
Bihar
Chhattisgarh
Goa
Gujarat
Haryana
Himachal Pradesh
Jharkhand
Karnataka
Kerala
Madhya Pradesh
Maharashtra
Orissa
Punjab
Rajasthan
Tamilnadu
Uttarakhand
Uttar Pradesh
West Bengal
Q1 Release (%)
Q2 Release (%)
Q3 Release (%)
Q4 Release (%)
Comparing the quarterly release schedule over the two financial years, we find a
significant shift in Q4 releases in 2010-11. Average Q4 release as a percentage of total
release came down from 25 percent in 2009-10 to less than 5 percent in 2010-11. This
implies that the fund flow for MDM has been substantially streamlined – 12 out of 19
55
states got their full release from the centre by Q3 in 2010-11. Only Uttarakhand in this
group of states had a large last quarter release (almost 40 percent of the total). In 2009-
10, there were 5 states with more than 40 percent release in the last quarter. It is to be
hoped that that this improvement in the timing of releases would continue in future.
3.12. Integrated Child Development Services (ICDS) (Ministry of Women and Child Development) ICDS is a scheme meant to deliver a comprehensive package of services for
child development across the country, the target age group being 0-6 years. The
package consists of supplementary nutrition, basic health and informal pre-school
education services. To facilitate achievement of the primary objective, pregnant and
lactating mothers are also provided the nutrition and health services, while women in
the age group 15-45 are provided education on nutrition and health to help them take
better-informed decisions/action. Immunisation, health check-up and referral services
that constitute the basic health services package are delivered through the Ministry of
Health and Family Welfare. The coverage is not limited to BPL households. The non-
medical services are delivered through a chain of Aanganwadi or mother and child
centres.
ICDS is a cost-shared scheme of the central government the funding pattern of
which has undergone a change in 2009-10. Before that, the supplementary nutrition
scheme was funded 50:50 by the centre and states, with the centre picking up the cost
of the rest of the scheme. From 2009-10, the North-Eastern states have to share the cost
of supplementary nutrition at 10 percent only (no change for other states), while the
100 percent funding by the centre for other components has been reduced to 90 percent.
The system is driven by the population norms for projects (often block level),
Aanganwadi centres (or AWC) and mini-AWCs. Individual beneficiaries are expected
to be registered. States present annual requirements on the basis of registered
beneficiaries and prevalent norms for existing projects/AWCs/mini-AWCs, as also to
establish new ones. After assessment, releases are made on the basis of approved
requirements in two instalments, as is usual. Foodgrains are allocated to states at prices
applicable for BPL population on demand from the states under this scheme. Releases
of instalments are subject to usual conditions of actual progress and submission of
prescribed documents like expenditure statements and utilisation certificates.
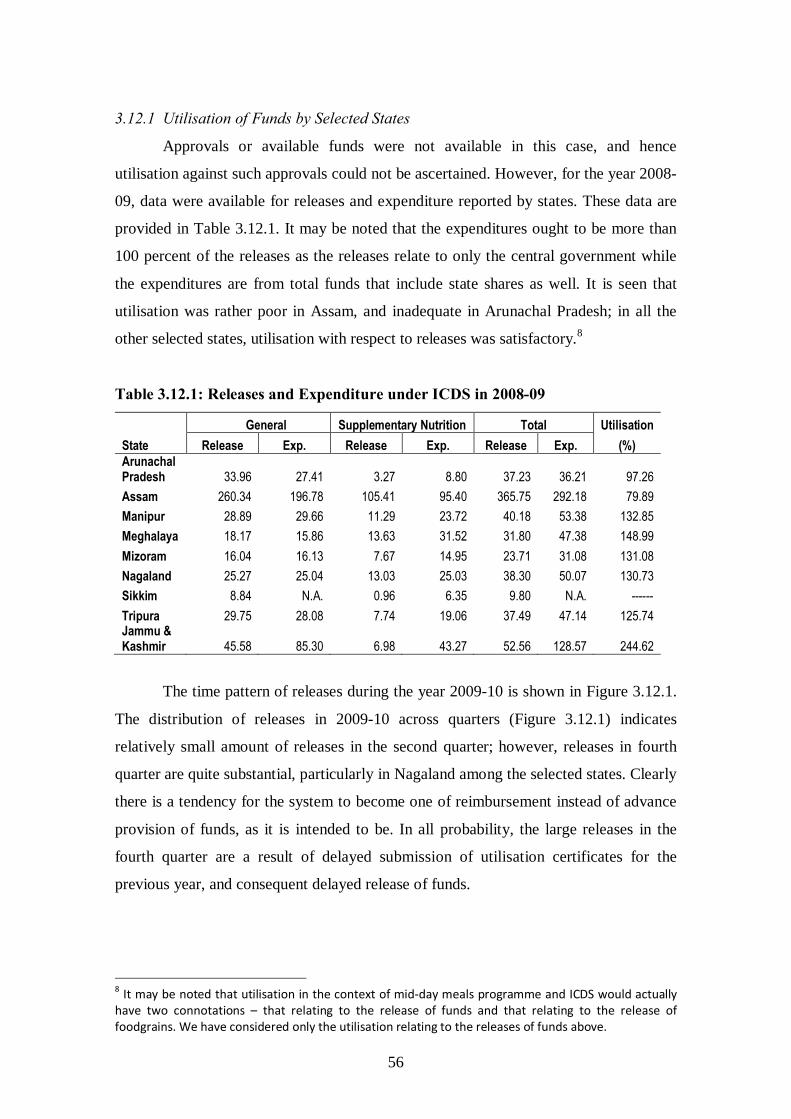
56
3.12.1 Utilisation of Funds by Selected States
Approvals or available funds were not available in this case, and hence
utilisation against such approvals could not be ascertained. However, for the year 2008-
09, data were available for releases and expenditure reported by states. These data are
provided in Table 3.12.1. It may be noted that the expenditures ought to be more than
100 percent of the releases as the releases relate to only the central government while
the expenditures are from total funds that include state shares as well. It is seen that
utilisation was rather poor in Assam, and inadequate in Arunachal Pradesh; in all the
other selected states, utilisation with respect to releases was satisfactory.8
Table 3.12.1: Releases and Expenditure under ICDS in 2008-09
General Supplementary Nutrition Total Utilisation State Release Exp. Release Exp. Release Exp. (%) Arunachal Pradesh 33.96 27.41 3.27 8.80 37.23 36.21 97.26 Assam 260.34 196.78 105.41 95.40 365.75 292.18 79.89 Manipur 28.89 29.66 11.29 23.72 40.18 53.38 132.85 Meghalaya 18.17 15.86 13.63 31.52 31.80 47.38 148.99 Mizoram 16.04 16.13 7.67 14.95 23.71 31.08 131.08 Nagaland 25.27 25.04 13.03 25.03 38.30 50.07 130.73 Sikkim 8.84 N.A. 0.96 6.35 9.80 N.A. ------ Tripura 29.75 28.08 7.74 19.06 37.49 47.14 125.74 Jammu & Kashmir 45.58 85.30 6.98 43.27 52.56 128.57 244.62
The time pattern of releases during the year 2009-10 is shown in Figure 3.12.1.
The distribution of releases in 2009-10 across quarters (Figure 3.12.1) indicates
relatively small amount of releases in the second quarter; however, releases in fourth
quarter are quite substantial, particularly in Nagaland among the selected states. Clearly
there is a tendency for the system to become one of reimbursement instead of advance
provision of funds, as it is intended to be. In all probability, the large releases in the
fourth quarter are a result of delayed submission of utilisation certificates for the
previous year, and consequent delayed release of funds.
8 It may be noted that utilisation in the context of mid-day meals programme and ICDS would actually have two connotations – that relating to the release of funds and that relating to the release of foodgrains. We have considered only the utilisation relating to the releases of funds above.
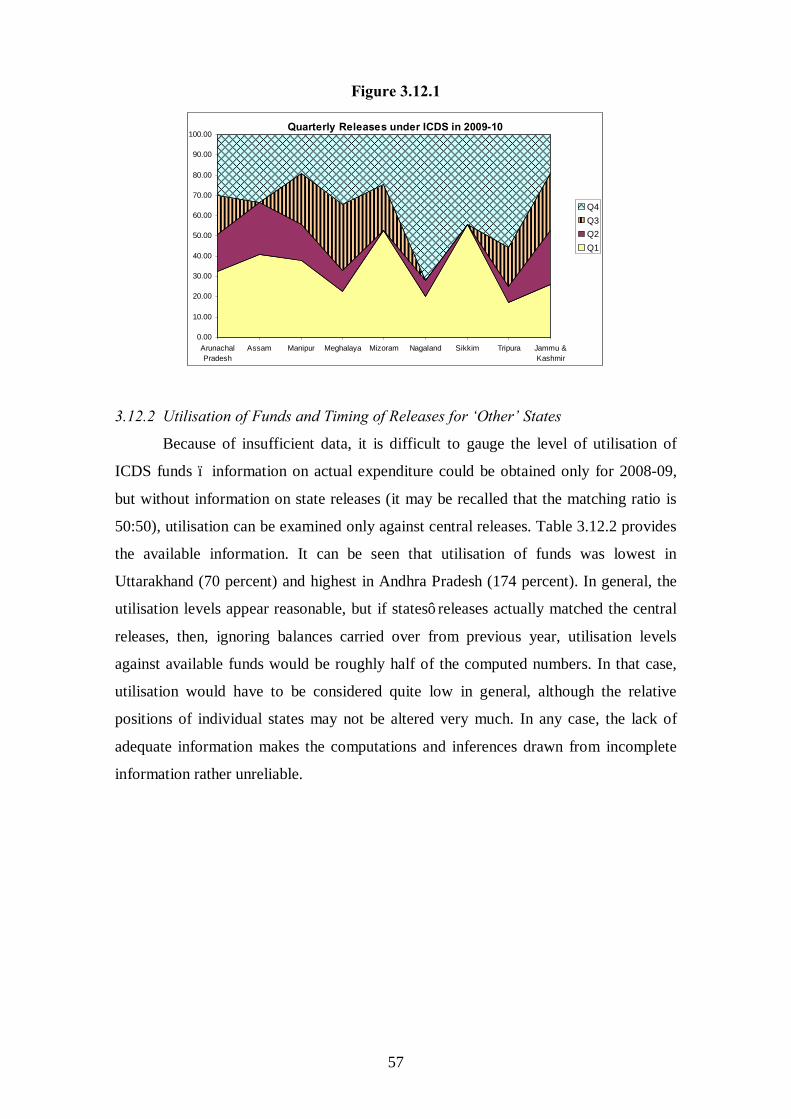
57
Figure 3.12.1
Quarterly Releases under ICDS in 2009-10
0.00
10.00
20.00
30.00
40.00
50.00
60.00
70.00
80.00
90.00
100.00
ArunachalPradesh
Assam Manipur Meghalaya Mizoram Nagaland Sikkim Tripura Jammu &Kashmir
Q4Q3Q2Q1
3.12.2 Utilisation of Funds and Timing of Releases for ‘Other’ States
Because of insufficient data, it is difficult to gauge the level of utilisation of
ICDS funds – information on actual expenditure could be obtained only for 2008-09,
but without information on state releases (it may be recalled that the matching ratio is
50:50), utilisation can be examined only against central releases. Table 3.12.2 provides
the available information. It can be seen that utilisation of funds was lowest in
Uttarakhand (70 percent) and highest in Andhra Pradesh (174 percent). In general, the
utilisation levels appear reasonable, but if states’ releases actually matched the central
releases, then, ignoring balances carried over from previous year, utilisation levels
against available funds would be roughly half of the computed numbers. In that case,
utilisation would have to be considered quite low in general, although the relative
positions of individual states may not be altered very much. In any case, the lack of
adequate information makes the computations and inferences drawn from incomplete
information rather unreliable.
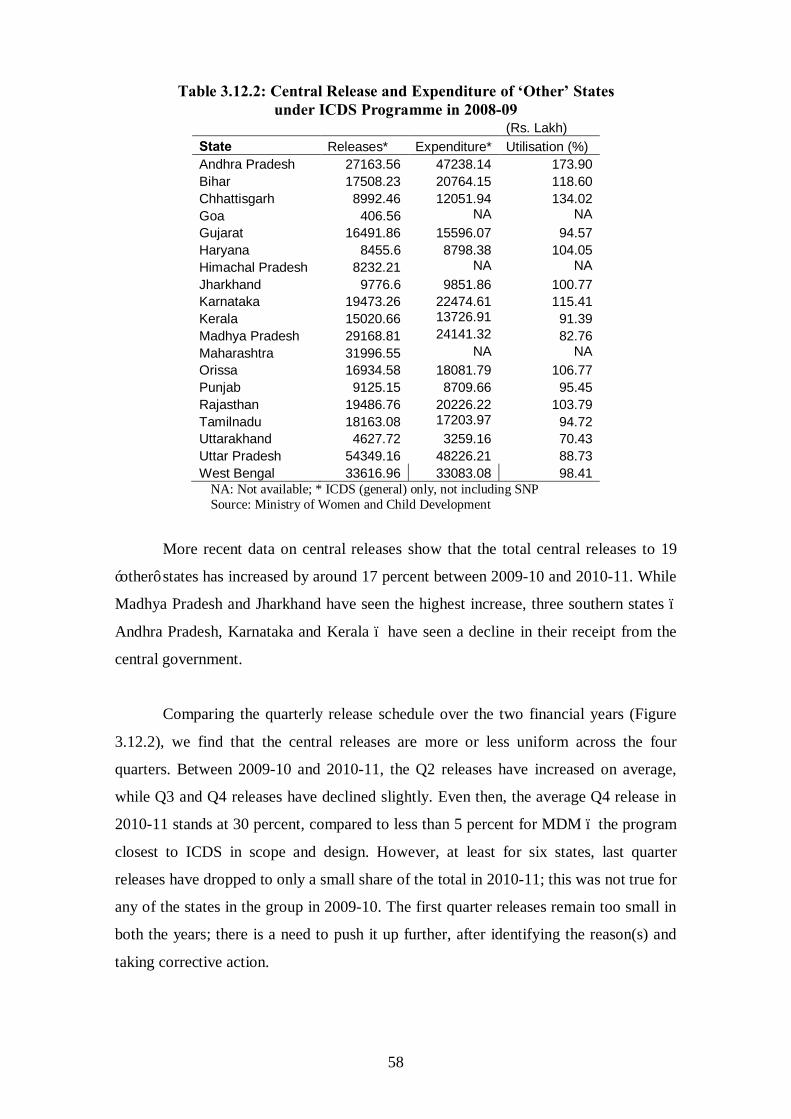
58
Table 3.12.2: Central Release and Expenditure of ‘Other’ States under ICDS Programme in 2008-09
(Rs. Lakh) State Releases* Expenditure* Utilisation (%) Andhra Pradesh 27163.56 47238.14 173.90 Bihar 17508.23 20764.15 118.60 Chhattisgarh 8992.46 12051.94 134.02 Goa 406.56 NA NA Gujarat 16491.86 15596.07 94.57 Haryana 8455.6 8798.38 104.05 Himachal Pradesh 8232.21 NA NA Jharkhand 9776.6 9851.86 100.77 Karnataka 19473.26 22474.61 115.41 Kerala 15020.66 13726.91 91.39 Madhya Pradesh 29168.81 24141.32 82.76 Maharashtra 31996.55 NA NA Orissa 16934.58 18081.79 106.77 Punjab 9125.15 8709.66 95.45 Rajasthan 19486.76 20226.22 103.79 Tamilnadu 18163.08 17203.97 94.72 Uttarakhand 4627.72 3259.16 70.43 Uttar Pradesh 54349.16 48226.21 88.73 West Bengal 33616.96 33083.08 98.41
NA: Not available; * ICDS (general) only, not including SNP Source: Ministry of Women and Child Development
More recent data on central releases show that the total central releases to 19
‘other’ states has increased by around 17 percent between 2009-10 and 2010-11. While
Madhya Pradesh and Jharkhand have seen the highest increase, three southern states –
Andhra Pradesh, Karnataka and Kerala – have seen a decline in their receipt from the
central government.
Comparing the quarterly release schedule over the two financial years (Figure
3.12.2), we find that the central releases are more or less uniform across the four
quarters. Between 2009-10 and 2010-11, the Q2 releases have increased on average,
while Q3 and Q4 releases have declined slightly. Even then, the average Q4 release in
2010-11 stands at 30 percent, compared to less than 5 percent for MDM – the program
closest to ICDS in scope and design. However, at least for six states, last quarter
releases have dropped to only a small share of the total in 2010-11; this was not true for
any of the states in the group in 2009-10. The first quarter releases remain too small in
both the years; there is a need to push it up further, after identifying the reason(s) and
taking corrective action.
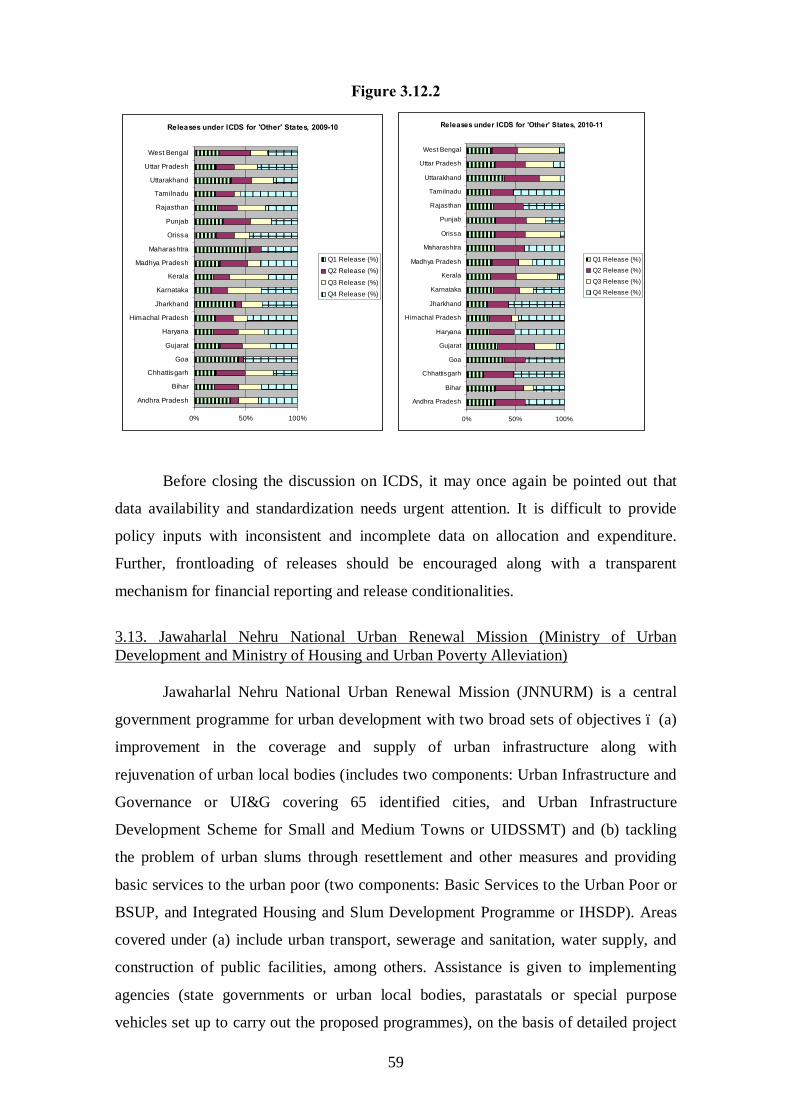
59
Figure 3.12.2
Releases under ICDS for 'Other' States, 2009-10
0% 50% 100%
Andhra Pradesh
Bihar
Chhattisgarh
Goa
Gujarat
Haryana
Himachal Pradesh
Jharkhand
Karnataka
Kerala
Madhya Pradesh
Maharashtra
Orissa
Punjab
Rajasthan
Tamilnadu
Uttarakhand
Uttar Pradesh
West Bengal
Q1 Release (%)Q2 Release (%)
Q3 Release (%)Q4 Release (%)
Releases under ICDS for 'Other' States, 2010-11
0% 50% 100%
Andhra Pradesh
Bihar
Chhattisgarh
Goa
Gujarat
Haryana
Himachal Pradesh
Jharkhand
Karnataka
Kerala
Madhya Pradesh
Maharashtra
Orissa
Punjab
Rajasthan
Tamilnadu
Uttarakhand
Uttar Pradesh
West Bengal
Q1 Release (%)Q2 Release (%)
Q3 Release (%)Q4 Release (%)
Before closing the discussion on ICDS, it may once again be pointed out that
data availability and standardization needs urgent attention. It is difficult to provide
policy inputs with inconsistent and incomplete data on allocation and expenditure.
Further, frontloading of releases should be encouraged along with a transparent
mechanism for financial reporting and release conditionalities.
3.13. Jawaharlal Nehru National Urban Renewal Mission (Ministry of Urban Development and Ministry of Housing and Urban Poverty Alleviation) Jawaharlal Nehru National Urban Renewal Mission (JNNURM) is a central
government programme for urban development with two broad sets of objectives – (a)
improvement in the coverage and supply of urban infrastructure along with
rejuvenation of urban local bodies (includes two components: Urban Infrastructure and
Governance or UI&G covering 65 identified cities, and Urban Infrastructure
Development Scheme for Small and Medium Towns or UIDSSMT) and (b) tackling
the problem of urban slums through resettlement and other measures and providing
basic services to the urban poor (two components: Basic Services to the Urban Poor or
BSUP, and Integrated Housing and Slum Development Programme or IHSDP). Areas
covered under (a) include urban transport, sewerage and sanitation, water supply, and
construction of public facilities, among others. Assistance is given to implementing
agencies (state governments or urban local bodies, parastatals or special purpose
vehicles set up to carry out the proposed programmes), on the basis of detailed project
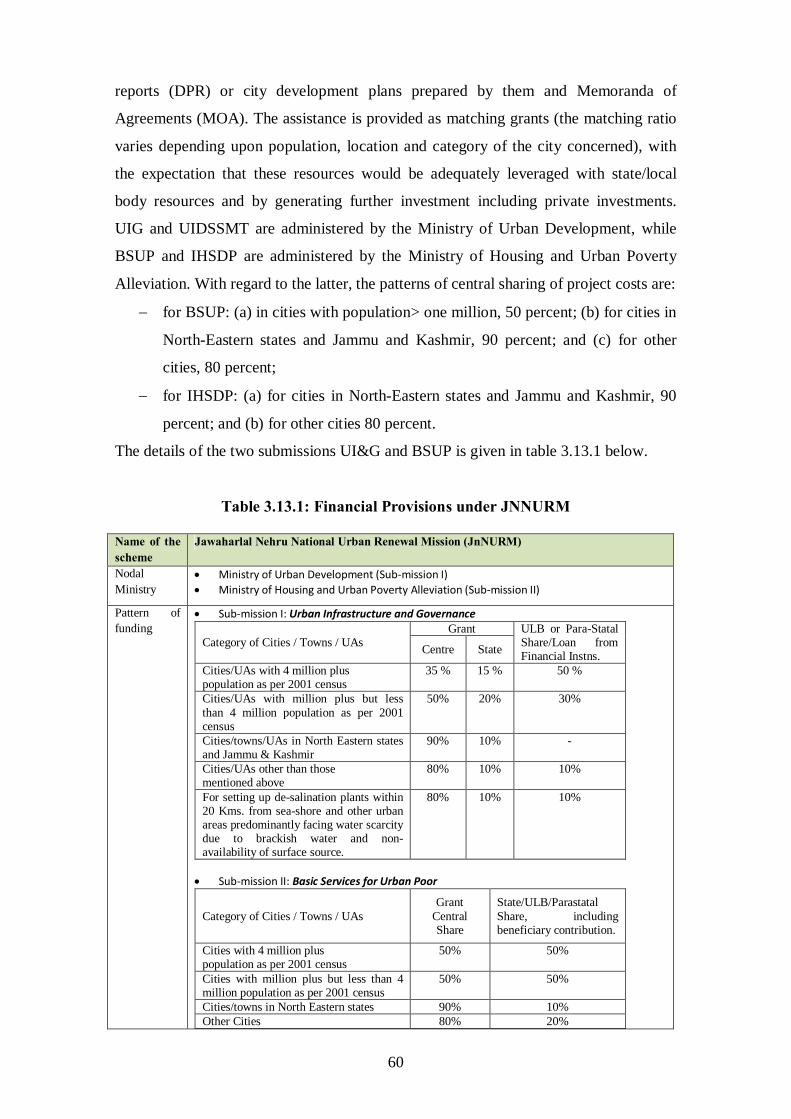
60
reports (DPR) or city development plans prepared by them and Memoranda of
Agreements (MOA). The assistance is provided as matching grants (the matching ratio
varies depending upon population, location and category of the city concerned), with
the expectation that these resources would be adequately leveraged with state/local
body resources and by generating further investment including private investments.
UIG and UIDSSMT are administered by the Ministry of Urban Development, while
BSUP and IHSDP are administered by the Ministry of Housing and Urban Poverty
Alleviation. With regard to the latter, the patterns of central sharing of project costs are:
− for BSUP: (a) in cities with population> one million, 50 percent; (b) for cities in
North-Eastern states and Jammu and Kashmir, 90 percent; and (c) for other
cities, 80 percent;
− for IHSDP: (a) for cities in North-Eastern states and Jammu and Kashmir, 90
percent; and (b) for other cities 80 percent.
The details of the two submissions UI&G and BSUP is given in table 3.13.1 below.
Table 3.13.1: Financial Provisions under JNNURM Name of the scheme
Jawaharlal Nehru National Urban Renewal Mission (JnNURM)
Nodal Ministry
• Ministry of Urban Development (Sub-mission I) • Ministry of Housing and Urban Poverty Alleviation (Sub-mission II)
Pattern of funding
• Sub-mission I: Urban Infrastructure and Governance
Category of Cities / Towns / UAs Grant ULB or Para-Statal
Share/Loan from Financial Instns. Centre State
Cities/UAs with 4 million plus population as per 2001 census
35 % 15 % 50 %
Cities/UAs with million plus but less than 4 million population as per 2001 census
50% 20% 30%
Cities/towns/UAs in North Eastern states and Jammu & Kashmir
90% 10% -
Cities/UAs other than those mentioned above
80% 10% 10%
For setting up de-salination plants within 20 Kms. from sea-shore and other urban areas predominantly facing water scarcity due to brackish water and non-availability of surface source.
80% 10% 10%
• Sub-mission II: Basic Services for Urban Poor
Category of Cities / Towns / UAs Grant
Central Share
State/ULB/Parastatal Share, including beneficiary contribution.
Cities with 4 million plus population as per 2001 census
50% 50%
Cities with million plus but less than 4 million population as per 2001 census
50% 50%
Cities/towns in North Eastern states 90% 10% Other Cities 80% 20%
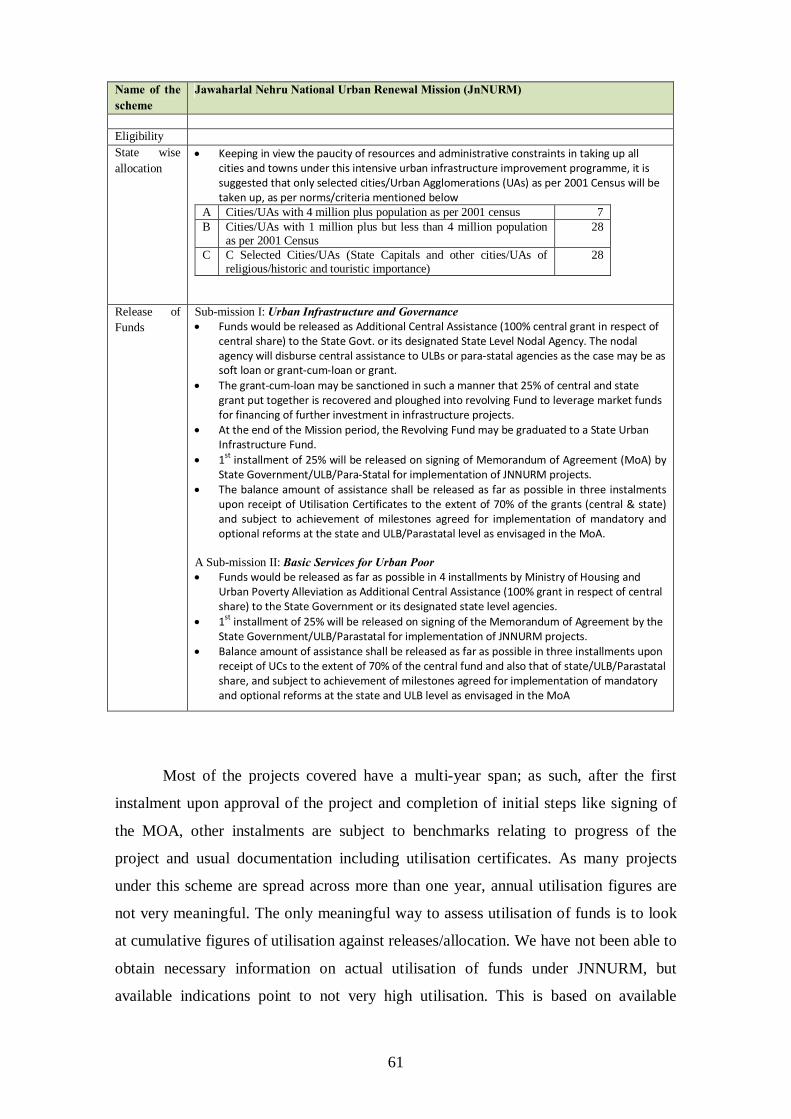
61
Name of the scheme
Jawaharlal Nehru National Urban Renewal Mission (JnNURM)
Eligibility State wise allocation
• Keeping in view the paucity of resources and administrative constraints in taking up all cities and towns under this intensive urban infrastructure improvement programme, it is suggested that only selected cities/Urban Agglomerations (UAs) as per 2001 Census will be taken up, as per norms/criteria mentioned below
A Cities/UAs with 4 million plus population as per 2001 census 7 B Cities/UAs with 1 million plus but less than 4 million population
as per 2001 Census 28
C C Selected Cities/UAs (State Capitals and other cities/UAs of religious/historic and touristic importance)
28
Release of Funds
Sub-mission I: Urban Infrastructure and Governance • Funds would be released as Additional Central Assistance (100% central grant in respect of
central share) to the State Govt. or its designated State Level Nodal Agency. The nodal agency will disburse central assistance to ULBs or para-statal agencies as the case may be as soft loan or grant-cum-loan or grant.
• The grant-cum-loan may be sanctioned in such a manner that 25% of central and state grant put together is recovered and ploughed into revolving Fund to leverage market funds for financing of further investment in infrastructure projects.
• At the end of the Mission period, the Revolving Fund may be graduated to a State Urban Infrastructure Fund.
• 1st installment of 25% will be released on signing of Memorandum of Agreement (MoA) by State Government/ULB/Para-Statal for implementation of JNNURM projects.
• The balance amount of assistance shall be released as far as possible in three instalments upon receipt of Utilisation Certificates to the extent of 70% of the grants (central & state) and subject to achievement of milestones agreed for implementation of mandatory and optional reforms at the state and ULB/Parastatal level as envisaged in the MoA.
A Sub-mission II: Basic Services for Urban Poor • Funds would be released as far as possible in 4 installments by Ministry of Housing and
Urban Poverty Alleviation as Additional Central Assistance (100% grant in respect of central share) to the State Government or its designated state level agencies.
• 1st installment of 25% will be released on signing of the Memorandum of Agreement by the State Government/ULB/Parastatal for implementation of JNNURM projects.
• Balance amount of assistance shall be released as far as possible in three installments upon receipt of UCs to the extent of 70% of the central fund and also that of state/ULB/Parastatal share, and subject to achievement of milestones agreed for implementation of mandatory and optional reforms at the state and ULB level as envisaged in the MoA
Most of the projects covered have a multi-year span; as such, after the first
instalment upon approval of the project and completion of initial steps like signing of
the MOA, other instalments are subject to benchmarks relating to progress of the
project and usual documentation including utilisation certificates. As many projects
under this scheme are spread across more than one year, annual utilisation figures are
not very meaningful. The only meaningful way to assess utilisation of funds is to look
at cumulative figures of utilisation against releases/allocation. We have not been able to
obtain necessary information on actual utilisation of funds under JNNURM, but
available indications point to not very high utilisation. This is based on available
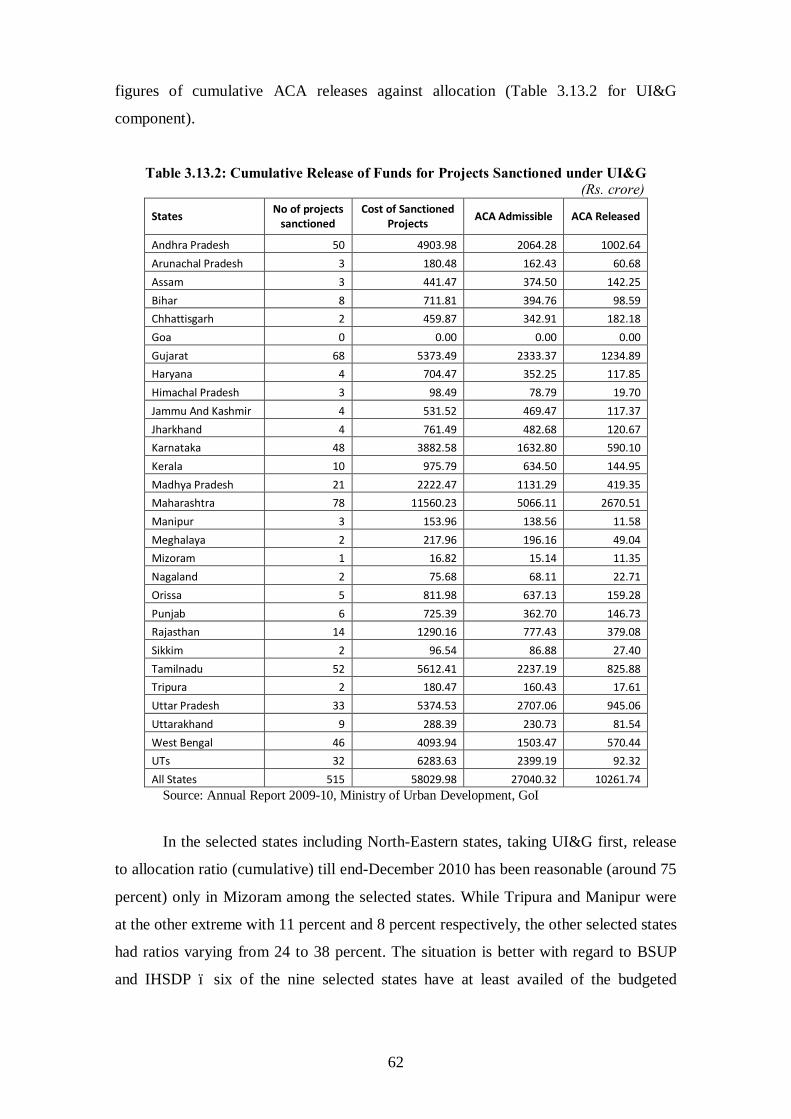
62
figures of cumulative ACA releases against allocation (Table 3.13.2 for UI&G
component).
Table 3.13.2: Cumulative Release of Funds for Projects Sanctioned under UI&G (Rs. crore)
States No of projects sanctioned
Cost of Sanctioned Projects ACA Admissible ACA Released
Andhra Pradesh 50 4903.98 2064.28 1002.64 Arunachal Pradesh 3 180.48 162.43 60.68 Assam 3 441.47 374.50 142.25 Bihar 8 711.81 394.76 98.59 Chhattisgarh 2 459.87 342.91 182.18 Goa 0 0.00 0.00 0.00 Gujarat 68 5373.49 2333.37 1234.89 Haryana 4 704.47 352.25 117.85 Himachal Pradesh 3 98.49 78.79 19.70 Jammu And Kashmir 4 531.52 469.47 117.37 Jharkhand 4 761.49 482.68 120.67 Karnataka 48 3882.58 1632.80 590.10 Kerala 10 975.79 634.50 144.95 Madhya Pradesh 21 2222.47 1131.29 419.35 Maharashtra 78 11560.23 5066.11 2670.51 Manipur 3 153.96 138.56 11.58 Meghalaya 2 217.96 196.16 49.04 Mizoram 1 16.82 15.14 11.35 Nagaland 2 75.68 68.11 22.71 Orissa 5 811.98 637.13 159.28 Punjab 6 725.39 362.70 146.73 Rajasthan 14 1290.16 777.43 379.08 Sikkim 2 96.54 86.88 27.40 Tamilnadu 52 5612.41 2237.19 825.88 Tripura 2 180.47 160.43 17.61 Uttar Pradesh 33 5374.53 2707.06 945.06 Uttarakhand 9 288.39 230.73 81.54 West Bengal 46 4093.94 1503.47 570.44 UTs 32 6283.63 2399.19 92.32 All States 515 58029.98 27040.32 10261.74
Source: Annual Report 2009-10, Ministry of Urban Development, GoI
In the selected states including North-Eastern states, taking UI&G first, release
to allocation ratio (cumulative) till end-December 2010 has been reasonable (around 75
percent) only in Mizoram among the selected states. While Tripura and Manipur were
at the other extreme with 11 percent and 8 percent respectively, the other selected states
had ratios varying from 24 to 38 percent. The situation is better with regard to BSUP
and IHSDP – six of the nine selected states have at least availed of the budgeted
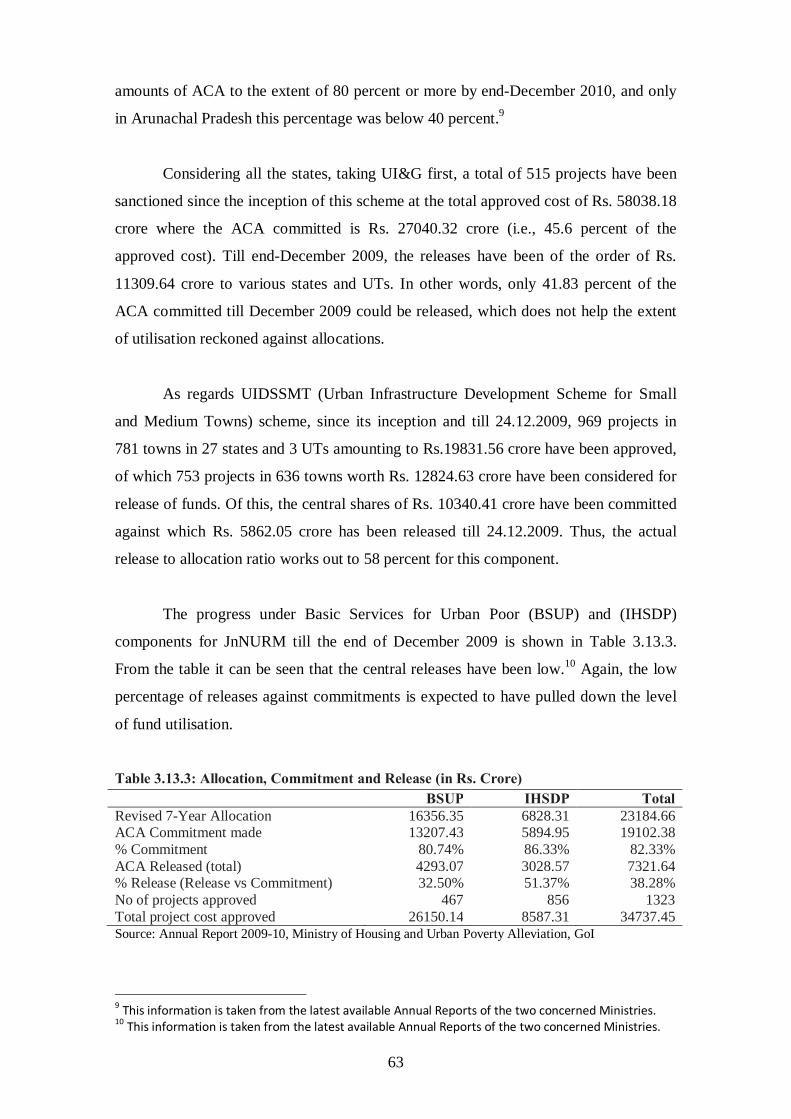
63
amounts of ACA to the extent of 80 percent or more by end-December 2010, and only
in Arunachal Pradesh this percentage was below 40 percent.9
Considering all the states, taking UI&G first, a total of 515 projects have been
sanctioned since the inception of this scheme at the total approved cost of Rs. 58038.18
crore where the ACA committed is Rs. 27040.32 crore (i.e., 45.6 percent of the
approved cost). Till end-December 2009, the releases have been of the order of Rs.
11309.64 crore to various states and UTs. In other words, only 41.83 percent of the
ACA committed till December 2009 could be released, which does not help the extent
of utilisation reckoned against allocations.
As regards UIDSSMT (Urban Infrastructure Development Scheme for Small
and Medium Towns) scheme, since its inception and till 24.12.2009, 969 projects in
781 towns in 27 states and 3 UTs amounting to Rs.19831.56 crore have been approved,
of which 753 projects in 636 towns worth Rs. 12824.63 crore have been considered for
release of funds. Of this, the central shares of Rs. 10340.41 crore have been committed
against which Rs. 5862.05 crore has been released till 24.12.2009. Thus, the actual
release to allocation ratio works out to 58 percent for this component.
The progress under Basic Services for Urban Poor (BSUP) and (IHSDP)
components for JnNURM till the end of December 2009 is shown in Table 3.13.3.
From the table it can be seen that the central releases have been low.10 Again, the low
percentage of releases against commitments is expected to have pulled down the level
of fund utilisation.
Table 3.13.3: Allocation, Commitment and Release (in Rs. Crore) BSUP IHSDP Total Revised 7-Year Allocation 16356.35 6828.31 23184.66 ACA Commitment made 13207.43 5894.95 19102.38 % Commitment 80.74% 86.33% 82.33% ACA Released (total) 4293.07 3028.57 7321.64 % Release (Release vs Commitment) 32.50% 51.37% 38.28% No of projects approved 467 856 1323 Total project cost approved 26150.14 8587.31 34737.45 Source: Annual Report 2009-10, Ministry of Housing and Urban Poverty Alleviation, GoI
9 This information is taken from the latest available Annual Reports of the two concerned Ministries. 10 This information is taken from the latest available Annual Reports of the two concerned Ministries.
64
The time pattern of releases in this case have not been examined mainly because
there is no expected pattern; after the first instalment is given (the timing depending on
the submission of the CDP/DPR and the time taken to complete assessment of the same
and completing initial paperwork), the subsequent releases do not follow a fixed time
pattern but depend on reaching benchmarks agreed upon. Casual observation of the
data (not reported) reveals that the timing of releases in 2009-10 varied substantially
among the nine selected states and did not show any clear pattern.
3.14. Non-Lapsable Central Pool of Resources (NLCPR) (Ministry of Development of North Eastern Region) NLCPR is meant to supplement state funds for infrastructure development (both
social and physical), but not normal plan programmes. This programme is project-
based, with the system requiring each state to submit a list of proposals for
consideration by November 30, to be taken up next year. These projects should not be
funded from any other external source, and should preferably be part of a long-term
strategy for identified priority sectors. Also, the proposed projects should benefit a
large number of people and not for individual beneficiaries. Estimated project cost for
each should be at least Rs. 3 crore and at least 25 percent of the project costs should be
for those in backward areas/ Sixth Schedule Areas/ Autonomous District Councils. The
concerned Committee in the Ministry examines the proposals and selects projects for
further detailed examination and upon approval, support from the central pool.
The support to the approved projects is to the tune of 90 percent of the project
cost as grant, the remaining 10 percent to be provided by the state. The first instalment
of 40 percent is released after project approval. Remaining support is released in two
further instalments of 40 and 20 percent of the total grant. The second instalment is
released after completion of at least 40 percent of the project and submission of
utilisation certificate of at least 80 percent of funds released in first instalment. The last
instalment is similarly contingent upon at least 80 percent utilisation of the last release
and full utilisation of previous instalment(s) along with commensurate physical
progress. After the first instalment, subsequent instalments are also conditional upon
requisite documentation like utilisation certificates, quarterly progress reports,
photographs and inspection reports. All central pool releases are to be utilised within 12
months and the state government must release funds received to the implementing
agency within 15 days of receipt.
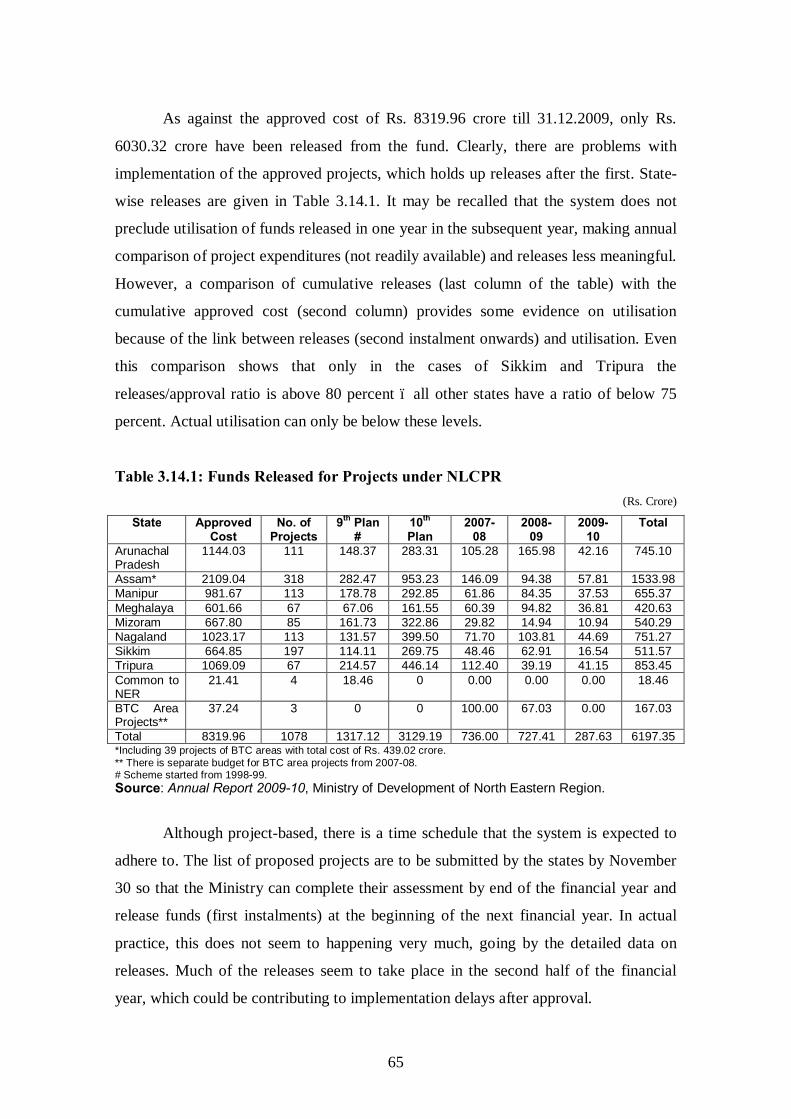
65
As against the approved cost of Rs. 8319.96 crore till 31.12.2009, only Rs.
6030.32 crore have been released from the fund. Clearly, there are problems with
implementation of the approved projects, which holds up releases after the first. State-
wise releases are given in Table 3.14.1. It may be recalled that the system does not
preclude utilisation of funds released in one year in the subsequent year, making annual
comparison of project expenditures (not readily available) and releases less meaningful.
However, a comparison of cumulative releases (last column of the table) with the
cumulative approved cost (second column) provides some evidence on utilisation
because of the link between releases (second instalment onwards) and utilisation. Even
this comparison shows that only in the cases of Sikkim and Tripura the
releases/approval ratio is above 80 percent – all other states have a ratio of below 75
percent. Actual utilisation can only be below these levels.
Table 3.14.1: Funds Released for Projects under NLCPR (Rs. Crore)
State Approved Cost
No. of Projects
9th Plan #
10th Plan
2007-08
2008-09
2009-10
Total
Arunachal Pradesh
1144.03 111 148.37 283.31 105.28 165.98 42.16 745.10
Assam* 2109.04 318 282.47 953.23 146.09 94.38 57.81 1533.98 Manipur 981.67 113 178.78 292.85 61.86 84.35 37.53 655.37 Meghalaya 601.66 67 67.06 161.55 60.39 94.82 36.81 420.63 Mizoram 667.80 85 161.73 322.86 29.82 14.94 10.94 540.29 Nagaland 1023.17 113 131.57 399.50 71.70 103.81 44.69 751.27 Sikkim 664.85 197 114.11 269.75 48.46 62.91 16.54 511.57 Tripura 1069.09 67 214.57 446.14 112.40 39.19 41.15 853.45 Common to NER
21.41 4 18.46 0 0.00 0.00 0.00 18.46
BTC Area Projects**
37.24 3 0 0 100.00 67.03 0.00 167.03
Total 8319.96 1078 1317.12 3129.19 736.00 727.41 287.63 6197.35 *Including 39 projects of BTC areas with total cost of Rs. 439.02 crore. ** There is separate budget for BTC area projects from 2007-08. # Scheme started from 1998-99. Source: Annual Report 2009-10, Ministry of Development of North Eastern Region.
Although project-based, there is a time schedule that the system is expected to
adhere to. The list of proposed projects are to be submitted by the states by November
30 so that the Ministry can complete their assessment by end of the financial year and
release funds (first instalments) at the beginning of the next financial year. In actual
practice, this does not seem to happening very much, going by the detailed data on
releases. Much of the releases seem to take place in the second half of the financial
year, which could be contributing to implementation delays after approval.
66
A recent CAG report (Performance Audit Report No. 5, 2010-11) dealt with this
programme and has pointed out several problems that plague its implementation. There
is considerable slippage in physical implementation of the approved projects because of
a several reasons; contributing factors actually start with non-release by states of funds
received for a long time, and non-release of the state share of funding. The CAG report
recommends a serious reassessment of the continuation of the scheme, particularly in
view of its marginal impact and failure to meet its objective.
3.15. Transfers from North-Eastern Council (NEC) (Ministry of Development of North Eastern Region) These are essentially ad hoc grants made by the NEC from central funds
allocated to it and are meant for institutions, organisations, and associations etc. in the
nature of NGO to implement projects the benefits of which cut across state boundaries,
even though the project may be located in one state. The proposals have to be
submitted through the concerned state government in general, but direct submission to
the Council (NEC) is also considered in exceptional cases. A small share of promoter’s
contribution is generally insisted upon in each case. Secretary (NEC) has been
delegated the power of approving small projects at his level.
There is no set time schedule for submission of proposals or release of funds
under this scheme – such terms are decided by the NEC on a case-by-case basis while
approving proposals. Usually funds for small projects costing less than Rs. 5 crore are
released in one or two instalments, and only for bigger projects the funds are released
in more than two instalments. Whenever funds are to be released in more than one
instalment, release of second and subsequent instalments are conditional upon
satisfactory financial and physical progress.
Other than data on annual releases by states and sectors, detailed data on
approvals, utilisation and timing of releases under this scheme were not readily
available. As such, an informed assessment of this scheme could not be carried out.
67
3.16. Prime Minister’s Reconstruction Plan (PMRP), 2004 (For Jammu and Kashmir)
(Ministry of Home Affairs)
PMRP is quite different from the programmes that were discussed above in
several respects; it relates to only one state, is essentially a co-ordinating system for
diverse developmental activities, is actually implemented by several agencies including
the State Government and is funded by several agencies including various Ministries
and other public sector bodies of the Government of India. Announced in 2004 and
expected to run till 2010-11, it originally included 67 Projects/Schemes in the following
sectors broadly aimed at: (a) expanding economic infrastructure, (b) expanding
provision of basic services, (c) providing thrust to employment and income generation,
and (d) providing relief & rehabilitation to the dislocated and the families of victims of
militancy. The largest part of the financial outlay was earmarked for the power sector,
with NHPC Limited bearing the bulk of the responsibility of implementing the projects.
Given the diversity of the projects and the implementing agencies, collating the
information on allocation and release of funds, their modalities and expenditure on the
several projects under PMRP proved to be a non-starter. Discussions with the major
implementation agency in terms of planned expenditure (NHPC) indicated the rather ad
hoc as also mixed (own resources of NHPC, central government and the state
government – also a mix of grants and loans) nature of the related financial flows,
forestalling any systematic analysis. Information on the portfolio of projects undertaken
by NHPC under the PMRP revealed that actual cumulative expenditures were much
higher than the releases from central/state governments in all cases. Obviously,
utilisation of funds was not the main issue – it was the actual implementation of the
projects. The latter, of course, was subject to different types of constraints, the three
major ones being law and order problems, vagaries of weather and difficulties of
obtaining permission to use land falling within forest areas.
4. Observations and Recommendations
The review of the individual schemes and their functioning provides us the
necessary background to undertake an assessment with a view to improving their
effectiveness and utilisation. Of the 15 schemes reviewed, utilisation would be a real
68
concern only in the cases of NRDWP, BRGF, ICDS, JNNURM and NLCPR. There
are isolated cases of poor utilisation in one or two states in the case of some other
schemes also, but one can argue that those could be ascribed to state-specific factors.
However, that is not to say that there is no scope for improvement. The following
discussion is undertaken in that spirit. To structure the discussion, two main aspects of
the schemes are covered: design of the scheme including administrative features, and
flow of funds. Nevertheless, it has to be borne in mind that these aspects are not
mutually exclusive.
4.1. Design of the Schemes
The first design feature to be discussed would be the matching requirement of
the scheme. Conceptually, the difference between a matching and non-matching grant
is that a matching requirement can change budget priorities for expenditures on other
heads of expenditure too, since the matching amount has to be taken out of the overall
expenditure ceiling, affected one or more of unrelated expenditure heads. A non-
matching grant simply makes more funds available for expenditure in the specified
category, in contrast. This is sometimes interpreted to contend that matching central
grants to states can ‘distort’ the priorities of states. The strength of this ‘distortion’
naturally depends on the matching ratio. Thus, a priori, matching grants are called for
when the grantor agency wants to change the pattern of grantee agency’s budgetary
allocations in favour of the supported service. The success of this instrument, however,
depends on the extent of foiling grantee level fungibility11 of funds; to ensure
additionality, a strong monitoring system is required. Also, too many matching
grants in the system of intergovernmental transfers can cause conflicts of interest in
the states with only small amounts of free resources; it may become difficult for a
state to accommodate so many demands on its meagre resources that remain after
meeting contractual obligations.
At a more practical level, a matching ratio that cannot be afforded by several
states can easily explain lukewarm response of the states to a scheme. However, in the
case of the selected states that this particular study is covering, matching requirement is
rarely above 10 percent, which is not high. Also, among the few schemes with low 11 This refers to the ability to use funds for purposes other than that formally declared; it would also include passing off normal increases in own expenditure as meeting matching requirements.
69
utilisation, BRGF has no matching requirement, indicating that lowering matching
requirement is not necessarily a solution to the problem of effective utilisation. There
have been some suggestions of reducing matching requirement further for better off-
take of funds, but we find no evidence that such reduction is either necessary or
sufficient to achieve that. A uniform matching requirement for all states may actually
be problematic in the case of ‘other’ states for schemes with high matching ratios,
since the fiscal strength of the states in the group varies widely. However, this a
question that has been debated since long and the perceived arbitrariness implicit in a
system of varying matching ratios has made such a system politically/administratively
unpalatable.
The second design feature that could be important is the basis of the
determination of transfers. The schemes can be divided into broadly two types: those
based on proposals/plans to be submitted for approval and those based on allocations.
Some of the schemes may have elements of both, but the distinction is still valid
because only one of them can be the effective driver. MGNREGA is a different
category by itself since it is an entitlement programme, although it is based to some
extent on annual plans submitted by states. Conceptually, allocation-based programmes
should have an edge in terms of utilisation simply because they do not involve the
additional effort on the part of the states to prepare credible proposals/plans that may
conceivably strain the administrative capabilities of some of the states. However, in
practice, allocations may be subject to proposals/plans as well as in the case of
NRDWP, RKVY or BRGF. In such cases, overall utilisation can be relatively low
because states with good proposals/plans will not be able to get more funds than their
respective allocations, while states that cannot prepare good proposals/plans would get
less than their allocations. As such, we would suggest that the design should opt for
either a pure proposal/plan based system, or a substantially allocation based system
(like IAY). Combining both would a priori reduce utilisation of available funds.
The third, and probably most important, issue is that of delivery mechanism of
the scheme. Most of the schemes reviewed, including the some of the flagship schemes,
have two features in common: (a) they are expected to be implemented in a
decentralised manner, and (b) the state level coordination is entrusted to an agency
created for the purpose, with state government participation but autonomous. Many
70
schemes expect the state level agency to be literally only a co-ordinating body, with the
focus at the district level or at a further decentralised level. The decentralised structure
is expected to cover the whole spectrum of the implementation process starting from
preparation of project proposals/plans to actual expenditure, and the flow of funds is
designed to percolate down for actual expenditures to be incurred at the most
decentralised level. While this is a structure that obviously has an appeal in terms of
decentralisation, it can, and probably does, create serious problems of administration
and effective delivery. The problems of administration are dealt with below; suffice it
to say here that this creates a trade-off between accountability and utilisation. Even in a
conceptual sense, the main problems with respect to a decentralised structure of a
scheme administered from the central government level in a country like India is: (i)
the inability to build in enough flexibility to accommodate necessary state-level
variations, particularly for the North-eastern states, (ii) lack of information and time to
assess really decentralised detailed proposals/plans, (iii) creating a large number of
agencies that have to ensure delivery without the authority or the constitutional back-up
that the state governments enjoy, and which add to the costs of governance, and (iv) not
getting the state governments – without whose involvement, the schemes cannot
succeed anyway – fully on board. For these reasons, as also administrative reasons
elaborated below, it would be better to involve the state governments fully in the
delivery of the schemes and leave it to their choice as to whether a dedicated agency
for the scheme is required or not (as under RKVY).
4.2. Flow of Funds
Ensuring a smooth flow of funds under any scheme is absolutely essential to the
success in meeting the ultimate objectives of the scheme. This is where the
administration of the scheme is tested, and more often than not, this is what determines
effective utilisation of the scheme. The review of the structure of the schemes,
unfortunately leads one to the conclusion that there is perhaps too little delegation in
the system that is creating bottlenecks in the flow of funds, which is also impacting on
the effectiveness of the scheme and utilisation of available funds, defeating the
objectives to varying extents. To begin with, approval of the project
proposals/DPRs/plans is almost invariably at the central level. Given the sheer volume
of the job, and the details that have to be gone into, there is a high probability of a
71
trade-off between doing a good job of evaluation and doing so within a reasonable
period of time. Unfortunately, slippage in either has negative impact on the scheme. As
such, the only way out is to reduce the number of approvals necessary at the central
level or eliminate this requirement altogether through delegation of this
responsibility to the state government, or an agency designated by it. The delegation
can be full (all proposals/plans) or partial (proposals/plans below a given cost, say Rs.
100 crore). When the scheme involves transfers to individuals/groups, it should be fully
based on allocations and no approvals at the central level, except an aggregative
estimate from the state level, should be required. However, when the proposal
originates from the state government, it should be assessed at the central level
irrespective of the cost.
Another cause of disruption in the flow of funds is the detailed documentation
necessary to obtain the second and subsequent instalments of approved amounts of
transfers, including audited accounts and utilisation certificates. With a decentralised
system of implementation, default by some lowest level implementation agencies can
penalise many such agencies (or delay on the part of a few can cause delay for a larger
number), if the documentation (particularly utilisation certificates) has to be
consolidated at a higher level for submission. This is where the trade-off between
accountability and utilisation shows up. Here again, the solution can only be through
delegation – the central Ministries should require utilisation certificate and audited
accounts from the respective state governments only (with a little more time allowed –
these should be allowed to be submitted by end-December of a year for the previous
year, with second instalments released on the basis of simple statements of
expenditures at the state level). Any discrepancy between expenditure statements and
utilisation certified can be adjusted while releasing the first instalment of the following
year.
The above changes should help significantly in maintaining the time schedule of
releases, which can impact on the schedule of implementation. For the selected states
covered in this report and the remaining special category states, it is particularly
important to provide the bulk of funds in the first instalment, so that seasonal
constraints can be worked around. Thus it would help these states if 80 percent of the
72
approved funds are released in the first instalment by May 15 of every year, after
necessary adjustments. For other states, the normal procedure may be followed.
Some comments on the design and functioning of the individual schemes are
included in their respective assessments. As regards the two schemes for North-Eastern
states covered in the present report – NLCPR and NEC, we have too little information
for the latter to base our comments on. As far as the NLCPR is concerned, the general
comments made above in subsections 4.1 and 4.2 should apply with the additional
recommendation that the 12-month restriction for spending all releases should be
removed to allow for longer time taken to implement projects in these states for
various reasons including several clearances required. Also, in the case of the selected
states (in fact, all special category states), appointment of professional consultants to
prepare project proposals should be allowed (if not included) on a reimbursable basis
under the schemes to compensate for usual lack of expertise in this area.
Top Related