


Languages
Pages
Legal


1 | P a g e
Improvements on Learning Outcomes and Teacher Capacity
Building of multigrade rural schools in India:
A Quasi Experimental Study under PCTFI
By
CARE INDIA
July 2017

2 | P a g e
Contents EXECUTIVE SUMMARY ........................................................................................................ 5
CHAPTER 1: INTRODUCTION .............................................................................................. 7
1.1 Background ..................................................................................................................... 7
1.2 Context of the Intervention ............................................................................................. 8
1.3 Issues to address ............................................................................................................ 10
1.4 Patsy Collins Trust Fund Initiative (PCTFI), the intervention in India ........................ 12
1.4.1 Goal and Objectives of Phase 1 and 2 .................................................................. 12
1.4.2 Children, Teachers and Schools Reached Directly .............................................. 14
1.4.3 Strategy of intervention ........................................................................................ 16
A.- Quasi Experimental Research: Teacher Capacity Building .................... 16
B.- Supported quality improvement intervention in other clusters ................ 18
1.4.4 Theory of Change ................................................................................................. 21
CHAPTER 2: FRAMEWORK OF THE RESEARCH ............................................................ 22
2.1 About experimental and control group ............................................................................... 22
2.1.1 Social Stratification of children ........................................................................... 22
2.1.2 Distribution of children by gender and castes ...................................................... 23
2.1.3 Social information of teachers ............................................................................. 24
2.2 Analytical framework: Data series and Methodology ........................................................ 27
CHAPTER 3: MAIN FINDINGS ............................................................................................ 33
3.1 Increased learning outcomes in language and mathematics ............................................... 33
3.1.1 Learners’ result in Language for Grade 2 & 3 ..................................................... 33
3.1.2 Learner’s Assessment in Mathematics in Grade 2 and 3 ..................................... 35
3.2 Learning Achievement: Read in Time - PCTFI Phase 2, all 3 districts ............................. 38
3.3 Reduced gender gap in achievement in both language and mathematics .......................... 40
3.4 Classroom Processes .......................................................................................................... 42
3.4.1 Teachers’ Behaviors, Practices and Methods ....................................................... 43
3.4.2 Incremented Students Engagement ...................................................................... 45
3.5 Teacher Participation & Practices from Phase 1 to Phase 2............................................... 47
CHAPTER 4: CONCLUSIONS AND LEARNINGS ............................................................. 49
REFERENCES ......................................................................................................................... 54

3 | P a g e
TABLES
Table 1
Number of children reached in 34 Primary School -Shrawasti- through Longitudinal
Quasi Experimental Study
Table 2
Number of Teachers reached with PCTFI in Primary School Shrawasti, through
Longitudinal Quasi Experimental Study
Table 3
Number of children reached direcly in Primary Schools -Shrawasti, Bahraich and
Balrampur through Longitudinal Quasi Experimental Study – PCTFI Phase 2
Table 4 Number of Primary Schools reached directly – PCTFI Phase 2
Table 5
Number of children in KGBV (upper primary residential schools) reached directly –
PCTFI Phase 2 (three districts)
Table 6 Numbers of Teachers and Government Functionaries reached directly – PCTFI Phase 2
Table 7
Cluster wise and caste wise distribution of children in control and experimental district
(2013-14)
Table 8 Distance of school from nearest minority habitation (2013-14)
Table 9 Distance of school from nearest Dalit community (2013-14)
Table 10 Infrastructure Status of Control & Experiment Schools (2013-14)
Table 11 Data Analysis Framework
Table 12 Database and Methodology for the Research in PCTFI
Table 13 Over all scenario-Competencies achievement of Grade 2 children in Language (%)
Table 14 Competency wise Achievement of Grade 2 children in Mathematics (%) T1 and T5
Table 15 Competency wise Achievement of Grade 3 children of in Mathematics (%)
Table 16 Progress in average reading score of children 2015-2016 (%)
Table 17 Progress in competencies associated to reading skills 2015-2016 (%)
Table 18 Children Reporting Gender fair environment
Table 19 Girls participation and interest in class
Table 20 Gender analysis of students reading with comprehension (%)
Table 21 Total No. of Classroom Observations
Table 22 Teachers’ Classroom Practices (% teachers)
Table 23 Teachers’ Classroom Practices (% teachers)
Table 24 Lesson Plan (% teachers)
Table 25 Teaching Methods (%)
Table 26 Attendance of Boys & Girls during Classroom Observations recorded in table 25
Table 27 Students Engagement (%)
Table 28 Frequency & Nature of Teachers’ Interaction with the Children
Table 29 Quality of Teacher Participation in cluster forums
Table 30 Teaching Practices in motivation to learn
Table 31 Changes on student workload
FIGURES Figure 1 Social Stratification of Children of Grade 2 & 3 in Experiment & Control schools (%)
(2014)
Figure 2 Social Stratification of Teachers from Experiment & Control site (in number) 2013-14
Figure 3 Comparative Analysis of performance in Hindi for Grade-2
Figure 4 Comparative Trend Analysis of Performance in Hindi for Grade-3

4 | P a g e
Figure 5 Comparative Trend Analysis of performance in Maths for Grade-2
Figure 6 Comparative Trend Analysis for performance of Maths for Grade-3
Figure 7 Gender Gap- Maths
ABBREVIATIONS
BRC Block Resource Centre
BRG Block Resource Group
CC Cluster Coordinator
CCE Continuous and Comprehensive Evaluation
CIHQ Care India Head Quarter
CISSD CARE India Solutions for Sustainable Development
COT Classroom Observation Tool
CRC Cluster Resource Centre
CRCC Cluster Resource Centre Coordinator
DIET District Institute of Education and Training
DISE District Information System for Education
DRG District Resource Group
EBB Educationally Backward Blocks
GDI Gender Disparity Index
GEP Girls Education Program
GO Government Order
GOI Government of India
HDI Human Development Index
KGBV Kasturba Gandhi Balika Vidyalaya
M & E Monitoring and Evaluation
MHRD Ministry of Human Resource Development
NER Net Enrollment Ratio
OBC Other Backward Caste
OoSC Out of school children
PCTFI Patsy Collins Trust Fund Initiatives
QEC Quality Education Cell
RTE Right to Education
SC Scheduled Castes
SCERT State Council for Education Research and Training
SCORE State Collective for Right to Education
SDP School Development Plans
SMC School Management Committees
SSA Sarva Shiksha Abhiyan (Education for all)
ST Scheduled Tribes
TLM Teaching and Learning Materials
UP Uttar Pradesh
UPS Upper Primary School

5 | P a g e
EXECUTIVE SUMMARY
CARE India es uno de los cuatro países que implementó la Iniciativa del Fondo Fiduciario Patsy Collins (PCTFI) Cohorte 2. El objetivo del PCTFI es lograr un cambio significativo y sostenido en la vida de las niñas marginadas, garantizando sus derechos a una educación de calidad y desarrollo. PCTFI en la India apoyó el Programa de Educación de las Niñas de CARE India, en dos fases, la fase 1 de 2009 al 2014 y la fase 2 de 2015 al 2016. La intervención en la fase 1 se centró en 34 escuelas primarias rurales multigrado, llegando a 7,142 niños de 2do y 3er grado, en el distrito de Shrawasti, Estado de Uttar Pradesh, a través de un estudio longitudinal cuasi experimental centrado en el desarrollo docente. Basándose en la experiencia de la Fase 1, la Fase 2, se centró en el desarrollo de los maestros en torno a las habilidades de comprensión lectora y escritura de 1ro a 5to de primaria y el fortalecimiento de los KGBV (escuelas residenciales para niñas del 6to al 8vo grado de primaria). Esto se implementó, en tres distritos: Shrawasti, Bahraich y Balrampur, la mayor parte de las escuelas de intervención en esta fase fueron escuelas multigrado. La fase 2 alcanzó a un total de 114.414 niñas y niños de 1ro a 5to grado, de 480 escuelas, en 48 redes educativas (clusters). La intervención del PCTFI – Fase 1 en India se centra en los siguientes factores:
• Limitada capacidad de las y los docentes para implementar procesos de enseñanza-aprendizaje centrados en las y los estudiantes.
• El ambiente escolar marcado por el abandono, el miedo y el castigo físico. La premisa básica de la intervención es que si las y los docentes implementan adecuadamente en aula procesos inclusivos y centrados en las y los estudiantes, los docentes logran una comprensión real de los fundamentos de la enseñanza y aprendizaje de las matemáticas y el lenguaje, practican estrategias didácticas apropiadas y proveerán el apoyo académico adecuado. De esta manera, se logra una mejora de los resultados de aprendizaje de las y los estudiantes, especialmente de las niñas. La intervención comprende tres componentes de básicos del desarrollo y desempeño docente:
a. Talleres anuales de capacitación docente sobre el uso de enfoques inclusivos y centrados en las y los estudiantes para el manejo de las matemáticas y el lenguaje.
b. Reuniones mensuales con las y los profesores a nivel de cluster (red educativa) para analizar y planificar sus estrategias de enseñanza y aprendizaje, y
c. Soporte pedagógico in situ una vez al mes a cada docente a través de visitas en aula. Además de los tres componentes anteriores, también se organizó un día de trabajo con el/la directora de las escuelas, con el objetivo de desarrollar una actitud de apoyo del directivo hacia la intervención. La hipótesis del cambio se resume en lo siguiente:
a. La capacitación de las y los docentes sobre el aprendizaje centrado en las y los estudiantes y el manejo de una pedagogía inclusiva y sensible al género conduce a un cambio de las prácticas en aula: la calidad de las relaciones y de los procesos de enseñanza y aprendizaje mejorará y las aulas serán más inclusivas.

6 | P a g e
b. Las mejores prácticas inclusivas en aula permitirán a que todos los niños, especialmente a las niñas marginadas, logren mejores resultados de aprendizaje, mayor autoestima y confianza a una mejor participación en las aulas.
En el marco del estudio cuasi experimental, el sitio de ‘experimento’ está localizado en Shrawasti y el sitio ‘control’ en Gonda. Ambos distritos tienen bajos indicadores de desarrollo humano y pertenecen al lado Este del Estado Uttar Pradesh, el cual es considerado un estado económicamente deprimido. Las características principales son las frecuentes inundaciones y un alto porcentaje de población rural dependiente de la agricultra y con limitadas oportunidades económicas.
El estudio incluyó a 34 escuelas de experimento y 32 escuelas control. Las escuelas tanto del experimento como control tienen el mismo perfil. Los estudiantes y profesores tienen similar situación socioeconómica y provienen del mismo contexto cultural. Todas las escuelas primarias seleccionadas tienen al menos tres docentes y la misma proporción de niñas y niños matriculados.
El estudio cuasi experimental fue de carácter longitudinal y la recolección de los datos se realizó en 5 años del 2010 al 2014 en la fase 1 y un año de la fase 2 (T6). Las técnicas utilizadas, tanto en las escuelas de sitio experimento y control fueron las evaluaciones de los aprendizajes de las niñas y niños, observación docente y del aula y entrevistas. Entre los principales resultados tenemos:
1. Se incrementó los niveles de aprendizaje durante todos los años tanto en matemáticas y lenguaje. En el caso de matemáticas se alcanzó mejoras en competencias básicas y con cierto grado de complejidad. El incremento fue mayor en las niñas en las escuelas de intervención. Mejoras significativas se mostró en competencias básicas en lenguaje.
2. Se redujo la brecha de género, tanto en lenguaje como en matemáticas. Esta tendencia continuó en la fase 2 del proyecto, atribuyendo este resultado al enfoque inclusivo y sensible al género que implementaron los docentes.
3. El desarrollo y desempeño de los docentes focalizado sobre género y prácticas inclusivas crearon un ambiente facilitador de aprendizajes en las escuelas que impactó en los resultados de las niñas con la clara reducción de la brecha de género en el aprendizaje.
4. El funcionamiento de las redes educativas de los docentes fue altamente positivo para generar el auto aprendizaje, el intercambio y de colaboración en desarrollar los procesos de enseñanza y aprendizaje inclusivos, sensibles al género y centrados en los aprendizajes de las y los estudiantes.
El Programa de Educación de las Niñas, bajo el PCTFI Cohort 2 Phase 1 y 2 ha contribuido significativamente en el nivel de las y los estudiantes, docentes y comunidades. Los aprendizajes de esta experiencia han sido compartidos a nivel de los tomadores de decisiones y el gobierno. CARE a través de esta intervención en India ha construido una credibilidad importante y se ha constituido en un aliado estratégico del gobierno en India, que se refleja en la colaboración de CARE India en aspectos técnicos relacionados a los asuntos de calidad y equidad en la educación, especialmente en contextos de alta marginación, principalmente de las niñas. Experiencia que además CARE comparte en todos los programas de educación en los países en que interviene.
Julio, 2017

7 | P a g e
CHAPTER 1: INTRODUCTION
1.1 Background
• Care India launched its Girls’ Education Program (GEP) in 19961. Over the years GEP
has been able to test new models that are focused towards improving the opportunities
for marginalized2 girls and women through their increased participation in formal and
alternative education systems. Girls’ leadership and empowerment are at the heart of
GEP interventions. GEP implements comprehensive education programs that aim to
increase educational attainment, enhance gender equality, improve educational quality
and promote empowerment of marginalized girls in a holistic way.
• Building on these contexts, CARE India was one of the four countries implementing the
education program supported by the Patsy Collins Trust Fund Initiative (PCTFI, Cohort
2). PCTFI seeks to make a difference in the lives of the marginalized girls by ensuring
their rights to quality education and development. As part of this initiative, CARE India
implemented a quasi- experimental design intervention through which it measures
impact. The goal of PCTFI is to generate evidences to establish most effective practices
that may address issues of girls’ marginalization in Education. Through this experimental
research, CARE expects to contribute to the knowledge base towards empowering and
enabling most marginalized children; especially girls, achieve quality primary education.
• PCTFI supported grant in India was implemented in two phases, phase 1 from 2009-2014
and phase 2 from 2015-2016. The intervention in phase 1 was focused in 34 primary
multigrade rural schools, reaching 7142 children of grade 2 and 3, in Shrawasti district,
through a longitudinal quasi experimental study focusing on teacher development.
Building on the experiences from the Phase 1, Phase 2, was focused on teacher
development around early literacy and strengthening KGBVs (upper primary girls
residential schools), this happened in three districts, Shrawasti, Bahraich and Balrampur,
and most of the intervention for phase 2 are multigrade primary schools, the early literacy
teacher development intervention reached out to 114,414 children (grade 1 to grade 5) of
480 schools, in 48 clusters and the Upper primary (grade 6 to 8) intervention reached
directly to 24 KGBVs in these three districts.
• Among others, the PCTFI intervention in India focuses on the following factors as
important reasons for marginalization of girls in the sphere of education:
o Limited teachers’ capacity in transacting learner centered methods
o School environment marked by neglect, fear and corporal punishment
The basic premise of the intervention is that if teachers are oriented on using learner
centered and inclusive teaching method, they have an understanding epistemology of
mathematics and language, they practice appropriate instructional strategies and they
are provided academic support at regular interval, then it will lead to improved learning
outcomes for all children, especially girls. There are three components of this teacher
development intervention:
1 Girls Education Program (GEP): Key Features and Achievements, Care India, March 2017 2 Marginalised groups refer to dalits, adivasis (tribals), minorities, other backward castes and economically weaker sections of the society

8 | P a g e
a) Annual training workshops for teachers on use of inclusive and learner
centered approaches to transact mathematics and language
b) Monthly teachers meeting at cluster level to review and plan their teaching
strategies and
c) Onsite support to teacher once in a month through school visits.
Besides the above three components, orientations of head teachers in schools is also
organized, with an aim to develop a cooperative attitude of head teachers towards the
intervention.
• The long-term outcomes and impact of PCTFI Cohort 2 (phase 1 and phase 2) are seen
in the light of intensive work that was rolled out as part of this project and supplemented
through other projects such as Start Early: Read in Time, Teacher Resource Laboratory,
Community library, Join my village and School improvement project.
The outcomes and impact consider specific changes from PCTFI as well as the
influence of other project interventions on the integrated strategy implemented as part
of Girls education program in India. This strategy addresses social, pedagogical and
systemic domains to enhance learning outcomes of the most marginalized children,
especially girls in the public schools of India.
• This learning document has been informed by various PCTFI Cohort 2 India related
documents and research findings including: PCTFI Intervention in India, Strategy
Document, July 2014; Trend analysis, Time 1 to Time 5 Data (2010 -2014), Patsy
Collins Trust Fund Initiative (PCTFI) supported Research in Shrawasti Uttar Pradesh,
India, PCTFI-CISSD, 2015; PCTFI – Cohort 2 proposal, CARE India, 2015; Secondary
Research on Effectiveness of Cluster Approach on Teachers’ Behaviour, Classroom
Practices and Learning Outcomes (Under PCTFI), Kaarak, 2015; PCTFI Cohort 2 India
Final Narrative Report, 2016.
The effort in this report is to synthesize key learnings of 8 years program with especial
focus to its experience around the ‘quasi-experimental design’.
1.2 Context of the Intervention3
In context of India, there has been an instrumental progress and positive trends visible on some
educational indicators such as school infrastructure, enrolment, and movement of children
across primary level due to favorable policies (National Policy of Education-86, Right to
Education Act-09) and implementation instruments like Sarva Shiksha Abhiyan4 (SSA). Due
to this positive environment, as per DISE5 (District Information System for Education) data,
3 Section taken from PCTFI – Cohort 2 Proposal, CARE India, 2015. 4 Sarva Shiksha Abhiyan (SSA) is Government of India's flagship programme for achievement of Universalization of Elementary Education
(UEE) in a time bound manner, as mandated by 86th amendment to the Constitution of India making free and compulsory Education to the
Children of 6-14 years age group, a Fundamental Right. 5 District Information System of Education. The site provides useful information for policy planners on information management using most
modern software called District Information System for Education.

9 | P a g e
there is an improvement in enrolment from 83% in 2000 to 97% in 2013-14, projecting the
country to be well set to achieve cent percent enrolment in primary education by 2015.
Notwithstanding the increased enrolment figures, the dropout rate of children in India is still
high at 40% and 57% respectively at the primary and elementary levels6 around 38% boys and
52% girls in the age group 6-14 are enrolled but not attending school. The dropout data is high
for rural and urban poor, SCs and STs being higher than the average drop-out rate. Data also
reveals that states which are low in general and tribal literacy are also states with higher gender
disparity.7 India has more than 6.6 million children who are Out of School, the problem being
more acute for children and girls from Dalit and Adivasi Communities. (Ministry of Human
Resource Development, MHRD, 2014)
Despite the enactment of the Right to Education act in India five years ago, the government
data8shows that only 10% schools meet the key provisions given in the act. The functioning of
the school system does not address the diverse learning needs of children from a wide range of
cultural, economic and linguistic backgrounds. The lack of enabling environment in school
adds to the burden on vulnerable children, especially girls from Dalit and Adivasi communities,
who are already shouldering responsibilities in the household.
Safety and security issues have been considered as one of the prime causes due to which
children drop out from schools especially girls with poor achievement and lower self –esteem.
Several studies including MHRD on Exclusion and Inclusion of children in school and
classrooms, establish that girls are being physically, mentally and sexually abused in schools.
Which has resulted into poor attendance and lack of participation in learning processes. If we
look at the root causes for not having safe and secure environment in schools, it may be
understood under four broad strands; i) lack of physical infrastructure like boundary wall,
dysfunctional girls toilets, dilapidated school building, safe access to school ii) Insensitive and
humiliating teaching learning practices - Sensitivity in teachers for social and gender inclusion,
corporal punishment and mental harassment iii) lack of community knowledge for bringing up
cases of abuse and report them & iv) lack of accountability in system towards safety and
security for children.
The RTE Act mentions about the safety and security of children in schools along with clear cut
roles and responsibility of each of the stakeholders involved in. However, systemic readiness
seems to be poor to establish proper system for grievance redressed at different levels.
Simultaneously, it has also been recognized that in school, there is a lack of such platforms
where children can raise their concerns/issues, and also children especially girls are not
equipped with leadership skills that they could raise their voice and negotiate for their rights.
In 2011, the crimes against children reported a 24% increase from the previous year with a total
of 33,098 cases of crimes against children reported in the country during 2011 as compared to
26,694 cases during 2010. The State of Uttar Pradesh accounted for 16.6% of total crimes
against children at national level in 2011. Studies reveal that marginalized children especially
girls belonging to Dalit communities face a range of discrimination in schools as they don’t
6 Mehta A, 2002 Education for all in India with focus on elementary education: Current status, recent initiatives and future prospects,
Occasional papers, NUEPA 7 K. Sujatha, 2000 Strategies for education and training for the disadvantaged groups, working paper series, Education of India Scheduled Tribes, Study of the community schools in the district of Vishakhapatnam, Andhra Pradesh, UNESCO 8 DISE, 2013-14

10 | P a g e
feel themselves safe and secure.9 This shows that Safety and security concerns are emerging as
important factors in children’s learning and completing schooling especially for girls from
Dalit community.10
Despite resources being churned into the Educational system, data also shows that children are
not learning. In, UP, being the largest state with highest concentration of Dalit and Other
Backward Caste children attending government schools. The data on reading levels indicates
that only 43.8 per cent of children respectively are able to only read a class 2 textbook on
completion of 5 years of schooling.11 Teaching of language for the most marginalized requires
sensitivity of the teachers to address it both as a pedagogical and social construct. In the existing
scenario, teachers lack holistic support to address and deliver inclusive, quality education for
the most marginalized, which includes addressing their scholastic or the psycho-social needs.
In India, the role of Cluster Resource Centers12 under revised SSA framework for
implementation has been considered critical in building capacities of teachers and in providing
regular academic support to teachers and supervision of school processes. Right to Education
Act-09 also realizes the importance of these decentralized units in ensuring the delivery of
quality education and puts an obligation on state government to strengthen these institutions to
promote and support a process of school quality improvement. In the current scenario, inspite
of the above thrust on decentralised teacher development structures stated in different policy
documents, these structures at the grassroots are not functional, it is the teacher who is expected
to handle issues concerning quality, equity and diversity in their classroom all by themselves
in vacuum.
1.3 Issues to address
There are various problems faced by children from marginalized context especially girls in
accessing a quality education program13. The concerns vary from their safety security, to the
way they are being valued and treated in the classroom, to the teaching methods and practices
adopted in the classroom. Most of the children who are entering the system in the post “Rights
to Education” scenario are first generation learners, for whom interface with numeracy and
literacy can enable them to continue their education cycle or can force them to quit the
education system. The statistics on safety security concerns, learning levels specifically early
reading levels, articulates the seriousness to come up with holistic strategies to address the
educational and psycho social needs of girls from the most marginalized context.
In 2008, in the district Shravasti of State of Uttar Pradesh, a situational analysis was conducted
to ascertain the existing situation and factors that lead to marginalization of girls in the sphere
of education14. Various factors including school environment, quality of education, teachers’
capacity and gender-sensitivity, parents’ attitudes and aspirations for girls, work distribution at
household level and overall access of families to various government schemes and services
9 Study on inclusion and exclusion in nine states, MHRD, 2012
10 A vision document on safety and security for children in elementary schools in India; CARE India, 2015 11 Annual State of Education Report (ASER) 2013
12 The Cluster Resource Centres (CRCs) form the lowest rung of institutions in the vertical hierarchy for providing in-service training to
school teachers. http://mhrd.gov.in/TE_ov 13 As described in PCTFI-Cohort 2 Proposaal, CARE India, 2015. 14 PCTFI Intervention in India, Strategy Document, CARE India, July 2014.

11 | P a g e
were studied in context of girls’ marginalization. It is noteworthy that the population in the
district largely constituted of marginalised groups referred to as Dalits15. It was, and continues
to be, amongst the most backward districts of the state in terms of human development indices.
It is interesting to note that six years hence, as CISSD worked towards designing its long term
Program strategy, clearly laying down its Strategic Program Framework, it committed to focus
on the empowerment of the marginalised for its Program approach, clearly identifying Dalits
and Adivasis16 to be the two groups to focus upon.
The situation analysis (2008) identified some critical factors directly affecting education and
others as indirectly linked. The direct factors that negatively impacted girls’ participation in
education relate to schools, institutions and larger society. However, keeping in view the
availability of resources and CISSD’s own capacity, a prioritization exercise was done. The
team decided upon a couple of most crucial factors to work upon:
• Limited teachers’ capacity in transacting gender sensitive, learner centered methods
• School environment marked by neglect, fear and corporal punishment
‘Teacher’ being the fulcrum for quality education, it was logical to work with them and the
school settings in which they provide education to children.
In the above context, teachers play a critical role in creating the enabling environment for all
children especially girls from marginalized background to feel safe, valued and to enable them
with a voice to negotiate for their rights. It is often seen that the teachers who are entrusted
with these responsibilities are not inducted and prepared for the expectation. They work in an
environment where there is no support, encouragement or acknowledgement of the hardships
they face in isolation to address quality and equity issues. There is no platform where they can
voice their problems both at personal and professional front. A teacher in a rural school almost
fights a battle all alone, forcing the teacher either to innovate or end up in a hypocrisy that
nothing would and could be changed for better. The sad part is that most of the teachers chose
the second strand than the first one. In the above scenario, it is important to look for platforms
where teachers can gain strength from each other, have vent outs for their problems, look for
collective solution and reinforce themselves as social change agent.
Several studies reveal that decentralized teacher development institutions by and large have
failed to deliver their expected roles due to various administrative reasons, hence states
including Uttar Pradesh are finding challenges in making Cluster Resource centers (CRCs)
effective. In absence of regular academic support and supervision, teachers do not have any
platform, to strengthen their subject specific knowledge, to share the issues and challenges
faced during classroom processes and most importantly to reflect upon their personal issues
that hamper their roles.
The current proposal would try to address the problem: Teachers lack continuous capacity
building platform that promotes their understanding and sensitisation to deliver safe, inclusive
15 SC: Scheduled Castes the term including all historically discriminated communities of India out-caste and Untouchables and are listed as
the Scheduled Castes in the Constitution of India. 16 Traditionally referred as Adivasis, the communities identified as the Scheduled Tribes in the Article 342 of the Indian Constitution, are the other most marginalized groups in India. Constituting about 8% of the total Indian population (Census of India 2011), there are 645 tribes
(many overlapping types in more than one State) in different States and Union Territories.

12 | P a g e
and quality education catering to the needs of the most marginalized children especially girls
belonging to Dalit setting.
1.4 Patsy Collins Trust Fund Initiative (PCTFI), the intervention in India
Patsy Collins Trust Fund Initiative is aimed to bring significant and sustainable change in lives
of marginalized girls through education. CARE India Solutions for Sustainable Development
(CISSD) is one of four countries implementing the Patsy Collins Trust Fund Initiative (PCTFI),
Cohort 2 for CARE USA. The purpose of PCTFI is to generate evidences to establish most
effective practices that may address issues of girls’ marginalization in Education. Following
are the goals and objectives of Phase 1 and 2:
1.4.1 Goal and Objectives of Phase 1 and 2
Phase 117: Goal:
To assess the impact of teacher development on enhanced participation and achievement of
girls.
Objectives:
1) To facilitate change in teachers' practices, behaviour and attitudes for better quality
transaction and enhanced participation of girls
Impact
• Teachers practice gender sensitive and learner centred teaching method.
• Enhanced participation of girls and all children in class and school activities.
• Ensuring timeliness and quality of inputs to teachers
2) To understand and measure change in teaching-learning practices as well as
students' achievements
Impact
• Teachers understand the overall target population
• Changes emerging as a response to teacher development initiatives understood and
monitored
• Teachers improve their classroom practice based on well-documented feedback.
3) To enhance capacity of India team on research, data analysis and pedagogy
Impact
CISSD establishes its credibility in the area of research based intervention
4) To improve the quality of education being provided by government schools in
Shravasti through application of research findings
17 PCTFI Intervention in India. Strategy Document, CARE India, July 2014.

13 | P a g e
Impact
• Improved learning outcomes in language and math in the district
• Strengthened teacher development forums at cluster level
• Supportive supervision for teachers at the school and cluster level
• Collective actions initiated for quality education at school and community
level
• Strengthened networks and coalitions for quality, inclusive education in the
district
5) To apply PCTFI learning for substantiating advocacy efforts of CISSD
Impact
o Enhanced safety and security of children, especially girls, in schools
o Active cluster forums functional in Shravasti
Phase2: Goal, Objectives and Results18
To address Early Grade Reading, leadership skills and safety, security of children, especially
girls, from the marginalized Dalit communities in selected geography of Uttar Pradesh by
enhancing understanding and capacities of teachers in the Government Primary schools and
Kasturba Gandhi Balika Vidyalayas (KGBVs)
Objectives:
1. To empower teachers to deliver inclusive quality education for enhanced early grade
reading and leadership in children especially Dalit girls
1.1To strengthen capacities of teachers in the domain of early grade reading and
leadership development focusing on negotiation and voice
1.2 To build sensitivity amongst teachers to address safety security concerns of girls
focusing on Dalit girls
1.3 To build capacity of teacher support functionaries and institutions on capacity
building to teachers
2. To advocate with system for continuous teachers development approaches focusing on
early grade reading ,leadership ability and addressing safety and security of children
Results:
1. A holistic teacher development Cluster based approach functional in three districts of
UP
18 PCTFI Cohort 2 Phase 2 Proposal, CARE India 2015

14 | P a g e
2. Evidence based holistic teacher development approach focusing on addressing safety
security concerns, enhancing early grade reading and leadership ability in girls ready
for scale up.
1.4.2 Children, Teachers and Schools Reached Directly
As stated earlier, PCTFI in India had two phases, phase 1 from 2009-2014 and phase 2
from 2015-2016:
Phase 1 from 2009-14, the intervention was in 34 primary schools in one district Shrawasti
through a longitudinal quasi experimental study focusing on teacher development. All the
primary schools, where the intervention was, were multigrade rural schools:
Tables 1 and 2 show children and teachers reached with PCTFI-phase 1 in the intervention
respectively
Table 1 Number of children reached in 34 Primary School -Shrawasti- through Longitudinal
Quasi Experimental Study PCTFI Phase 1
TIME Grade II Grade III Cumulative
Boys Girls Boys Girls Boys Girls Total
Time-1 (FY 2009-10) 582 604 520 569 1102 1173 2275
Time-2 (FY 2010-11) 478 521 0 0 1580 1694 3274
Time-3 (FY 2011-12) 579 575 0 0 2159 2269 4428
Time-4 (FY 2012-13) 521 482 0 0 2680 2751 5431
Time-5 (FY 2013-14) 508 445 0 0 3188 3196 6384
Time-6 (FY 2014-15) 377 381 0 0 3565 3577 7142
3045 3008 520 569
Table 2 Number of Teachers reached in Multigrade Primary School Shrawasti,
through Longitudinal Quasi Experimental Study – PCTFI Phase 1
TIME EXPERIMENTAL
Male Female Total
Time-1 (FY 2009-10) 57 62 119
Time-2 (FY 2010-11) 56 57 113
Time-3 (FY 2011-12) 61 108 169
Time-4 (FY 2012-13) 50 80 130
Time-5 (FY 2013-14) 57 39 96
Time-6 (FY 2014-15) 0 0 0 281 346 627
Phase 2, there was an implementation intervention focusing on teacher development
around early literacy and strengthening KGBVs (upper primary girls residential schools),
this happened in three districts, Shrawasti, Bahraich and Balrampur. The early literacy
teacher development intervention reached out to 480 schools and the Upper primary

15 | P a g e
intervention reached directly to 24 KGBVs in these three districts. The majority of the
intervention primary schools are multigrade rural schools.
Tables 3 and 4 show children and teachers of primary schools, from grade 1 to grade 5,
reached with PCTFI-phase 2
Table 3 Number of children reached direcly in Multigrade Primary Schools -Shrawasti,
Bahraich and Balrampur – PCTFI Phase 2
Table 4 Number of Multigrade Primary Schools reached directly – PCTFI Phase 2
Year District Total
Shrawasti Bahraich Balrampur
FY 2014-15 120 200 160 480
FY 2015-16 120 200 160 480
FY 2016-17 120 200 160 480
Table 5 Number of children in KGBV (Upper Primary Residential Shools)
reached directly – PCTFI Phase 2 (three districts)
Year Boys Girls Total
FY 2014-15 0 2381 2381
FY 2015-16 0 2400 2400
FY 2016-17 0 2400 2400
0 7181 7181
YEAR Grade I Grade II Grade III Grade IV Grade V Total
Boys Girls Boys Girls Boys Girls Boys Girls Boys Girls Boys Girls Total
FY 2014-15 9562 9311 9770 9236 10075 9683 8550 8391 8641 7990 46598 44611 91209
FY 2015-16 6737 6495 0 0 0 0 0 0 0 0 6737 6495 13232
FY 2016-17 5141 4832 0 0 0 0 0 0 0 0 5141 4832 9973
21440 20638 9770 9236 10075 9683 8550 8391 8641 7990 58476 55938 114414

16 | P a g e
Table 6 Numbers of Teachers and Government Functionaries reached directly – PCTFI Phase 2
Year # of Teachers # of Block
Resource
Persons (BRPs)
# of Cluster
Resource Centre
Coordinators
(CRCs)
# of teachers in
KGBV
M F Total M F Total M F Total M F Total
FY 2014-15 1236 956 2192 66 5 71 41 7 48 14 125 139
FY 2015-16 939 868 1807 107 3 110 40 8 48 65 70 135
FY 2016-17 809 798 1607 65 4 69 114 14 128 70 121 191
2984 2622 5606 238 12 250 195 29 224 149 316 465
1.4.3 Strategy of intervention
A two fold strategy19 is adopted as part of PCTFI – phase1 support to improve quality of
education in government schools of Shrawasti, especially focusing on Gender-sensitive, Child-
centered, teaching and Learning processes:
• Quasi Experimental Research
• Quality improvement intervention
A.- Quasi Experimental Research: Teacher Capacity Building
The treatment site for the intervention is located in Ekauna block of Shravasti district in Uttar
Pradesh. The control site is located in the Rupaideeh block of neighboring Gonda. Both the
districts perform badly on key human development indicators and belong to Eastern part of
UP, which is considered an economically backward region. Frequent floods, high proportion
of agriculture-dependent rural population and limited economic opportunities are salient
features of this area.
34 schools in Ekauna, Shravasti are treatment schools whereas 32 schools in Rupaideeh, Gonda
are control schools. Schools in both control and treatment sites have similar profiles. The
students and teachers belong to similar socio-economic and cultural backgrounds. All the
schools selected have at least three teachers. Roughly similar proportion of boys and girls are
enrolled in the schools.
Three pronged strategy adopted specifically in the 34 schools
The ‘teacher development intervention’ in the 34schools focuses on capacity building of grade
2 and 3 teachers on learner centered and gender sensitive teaching learning approaches. These
are done through different platforms
• Annual training workshops
• Monthly teacher forums
• Onsite support
19 Section extracted from PCTFI Intervention in India. Strategy Document, CARE India, July 2014.

17 | P a g e
Annual training workshops
Annual training workshops are basically done in a residential mode and this lasts for around
ten days. The trainings focus on use of inclusive and learner centered approaches to transact
mathematics and language. It specifically focuses on building Teachers ‘understanding on
mathematics and language teaching, instructional methods, use of TLMs, management of
classroom and assessment of children. The workshops primarily also focus on sensitizing
teachers on gender and equity issues.
Monthly teacher forums
Teachers are oriented through the Cluster forums on monthly basis. These are platforms where
teachers from a cluster (consisting of 10 -11 schools) converge together every month.
Cluster Forum is conceptualized as a self-help commune, a group, which undertakes
responsibility for its own professional development. The two subjects that are being covered
by this intervention through these forums are mathematics and language (Hindi). The Cluster
forums mainly focuses on using learner centered and inclusive teaching methods, epistemology
of mathematics and language, instructional strategies &classroom management strategies.
These forums act as continuous capacity building platforms, where there is a linkage between
each forum. These meetings are used as a medium to reinforce the principles already discussed
in training. They also serve as platforms for sharing feedback and observations about ongoing
classroom practices. Teachers develop the plans for the month during these workshops. Role-
plays, reflection sessions and group exercises are integral to all these meetings.
Salient features:
• This is a platform where teachers meet up and converse on the experiences, problems,
successes and triumphs they encounter in their everyday classrooms.
• The central assumption behind the forum is that there is no absolute expert who can
provide solutions and address the needs of the group. Instead every member should
work together to seek collective solutions.
• Here the problems encountered are not theoretical or hypothetical in nature, they are
burning problems, which every practitioner wants to address to make their classroom
processes more effective and inclusive in nature.
• The Teachers' Forum is a flat democratic platform, where there is no hierarchy between
different participants. Everyone has the same stake over the issues and their strength to
influence a discussion or dialogue is based on their logic and reasoning strength rather
than their power or position.
Each of these monthly meetings are planned actively. The capacity building initiative is backed
by a follow up through onsite support by Cluster Coordinators (CC) at the school level.
Onsite support to teacher once in a month
Onsite support to teacher once in a month through school visits is provided by cluster
coordinators. Duration of each visit is 4-5 hours. During these visits, CCs seek teachers’
opinions about the progress and challenges during the month. Teachers may share, if any
success they received in implementing new methods of teaching that they learned through
monthly meeting, any modifications they made to that, any other method they tried and how it

18 | P a g e
worked. They may also share other problems related to classroom management. Model lessons
are also provided by CCs. Classroom observations to understand areas of teacher support will
be undertaken. CC and teacher undertake some activities that involve collaborative work e.g.
developing TLM, planning library usage, etc., which complements the training input. The CC
give an overall feedback to teachers based on the progress shared by teachers and their
observations.
B.- Supported quality improvement intervention in other clusters
The PCTFI intervention also focuses on improving quality of education in Shravasti district.
This along with the learnings from the research, is a linked and critical learning ground for the
overall GEP strategy in other districts of UP and other states as well.
The strategy involves a comprehensive school improvement approach for improving the quality
of education in government primary schools located in other geography, where the research is
not being conducted. The schools and teachers are being supported through technical support
provided by CISSD. The hypothesis is that children will be able to learn better, if teachers use
inclusive and learner centered approaches.
The PCTFI supported quality intervention in other blocks reaches 12 clusters, involving 11 to
schools/village per cluster and 396 teachers
The intervention focuses on a holistic approach trying to create a synergy amongst schools,
system and community. It rests on important four levers of change which includes, system
strengthening, teacher development school governance and collectivization, to empower the
girl child from the most marginalized context. Maintaining the focus on PCTFI research
strategy on Teacher Development, the strategy includes additional component of working with
Education institutions and Collectivization of Community.
Strengthening educational institutions
Educational institutions (CRC, BRC, DIET, and SCERT) are strengthened to institutionalize
mechanisms to provide supportive supervision and capacity building of teachers. Academic
teacher support Resource groups like BRGs/DRGs (Block/District resource Group) are
functionalized to sustain and institutionalize efforts of teacher development in the blocks and
district.
The capacities of school support functionaries are strengthened at the cluster, block and district
levels (CRCC, BRCC, BRP, and BEO) through monthly meetings, joint visits and reviews.
They are looked as catalyst and mentors, who will disseminate, enable and monitor the
processes across the district even after the program withdraws or exits from the district.
Mechanisms for joint reviews by government and civil society are initiated through which
lessons are shared and good practices are pushed for expansion across similar geography.
Teacher development
Teacher development is done in a similar fashion as in Treatment clusters. It is dealt through
annual trainings, monthly cluster forums and through follow up by onsite support. Through
continuous forums, focus is on language development and math skills. In language
development focus is on Hindi and efforts are also done to build perspective of teacher in
transacting English in the primary classes. As most of the schools, all the subjects are dealt by

19 | P a g e
single teachers, it becomes imperative for the teacher to transact Hindi, Math and English in
the same class.
In Uttar Pradesh, the State Government has introduced English from class one. There is huge
emphasis on rote memorization of alphabets as part of English instruction. There is no work
done in schools that focuses on creating a print rich environment, providing exposure to
children to hear, see, listen and speak the language. All the effort done by CISSD in the past as
part of Hindi language instruction is to build perspective on language teaching which uses the
strength of whole language and phonics approach. As single teacher is handling the primary
classes (especially classes 1, 2 & 3). It is often seen they teach both English and Hindi in
different manner. There is huge dearth even in the capacity of the teacher to transact English.
The effort through the monthly forums is to build capacity of teachers , build their perspective
on teaching language, help them create a print rich environment, create locally relevant TLMs
to supplement the effort . The focus is to enable children to express and make meaning as core
of language instruction.
The focus of language teaching both in Hindi and English at the beginning grades is to make
children get competent in early grade reading competencies. There is compulsion on the teacher
to teach different languages at the beginning grades. CISSD effort is to make it more organic
in terms of linking experiences from their mother tongues to Hindi and gradually transit to
English
Collective Action of community
Collectives are created and nurtured in schools and community of children especially girls and
through formal structures like SMCs that represent the voice and educational aspiration of girls
and women from Dalit community. The specific objectives to be achieved through these
collectives are to:
• institutionalise collective action in schools through different platforms for enhancing
leadership ability in Dalit girls
• strengthen School Management Committees in villages to facilitate inclusive
governance in schools
• create and empower networks of girls and boys in community to mobilize and advocate
for rights of Dalit girls
Efforts are targeted to alter in a meaningful way the relationships between state administrators,
power holder village leadership, teachers and the poorer, low-caste groups within their
communities. This is done by building alternative spaces and processes for hearing the
perspectives of those excluded on what underpins their exclusion, what they feel about
education can offer, and how they see education fitting into their economic and social survival
strategies.
Under the Right to Education Act 2009, (RTE)20, School management committees have been
constituted with specified roles and responsibilities. SMC can play a vital role in influencing
and acting as a pressure group on government to ensure effective implementation of the Act.
20 Right to Education Act (RTE), is an Indian legislation enacted by the Parliament of India on 4 August 2009, which describes the
modalities of the importance of free and compulsory education for children between 6 and 14 in India under Article 21a of the Indian Constitution. India became one of 135 countries to make education a fundamental right of every child when the act came into force on 1
April 2010.

20 | P a g e
Hence, various capacity building programs are targeted towards SMCs to bring community and
school together. Thrust is maintained on creating an enabling environment at family and
community level to build their understanding on issues like equity, diversity, mobility of girls
and specific challenges associated with girls and finding way forward through collective
process.
Efforts are made to endorse and facilitate the participation of Dalit girls at all levels, especially
at the level of SMCs. The efforts will result in the following:
i) Inclusive SMCs having representation of parents of Dalit girls, they are aware of
their rights and duties as members of SMC and are instrumental in formulating
School Development Plans (SDPs)
ii) Empowered Collectives: Representation of Dalit girls in the collectives who are
aware of their rights and duties as citizens and are instrumental in initiating civic
actions
iii) Leadership at School level: Dalit girls aware of their rights and duties , participate
and organise collective action in school where they exercise and demand rights from
concerned authorities (teachers, head teachers, SMC, panchayat representatives)
Advocacy efforts in Phase 1 and 2
In the PCTFI design, advocacy efforts are focused towards
o Enhancing safety and security of children, especially girls, in schools
o Developing appropriate technical material for teachers and teacher supervisors
around safety and security to develop their understanding
o Activating functional cluster forums for teacher development
o Documenting the key learning and approaches in the domain of teacher
development and advocate for their state-wide adoption and replication largely
by the Government system
o Influencing the state government (UP) to develop guidelines on provisions for
continuous teacher development forums by 2017.
The advocacy efforts are taken up at different levels for issues of safety and security of girls.
At the community level, advocacy is done through the SMC, panchayat structures and through
the collectives on issues of safety and security of children specially girls. This is done through
monthly SMC meetings at the school level. Community seminar held once quarterly at the
village and through the monthly meetings of the collectives, Through the collectives, boys and
men also receive positive messages about gender equality, alternate masculinity and non-
violence This helps in creating a conducive environment that helps in social access of girls to
schools and also helps in promoting attendance and retention of girls in the schools.
The issues of safety and security is taken up at district and state level through networking with
system functionaries in SSA at block, district and state level. CISSD has initiated creation of
safety and security manual to orient SMC members on safety and security issues. The effort is
initiated at the state level and CISSD supports training of master trainers and SMC members
at the district level.

21 | P a g e
At the state and national level, the issues of safety and security of girls is taken up through state
level consortium SCORE and at national level forums like the RtE forums. Efforts are put in
to identify the indicators during the social audit and public hearing as part of the consortium.
One of the other critical advocacy agenda, which CISSD is pushing forward is activating of
cluster forums for teacher development at the cluster level in the district. This agenda has been
a critical programming area focused as part of the PCTFI intervention. Advocacy is created
through creation of model teacher forums at cluster level as part of programming and bringing
in relevant system stakeholders to make joint visits to understand the model and work out
similar models in other clusters. The visits are not only restricted to the cluster and block
functionaries , where the cluster forums are functional , but efforts have also be taken up to
make cross visits from other blocks and districts to disseminate the learning from the approach.
It is important to note that the cluster approach has also potential to support the government
and policy makers by helping to strengthen teacher’s understanding on some of the recent
education reforms and play a critical role for their implementation; fully understand the
contexts of the subject matters and contents they teach; solidify their professionalism towards
contributing to strengthen student’s learning outcomes.
To achieve the advocacy aspirations around cluster forums for teachers CISSD is engaged with
multiple stakeholders including teachers, School Management Committees (SMC), policy
makers and government.
For evidence based advocacy, quality research and studies are undertaken to learn lessons and
share with others. In addition to advocacy, some technical pieces are also developed especially
in the core subject and leadership areas. Conferences & media campaigns are also organized in
partnerships with others for community awareness and systemic awakening.
1.4.4 Theory of Change
The basic premise of the intervention21 is that if teachers are oriented on using learner centered
and inclusive teaching methods, they have an understanding epistemology of mathematics and
language, they practice appropriate instructional strategies and they are provided academic
support at regular interval, then it will lead to improved learning outcomes for all children,
especially girls. Technical support to teachers will enhance teachers’ capacity on content as
well as methodology. Hence, they will transact language (Hindi) and mathematics classes in a
learner centered and inclusive manner. This will also impact on students’ participation in class
and consequently students will learn better. Children, especially girls will improve their
performance in mathematics and language.
In addition, PCTFI support was extended to the quality intervention component of the overall
Girls' Education Program in the other identified clusters in the district. Thus, CISSD set upon
collecting evidences for the existing longitudinal study from the control district Gonda,
intervention blocks in Shrawasti. While the research focused on a structured research design,
the other blocks of Shrawasti applied learnings from the research as well as included other key
components essential for the quality enhancement of the education in the government schools.
21 PCTFI Intervention in India. Strategy Document, CARE India, July 2014.

22 | P a g e
Hypotheses or propositions of effect/change:
a) Training of teachers on the learner centered, gender sensitive and inclusive
pedagogies will lead to change in classroom practices: quality of transactions will
improve and classrooms will be more inclusive.
b) Improved classroom practices and inclusive classrooms will enable all children,
especially marginalized girls to achieve better learning outcomes, enhanced self-
esteem and confidence and better participation in classrooms.
Evidences from across the world prove that layering of capacity building efforts at the level of
the cluster brings about greater success and sustainability. Most such sharing indicate that
teachers changed their teaching style from teacher – centric to student- centric and make efforts
to make the classrooms integrated.
CHAPTER 2: FRAMEWORK OF THE RESEARCH
This chapter22 specifically highlights about the research which was conducted as part of the
first phase of intervention. Following are the main characteristics both experimental & control
sites and analytical framework of the quasi-experimental research design.
2.1 About experimental and control group
The research intervention was implemented in 3 clusters of Ekauna block of Shravasti district.
In addition, three clusters of Rupaidih block of adjacent district Gonda are the control sites for
this intervention. There are 34 schools in the experimental clusters and 32 schools in control
sites. Intervention focuses only on grade II and III language and mathematics classes in the
government primary schools. There are 60 teachers23 in the experimental schools that are
responsible for grades 2 and 3.
As stated earlier, both the districts perform badly on key human development indicators and
belong to an economically backward region. Also, schools in both control and experimental
sites have similar profiles and the students come from agriculture-dependent rural families with
limited economic opportunities. Description of comparison groups from available information
is as follows.
2.1.1 Social Stratification of children
Both control and experiment districts are the most backward districts with respect to the human
indicators
22 Information concerning of this chapter has been taken from Trend Analysis, Time 1 to Time 5 Data (2010-2014). PCTFI supported
Research in Shrawasti Uttar Pradesh, India, CARE India 2015. 23 During Time 1 & Time 2, there were 59 teachers in experimental schools. Out of 59 teachers 10 teachers were transferred during Time 3
but 16 new teachers were added. During Time 4, 6 teachers were transferred and 1 new teacher was added to the list.

23 | P a g e
FIGURE 1.-
Social Stratification of Children of Grade 2 & 3 in Experiment & Control schools (%) (2014)
Social stratification of students reveals that majority of the children in experiment & control
sites are from OBC (Other Backward Caste) category (45 % & 40% respectively) whereas SC
(Schedule Caste) students in experiment site and general category students in control site
represent as the second highest category.
2.1.2 Distribution of children by gender and castes
There are around 48 per cent girls in the experimental schools and 49 per cent girls in the
control schools. 82 per cent of the girls in experimental schools are from the Dalit/other
backward castes as compared to 74 per cent in the control schools. The school size in Shrawasti
is bigger than Gonda. The 34 schools in Shrawasti have around 1898 students enrolled in
comparison to 1573 students in 32 schools of Gonda.
Kalyanpur cluster has more number of girls from Dalit community in comparison to any other
cluster in both the districts put together. Veerpur has substantial representation from minority
community. The clusters in Gonda have more students from General and OBC categories in
comparison to all the experimental clusters in Shrawasti.
Table 7 Cluster wise and caste wise distribution of children in control and experimental district (2013-14)
DISTRICT CLUSTERS CASTES TOTAL
SC OBC GEN MINORITY
Girls Boys G B G B G B G B Total
Shrawasti
(Experiment
al)
Kalyanpur 103 97 87 92 88 79 17 41 295 309 604
Ramwapur 53 53 168 200 18 10 27 57 266 320 586
Veerpur 60 67 160 139 55 42 82 103 357 351 708
Total 3 clusters 216 217 415 431 161 131 126 201 918 980 1898
23
45
15 1722
40
26
12
SC OBC GEN MINORITY
Shrawasti
Gonda

24 | P a g e
Gonda
(Control)
Achlapur
Bargadahi 39 47 84 75 50 49 13 19 186 190 376
Bhaganha 47 64 97 107 40 40 28 38 212 249 461
Fathegard 69 78 153 117 110 125 41 43 373 363 736
Total 3 clusters 155 189 334 299 200 214 82 100 771 802 1573
Grand Total 6 clusters 371 406 749 730 361 345 208 301 1689 1782 3471
2.1.3 Social information of teachers
Social stratification of teachers in the experimental and control districts shows that majority of
the teachers belong to the general category and the rest belong to the OBC, SC and minority as
second, third and fourth, in that order. There are 40 female and 49 male teachers in the
experiment site, where as there are 38 female and 43 male teachers in the control site.
The data reveals a substantial number of students from Dalit, other backward castes and
minority communities going to the government schools in the experimental schools. This
population of children is being educated largely by the teachers from the general category.
There are less than half number of female teachers in both districts.
Figure 2
Social Stratification of Teachers from Experiment & Control site (in number) 2013-14
2.1.4 School location
Two kinds of data are collected under PCTFI, one on the distance of schools from the nearest
minority (Muslim) community and the other on the distance of schools from the nearest Dalit
community. As per the Right to Education (RtE)24 Act all primary schools need to be within 1
kilometre (km) of a habitation.
24 The Right of Children to Free and Compulsory Education Act or Right to Education Act (RTE), is an Act of the Parliament of India enacted on 4 August 2009, which describes the modalities of the importance of free and compulsory education for children between 6 and
14 in India under Article 21a of the Indian Constitution.[1] India became one of 135 countries to make education a fundamental right of every
child when the act came into force on 1 April 2010.[2][3][4]
Source: Sarva Shiksha Abhiyan, Framework of Intervention, page no- 13 (1)The area within which a school has to be established by
appropriate Government or local authority shall be: in respect of children in classes I to V, a school shall be established within a walking
distance of one km of the neighbourhood (3) In places with difficult terrain, risk of landslides, floods, lack of roads and in general, danger
for young children in the approach from their homes to the school, the appropriate Government or the local authority shall locate school in
such a manner as to avoid such dangers, by reducing the area or limits specified under sub-rule (1).
59
11
16
2119
354 4
79
25 25
25
Female Male Female Male Female Male Female Male
SC OBC GEN MINORITY
Shrawasti Gonda

25 | P a g e
Table 8
Distance of school from nearest minority habitation (2013-14)
District Cluster < 1 KM 1-4 KM
Gonda (control) Achlapur Bargadahi 6 2
Bhaganha 5 4
Fathegard 10 5
Total control schools 21 11
Shrawasti (Experimental) Kalyanpur 7 7
Ramwapur 3 5
Veerpur 5 7
Total experimental schools 15 19
Grand Total 36 30
The data on the schools closer to minority communities in experimental and control districts
show that in the control district 65 per cent of the schools are within this norm but there are
still 35 per cent schools which are situated at a longer distance, even upto 4 kms. The
experimental district is not doing any better, with only 44 per cent schools located as per the
norm and 56 per cent schools are situated between 1 to 4 kms.
Table 9
Distance of school from nearest Dalit community (2013-14)
With respect to the distance of schools from the Dalit community in the control district Table
1.5 shows that 62 per cent schools are within the norm of 1 km but 38% schools are located up
to a distance of 4 kms. In Shrawasti, only 23 per cent schools follow the norm of 1 km.
The above has a bearing on uniform enrolment and regular attendance of children in primary
schools. There are safety and security issues for children, especially for girls, which hampers
their active participation in school. It is also a problem for teacher attendance in terms of their
commuting long distances to reach school.
District Cluster < 1 KM 1-4 KM
Gonda (Control) Achlapur Bargadahi 5 3
Bhaganha 4 5
Fathegard 11 4
Gonda Total Schools 20 12
Shrawasti (Experimental) Kalyanpur 7 7
Ramwapur 0 8
Veerpur 1 11
Shrawasti Total Schools 8 26

26 | P a g e
2.1.5 Infrastructure conditions
Table below reflects some important data with respect to the infrastructure. The norm of having
a separate toilet for girls has been addressed to a large extent (72 percent in control and 88
percent in experimental). Same is the situation with respect to having a separate toilet for boys
(72 percent in control and 88 percent in experimental). However, the use of these toilets is
fairly poor in case of both. The data shows that in control district only 37 per cent girls and
boys use the toilet. Similarly, in the experimental district only 24% girls and 21% boys use the
toilets. This is because of the non-functionality of the toilets in schools and the issue of keeping
it clean. As a result, while issues of safe drinking water and construction of toilets is addressed
to a large extent, the usability of toilets remain a concern. Overall there is a depleting
infrastructure in schools.
Table 10
Infrastructure Status of Control & Experiment Schools (2013-14)
Description Control Experiment
No Yes Total No Yes Total
Boundary wall 21 11 32 4 30 34
Gates 21 11 32 15 19 34
Sports grounds 15 17 32 6 28 34
Use the common toilet 31 1 32 34 0 34
Separate girls toilet 9 23 32 4 30 34
Use of the girls toilet 20 12 32 26 8 34
Separate boys toilet 9 23 32 4 30 34
Use of the boys toilet 20 12 32 26 7 33
Light 22 10 32 22 12 34
Safe drinking water facility 3 29 32 5 29 34
Classroom as per norms 17 15 32 11 23 34
Safe ramps as per norm 5 27 32 9 25 34
Black board 0 32 32 0 34 34
Green board 32 0 32 5 29 34
Availability of library books 27 5 32 6 28 34
Learning corner for children in school 31 1 32 23 11 34
Science kit in school 32 0 32 29 5 34
Math kit in school 31 1 32 27 7 34
Other important data inferred is the following:
• 90 percent schools in control and 85 percent in experimental district have safe drinking
water.
• 84 percent control schools and 74 percent experimental schools have safe ramps for children

27 | P a g e
• While 68 percent experimental school have classrooms as per norms, only 37 per cent
control schools have such classrooms
• Blackboards are present in ALL schools but greenboard is present only in 85 per cent
experimental schools but none in control schools
• Only 15 per cent of control schools as opposed to 83 per cent of experimental schools are
equipped with libraries.
• One third experimental schools as compared to negligible control schools have started to
maintain learning corners for children.
• Only 15 percent and 17 per cent experimental schools have science and math kits against
none/negligible in the control schools.
• Other infrastructure in the control and experimental schools show a depleting state -
boundary walls in 88 per cent of experimental but only in 34 per cent of control schools,
gates in 34 percent control and 56 per cent experimental, playground in 53 control and 82
experimental, adequate light in 31 per cent control and 35 per cent experimental).
2.2 Analytical framework: Data series and Methodology
Data for trend analysis pertains to the Research component of PCTFI across Time 1 to Time 5
period (2010-2014). This data series is referred to as Time 1 (T1)- 2010, Time 2 (T2)- 2011,
Time 3 (T3)- 2012, Time 4 (T4)- 2013, Time 1 (T1)- 2014.
The following tools have been used for data collection:
• Children’s assessment
• Teacher Observation
• Classroom Observation
• Teachers’ Interview
• Children Interview
• Whole School information

28 | P a g e
Analytical framework with clear indicators measured by each of the tool is given in the Table
11:
Table 11
Data Analysis Framework
Table 12 presents the tools used and the analytical framework for the research. The database
emanating from these have been used to get the trends.
Tool Indicators
Teacher Observation
Tool (COT 1)
1. %age of teachers using various teaching methods
2. Extent of children participation in different teaching methods
3. Level of teachers’ behaviour in classroom processes
4. Teachers' language in classroom processes (gender & caste
sensitive)
5. Extent of teachers' engagement with girls & boys during
classroom processes
6. Extent of TLM used by teachers, girls & boys
7. Extent to which teachers offer assistance to girls & boys and
move around the classroom
8. % of teachers prepare lesson plan with objectives & processes
9. %age of teachers keep record of each students learning level and
update it
10 %age of teachers found to handle the multi-grade classroom
well
Classroom
Observation Tool
(COT 2)
1. Frequency of teachers calling on girls & boys
2. Frequency of girls & boys speak in class
3. Frequency of teachers rewards/praises girls & boys
4. Frequency of teachers disciplines/punishes girls & boys
Teachers' Interview 1. How have the expectation of teachers towards girls' & boys'
educational and/or career attainment changed over time
2. How have the teachers' gender-sensitive practices changed over
time
Children Interview 1. To what extent do girls & boys differ in their workload
2. To what extent have girls' & boys' workload changed over time
3. What is the relationship between workload and student
achievement in hindi & mathematics
One Time
information/Monthly
reports of Cluster
Coordinators
1. Social stratification of enrolled children & teachers (Experiment
Vs control site)
2. No of School having good & usable infrastructure facilities -
item wise
3. Reasons for not attending schools i) Social Obstruction ii)
Physical Obstruction
4. Average distance of school from Dalit Community & Minority
Community

29 | P a g e
Table 12
Database and Methodology for the Research in PCTFI
1 2 3 4 5 6
Common item:
Teacher observation
tool (COT 1)
Common item:
Teacher
interview
Classroom
observation tool
(COT 2)
Children’s common item Children’s
Assessment
One time
information
tool
Target (on
whom)
Teachers in treatment
and control sites
Teachers only in
treatment schools
Teachers in treatment
and control sites
Select grade 2 and 3
children from treatment
schools
Grade 2 and 3
children in
treatment and
control sites
Whole school
Once in an academic
year
Once in an
academic year
Once in an academic
year
Once in academic year Twice in an
academic year
Once in an
academic year
Sites All 32 control and 34
experimental schools
All 34
experimental
schools
All 32 control and 34
experimental schools
34 experimental schools All 32 control and
34 experimental
schools
All 32 control
and 34
experimental
schools
T1 Mar-Apr/2010 Apr - May/2010 Apr-May 2010 Dec 2010-Jan-2011 Nov-Dec-2010 Sep-Oct 2010
T2 Mar-May/2011 Apr- May/2011 Mar-Apr 2011 Nov-Dec 2011 Apr-May-2011 Sep-Oct 2011
T3 Apr-May/2012 May-August/2012 Apr-May, 2012 Nov 2012 Mar-Apr-2012 Sep-Oct 2012
T4 Apr-May/2013 May- 2013 Apr-May, 2013 Nov 2013 Mar-Apr-2013 Sep-Oct 2013
T5 March - April, 2014 March - April, 2014 tbd in Nov 2014 tbd in Nov 2014 Mar-Apr, 2014 tbd in Nov 2014
Male 94 28 94 135 1042 (Grade II-524,
Grade III-518)
Female 108 31 108 138 1126 (Grade II-558,
Grade III-568)
This tool was
administered along
with common item on
teacher observation
Majority of students were
grade II student(211), so
that they may be tracked in
next year

30 | P a g e
Data cleaning Frequency analysis and
cross tabulation on each
variable of the tool to
check data consistency
Frequency analysis
and cross tabulation
on each variable of
the tool to check data
consistency
Frequency analysis and
cross tabulation on each
variable of the tool to check
data consistency
Frequency analysis
and cross tabulation
on each variable of
the tool to check
data consistency
To check
Normality of
the variables
Examine One
Quantitative
Variable
Calculate percentage of
instances showing a
particular incidence:
how many times girls
spoke in class
Code
management
Calculate %
observations showing
one incidence. For
example, how often
'questioning' method
was used in 202
observations
Calculate % of each sub
items of a key parameter of
the tool (Learning time of
girls/boys at home and in
school, girl's/boy's opinion
about intelligence etc.)
Know the number
of children by
gender, school,
cluster etc. %
students scoring in
the competencies
Examine
Relation
Between Two
Categorical
Variables
This gave the count of
incidences of an even
segregated by a
category.
To segregate data based
on experimental sites,
gender of teachers and
subjects; Eg. whether
teacher from control site
praised girls more or
teachers from treatment
sites praised girls more
To segregate data
based on experimental
sites, gender of
teachers and subjects.
For example, whether
lecture method was
more often used in
Hindi or in
Mathematics
To know how often boys
felt confident while
answering in class and how
often girls felt confident in
speaking in class….similar
other factors
Relation
Between One
Quantitative
Variable &
One
To know average
number of times, girls
spoke in class in
treatment sites v/s
average number of
To look at the
average number of
instances when
teacher moved in
class, or talked on
We created scales based
on reliability analysis.
Some items were grouped
together under various
headings 'perception
Mean scores by
gender and
experimental were
compared

31 | P a g e
Categorical
Variable
times girls in control
sites …..this was often
used after T test to
check in which site the
'mean' is greater
phone, or used a
particular method
and so on based on
site, gender, subject
etc.
about work load' ,
'perception about study
time' etc then we
compared the mean on
each scale based on
gender of student. (Since
item was only used in
treatment sites, we could
not compare it by sites)
Testing the
mean value of
a distribution
To test whether the
difference between 2
means was statistically
significant or not.
To test whether the
difference between
2 means was
statistically
significant or not.
To test whether the
difference between 2
means was statistically
significant or not.
To test whether
the difference
between 2 means
was statistically
significant or not.
Testing the
mean value of
a distribution
contains more
than two sub
group
It was used in
combination with T-
test
It was used in
combination with T-
test
It was used in
combination with
T-test; to check
cluster wise
variations
Non-
parametric
test used
when data
consist
nominal or
ordinal
variables
To compare responses
under three or more
categories. For example,
children were asked when
someone hurts you, do
you seek help from
mother, father, sister,
brother, friend and so
on…
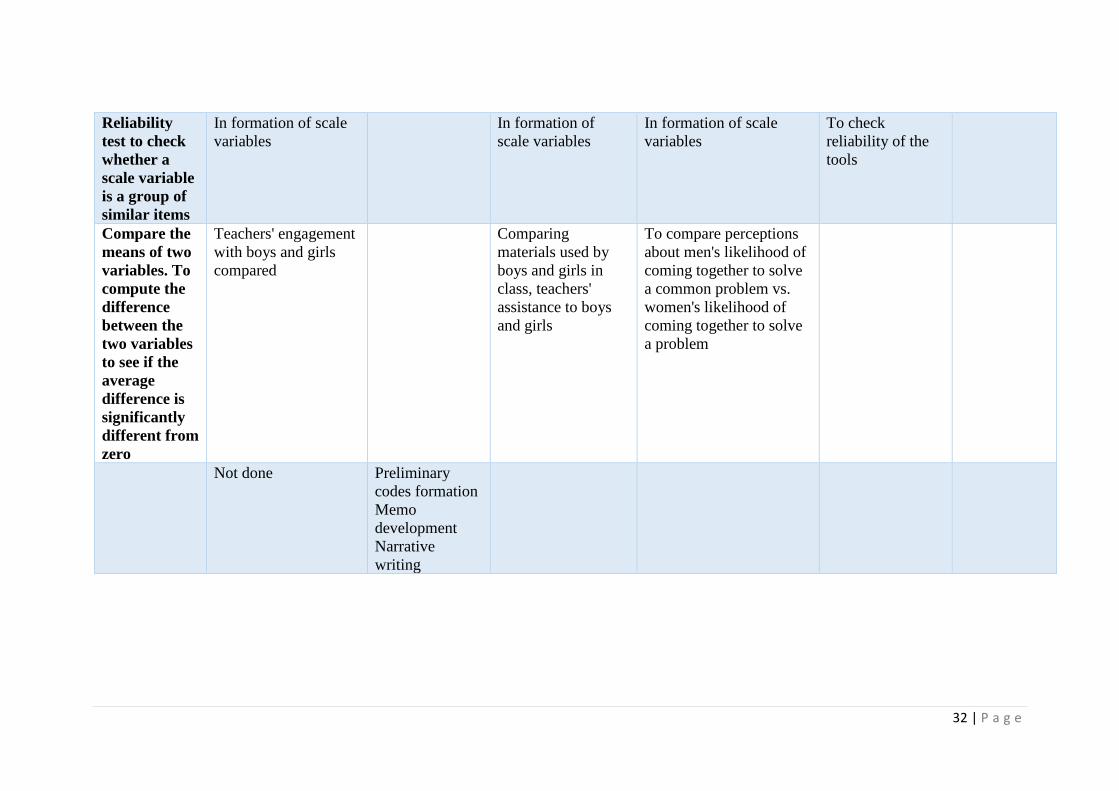
32 | P a g e
Reliability
test to check
whether a
scale variable
is a group of
similar items
In formation of scale
variables
In formation of
scale variables
In formation of scale
variables
To check
reliability of the
tools
Compare the
means of two
variables. To
compute the
difference
between the
two variables
to see if the
average
difference is
significantly
different from
zero
Teachers' engagement
with boys and girls
compared
Comparing
materials used by
boys and girls in
class, teachers'
assistance to boys
and girls
To compare perceptions
about men's likelihood of
coming together to solve
a common problem vs.
women's likelihood of
coming together to solve
a problem
Not done Preliminary
codes formation
Memo
development
Narrative
writing

33 | P a g e
CHAPTER 3: MAIN FINDINGS
The learner’s assessment data in PCTFI captures25 the achievement of the students in
grade 2 and 3 in language (Hindi) and mathematics. It also provides for the competency
wise achievement in these subjects. The sections in the chapter are organized as per the
achievement in each of the subject area for grade 2 and 3.
3.1 Increased learning outcomes in language and mathematics
3.1.1 Learners’ result in Language for Grade 2 & 3
Figures below show that the average achievement scores in language for grade 2 and 3
have steadily improved in Shrawasti as well as in Gonda. At the same time the gap in
average scores between boys and girls has decreased over time, especially for grade 3
scores from T1 to T5. This reflects that girls are speeding up with boys in performance.
25 Topics of this chapter are taken from the following reports: Trend analysis, Time 1 to Time 5 Data (2010-2014) PCTFI supported research in Shrawasti Uttar Pradesh, India. Care India, 2015; ‘Secondary Research on Effectiveness of Cluster Approach on
Teachers’ Behaviour, Classroom Practices and Learning Outcome, Kaarak, 2015 and PCTFI Cohort 2 Final Narrative Report, 2016.
T1 T2 T3 T4 T5 T6
Control boys 6.1 9.1 7.0 10.3 11.5 11.4
Control girls 5.6 7.2 6.2 9.0 8.5 11.2
Experiment boys 6.4 10.1 10.7 11.8 10.6 13.8
Experiment girls 5.3 8.0 9.2 10.1 8.9 11.3
0.0
2.0
4.0
6.0
8.0
10.0
12.0
14.0
16.0
Mean
Sco
res
Figure 3
Comparative Analysis of performance in Hindi for Grade-2

34 | P a g e
There was an improvement in early literacy scores recorded from T1 to T6 in some
important basic level competencies in grade 2 and 3 (sound symbol association, word
formation, picture reading, listening comprehension).
Table 13
Over all scenario-Competencies achievement of Grade 2 children in Language (%)
Grade 2- Hindi T1 T5 T6
Competencies in % Control Exp Control Exp Control Exp
B G B G B G B G B G B G
Listening & Identification of 2
letter words
26 26 28 26 10 33 52 43 45 47 55 49
Listening & Identification of 3
letter words
29 29 24 24 10 35 54 44 39 45 55 51
Pairing of picture and word part 40 28 41 34 10 44 56 40 55 54 64 55
Word formation with a
particular letter
6 7 9 5 4 17 23 18 34 28 39 29
Picture identification and
writing
20 18 24 17 8 22 31 24 34 35 42 31
In grade 3, 70% children could identify letters and establish sound and symbol
correspondence. In higher order competencies like (reading comprehension, writing)
children’s performance did not show much progress in comparison to baseline scores,
T1 T2 T3 T4 T5 T6
control boys 7.4 9.4 7.8 8.1 12.5 12.3
control girls 5.4 7.4 7.0 7.2 10.9 9.3
Experiment boys 8.2 10.5 10.1 10.3 11.0 11.3
Experiment girls 6.5 8.9 8.2 9.3 9.6 9.2
0.0
2.0
4.0
6.0
8.0
10.0
12.0
14.0
Mean
Sco
res
Figure 4
Comparative Trend Analysis of Performance in Hindi for Grade-3

35 | P a g e
around 11% children could read fluently and comprehend in comparison to 5% children
in T1.
Trends of average achievement of grade 2 children in Hindi reveals that from Time 1 to
Time 5 there has been an increase in average achievement score of control and experiment
sites respectively. However, the increase in the control schools has been less consistent.
The analysis shows children, especially girls were getting more opportunity in
experimental schools. This can be correlated with the language instruction methods that
has been used in the experimental schools over a period which is more participatory in
nature.
Significant improvement is recorded from T1 to T5-T6 in some important competencies
(identifying two & three letter words, pairing pictures & word, word formation, picture
reading). Children of experiment site doing better than control group with about 50 %
children from experiment site able to identify two and three letter words and pairing of
pictures with words.
3.1.2 Learner’s Assessment in Mathematics in Grade 2 and 3
Steady improvement in math is recorded both in experiment schools in grade 2 and 3,
with higher increase for girls. The girls’ achievement score in grade 2 has more than
doubled from T1 to T5. The gender gap in the scores has also steadily decreased from T1
to T5, indicating better performance of girls in mathematics in grade 2 and 3.

36 | P a g e
T1 T2 T3 T4 T5 T6
Control boys 4.1 5.7 4.7 6.5 8.8 7.4
Control girls 2.8 4.1 3.7 5.2 5.5 6.8
Experiment boys 4.2 6.9 7.5 8.2 7.2 10.7
Experiment girls 2.5 4.4 5.0 5.9 5.4 6.9
0.0
2.0
4.0
6.0
8.0
10.0
12.0
Mean
Sco
re
Figure 5Comparative Trend Analysis of performance in Maths for Grade-2
T1 T2 T3 T4 T5 T6
Control boys 5.4 7.1 5.0 6.2 10.8 9.1
Control girls 3.3 4.6 4.2 4.8 8.0 6.9
Experiment boys 6.3 8.5 7.1 8.9 9.4 8.7
Experiment girls 4.2 5.8 5.7 7.6 8.2 7.3
0.0
2.0
4.0
6.0
8.0
10.0
12.0
Mean
Sco
re
Figure 6Comparative Trend Analysis for performance of Maths for Grade-3

37 | P a g e
In grade 3, both boys and girls showed a marked increase in the achievement scores. All
the three experiment clusters performed better over time, with increase being substantial
for girls in experimental schools. The control clusters too showed an increase from T1 to
T6 (PCTFI Cohort 2 Final Narrative Report, CARE 2016).
Table below shows there is a considerable improvement in basic concepts (counting,
spatial sense) and improvement in conceptual themes like place value (from 0% to 12%).
However, the increase is negligible in higher level competencies like application concepts
(operations, length), for both control and experimental schools in grade 2 and 3.
Table 14
Competency wise Achievement of Grade 2 children in Mathematics (%) T1 and T5
Class-2
Competency
Time 1 Time 5
Control Experiment Control Experiment
Boys Girls Boys Girls Boys Girls Boys Girls
Count & write 26.0 17.1 24.6 14.2 37.2 19.3 36.0 27.5
Write the place
value of the number
0.0 0.0 0.0 0.0 14.2 8.3 12.9 10.0
Simple addition of 3
digit number
20.2 14.6 23.2 12.3 27.2 16.1 25.2 19.4
Understanding of
concept of shape
9.9 7.1 10.9 9.7 34.6 33.5 39.5 35.9
Understanding of
concept length
8.5 8.2 7.0 4.9 28.6 19.3 20.7 15.8
Understanding of
concept of Time
37.7 28.1 39.8 25.7 48.4 36.7 47.1 37.7
Table 14 shows that the girls in the experimental schools have done better than the control
group in the basic competencies. They have also shown notable gains in these
competencies over the control group. Competencies in shapes and time showed maximum
achievement scores.
Table 15 shows for Grade 3 similar trends as in grade 2, with improvement shown in only
basic competencies (identify 3 digit numbers, count and write, additions). In addition,
improvement over T1 is seen in concepts related to time and calendar. Rest of the
competencies show negligible gains (subtraction, multiplication, division, fractions).

38 | P a g e
Table 15
Competency wise Achievement of Grade 3 children of in Mathematics (%)
3.2 Learning Achievement: Read in Time - PCTFI Phase 2, all 3 districts26
The child assessment survey tool used for data collection in the baseline study was used
to assess the current reading competency of students. Students who completed grades I to
IV were surveyed in selected districts in Uttar Pradesh.
A representative sample 1703 child were collected from UP. The sample had equal
representation of girls and boys and included students belonging to various marginalised
communities, such as Dalit, Adivasi, OBC and religious minority.
In order to assess a child’s overall progress in reading ability, the research framework
covered five competencies associated to one’s reading skills, namely- phonemic
awareness, phonic awareness, comprehension (listening and reading), reading fluency
and independent writing.
There has been an average improvement of 15 % in capabilities (in reading skills) of
children across grades compared to baseline score. The table below describes progress in
average reading score of children as per assessment conducted in 2016 (Baseline 2014 and
midline study 2016).
26 Section extracted from PCTFI Cohort 2. Final Narrative Report, CARE 2016.
Class-3 Competency Time 1 Time 5
Exp. Cont. Exp. Cont.
Identify 3 digit numbers 13 8 23 31
Count & Write 24 17 42 44
Addition in equation form 7 5 10 13
Simple addition of 3 digit number 29 24 27 35
Addition through carry over 2 digit 17 14 21 19
Addition through carry over 3 digit 15 12 19 16
Simple subtraction of 3 digit number 19 17 24 26
Subtraction through carry over 8 5 10 9
Complex subtraction in equation form 6 4 8 13
Multiplication through carry over (2-1 digit) 10 10 17 16
Multiplication through carry over (3-digit) 11 9 15 16
Multiplication in equation form 3 2 7 8
Simple división 11 11 16 17
Understanding of concept of shape 3 2 19 13
Understanding of concept of length 3 3 13 18
Understanding of concept of time 41 37 53 57
Understanding of concept of calendar 18 14 32 32

39 | P a g e
Table 16
Progress in average reading score of children 2015-2016 (%)
Class Year 2015 Year 2016
Grade 1 18 % 36%
Grade 2 25 % 38%
Grade 3 29% 48%
Grade 4 35% 51%
There is an improvement in all four grades in Uttar Pradesh from the baseline results. The
change is more prominent in grades III and IV (where the increase is of 12 and 9
percentage points respectively) than in the lower grades (where increase is 4 and 3
percentage points respectively). See the table below.
Table 17
Progress in competencies associated to reading skills 2015-2016 (%)
Grades Phonemic
awareness
Phonic
awareness
Listening
comprehension
Reading
Fluency
Independent
writing 2016 Baseline 2016 Baseline 2016 Baseline 2016 Baseline 2016 Baseline
Grade I 40 11 27 15 74 40 5 2 9 4
Grade II 50 21 34 27 76 45 13 10 17 10
Grade III 67 31 50 35 70 38 25 19 24 15
Grade IV 70 40 57 48 60 32 31 27 17 10
The overall percentage of students who have phonemic awareness increased from 48% in
baseline (2015) to 68% in 2016. There has been a significant improvement in this
competency, from 26% of the students having the ability to identify and differentiate
sounds in baseline, the percentage increased to 57%. The growth is consistent in all four
grades in the state.
There is an 11% increase in the percentage points in average phonic awareness in all four
grades in Uttar Pradesh. Additionally, similar to the trend in phonemic awareness and the
trend in phonic awareness in the baseline, the competency increases with advancement in
grades.
The overall percentage of students who were able to correctly answer questions based on
a passage read to them increased from 39% to 70%. This level of improvement is
consistent in all four grades in UP. Hence, majority of the students in Uttar Pradesh were
able to demonstrate the ability to comprehend while listening
There is a seven-percentage point improvement in the results in Uttar Pradesh in
comparison to the baseline. The level is highest in grade IV where 24% of the students
demonstrated having this competency.

40 | P a g e
3.3 Reduced gender gap in achievement in both language and mathematics
By end of phase 1, gender gap in achievement in both language and mathematics
narrowed, reflecting girls speeding up with boys and reduced much more for the
experiment schools. The trend continues in phase 2, attributing to a more gender sensitive
approach followed by teachers (Secondary research, GEP (2015), Baseline study, Kaarak (2015),
Annual assessment, GEP (2016))
Table 18 Children Reporting Gender fair environment
Children report gender-fair
environment T1 T2 T3 T4 T5
B G B G B G B G B G
Do you think your
teacher calls on girls
and boys the same
number of times?
Equal 43 57 61 72 68 71 61 65 72 58
Girls > boys 18 20 11 16 11 14 12 20 9 25
Boys > girls 39 22 28 13 21 15 26 15 18 17
Who does your
teacher ask more easy
questions to?
Equal 53 57 63 72 71 66 64 66 71 63
More for girls 21 23 18 13 14 20 13 18 11 20
More for boys 25 20 19 15 14 14 23 15 18 18
Who does your
teacher ask more
difficult questions to?
Both equally 36 46 42 59 62 61 54 60 59 59
More for girls 24 12 15 13 14 9 20 13 19 16
More for boys 40 43 43 28 24 30 25 27 22 25
Who do teachers
reward / praise more
when girls and boys
do good work?
Both equally 52 58 57 70 81 73 65 73 75 74
More for girls 19 29 13 19 9 20 18 15 8 16
More for boys 28 13 30 11 10 7 17 13 16 11
When girls are teased
by boys, who usually
helps solve the
problem?
Both 30 28 44 52 42 38 46 47 51 49
More female
teachers
30 36 28 29 27 36 20 28 16 27
More male
teachers
40 26 27 17 30 25 33 22 29 24
Neither 1 10 2 2 2 1 1 2 4 1
The table shows that the children feel there is more of an equal and fair environment for
both boys and girls to participate, this perception has shown an upward trend from T1.
Girl speaking in class
Girls speaking in class is one of the immediate indicator of their participation and
interest in class. This is possible if a fair and conducive environment is built by the
teachers. In all the experimental clusters girls participation showed an increasing trend

41 | P a g e
from T1 to T6, this was true both in Language and Math class (PCTFI Cohort 2 Final
Narrative Report, 2016).
Table 19
Girls participation and interest in class
Experiment/
Clusters Girls speaks in class- HINDI Girls speaks in class- MATHS
T1 T2 T3 T4 T5 T6 TOT T1 T2 T3 T4 T5 T6 TOT
Kalyanpur 3 3 4 4 7 9 5 3 3 4 3 7 11 5
Ramwapur 2 7 7 4 5 6 5 1 5 7 3 7 8 5
Veerpur 2 4 2 3 5 6 4 2 6 4 4 5 8 5
Total 2 4 4 3 6 7 5 2 4 4 4 6 9 5
Girls in the experimental schools did better than the control group in the basic
competencies in language and mathematics in phase 1. Leadership and regular onsite
academic support to school and its teachers plays a critical role in improving teacher’s
performance and learner’s scores.
There has been an upward trend in girls participation in grade 3 math classes in
experimental school, as well as their learning outcome, The gender gap has considerable
reduced for Grade 3 experimental school from 2.2 in T1 to 1.4 in T6. The table on teaching
methods also points that teachers from T1 to T6 started using participatory, collaborative
methods to their teaching.
2.1
2.5
0.8
1.4
2.7
2.22.2
2.8
1.4
1.2 1.2
1.41.3
1.6
1.0
1.4
3.3
0.6
1.8
2.4
2.5
2.2
1.7
3.8
T1 T2 T3 T4 T5 T6
Figure 7Gender Gap- Maths
Class 3 Control Class 3 Experiment
class 2 Control class 2 Experiment

42 | P a g e
This points out that a fear free environment creates a conducive learning environment for
all children specially girls in non stereotypical subjects like math.
Reading with comprehension by gender
Gender-wise break up of students who are able to read with comprehension in each class.
Table 20 Gender analysis of students reading with comprehension (%)
Uttar Pradesh (% of children)
2016 Baseline
Boys Girls Boys Girls
Grade I 7 5 3 2
Grade II 14 11 11 6
Grade III 30 25 19 11
Grade IV 38 35 29 24
Total 22 19 15 11
In reading comprehension, there is an improvement in all four grades from the baseline
results. The change is more prominent in grades III and IV (where the increase is of 12
and 9 percentage points respectively) than in the lower grades (where increase is 4 and 3
percentage points respectively). Overall gender gap in reading comprehension is small;
however, girls have shown more improvement than boys.
3.4 Classroom Processes
The Classroom observation data was derived from two separate tools. The first tool
focused on teaching methods, student engagement, teacher behavior, lesson planning and
use of materials. The second tool identified the frequency and nature of teacher
interactions with children. In all cases, two observations were conducted in each
classroom: one during a Hindi lesson and one during a mathematics lesson. These data
were collected in grade 2 and 3 classrooms in both experimental and control schools.
Break down of the classrooms observed is as follow:
Table 21
Total No. of Classroom Observations
Time Experiment Control Grand Total
Time 1 102 100 202
Time 2 122 104 226
Time 3 125 94 219
Time 4 120 108 228
Time 5 130 108 238

43 | P a g e
3.4.1 Teachers’ Behaviors, Practices and Methods
Table 22 shows that in terms of indicators such as seating arrangement for children,
gender and caste sensitivity, teachers’ language and voice, teachers from both the
experiment and control schools are reflecting similar behavioral pattern. On the other
side, teachers from experiment schools display better behavioral pattern during classroom
transaction on indicators such as encouraging girls & boys, offering assistance, moving
around the class and encouraging shy & hesitant students. Teachers in both control and
experiment schools show less inclination towards using additional material for teaching.
Table 22
Teachers’ behavior during classroom transaction (% teachers)
Teachers’ Behavior District Time 1 Time 5
N R S A N R S A
Teacher Ensure proper
Seating Arrangement
Exp. 52 0 0 48 8.5 5.4 5.4 80.8
Control 32 15 10 43 2.8 7.3 9.2 80.7
Teacher Language is
Gender Sensitive
Exp. 86.3 8.8 3.9 1 0 0 3.1 96.9
Control 77 16 4 3 2.8 1.8 0 95.4
Teacher Language Caste is
Sensitive
Exp. 1 0 1 98 0 0 0.8 99.2
Control 0 0 0 100 3.7 0 0 96.3
Teacher Voice is Clear Exp 0 0 0 100 0 0 4.6 95.4
Control 1 0 0 99 0.9 1.8 0 97.2
Teacher Encourage Boys Exp. 0 0 2 98 1.5 10.8 27.7 60
Control 1 0 0 99 5.5 16.5 34.9 43.1
Teacher Encourage Girls Exp. 14.7 13.7 30.4 41.2 1.5 13.1 26.9 58.5
Control 0 6 40 54 4.6 19.3 33 43.1
Teacher Uses Other
Materials
Exp. 13.7 19.6 26.5 39.2 55.4 10.8 20 13.8
Control 2 7 41 50 71.6 12.8 10.1 5.5
Teacher Approaches Girls
to offer assistance
Exp. 92.2 2 5.9 0 35.4 25.4 20.8 18.5
Control 78 6 1 15 47.7 36.7 13.8 1.8
Teacher Approaches Boys
to offer assistance
Exp. 86.3 13.7 0 0 29.2 29.2 22.3 19.2
Control 66 21 10 3 52.3 35.8 11 0.9
Teacher Moves In Class Exp. 91.2 3.9 4.9 0 3.8 23.1 33.1 40
Control 66 18 13 3 29.4 33 34.9 2.8
Teacher Encourage Shy
Student
Exp. 67.6 19.6 12.7 0 48.5 23.1 22.3 5.4
Control 52 24 21 3 64.2 24.8 9.2 1.8
Note: N=Never; R=Rarely; S=Sometimes; A=Always
The correlation between girls performing better in language or mathematics in experiment
schools can be made with the behavior practices followed in classrooms by teachers, in
terms of their using mixed seating arrangement for both boys and girls, encouraging them,
offering assistance and encouraging shy and hesitant students.

44 | P a g e
Table 23
Teachers’ Class room Practices (% teachers)
Time 1 Time 5
Exp. Control Exp. Control
Teacher clearly outline the problems 1 1 4.6 3.7
Teacher gives clues 1 1 4.6 3.7
Teacher creates opportunity 2 1 4.6 1.8
Teacher ask student to read 10 3.9 7.7 9.2
Teacher writes question on the board 41 39.2 58.5 51.4
Teacher ask student to repeat word 18 13.7 23.8 41.3
Teacher ask student copy 39 27.5 74.6 67
The above table suggests that classroom practices by teachers from both the experiment
& control sites are not very dissimilar. However, there seems to be a change in trends
amongst the teachers of experiment schools, with them remarkably following varied and
different classroom practices.
It cannot be concluded which practice is better to follow in which situation. A traditional
practice such as writing question on board or asking students to copy or repeating a word
may be appropriate in one situation or the other.
Table 24
Lesson Plan (% teachers)
Time 1 Time 5
Lesson Plan Exp. Control Exp Cont
Lesson Plan available 13 0 54.6 5.5
Lesson Plan For Day 11 0 25.4 5.5
Lesson Plan For Week 2 0 18.5 0
Lesson Plan For Month 0 0 10.8 0
Lesson Plan Book and Objectives 3 0 30.8 5.5
Class Type (Multi-grade) 32 38 47.7 56
Table 24 shows a far more clear cut practice in developing and maintaining lesson plans
in the experiment schools as compared to the control schools. More than half (54.6 %)
of the teachers in experiment schools as compared to only 5.5% teachers from control site
do the same. In the experiment sites around 20% & 11% teachers found to have lesson
plan for a week and for a month respectively.
The teachers in both experiment and control schools are handling a far more multigrade
classrooms than before. This has implications on the classroom practices and subsequent
achievement of children.

45 | P a g e
Table 25
Teaching Methods (%)
Table 25 shows questioning method to be the most predominant in both the experiment
and control schools. Both schools teachers provide enough time to students to reply.
While lecture method is still used by one-third of teachers, in addition the experiment
school teachers are using role play, group formation and games in their transactions.
Control school teachers are using more of lecture method and examples for explanation.
Those methods which were not used by any of the teachers in control or experiment
schools during T1, such as role play, indoor games, outdoor games, giving instructions,
group formation, games; these have now started to emerge as being used by some teachers
in both schools but more by experiment school teachers.
3.4.2 Incremented Students Engagement
This study examined classroom activity settings in relation to children’s observed
behavior during classroom interactions, child gender, and basic teacher behavior within
the classroom. 1294 children were observed during Time 1 and 1372 through Time 5.
Time 5 Time 1
Exp. Control Exp. Control
Questioning 72.3 78 27 38.2
Teacher asked Close ended Question 65.4 71.6 23 33.3
Teacher asked Open ended Question 20 28.4 5 10.8
Teacher asked Series of Question 29.2 34.9 8 14.7
Teacher Provide Time to students to reply 72.3 77.1 27 38.2
Teacher facilitate Role Play 6.2 0.9 0 0
Indoor Games 10 3.7 0 0
Outdoor Games 0 0.9 0 0
Teacher gave Instruction 10 2.8 0 0
Teacher Divided groups 4.6 1.8 0 0
Teacher Facilitated Game 10 2.8 0 0
Lecture Method 29.2 42.2 42 16.7
Teacher ask Question in between 24.6 37.6 35 15.7
Teacher used Examples to explain 27.7 36.7 0 0
Teacher Forms Small Group 29.2 0 0 0
Teacher Forms Mix Group 27.7 0 0 0

46 | P a g e
Table 26
Attendance of Boys & Girls during Classroom Observations
TIME 1 TIME 5
Time Exp. Cont. Total Exp. Cont. Total
Time 1 505 562 1067 583 607 1190
Time 2 619 488 1107 635 572 1207
Time 3 486 384 870 517 459 976
Time 4 504 478 982 589 461 1050
Time 5 776 518 1294 802 570 1372
Trend analysis showed increase in students’ engagement interactions with peers in group
work and with teachers in child-directed settings. Majority of the students were more
positive in other methods (solving questions on board).
Table 27
Students Engagement (%)
Particulars Time 1 Time 5
None Few Some Most All None Few Some Most All
Cont. Exp. C E C E C E C E C E C E C E C E C E
Students respond
to closed ended question
0 0 0 1 1 5 4 5 0 0 7 6 6 3 25 15 36 42 4 6
Students respond
to opened ended
question
0 0 0 9 7 4 10 21 6 0 46 47 6 2 13 7 11 16 3 1
Students
participate in the
game
0 0 0 0 0 0 0 0 0 0 0 0 0 0 0 0 2 3 1 7
Students were engaged in group
work
0 0 0 0 0 0 0 0 0 0 0 0 0 1 0 2 0 15 0 12
Students were engaged in
problem solving
0 0 0 0 0 0 1 1 1 0 1 0 0 0 1 0 2 2 0 2
Students engaged
in role play
0 0 0 0 0 0 0 0 0 0 0 0 0 0 0 0 2 3 1 7
Students were
engaged with
other method
0 0 0 1 3 7 49 54 28 2 0 0 5 2 26 9 51 55 16 29
Table 27 shows that there is an increase in students’ response to close ended question as
42% experiment schools and 36% control school students have started responding to
those as compared to 4% and 5% respectively during T1. In the experiment site, 15%
students were found to be engaged in group work. It is also noted that majority of the
students were found to be engaged in other methods (predominantly teacher writing some
questions on the blackboard and asking students to solve).

47 | P a g e
Table 28
Frequency & Nature of Teachers’ Interaction with the Children
Observation
details
Time1 Time2 Time3 Time4 Time5
Cont Exp Cont Ex. Cont Exp Cont Exp. Cont Exp.
Teacher calls on Girls 185 272 408 549 52 751 340 523 433 522
Teacher calls on Boys 295 297 353 569 53 763 355 393 430 540
Girls speak in class 239 273 453 534 33 801 297 426 643 858
Boys speak in class 355 307 378 566 45 813 282 377 681 824
Teacher rewards or
praises girls
10 22 21 15 6 65 60 70 44 39
Teacher rewards or
praises boys
11 18 13 20 3 82 44 46 31 28
Teacher disciplines or
punishes girls
51 11 51 89 2 68 25 134 31 23
Teacher disciplines or
punishes boys
56 7 44 90 1 83 22 132 34 29
Teacher approaches girls
to offer assistance
38 27 29 146 7 192 46 293 95 195
Teacher approaches boys
to offer assistance
55 24 39 117 5 168 49 246 88 171
Table 28 shows nearly 3-fold increase in the number of times girls speak in the class,
indicating the girls’ participation in the classrooms. Also teachers’ engagement with girls
increased consistently. There is also decrease in instances of teachers disciplining girls.
Alternatively, even the boys are not being rewarded or praised frequently by teachers in
both locations. There is also increase in instances of teachers approaching girls to offer
assistance. Instances of girls and boys speaking in the class was far more in the
intervention schools by end of phase 1 (T5). Experiment school teachers were now
frequently found to be approaching both boys and girls for assistance as compared to
control schools.
3.5 Teacher Participation & Practices from Phase 1 to Phase 2
Increased Participation Index of teachers in cluster forums
Phase 1 worked intensively around supporting teachers for positive changes in motivation
to learn, attitudes towards marginalized children, especially girls, content understanding
and in classroom transactions. These efforts were continued in phase 2. The significant
gain has been in the Participation index of teachers in cluster forums that has continued
to increase in the intervention clusters in phase 2 of the project.
In 48 intervening clusters in three districts, there was a specific agenda for the cluster
meetings, teachers were found to be active in the meetings, and the teacher support
functionaries (cluster and block level resource persons) were seen taking initiative and
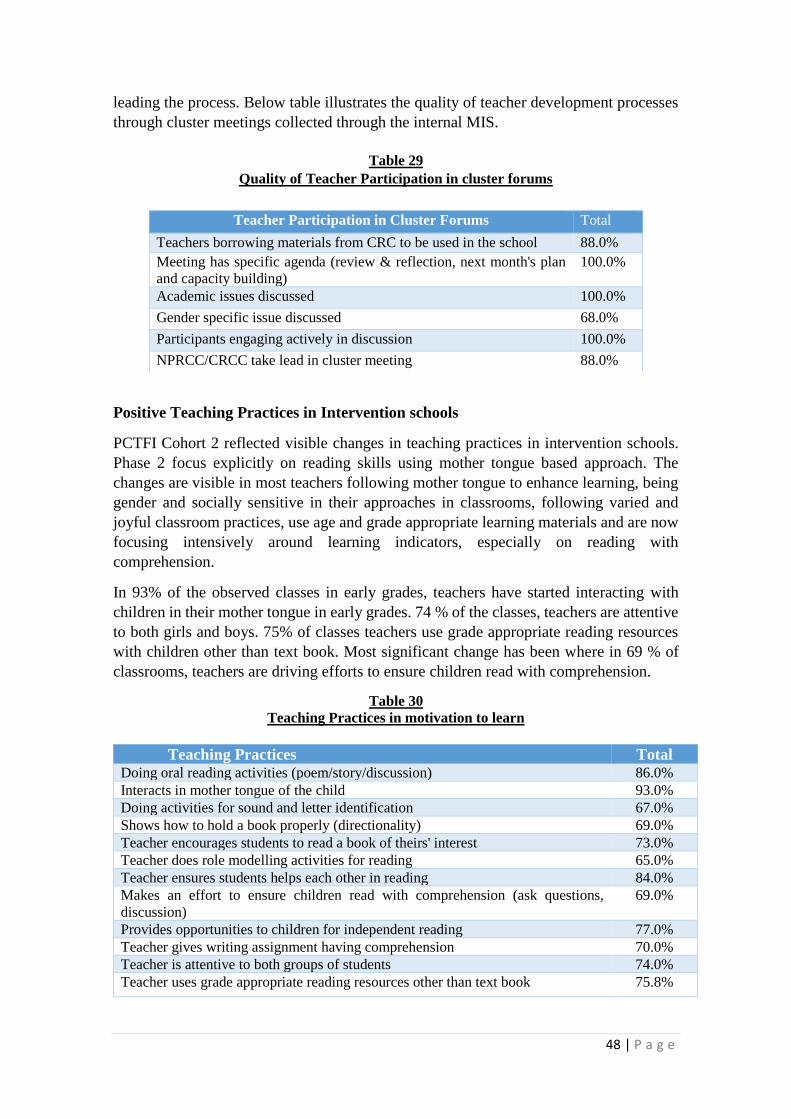
48 | P a g e
leading the process. Below table illustrates the quality of teacher development processes
through cluster meetings collected through the internal MIS.
Table 29
Quality of Teacher Participation in cluster forums
Positive Teaching Practices in Intervention schools
PCTFI Cohort 2 reflected visible changes in teaching practices in intervention schools.
Phase 2 focus explicitly on reading skills using mother tongue based approach. The
changes are visible in most teachers following mother tongue to enhance learning, being
gender and socially sensitive in their approaches in classrooms, following varied and
joyful classroom practices, use age and grade appropriate learning materials and are now
focusing intensively around learning indicators, especially on reading with
comprehension.
In 93% of the observed classes in early grades, teachers have started interacting with
children in their mother tongue in early grades. 74 % of the classes, teachers are attentive
to both girls and boys. 75% of classes teachers use grade appropriate reading resources
with children other than text book. Most significant change has been where in 69 % of
classrooms, teachers are driving efforts to ensure children read with comprehension.
Table 30
Teaching Practices in motivation to learn
Teaching Practices Total Doing oral reading activities (poem/story/discussion) 86.0%
Interacts in mother tongue of the child 93.0%
Doing activities for sound and letter identification 67.0%
Shows how to hold a book properly (directionality) 69.0%
Teacher encourages students to read a book of theirs' interest 73.0%
Teacher does role modelling activities for reading 65.0%
Teacher ensures students helps each other in reading 84.0%
Makes an effort to ensure children read with comprehension (ask questions,
discussion)
69.0%
Provides opportunities to children for independent reading 77.0%
Teacher gives writing assignment having comprehension 70.0%
Teacher is attentive to both groups of students 74.0%
Teacher uses grade appropriate reading resources other than text book 75.8%
Teacher Participation in Cluster Forums Total
Teachers borrowing materials from CRC to be used in the school 88.0%
Meeting has specific agenda (review & reflection, next month's plan
and capacity building)
100.0%
Academic issues discussed 100.0%
Gender specific issue discussed 68.0%
Participants engaging actively in discussion 100.0%
NPRCC/CRCC take lead in cluster meeting 88.0%

49 | P a g e
Positive teachers’ behavior, instruction methods and interaction pattern
The changes are more in terms of teachers’ sensitivity towards learner and their context,
creating a democratic fear free learning environment and use of child centric instruction
methods.
In Phase 1, the classroom practices by teachers from both the experiment & control sites
were similar in the content that they were transacting, However, the change in trends
amongst the teachers of experiment schools, was most of the teachers reaching out to
children, adapting learner centred methods like works in groups, giving more opportunity
for children to participate and express. A far clearer practice in developing and
maintaining lesson plans in the experiment schools as compared to the control schools
was seen with more than half (54.6 %) of the teachers in experiment schools as compared
to only 5.5% teachers from control site developing lesson plans.
The teachers in both experiment and control schools started to handle far more multi-
grade classrooms than before. This has implications on the classroom practices and
subsequent achievement of children. The difficulty in making a difference in higher order
competencies may be attributed partly to this aspect.
CHAPTER 4: CONCLUSIONS AND LEARNINGS
This section highlights key lessons learnt as part of PCTFI Cohort 2 Phase 1 and 2 (2009-
2016) which was focused in the state of Uttar Pradesh of India Phase 1 in 34 multigrade
schools in district Shrawasti through a longitudinal quasi experimental study focusing on
teacher development from 2009 to 2014, Phase 2 an implementation intervention around
early literacy and strengthening KGBVs in three districts Shrawasti, Bahraich and
Balrampur reaching out to 48 clusters-480 schools and 24 KGBVs from 2014 to 2016.
The second phase of the PCTFI proposal was based on methodological approaches
developed during the first phase of the PCTFI India project, as well as other education
projects, and on lessons learned regarding key factors affecting learning outcomes and
shifts in social/gender norms. The PCTFI second phase approach incorporated reading
skills development, leadership skills development and safety and security in the
previously developed clustered teacher training process.
It is also important to note that the outcomes and impact27 consider specific changes from
PCTFI as well as the influence of other project interventions on the integrated strategy
implemented as part of Girls education program in India. This strategy addresses social,
pedagogical and systemic domains to enhance learning outcomes of the most
marginalized children, especially girls in the public schools of India.
27 Learning achievement and outcomes described in Trend Analysis Time 1 to Time 5 Data (2010-2014), CARE India, 2015 and
PCTFI Cohort 2. Final Narrative Report, CARE 2016

50 | P a g e
• Outcomes at the level of children
Increased learning outcomes in mathematics and language: The first phase of PCTFI
cohort 2 recorded increased learning outcomes of children in the early grades (grade
2 and 3) in the intervention schools in mathematics and language. 82% of children in
the intervention schools were primarily from marginalized Dalit28 communities.
Steady improvements were recorded through time series data (T1 to T6) in basic as
well as higher level competencies of children in mathematics, with the increase more
for girls and more in intervention schools. Significant improvements in basic level
competencies in language were also visible in grade 2 and 3 but not in higher level
competencies29
Reduced gender gap in achievement in both language and mathematics: by end of
phase 1, girls were at par with boys in performance in both language and
mathematics. The trend continues in phase 2, attributing to a more gender sensitive
approach followed by teachers. Teacher development initiative focusing on
components of gender and inclusiveness created enabling environment in school for
teaching learning, and in turn impacted girls learning outcomes, clearly reducing
gender gap in learning30
Increased Student engagement: student engagement increased in the classroom,
especially that of girls, with nearly three- fold increase in the number of times girls
participate in classrooms31
• Outcomes at the level of teachers
Functionalizing continuous teacher development approach through cluster forums -
In phase one through cluster forums continuous teacher development initiatives were
initiated in 3 clusters reaching out to 94 teachers in one district. The lessons learnt in
functionalizing continuous teacher development forums were further scaled in phase
2 through working in 48 clusters, reaching out to around 879 teachers across 3
districts.
Increased Participation Index of teachers in cluster forums: Phase 1 worked
intensively around supporting teachers for positive changes in motivation to learn,
attitudes towards marginalized children, especially girls, content understanding and
in classroom transactions. These efforts were continued in phase 2. The significant
28 Dalit: part of the Scheduled Caste, the term includes all historically discriminated communities of India out-caste and Untouchables and are listed as the Scheduled Castes in the Constitution of India. 29 Secondary Research on Effectiveness of Cluster Approach on Teachers’ Behavior, Classroom Practices and Learning Outcomes,
Kaarak, 2015. 30 Secondary Research on Effectiveness of Cluster Approach on Teachers’ Behavior, Classroom Practices and Learning Outcomes,
Kaarak, 2015, Baseline Study, Karak 2015 and Annual assessment, GEP (2016). 31 Baseline Study to Understand Reading skills and classroom practices in government Primary Schools of Uttar Pradesh and Odisha, Kaarak, 2015.
GEP (2016), Annual Assessment of Children Reading Level in Uttar Pradesh & Odisha

51 | P a g e
gain has been in the Participation index of teachers in cluster forums that has
continued to increase in the intervention clusters in phase 2 of the project32.
Positive Teaching Practices in Intervention schools: Both phases of PCTFI Cohort 2
brought visible changes in teaching practices in intervention schools. Phase 2
narrowed down to a focus on building skills in language, using mother tongue based
approach; this was informed by linguistic and teacher development approaches
adopted in Udaan, one of the pioneer education innovations of GEP which aims to
give never enrolled or early drop-out Dalit33 adolescent girls, aged 10 to 14 years,
the chance to receive a fifth-grade education in just 11 months. The Study taken by
Mohanty 34 points out in Udaan teachers place importance on children’s wide
experience and resourcefulness, and there is a basic belief in teachers that teaching
in mother tongue is more effective, this formulated the basis of language pedagogy
which was used in first and second phase of PCTFI implementation . Changes were
also observed in intervention schools and classrooms where teachers were seen being
gender and socially sensitive in their approaches in classrooms, following varied and
joyful classroom practices, use age and grade appropriate learning materials and are
now focusing intensively around learning indicators, especially on reading with
comprehension.
Positive teachers’ behavior, instruction methods and interaction pattern: The changes
are more in terms of teachers’ sensitivity towards learner and their context, creating
a democratic fear free learning environment and use of child centric instruction
methods.
• Learnings from PCTFI Phase -1 being part of the quasi experimental
Longitudinal study35
The PCTFI phase 1 intervention in India focused on the following factors as important
reasons for marginalization of girls in the sphere of education, -Limited teachers’
capacity in transacting learner centered methods, School environment marked by
neglect, fear and corporal punishment. The longitudinal research design helped in
focusing down approaches targeted towards testing two hypothesis
a) Training of teachers on the learner centered, gender sensitive and inclusive
pedagogies will lead to change in classroom practices: quality of transactions will
improve and classrooms will be more inclusive.
b) Improved classroom practices and inclusive classrooms will enable all children,
especially marginalized girls to achieve better learning outcomes, enhanced self-
esteem and confidence and better participation in classrooms.
32 Baseline study, Kaarak, 2015 and Annual assessment, GEP (2016) 33 The term Dalit has been interchangeably used with Scheduled Caste, including all historically discriminated communities of India out-caste and Untouchables. They constitute around 16% of the Indian population (Census of India, 2011) today and are listed as the
Scheduled Castes in the Constitution of India 34 Mohanty Ajit(2016),"Multilingualism, Pedagogy and Learning: Understanding Transactions, Transformations and Tribulations in Udaan, Odisha" 35 PCTFI Cohort 2. Final Narrative Report, CARE 2016

52 | P a g e
The focus as part of longitudinal study research design helped in trying and testing
technical approaches around inclusive teacher development approaches and setting
up of continuous teacher development platforms for teachers It further provided
insights on understanding components around school organization, system
strengthening.
The longitudinal study helped in creating knowledge products around the approaches-
training modules, classroom observation tools, monitoring indicators, operational
strategies. It also helped in designing a composite operational strategy for scaling
working with different components teacher, school and community for enhancing
quality and equitable learning opportunities for children especially girls.
It also helped with insights around systemic and structural components which were
hugely influential in impacting outcomes both at experimental and control sites –
availability of teachers, attendance, transfer, monitoring, enrolment and retention of
children. This reemphasized the need to work with community and advocate with
system simultaneously to create sustainable educational impact for children.
The longitudinal study also provided insights on the need to work on belief , attitude
and sensitivity of teachers as a foundation stone to work on conceptual clarity and
pedagogical approaches with teachers.
• Analysis through triangulation for Phase 136
In the experiment schools, teachers were more active in providing opportunity for
students, especially girls, in their classroom processes. They started moving out of
traditional roles and are trying out facilitative roles instead.
The data strongly hinted that the intervention has had influence on the perspective,
sensitivity and instruction methods of the teachers. In five years of intervention,
teachers started using teaching methods, which are more participatory in nature. In
language teaching, method like role play were used and in mathematics games were
more widely used along with traditional methods. These methods provided more
opportunity and gained more acceptance from children specially girls. There has been
wider use of group methods in classroom which has helped in creating collaborative
and peer learning culture in the classroom. This also helped in making the classrooms
more inclusive.
However, all the above positive measures have not resulted in enhancing the
achievement scores of the students in experimental schools drastically. The impact on
learning outcome is not very drastically different between the experimental and
control schools. It is necessary to apply a much more rigorous evaluation using impact
evaluation methods like Difference in Difference model or a Randomized Control
Trials. These techniques will give causality to the intervention in the outcomes
without the effects of external shocks that may influence in the results.
36 Trend Analysis Time1 to Time 5 Data (2010-2014). PCTFI supported researched in Sharawasti Uttar Pradesch, India. CARE
India, 2015.

53 | P a g e
The greater achievement has been the reduction in achievement gap between boys
and girls. This is clearly visible in grade 3 children, in both language and mathematics.
Efforts like using more activity methods, allowing children to work in group, play
way methods, providing more opportunity to children specially girls have helped girls
to open and has contributed in reduction of the achievement gap. There is a slow but
steady increase in achievement for both boys and girls and the gender gap in
achievement has reduced in the intervention period. There has also been noticeable
increase in girl’s achievement in the experimental schools, specifically in the cluster
having considerable representation from Dalit and minority communities.
More and intensive focus was required to improve various competencies of
mathematics amongst the children and higher order competencies in language. Apart
from the basic ones where to an extent, some students are score reasonably, in all
other competencies, the children achievement level is not very encouraging.
Comprehensive focus is required by the teacher to work with the children to improve
the competencies of children on mathematics and language.
• Learnings of teacher development37
o Teacher development initiative impacts learner outcome gradually and the
enhancement consistently increases with time.
o Learning outcome is also dependent on other enabling factors like School
leadership, supportive supervision and monitoring by the Teacher support
structures and system, parent’s willingness and perception on value of education
o Teacher development initiative focusing on components of gender and
inclusiveness creates enabling environment in school for teaching learning, which
in turn impacts girls learning outcome. Over a period, this influences reduction of
gender gap in learning
o Continuous Teacher development initiative results in visible changes in teacher
behavior, instruction methods and interaction pattern. The changes are more in
terms of teacher’s sensitivity towards learner and their context, creating a
democratic fear free learning environment and use of child centric instruction
methods. This change is gradual and slowly penetrates to the classrooms
As mentioned above, PCTFI Cohort 2 Phase 1 and 2 as part of GEP interventions in India
have significantly contributed at the level of students, teachers and communities. The
learnings have also been instrumental to the government and policy makers. Over the
years, GEP, through its programs and strategic engagement with the government, ‘has
built a credibility as a serious player in education, and this has reflected in it being
approached by state and national governments to collaborate on technical aspects related
to quality and equity issues in education, especially in the context of girls and
marginalized communities’38. One of the comparative advantages of GEP is its
37 PCTFI Cohort 2. Final Narrative Report, CARE 2016 38 Girl’s education program (GEP): Key features and achievements, Care India, March 2017

54 | P a g e
comprehensive programming approach which has helped various education programs to
be nested together, share information and results and solidify the intervention models.
REFERENCES
CARE India (2014. PCTFI Intervention in India, Strategy Document, July.
CARE India (2015) Trend analysis, Time 1 to Time 5 Data (2010 -2014), Patsy Collins
Trust Fund Initiative -PCTFI- supported Research in Shrawasti Uttar Pradesh, India.
CARE India (2015) PCTFI – Cohort 2 proposal 2015 – 2017.July.
KAARAK (2015) Secondary Research on Effectiveness of Cluster Approach on
Teachers’ Behaviour, Classroom Practices and Learning Outcomes (Under PCTFI),
August.
CARE (2016) PCTFI Cohort 2 India, Final Narrative Report
Top Related