


Languages
Pages
Legal


1
Impact of Delta on viral burden and vaccine effectiveness against new SARS-CoV-2 infections in the UK
Koen B. Pouwels1,2 Emma Pritchard1,3, Philippa C. Matthews3,5,6, Nicole Stoesser1,3,5,6, David W. Eyre1,3,4,5,
Karina-Doris Vihta1,7, Thomas House8,9, Jodie Hay10,11, John I Bell12, John N Newton13, Jeremy Farrar14,
Derrick Crook1,3,5,6, Duncan Cook15, Emma Rourke15, Ruth Studley15, Tim Peto1,3,5,6, Ian Diamond15, A. Sarah
Walker1,3,5,16 and the COVID-19 Infection Survey Team
1 The National Institute for Health Research Health Protection Research Unit in Healthcare Associated
Infections and Antimicrobial Resistance at the University of Oxford, Oxford, UK.
2 Health Economics Research Centre, Nuffield Department of Population Health, University of Oxford,
Oxford, UK
3 Nuffield Department of Medicine, University of Oxford, Oxford, UK
4 Big Data Institute, Nuffield Department of Population Health, University of Oxford, Oxford, UK
5 Department of Infectious Diseases and Microbiology, Oxford University Hospitals NHS Foundation Trust,
John Radcliffe Hospital, Oxford, UK
6 The National Institute for Health Research Oxford Biomedical Research Centre, University of Oxford,
Oxford, UK
7 Department of Engineering, University of Oxford, Oxford, UK
8 Department of Mathematics, University of Manchester, Manchester, UK
9 IBM Research, Hartree Centre, Sci-Tech Daresbury, UK
10 Glasgow Lighthouse Laboratory, Glasgow, UK
11 University of Glasgow, Glasgow, UK
12 Office of the Regius Professor of Medicine, University of Oxford, Oxford, UK
13 Health Improvement Directorate, Public Health England, London, UK
14 Wellcome Trust, London, UK
15 Office for National Statistics, Newport, UK
16 MRC Clinical Trials Unit at UCL, UCL, London, UK
Corresponding author: Koen B. Pouwels, [email protected]

2
Abstract The effectiveness of BNT162b2, ChAdOx1, and mRNA-1273 vaccines against new SARS-CoV-2 infections
requires continuous re-evaluation, given the increasingly dominant Delta variant. We investigated the
effectiveness of the vaccines in a large community-based survey of randomly selected households across
the UK. We found that the effectiveness of BNT162b2 and ChAd0x1 against any infections (new PCR
positives) and infections with symptoms or high viral burden is reduced with the Delta variant. A single
dose of the mRNA-1273 vaccine had similar or greater effectiveness compared to a single dose of
BNT162b2 or ChAdOx1. Effectiveness of two doses remains at least as great as protection afforded by prior
natural infection. The dynamics of immunity following second doses differed significantly between
BNT162b2 and ChAdOx1, with greater initial effectiveness against new PCR-positives but faster declines in
protection against high viral burden and symptomatic infection with BNT162b2. There was no evidence
that effectiveness varied by dosing interval, but protection was higher among those vaccinated following a
prior infection and younger adults. With Delta, infections occurring following two vaccinations had similar
peak viral burden to those in unvaccinated individuals. SARS-CoV-2 vaccination still reduces new infections,
but effectiveness and attenuation of peak viral burden are reduced with Delta.

3
Introduction Multiple studies have assessed the real-world effectiveness of different COVID-19 vaccination programs in
the general population, healthcare and other frontline workers, and care home residents1. Studies
generally showed high effectiveness of the BNT162b2 mRNA vaccine (Pfizer-BioNTech) and the Oxford-
AstraZeneca adenovirus-vector vaccine, ChAdOx1 nCoV-19 (termed here ChAdOx1) against the Alpha
(B.1.1.7) and preceding variants. More limited real-world effectiveness data is available for the mRNA-1273
(Moderna) vaccine2-4. Continued emergence of new SARS-CoV-2 variants potentially threatens the success
of vaccination programs, particularly as in vitro experiments suggest reduced neutralisation activity of
vaccine-elicited antibodies against emerging variants5,6. Of particular concern is the Delta variant
(B.1.617.2), which has caused sharp rises in infections in many countries, including some with relatively
high vaccination coverage such as the UK. In England, Delta quickly became dominant after being classified
as a Variant of Concern on 28 April 2021, reaching 61% of sequenced positives from the English
symptomatic testing program in the week commencing 17 May7 and 99% from 27 June onwards8.
Real-world data on vaccine effectiveness against Delta infections are currently limited. A test-negative case-
control study using data to 16 May 2021 from the English symptomatic testing program suggested that the
effectiveness after one BNT162b2 or ChAdOx1 vaccination was lower against symptomatic infection with
Delta (31%) than Alpha (49%)9. Reductions in effectiveness against infection with Delta versus Alpha were
smaller following two doses of either vaccine. However, estimates from test-negative case-control studies
may be biased if vaccination status influences test-seeking behaviour of cases not requiring healthcare10. A
recent study from Scotland also suggested reduced effectiveness against infection with Delta versus Alpha
following two doses of either vaccine11. However, they found no evidence that effectiveness on hospital
admissions among those first testing positive varied with Delta versus Alpha, leaving it unclear to what
extent the results for infection might be attributable to bias due to test-seeking behaviour being influenced
by vaccination status10. A further contributor may be waning immunity, with two recent studies from Israel
finding higher infection rates in those vaccinated earliest12,13.
We therefore assessed the effectiveness of the BNT162b2, ChAdOx1, and mRNA-1273 vaccines against new
SARS-CoV-2 PCR-positive tests using the Office for National Statistics COVID-19 Infection Survey, a large
community-based survey of individuals living in randomly selected private households across the UK, where
RT-PCR tests were performed following a pre-determined schedule, irrespective of symptoms, vaccination
and prior infection14,15. We assessed vaccine effectiveness based on overall RT-PCR positivity, and split
according to self-reported symptoms, cycle threshold (Ct) value (<30 versus 30) as a surrogate for viral
load, from 1 December 2020 (start of vaccination rollout) to 16 May 2021, when Alpha dominated, and
from 17 May 2021 to 1 August 2021 when Alpha was replaced by Delta (Figure S1; confirmed by available
whole genome sequencing16). In addition, in this Delta-dominant period, we investigated variation in
vaccine effectiveness by long-term health conditions, age (18-34 versus 35-65 years) interval between first
and second vaccination (<9 weeks versus ≥9 weeks), and prior infection. We also assessed viral burden in
new PCR-positives occurring 14 days after second vaccination using Ct values.

4
Results Visits and new PCR-positives included in analysis
During the Alpha-dominant period from 1 December 2020 to 16 May 2021 (Figure S1), nose and throat RT-
PCR results were obtained from 384,543 individuals aged 18 years or older (221,909 households) at
2,580,021 visits (median [IQR] 7 [6-8]), of which 16,538 (0.6%) were the first PCR-positive in a new infection
episode. During the Delta-dominant period from 17 May to 1 August 2021, results were obtained from
358,983 individuals (213,825 households) at 811,624 visits (median [IQR] 2 [2-3]), 3,123 (0.4%) being the
first PCR-positive. Characteristics at included visits are shown in Table S1.
We classified each visit according to vaccination status and previous infection as previously15 (Table S2),
considering those not yet vaccinated or >21 days before vaccination without evidence of prior infection as
the reference group. The vast majority of post-vaccination visits between 1 December 2020 and 16 May
2021 were from individuals that received BNT162b2 or ChAdOx1, but from 17 May 2021 there were also
visits from individuals that received mRNA-1273. The median (IQR) time since first vaccination for visits 21
days after the first vaccination but before the second was 47 (34-61), 43 (31-58), and 41 (31-52) for
ChAdOx1, BNT162b2 and mRNA-1273, respectively; and from second vaccination for visits 14 days after
the second vaccination 41 (27-57) and 59 (35-86), respectively (insufficient data for mRNA-1273). The
median (IQR) dosing interval between first and second vaccination was 76 (68-78) days for ChAdOx1 and 74
(62-77) for BNT162b2.
Impact of vaccination on new PCR-positives, regardless of self-reported symptoms
Adjusting for multiple potential confounders, in the Alpha-dominant period the vaccine effectiveness (VE)
of both BNT162b2 and ChAdOx1 vaccines against new PCR-positives was similar amongst those ≥18 years
to that previously reported to 8 May 2021 amongst those ≥16 years15 (Table 1).
In the Delta-dominant period, amongst those ≥18 years there was evidence of reduced effectiveness 21
days after the first ChAdOx1 vaccination (VE 46% (95% CI 35-55%), heterogeneity p=0.004), but not 14
days after the second (67%, 62-71% vs 79%, 56-90% in the Alpha-dominant period, heterogeneity p=0.23).
There was no evidence of reduced effectiveness in the Delta-dominant period for BNT162b2 against all new
PCR-positives, with VE 57% (50-63%) post first dose and 80% (77-83%) post second dose (heterogeneity
p=0.60, p=0.23, respectively) (Table 1, Figure 1).
However, a decreasing number of visits remained in the unvaccinated reference group over time,
particularly for older individuals (Figure S2). Whilst reasonable numbers of those aged 18 to 64 years
remained in the unvaccinated reference group in the Delta-dominant period, comparisons with the Alpha-
dominant period were not possible in this age group due to low numbers having received two vaccinations
before 17 May 2021; however, VE estimates in the Delta-dominant period were similar to all adults for both
vaccines (Figure 1, Tables 1&2). To investigate VE in the Delta-dominant period further, we therefore
focussed on the younger age group.
In the Delta-dominant period, VE against new PCR-positives amongst those aged 18-64 years was
significantly lower for ChAdOx1 versus BNT162b2 21 days after one vaccination and 14 days after two
vaccinations (heterogeneity p=0.001 and p<0.0001, respectively, Table 2). For both vaccines, having
received two doses 14 days previously still provided significantly more protection compared with one
dose 21 days previously (p<0.0001). There was no evidence that the effectiveness of two ChAdOx1
vaccinations 14 days previously in preventing new PCR-positives differed from the protection afforded by
previous natural infection without vaccination (heterogeneity p=0.33), whereas two BNT162b2 vaccinations
afforded greater protection (p=0.04). Results were similar for those 18y (Table 1).
Delta-dominant period: impact of vaccination on new PCR-positives over time from second vaccination and
in specific subgroups

5
In those 18 to 64 years, VE of BNT162b2 against new PCR-positives reduced by 22% (95% CI 6% to 41%) for
every 30 days from second vaccination (p=0.007; Figure 2). Reductions were numerically smaller for
ChAdOx1 (change -7% per 30 days, 95% CI -18% to +2%, p=0.15) but there was no formal evidence of
heterogeneity (p=0.14).
Approximately 10% of visits in the Delta-dominant period occurred in vaccinated individuals with evidence
of prior SARS-CoV-2 infection (Table S2). Protection against new PCR-positives was significantly higher for
vaccinated individuals with prior infection than vaccinated individuals without prior infection (Table S3).
For example, 14 days after two ChAdOx1 vaccinations VE was 88% (95% CI 83-92%) among those with prior
infection versus 68% (61-73%) in those without (heterogeneity p<0.0001); and 93% (87-96%) versus 85%
(79-90%), respectively for BNT162b2 (heterogeneity p=0.006).
Vaccine effectiveness was also generally higher at younger ages (Table S3). For example, VE 14 days after
the second BNT162b2 dose was 90% (85-93%) for those aged 18-34 years versus 77% (65-85%) for those
aged 35-64 years (heterogeneity p=0.0001); and was 73% (65-80%) versus 54% (40-65%), respectively, for
ChAdOx1 (heterogeneity p=0.002).
There was also no evidence of heterogeneity in VE between <9 versus 9 weeks between the first and
second vaccination (approximate 25th percentile) (heterogeneity p=0.80 and p=0.89 14 days after two
ChAdOx1 and BNT162b2 vaccinations, respectively, Table S3). There was no evidence that the effect of
vaccination on new PCR-positives differed between those reporting versus not reporting long-term health
conditions (heterogeneity p>0.23 for BNT162b2 or Moderna, p>0.04 for ChAdOx1; Table S3).
Impact of vaccination on new PCR-positives split by Ct and self-reported symptoms
Restricting new PCR-positives to those with Ct<30 (higher viral burden) or with symptoms, attenuations in
VE in those 18 years in the Delta-dominant versus the Alpha-dominant period were more pronounced
than against all new PCR-positives (Table 1). Importantly, attenuations in the Delta-dominant period now
reached statistical significance for BNT162b2 as well as ChAdOx1 (e.g. Ct<30 VE 14 days post second dose
84% (82-86%) Delta versus 94% (91-96%) Alpha (heterogeneity p<0.0001), and 70% (65-73%) versus 86%
(71-93%) respectively for ChAdOx1 (heterogeneity p=0.04)). In the Delta-dominant period, one or two
BNT162b2 vaccinations still provided greater VE than ChAdOx1 against PCR-positives with Ct<30 or with
reported symptoms in those 18 years (Table 1; p<0.003) and 18-64 years (Figure 1, Table 2; p<0.001). In
the Delta-dominant period, VE against PCR-positives with Ct30 (lower viral burden) or without self-
reported symptoms was only modestly lower than against PCR-positives with Ct<30 or with symptoms for
all three vaccines (Table 2).
There was now formal evidence that the effectiveness of BNT162b2 against PCR-positives with Ct<30 or
with symptoms declined faster 14 days after second vaccinations than for ChAdOx1 (heterogeneity
p=0.003 for both outcomes; Figure S3, Figure S4). Extrapolating declines beyond the observed follow-up,
both vaccines would be equally effective against PCR-positives with Ct<30 139 days (4.6 months) after the
second dose and 116 days (3.8 months) against PCR-positives with symptoms.
Viral burden and symptoms in new PCR-positives aged 18 years
In 12,287 new PCR-positives in the Alpha-dominant period, Ct values (inversely related to viral load)
increased strongly with increasing time from first vaccination and number of doses (age/sex-adjusted
trend-p<0.0001, Figure 3A). Ct values were highest in those ≥14 days after second vaccination (median
(IQR) 33.3 (31.6-34.0) [N=56]); there was no evidence that this differed from those unvaccinated but
previously PCR/antibody-positive (32.8 (30.9-34.2) [N=68]; age/sex-adjusted p=0.72), but Ct values were
significantly higher than in those unvaccinated and not previously PCR/antibody-positive (28.7 (20.4-32.9)
[N=10,853]; age/sex-adjusted p=0.02).

6
From 14 June 2021, after which >92% of PCR-positives with Ct<30 were Delta-compatible (Figure S1),
differences in Ct values between those unvaccinated (median (IQR) 25.7 (19.1-30.8) [N=326]) and ≥14 days
after second vaccination (25.3 (19.1-31.3) [N=1593]) had attenuated substantially (age/sex-adjusted
p=0.35, heterogeneity versus Alpha-dominant period p=0.01), as had differences with those unvaccinated
but previously PCR/antibody-positive (22.3 (16.5-30.3) [N=20]). There was a trend towards lower Ct values
in PCR-positives ≥14 days after two ChAdOx1 than two BNT162b vaccinations (Figure 3B; median -1.3 (95%
CI -0.2 to +2.9), sex/age-adjusted p=0.08). Mirroring the attenuation in Ct values, the difference between
those unvaccinated and ≥14 days after second vaccination in the percentages of PCR-positives reporting
any or well-recognised COVID-19 symptoms (cough, fever, loss of taste/smell) significantly attenuated after
14 June 2021 (heterogeneity p<0.0001, p=0.008 respectively, Figure S5). However, this was likely driven by
lower Ct values, as the association between Ct and symptom reporting remained broadly similar post-Delta
(Figure S6).
Considering all 1,736 PCR-positives ≥14 days after two ChAdOx2 or BNT162b2 vaccinations (1,415 (82%) of
which had 1 prior negative swabs after their second vaccination), Ct values came from a mixture of two
sub-populations (Figure 3C; Bayesian Information Criterion 499.4 lower than single population). The low
sub-population had mean Ct=21.7 (95%CI 21.2-22.2) and the high sub-population mean Ct=32.7 (32.5-33.0),
consistent with either mild or late identified infection. The relative percentage of new PCR-positives falling
into these two sub-populations varied strongly over time (p<0.0001; Figure 3D), with the percentage in the
low Ct (high viral burden) sub-population averaging 16%, 34% and 72% through 16 May 2021, 17 May-13
June and 14 June onwards respectively.
Independently of this effect of calendar time (Alpha versus Delta), new PCR-positives were less likely to be
in the low Ct sub-population 14 days after two BNT162b2 than ChAdOx1 vaccinations (adjusted odds ratio
(aOR)=0.33 (95% CI 0.16-0.67) p=0.002; Table S4, Figure S7A), but this likelihood increased significantly
over time from second vaccination (aOR per month=1.43 (1.07-1.91) p=0.01; unadjusted in Figure 4A). In
contrast, there was no evidence of changing likelihood over time for ChAdOx1 (aOR per month=0.97 (0.79-
1.19) p=0.78; heterogeneity p=0.02). Overall, therefore, by around 3 months post second vaccination the
probability of being in the low Ct sub-population was similar for both BNT162b2 and ChAdOx1 (Figure S7A).
Those previously PCR/antibody-positive were less likely to belong to the low Ct sub-population (p<0.0001),
as were those reporting having long-term health conditions (p=0.006), potentially reflecting protection in
the former and longer duration of PCR-positivity in the latter leading to late infections being more likely to
be identified through the fixed testing schedule. There were no additional effects of sex, age (unadjusted in
Figure 4B), or ethnicity on the probability of belonging to the low Ct sub-population (p>0.15).
Vaccine type and time from second vaccination had similar effects on the mean Ct within the low Ct sub-
population, with higher Ct values in new PCR-positives 14 days after second BNT162b2 vaccination
(p=0.003) which then dropped significantly faster with time from second vaccination than for ChAdOx1
(interaction p=0.01), leading to similar Ct values with both vaccines by around 3 months (Figure S7B).
Calendar date was the only other factor strongly associated with Ct in both low and high Ct sub-populations
(Figure S7C), with modest declines and increases within the low Ct sub-population consistent with
increasing and decreasing positivity rates (Figure S1C) leading to new infections being identified slightly
earlier/later15.
A prior anti-trimeric spike antibody (IgG) result was available for 846/1,736 (49%) new PCR-positives ≥14
days after two ChAdOx2 or BNT162b2 vaccinations, of which 795 (94%) were above the 42 ng/mL positivity
threshold (Figure 4C), median 215 ng/ml (IQR 126-454). However, independently of factors in Table S4,
every doubling in IgG was associated with 22% lower odds of a new PCR-positive belonging to the low Ct
sub-population (aOR=0.78 (95% CI 0.66-0.93), p=0.007), with no evidence this varied by vaccine type
(heterogeneity p=0.31). There was no evidence of association between IgG and mean Ct values within
either sub-population (p>0.14). Most participants with antibody measurements after a new PCR-positive
≥14 days post second vaccination increased antibody levels after their new PCR-positive (Figure S8).

7
Discussion The results from this large community surveillance study show that vaccination with two doses of
BNT162b2 or ChAdOx1 still significantly reduces the risk of new PCR-positive SARS-CoV-2 infections.
However, whereas the two vaccines provided similar benefits when Alpha was dominant, benefits from two
ChAdOx1 doses are reduced with Delta more than two BNT162b2 doses, although two ChAdOx1 doses still
provide similar protection to that from previous natural infection. Benefits from both vaccines are
numerically greater against PCR-positives with versus without self-reported symptoms and high versus low
viral burden PCR-positives, but the difference in effectiveness is smaller with Delta for both vaccines.
The dynamics of protection varied over time from second vaccination, and by vaccine type, with initially
larger effectiveness with BNT162b2 than ChAdOx1, which then become more similar by ~4-5 months due to
more rapid waning of effectiveness with BNT162b2, particularly against infections with Ct<30 or symptoms.
Importantly, there was no evidence that effectiveness depended on the interval between first and second
vaccinations (<9 weeks versus ≥9 weeks). Protection against new PCR-positives was significantly larger
among those vaccinated with evidence of prior infection compared to those vaccinated without prior
infection. While we could only assess the effectiveness of a single mRNA-1273 dose in the Delta-dominant
period, this vaccine appeared more effective than a single dose of BNT162b2 or ChAdOx1, although this
could potentially be driven by age, as those receiving mRNA-1273 were younger on average and
effectiveness appeared greater in younger individuals. To date, other studies have only assessed mRNA-
1273 effectiveness against other SARS-CoV-2 variants, and generally had limited power for comparisons
with other vaccines or did not account for time since vaccination1,17-21. We also found greater effectiveness
in those 18 to 34 than 35 to 64 years, although we were not able to jointly assess the degree to which this
could have been cause by higher rates of previous infection in this group. We were unable to estimate
vaccine effectiveness in those 65 years and older in the Delta-dominant period as very few individuals
remained unvaccinated.
Few studies have assessed VE during periods where the Delta variant dominated. A test-negative case-
control study from the English symptomatic testing program suggested that the effectiveness after one
dose of either BNT162b2 or ChAdOx1 was lower against symptomatic infection with Delta than Alpha (31%
versus 49%, respectively), with smaller differences after two doses (BNT162b2 88% versus 94%,
respectively; ChAdOx1 67% versus 75%, respectively)9. There is little alternative to using observational data
to assess vaccine effectiveness against new variants, since further placebo-controlled randomised trials
would be unethical (although active comparator trials could still be performed). However, there are
numerous biases in observational analyses22, particularly if symptomatic testing is non-random and related
to perceived efficacy10. Potential bias due to such health-seeking behaviour is likely particularly pronounced
for mild symptoms, included in many vaccine effectiveness studies using routine symptomatic testing
program data. This may be exacerbated by the generic nature of many symptoms prompting testing, which
may be incidental, and misclassification due to individuals reporting symptoms when they wish to get a
test. As we demonstrated substantially lower VE against infections with high Ct or no reported symptoms,
this would bias estimates towards lower effects, potentially differentially between vaccines.
Such bias is substantially reduced when testing schedules are fixed independent of symptom or vaccination
status, as in our survey, or when using objective severe disease endpoints such as hospital admissions and
deaths. A recent study from Scotland11 found no statistical evidence of differential effectiveness against
hospital admissions with Delta and Alpha (62% versus 72% in PCR-positives), although power was relatively
limited. BNT162b2 effectiveness against hospitalisations remained high when Delta dominated in Israel
(88%)23, despite lower effectiveness against self-reported symptomatic SARS-CoV-2 infection (41% versus
97% previously)24.
Although testing behaviour bias could contribute to these differences, we also found a stronger protective
effect against infections with higher viral burden and/or symptoms from BNT162b2 and ChAdOx1 vaccines,
although to a lesser degree than against Alpha. One explanation could be differential effects of vaccination

8
on mucosal and systemic immunity25. In theory, the former is more important for preventing carriage,
transmission, and infection becoming established, while the latter is more important for preventing severe
disease once infected26. Studies in rhesus macaques showed greater reductions in SARS-CoV-2 viral load in
the lungs and prevention of pneumonia, without reducing viral loads in the upper respiratory tract with
intramuscular ChAdOx127, and protection against viral replication at much lower concentrations in the
lower than the upper respiratory tract with intramuscular mRNA-127328. In mice, an experimental
adenovirus vaccine induced strong systemic adaptive immune responses against SARS-CoV-2 and reduced
infection in the lungs, but minimal mucosal immune responses when administered intramuscularly29.
Another explanation for differences in VE against infections with Delta versus Alpha is that the former may
have a replication advantage in airway human epithelial cells; increased infectivity at mucosal surfaces
could facilitate antibody evasion30. A final explanation could be varying protection by time since second
vaccination in the Delta-dominant period, which also differed between BNT162b2 and ChAdOx1. When
such time-dependent effects are present, studies with different follow-up will inevitably get different
“average” results, and studies when Alpha dominated may predominantly reflect early effects. Regardless
of explanation, whilst protection against hospitalisation and death is maintained, “booster” vaccinations
may not be needed, particularly since infection post vaccination may provide a natural antibody boost.
However, declines in immunity against infection demonstrate this needs to be monitored closely.
As well as reduced VE, we also found a substantial shift in viral burden in those infected despite two
vaccinations with BNT162b2 or ChAdOx1 in the Delta-dominant period, with similar average Ct values to
those infected without vaccination, and much more similar percentages reporting symptoms, driven by Ct.
Whilst with Alpha, we15, and others31-33, found that vaccinated individuals had lower viral burden (higher Ct
values) than unvaccinated individuals, the greater number of new PCR-positives (1,736 14d post second
vaccination) allowed us to show there are two different types of such infections, a low viral burden group
that dominated early in 2021, and a high viral burden group which increased in frequency with Delta. Those
receiving ChAdOx1 were more likely to fall into the latter group after their second vaccination, as were an
increasing percentage of new PCR-positives with increasing time from second BNT162b2 vaccination,
mirroring changes in protection against new PCR-positivity. Peak viral load therefore now appears similar in
infected vaccinated and unvaccinated individuals, with potential implications for onward transmission risk,
given the strong association between peak Ct and infectivity34. However, the degree to which this might
translate into new infections is unclear; a greater percentage of virus may be non-viable in those
vaccinated, and/or their viral loads may also decline faster as suggested by a recent study of patients
hospitalised with Delta31 (supported by associations between higher Ct and higher antibody levels here and
in35), leading to shorter periods “at risk” for onwards transmission. Nevertheless, there may be implications
for any policies that assume a low risk of onward transmission from vaccinated individuals (e.g. relating to
self-isolation, travel), despite vaccines both still protecting against infection, thereby still reducing
transmission overall. This may be particularly important when vaccinated individuals are not aware of their
infection status or perceive that their risk of transmission is low. Importantly, those infected after second
vaccination appeared to gain an antibody boost, and higher prior antibody levels were independently
associated with lower viral burden.
The main study strength is its size and design including participants from randomly selected private
residential households in the community, tested following a fixed schedule, independent of symptoms and
vaccination status, thereby avoiding bias due to test-seeking behaviour that potentially affects many other
studies assessing vaccine effectiveness against SARS-CoV-2 infections10. Furthermore, we are able to adjust
for risk factors that also affect vaccination but are typically not available in electronic health records, such
as patient-facing healthcare work and long-term health-conditions, potentially leading to less residual
confounding than studies relying on routine electronic healthcare data.
Our study has several limitations. While we have included a broad set of potential confounders, results may
still be biased by unknown confounders or misclassification of prior infection status, for example due only
having antibody measurements on a subset. Participants are tested initially at weekly and then monthly

9
visits, meaning when rates are increasing, as when Delta came to dominate, we expect to identify infected
individuals earlier in their infection episode36,37, as shown and adjusted for in our Ct analysis. Late detection
of older infections on the fixed visit schedule means some positives could be classified as having occurred
shortly after vaccination while the infection may actually have been acquired before vaccination,
potentially diluting vaccine effectiveness estimates. However most infections 14d post second vaccination
had a preceding negative after second vaccination. To avoid misclassification bias from erroneously
classifying higher Ct positives where only ORF1ab+N genes were detected as Alpha, our comparisons
treated calendar periods as an instrumental variable, according to whether Alpha or Delta was dominant,
but this will likely lead to a small amount of bias in our vaccine effectiveness estimates.
In summary, with Delta, BNT162b2 and ChAdOx1 remain protective against any new PCR-positive and
infections with higher viral burden or symptoms, but vaccine effectiveness is reduced, with evidence of
significantly different dynamics of immunity against infections with Ct<30 or symptoms following second
doses of the two vaccines. With Delta, those infections occurring despite either vaccine have similar peak
viral burden to those in unvaccinated individuals. The impact on infectivity to others is unknown, but
requires urgent investigation. It further argues for vaccinating as many of the population as possible, since
those not vaccinated may not be protected by as substantial reductions in transmission among the
immunised population as seen other infections, making herd immunity likely unachievable for emerging
variants and requiring efforts to protect individuals themselves. Whilst the current preservation of VE
against severe outcomes suggests that allowing ongoing virus transmission and nasopharyngeal viral
presence may have limited consequences, the success of this strategy will ultimately rely on universal
vaccination (currently not available to most worldwide), uniform protection induced by vaccines including
in older individuals, optimisation of vaccine strategies to induce higher levels of mucosal and systemic
immunity, and an absence of novel variants which might compromise VE against severe infection.

10
Acknowledgements: This study is funded by the Department of Health and Social Care with in-kind support
from the Welsh Government, the Department of Health on behalf of the Northern Ireland Government and
the Scottish Government. EP, KBP, ASW, TEAP, NS, DE are supported by the National Institute for Health
Research Health Protection Research Unit (NIHR HPRU) in Healthcare Associated Infections and
Antimicrobial Resistance at the University of Oxford in partnership with Public Health England (PHE)
(NIHR200915). ASW and TEAP are also supported by the NIHR Oxford Biomedical Research Centre. EP and
KBP are also supported by the Huo Family Foundation. ASW is also supported by core support from the
Medical Research Council UK to the MRC Clinical Trials Unit [MC_UU_12023/22] and is an NIHR Senior
Investigator. PCM is funded by Wellcome (intermediate fellowship, grant ref 110110/Z/15/Z) and holds an
NIHR Oxford BRC Senior Fellowship award. DWE is supported by a Robertson Fellowship and an NIHR
Oxford BRC Senior Fellowship. The views expressed are those of the authors and not necessarily those of
the National Health Service, NIHR, Department of Health, or PHE. The funder/sponsor did not have any role
in the design and conduct of the study; collection, management, analysis, and interpretation of the data;
preparation, review, or approval of the manuscript; and decision to submit the manuscript for publication.
All authors had full access to all data analysis outputs (reports and tables) and take responsibility for their
integrity and accuracy.
We are grateful for the support of all COVID-19 Infection Survey participants and the COVID-19 Infection
Survey team:
Office for National Statistics: Sir Ian Diamond, Emma Rourke, Ruth Studley, Alex Lambert, Tina Thomas.
Office for National Statistics COVID Infection Survey Analysis and Operations teams, in particular Daniel
Ayoubkhani, Russell Black, Antonio Felton, Megan Crees, Joel Jones, Lina Lloyd, Esther Sutherland.
University of Oxford, Nuffield Department of Medicine: Ann Sarah Walker, Derrick Crook, Philippa C
Matthews, Tim Peto, Emma Pritchard, Nicole Stoesser, Karina-Doris Vihta, Alison Howarth, George Doherty,
James Kavanagh, Kevin K Chau, Stephanie B Hatch, Daniel Ebner, Lucas Martins Ferreira, Thomas Christott,
Brian D Marsden, Wanwisa Dejnirattisai, Juthathip Mongkolsapaya, Sarah Hoosdally, Richard Cornall, David
I Stuart, Gavin Screaton.
University of Oxford, Nuffield Department of Population Health: Koen Pouwels.
University of Oxford, Big Data Institute: David W Eyre.
University of Oxford, Radcliffe Department of Medicine: John Bell.
Oxford University Hospitals NHS Foundation Trust: Stuart Cox, Kevin Paddon, Tim James.
University of Manchester: Thomas House. Public Health England: John Newton, Julie Robotham, Paul
Birrell.
IQVIA: Helena Jordan, Tim Sheppard, Graham Athey, Dan Moody, Leigh Curry, Pamela Brereton. National
Biocentre: Ian Jarvis, Anna Godsmark, George Morris, Bobby Mallick, Phil Eeles.
Glasgow Lighthouse Laboratory: Jodie Hay, Harper VanSteenhouse
Author Contributions: The study was designed and planned by ASW, JF, JB, JN, ID and KBP and is being
conducted by ASW, RS, DC and ER. This specific analysis was designed by ASW and KBP. KBP and ASW
contributed to the statistical analysis of the survey data. JH conducted analysis of the RT-PCR data. ASW
and KBP drafted the manuscript. All authors contributed to interpretation of the study results, and revised
and approved the manuscript for intellectual content. KBP and ASW are the guarantors and accept full
responsibility for the work and conduct of the study, had access to the data, and controlled the decision to
publish. The corresponding author (KBP) attests that all listed authors meet authorship criteria and that no
others meeting the criteria have been omitted.
Competing Interests Statement: All authors have completed the ICMJE uniform disclosure from at
www.icmje.org/coi_disclore.pdf and declare: DWE declares lecture fees from Gilead, outside the submitted
work; EP, PCM, NS, DWE, JIB, DC, TEAP, ASW, and KBP are employees of the University of Oxford, but not

11
involved in the development or production of the vaccine; JIB act as an unpaid advisor to HMG on Covid but
does not sit on the vaccine task force and it not involved in procurement decisions, sits on the Board of OSI
who has an investment in Vaccitech who have a royalty from the ChAdOx1 vaccine when, if ever, it makes a
profit; ASW besides funding mentioned above, also received grants from Medical Research Council UK
during the conduct of the study; there are no other relationships or activities that could appear to have
influenced the submitted work.
PCM received funding from the Wellcome Trust [110110/Z/15/Z]. For the purpose of Open Access, the
author has applied a CC BY public copyright licence to any Author Accepted Manuscript version arising from
this submission.

12
Methods Study participants
The Office for National Statistics (ONS) COVID-19 Infection Survey (CIS) is a large household survey with
longitudinal follow-up (ISRCTN21086382, https://www.ndm.ox.ac.uk/covid-19/covid-19-infection-
survey/protocol-and-information-sheets) (details in14,15). The study received ethical approval from the
South Central Berkshire B Research Ethics Committee (20/SC/0195). Private households are randomly
selected on a continuous basis from address lists and previous surveys to provide a representative sample
across the UK. Following verbal agreement to participate, a study worker visited each selected household
to take written informed consent for individuals aged 2 years and over. Parents or carers provided consent
for those aged 2-15 years; those aged 10-15 years also provided written assent. For the current analysis we
only included individuals aged 16 years and over who were potentially eligible for vaccination.
Individuals were asked about demographics, behaviours, work, and vaccination uptake
(https://www.ndm.ox.ac.uk/covid-19/covid-19-infection-survey/case-record-forms). At the first visit,
participants were asked for (optional) consent for follow-up visits every week for the next month, then
monthly for 12 months from enrolment. At each visit, enrolled household members provided a nose and
throat self-swab following instructions from the study worker. From a random 10-20% of households, those
16 years or older were invited to provide blood monthly for antibody testing from enrolment. From April
2021, additional participants were invited to provide blood samples monthly to assess vaccine responses,
based on a combination of random selection and prioritisation of those in the study for the longest period
(independent of test results). Throughout, participants with a positive swab test and their household
members were also invited to provide blood monthly for follow-up visits after this.
Laboratory testing
Swabs were couriered directly to the UK’s national Lighthouse laboratories (Glasgow and the National
Biocentre in Milton Keynes (to 8 February 2021)) where samples were tested within the national testing
programme using identical methodology. The presence of three SARS-CoV-2 genes (ORF1ab, nucleocapsid
protein (N), and spike protein (S)) was identified using real-time polymerase chain reaction (RT-PCR) with
the TaqPath RT-PCR COVID-19 kit (Thermo Fisher Scientific, Waltham, MA, USA), analysed using UgenTec
Fast Finder 3.300.5 (TagMan 2019-nCoV assay kit V2 UK NHS ABI 7500 v2.1; UgenTec, Hasselt, Belgium).
The assay plugin contains an assay-specific algorithm and decision mechanism that allows conversion of the
qualitative amplification assay raw data into test results with little manual intervention. Samples are called
positive if either N or ORF1ab, or both, are detected. The S gene alone is not considered a reliable positive,
but could accompany other genes (ie, one, two, or three gene positives).
Blood samples were couriered directly to the University of Oxford, where they were tested for the SARS-
CoV-2 antibody using an ELISA detecting anti-trimeric spike IgG38. Before 26 February 2021, the assay used
fluorescence detection as previously described (positivity threshold 8 million units). After this, it used a
commercialised CE-marked version of the assay, the Thermo Fisher OmniPATH 384 Combi SARS-CoV-2 IgG
ELISA (Thermo Fisher Scientific, Waltham, MA, USA), with the same antigen and a colorimetric detection
system (positivity threshold 42 ng/ml monoclonal antibody unit equivalents, determined from 3840
samples run in parallel). From 27 February 2021, samples were also tested using a Thermo Fisher N
antibody.
Inclusion and exclusion criteria
This analysis included participants aged 18 years or over (i.e. those who were eligible for vaccination), and
all visits with positive or negative swab results from 1 December 2020 to 1 August 2021. The analysis of
vaccine effectiveness comparing Alpha-dominant and Delta-dominant periods included all individuals 18
years; analyses of the Delta-dominant period were also restricted to visits in those aged 18 to 64 years, as

13
the vast majority of those 65 years and older were vaccinated twice before Delta became dominant (Figure
S2). Analyses of Ct values in new PCR-positives by vaccination status included all individuals 18 years.
Vaccination status
Participants were asked about their vaccination status at visits, including type, number of doses and
date(s). Participants from England were also linked to administrative records from the National
Immunisation Management Service (NIMS). We used records from NIMS where available, otherwise
records from the survey, since linkage was periodic and NIMS does not contain information about
vaccinations received abroad or in Northern Ireland, Scotland, and Wales. Where records were available in
both, agreement on type was 98% and on dates 95% within ±7 days. A small number of visits after reported
vaccination with either unknown or vaccines other than ChAdOx1, BNT162b2 or mRNA-1273 (for the latter
we only included the first dose and only for the period ≥17 May) were excluded as these were too few to
provide reliable estimates.
SARS-CoV-2 positive episodes
PCR-positive results may be obtained at multiple visits after infection, so we grouped positive tests into
‘episodes’. Whole genome sequencing is available on only a subset of positives, and only a subsample
provide monthly blood samples for antibody status, so positive episodes were defined using study PCR
results. We previously found that defining episodes based on 90 days as suggested by the World Health
Organisation (WHO)39 led to higher than plausible risk of a new episode between 90-120 days, particularly
for high Ct infections15, suggesting intermittent long-term PCR positivity could be contributing. Here, we
therefore defined the start of a new ‘positive episode’ as the date of either: i) the first PCR-positive test in
the study (not preceded by any study PCR-positive test by definition); ii) a PCR-positive test after 4 or more
consecutive negative tests; or iii) a PCR-positive test at least 120 days after the start of a previous episode
with one or more negative tests immediately preceding this. Positive episodes were used to classify
exposure groups and outcomes (see below).
Exposures
At each study visit, a participant was classified into one of 13 different exposure groups based on current
vaccination status, study antibody and PCR tests, and (for exposure classification only) positive swab tests
linked from the English national testing programme40 (prior to visit), as follows:
i) Visits from participants ≥21 days before first vaccination, including those currently with no
vaccination date, with no prior PCR or antibody-positive in the study, nor a positive swab test in
the national testing programme (as defined below) (“Not vaccinated, not previously positive,
≥21 days before vaccination”) (baseline group);
ii) Visits from participants 1 to 21 days before first vaccination with no prior PCR or antibody-
positive in the study, nor a positive swab test in the national testing programme (“Not
vaccinated, not previously positive, 1-21 days before vaccination”)
iii) Visits 0 to 20 days following a first vaccination with BNT162b2 (“Vaccinated 0-20 days ago
BNT162b2”);
iv) Visits 0 to 20 days following a first vaccination with ChAdOx1 (“Vaccinated 0-20 days ago
ChAdOx1”);
v) Visits 0 to 20 days following a first vaccination with mRNA-1273 (“Vaccinated 0-20 days ago
mRNA-1273”);
vi) Visits 21 days or more following a first vaccination with BNT162b2 but before a second
vaccination (“≥21 days after 1st dose, no second vaccination BNT162b2”);
vii) Visits 21 days or more following a first vaccination with ChAdOx1 but before a second
vaccination (“≥21 days after 1st dose, no second vaccination ChAdOx1”);

14
viii) Visits 21 days or more following a first vaccination with mRNA-1273 but before a second
vaccination (“≥21 days after 1st dose, no second vaccination mRNA-1273”);
ix) Visits 0 to 13 days following a second vaccination with BNT162b2 (“2nd dose 0-13 days ago
BNT162b2”);
x) Visits 0 to 13 days following a second vaccination with ChAdOx1 (“2nd dose 0-13 days ago
ChAdOx1”);
xi) Visits ≥14 days following second vaccination with BNT162b2 (“≥14 days after 2nd dose
BNT162b2”);
xii) Visits ≥14 days following second vaccination with ChAdOx1 (“≥14 days after 2nd dose
ChAdOx1”);
xiii) Visits from participants that had not yet been vaccinated but were previously PCR/antibody
positive in the study, or had a positive swab test in the national testing programme based on
the definition of positive episodes above (“Not vaccinated, previously positive”).
We chose these vaccination status categories empirically based on previous findings15. Exposure group ii
(Not vaccinated, not previously positive, 1-21 days before vaccination) was included because there is
inevitably a degree of transient reverse causality where vaccination appointments have to be rescheduled if
someone tests positive in the weeks before the scheduled visit. As antibody status before vaccination is not
available for all participants, we defined prior positivity by having either a previous PCR-positive episode or
a positive S-antibody measurement >90 days before the visit or two consecutive positive N-antibody
measurements >42 days before the visit. The choice of 90 and 42 days was arbitrary, but designed to
exclude ongoing infections acquired previously being misattributed to current visits. Visits from vaccinated
individuals (groups (iii)-(xii)) were defined irrespective of previous positivity (Table S2) to reflect the impact
of vaccination as being implemented in the UK (without regard to prior infection). However, in sensitivity
analysis we analysed the impact of vaccination by prior infection status. Visits from the same participant
were classified in different groups depending on their status at each visit.
Outcomes
Analysis was based on visits, since these occur independently of symptoms and are therefore unbiased.
Only the first test-positive visit in each new PCR-positive infection episode starting after 1 December 2020
was used, dropping all subsequent visits in the same infection episode and all negative visits before the first
time a participant could be considered “at risk” for a subsequent new positive episode (as defined above),
to avoid misattributing ongoing PCR-positivity to visit characteristics and immortal time bias respectively.
Primary analysis included all new PCR-positive episodes. Secondary analyses considered infection severity,
by classifying positives by cycle threshold (Ct) value (<30 or ≥30) and self-reported symptoms. The
threshold Ct value of 30 is somewhat arbitrary, but corresponds to ~150 copies/ml34, and is consistently
used in the UK for many purposes, including algorithms for review of low level positives at the laboratories
where the PCR tests were performed and a threshold for attempting whole genome sequencing. For each
positive test, a single Ct was calculated as the arithmetic mean across detected genes (Spearman
correlation>0.98), then the minimum value was taken across positives in the infection episode to reflect the
greatest measured viral burden within an episode. To allow for pre-symptomatic positives being identified
in the survey, any self-reported symptoms at any visit within 0 to 35 days after the index positive in each
infection episode were included (questions elicit symptoms in the last 7 days at each visit). Finally, positive
infection episodes were classified as triple positive (ORF1ab+N+S or ORF1ab+S or N+S at least once across
the episode; Delta-compatible), positive only for ORF1ab+N across the episode and never S-positive (Alpha-
compatible, since Alpha has deletions in the S gene leading to S gene target failure) or always positive only
on a single gene. As S-gene target failure may also occur in high Ct samples, the main analysis considered
two periods of time when Alpha dominated (1 December 2020 to 16 May 2021) and when Delta dominated
(17 May 2021 onwards) (Figure S1), further dividing analysis of Ct values at 14 June 2021.
Confounders

15
The following potential confounders were adjusted for in all models as potential risk factors for acquiring
SARS-CoV-2 infection: geographic area and age in years (see below), sex, ethnicity (white versus non-white
as small numbers), index of multiple deprivation (percentile, calculated separately for each country in the
UK)41-44, working in a care-home, having a patient-facing role in health or social care, presence of long-term
health conditions, household size, multigenerational household, rural-urban classification45-47, direct or
indirect contact with a hospital or care-home, smoking status, and visit frequency. Details are shown in
Table S1.
Statistical analysis
Associations between the different exposure groups and outcome (first positive test in an infection episode
versus test-negative) were evaluated with generalised linear models with a logit link. Robust standard
errors were used to account for multiple visits per-participant. To adjust for substantial confounding by
calendar time and age, with non-linear effects of age which are also different by region, we included both
as restricted cubic splines and interactions between these splines and region/country (regions for England
and country for Northern Ireland, Scotland and Wales). Furthermore, given previous observations of
different positivity rates by age over time14, we added a tensor spline to model the interaction between age
and calendar time with the restriction that the interaction is not doubly non-linear48. The primary analysis
considered effect modification of each vaccine exposure group by time period (before (Alpha-dominant) or
after (Delta-dominant) 17 May 2021) in those aged 18 years. Secondary analyses considered variation
over time from second vaccination (linear on the log-odds scale, truncating at the 95th percentile of
observed days from second vaccination separately for each vaccine), and effect modification by long-term
health conditions, dosing interval, and prior infection status in the Delta-dominant period only in those
aged 18 to 64 years. Pairwise comparisons of the exposure groups were performed unadjusted. Analysis
was based on complete cases (>99% observations). Comparisons of Ct values by vaccine exposure groups
used quantile (median) regression adjusted for age and sex. Associations between factors and Ct values
were assessed using mixture normal linear regression models. We conducted backwards elimination (exit
p=0.05) for associations between factors and the latent class probabilities and separately with the Ct values
in each sub-population for the 12 variables shown in Table S4. We included interactions with vaccine in
either part of the model type where these had interaction p<0.05. We considered three knot restricted
natural cubic splines in contiuous factors (calendar date of positive, age, interval between first and second
vaccination, time since second vaccination) (knots at the 10th, 50th and 95th percentiles) if there was
evidence of non-linearity at p<0.01. To reduce the influence of outliers, we truncated the interval between
first and second vaccination at 3 and 14 weeks, and the time from second vaccination at the 95th percentile
(118 days, 3.9 months).
Data Availability: Data are still being collected for the COVID-19 Infection Survey. De-identified study data
are available for access by accredited researchers in the ONS Secure Research Service (SRS) for accredited
research purposes under part 5, chapter 5 of the Digital Economy Act 2017. For further information about
accreditation, contact [email protected] or visit the SRS website.
Code Availability: All statistical analyses of vaccine effectiveness were performed using standard functions
in the following R packages: ggplot2 (version 3.3.2), rms (version 6.0-1), dplyr (version 1.0.2), emmeans
(version 1.5.1), haven (version 2.3.1), sandwich (version 3.0-0), ggeffects (version 1.0.1), broom (version
0.7.2), multcomp (version 1.4-14), and Epi (version 2.44)). Analyses of Ct values were performed using qreg
and fmm in Stata v16.1.Code used for data analysis is available upon request.

16
References
1 Imai, N. et al. Interpreting estimates of coronavirus disease 2019 (COVID-19) vaccine efficacy and effectiveness to inform simulation studies of vaccine impact: a systematic review. Wellcome Open Res https://wellcomeopenresearch.org/articles/6-185 (2021).
2 Chemaitelly, H. et al. mRNA-1273 COVID-19 vaccine effectiveness against the B.1.1.7 and B.1.351 variants and severe COVID-19 disease in Qatar. Nat Med, doi:10.1038/s41591-021-01446-y (2021).
3 Chung, H. et al. Effectiveness of BNT162b2 and mRNA-1273 COVID-19 vaccines against symptomatic SARS-CoV-2 infection and severe COVID-19 outcomes in Ontario, Canada: a test-negative design study. MedRxiv https://www.medrxiv.org/content/10.1101/2021.05.24.21257744v2 (2021).
4 Thompson, M. G. et al. Interim Estimates of Vaccine Effectiveness of BNT162b2 and mRNA-1273 COVID-19 Vaccines in Preventing SARS-CoV-2 Infection Among Health Care Personnel, First Responders, and Other Essential and Frontline Workers - Eight U.S. Locations, December 2020-March 2021. MMWR Morb Mortal Wkly Rep 70, 495-500, doi:10.15585/mmwr.mm7013e3 (2021).
5 Noori, M. et al. Potency of BNT162b2 and mRNA-1273 vaccine-induced neutralizing antibodies against severe acute respiratory syndrome-CoV-2 variants of concern: A systematic review of in vitro studies. Rev Med Virol, e2277, doi:10.1002/rmv.2277 (2021).
6 Davis, C. et al. Reduced neutralisation of the Delta (B.1.617.2) SARS-CoV-2 variant of concern following vaccination. MedRxiv https://www.medrxiv.org/content/10.1101/2021.06.23.21259327v1.full (2021).
7 Public Health England. SARS-CoV-2 variants of concern and variants under investigation in England: Technical briefing 14. https://assets.publishing.service.gov.uk/government/uploads/system/uploads/attachment_data/file/991343/Variants_of_Concern_VOC_Technical_Briefing_14.pdf. (2021).
8 Public Health England. SARS-CoV-2 variants of concern and variants under investigation in England: Technical briefing 18. https://assets.publishing.service.gov.uk/government/uploads/system/uploads/attachment_data/file/1001358/Variants_of_Concern_VOC_Technical_Briefing_18.pdf. (2021).
9 Lopez Bernal, J. et al. Effectiveness of Covid-19 Vaccines against the B.1.617.2 (Delta) Variant. N Engl J Med, doi:10.1056/NEJMoa2108891 (2021).
10 Lewnard, J. A. et al. Theoretical Framework for Retrospective Studies of the Effectiveness of SARS-CoV-2 Vaccines. Epidemiology 32, 508-517, doi:10.1097/EDE.0000000000001366 (2021).
11 Sheikh, A. et al. SARS-CoV-2 Delta VOC in Scotland: demographics, risk of hospital admission, and vaccine effectiveness. Lancet 397, 2461-2462, doi:10.1016/S0140-6736(21)01358-1 (2021).
12 Mizrahi, B. et al. Correlation of SARS-CoV-2 Breakthrough Infections to Time-from-vaccine; Preliminary Study. MedrXiv https://www.medrxiv.org/content/10.1101/2021.07.29.21261317v1 (2021).
13 Israel, A. et al. Elapsed time since BNT162b2 vaccine and risk of SARSCoV-2 infection in a large cohort. MedrXiv https://www.medrxiv.org/content/10.1101/2021.08.03.21261496v1 (2021).
14 Pouwels, K. B. et al. Community prevalence of SARS-CoV-2 in England from April to November, 2020: results from the ONS Coronavirus Infection Survey. Lancet Public Health 6, E30-38, doi:10.1016/S2468-2667(20)30282-6 (2020).
15 Pritchard, E. et al. Impact of vaccination on new SARS-CoV-2 infections in the United Kingdom. Nat Med, doi:10.1038/s41591-021-01410-w (2021).
16 Office for National Statistics. Coronavirus (COVID-19) Infection Survey: England 31 July 2021 technical dataset https://www.ons.gov.uk/peoplepopulationandcommunity/healthandsocialcare/conditionsanddiseases/datasets/covid19infectionsurveytechnicaldata/2021. (2021).
17 Pilishvili, T. et al. Interim Estimates of Vaccine Effectiveness of Pfizer-BioNTech and Moderna COVID-19 Vaccines Among Health Care Personnel - 33 U.S. Sites, January-March 2021. MMWR Morb Mortal Wkly Rep 70, 753-758, doi:10.15585/mmwr.mm7020e2 (2021).

17
18 Harder, T. et al. Efficacy and effectiveness of COVID-19 vaccines against SARS-CoV-2 infection: interim results of a living systematic review, 1 January to 14 May 2021. Euro Surveill 26, doi:10.2807/1560-7917.ES.2021.26.28.2100563 (2021).
19 Charmet, T. et al. Impact of original, B.1.1.7, and B.1.351/P.1 SARS-CoV-2 lineages on vaccine effectiveness of two doses of COVID-19 mRNA vaccines: Results from a nationwide case-control study in France. Lancet Reg Health Eur 8, 100171, doi:10.1016/j.lanepe.2021.100171 (2021).
20 Butt, A. A., Omer, S. B., Yan, P., Shaikh, O. S. & Mayr, F. B. SARS-CoV-2 Vaccine Effectiveness in a High-Risk National Population in a Real-World Setting. Ann Intern Med, doi:10.7326/M21-1577 (2021).
21 Puranik, A. et al. Comparison of two highly-effective mRNA vaccines for COVID-19 during periods of Alpha and Delta variant prevalence. MedrXiv https://www.medrxiv.org/content/10.1101/2021.08.06.21261707v1 (2021).
22 Evans, S. J. W. & Jewell, N. P. Vaccine Effectiveness Studies in the Field. N Engl J Med, doi:10.1056/NEJMe2110605 (2021).
23 Ministry of Health, I. https://www.gov.il/BlobFolder/reports/vaccine-efficacy-safety-follow-up-committee/he/files_publications_corona_two-dose-vaccination-data.pdf. (2021).
24 Haas, E. J. et al. Impact and effectiveness of mRNA BNT162b2 vaccine against SARS-CoV-2 infections and COVID-19 cases, hospitalisations, and deaths following a nationwide vaccination campaign in Israel: an observational study using national surveillance data. Lancet 397, 1819-1829, doi:10.1016/S0140-6736(21)00947-8 (2021).
25 Jeyanathan, M. et al. Immunological considerations for COVID-19 vaccine strategies. Nat Rev Immunol 20, 615-632, doi:10.1038/s41577-020-00434-6 (2020).
26 Lavelle, E. C. & Ward, R. W. Mucosal vaccines - fortifying the frontiers. Nat Rev Immunol, doi:10.1038/s41577-021-00583-2 (2021).
27 van Doremalen, N. et al. ChAdOx1 nCoV-19 vaccine prevents SARS-CoV-2 pneumonia in rhesus macaques. Nature 586, 578-582, doi:10.1038/s41586-020-2608-y (2020).
28 Corbett, K. S. et al. Immune Correlates of Protection by mRNA-1273 Immunization against SARS-CoV-2 Infection in Nonhuman Primates. bioRxiv, doi:10.1101/2021.04.20.440647 (2021).
29 Hassan, A. O. et al. A Single-Dose Intranasal ChAd Vaccine Protects Upper and Lower Respiratory Tracts against SARS-CoV-2. Cell 183, 169-184 e113, doi:10.1016/j.cell.2020.08.026 (2020).
30 Mlcochova, P. et al. SARS-CoV-2 B.1.617.2 Delta variant emergence, replication 1 and sensitivity to neutralising antibodies. BioRxiv https://www.biorxiv.org/content/10.1101/2021.05.08.443253v4 (2021).
31 Chia, P. Y. et al. Virological and serological kinetics of SARS-CoV-2 Delta variant vaccine-breakthrough infections: a multi-center cohort study. MedRxiv https://www.medrxiv.org/content/10.1101/2021.07.28.21261295v1 (2021).
32 Riemersma, K. K. et al. Vaccinated and unvaccinated individuals have similar viral loads in communities with a high prevalence of the SARS-CoV-2 delta variant. MedRxiv https://www.medrxiv.org/content/10.1101/2021.07.31.21261387v1 (2021).
33 Shrotri, M. et al. Vaccine effectiveness of the first dose of ChAdOx1 nCoV-19 and BNT162b2 against SARS-CoV-2 infection in residents of Long-Term Care Facilities (VIVALDI study). MedrXiv https://doi.org/10.1101/2021.03.26.21254391 (2021).
34 Lee, L. Y. W. et al. SARS-CoV-2 infectivity by viral load, S gene variants and demographic factors and the utility of lateral flow devices to prevent transmission. Clin Infect Dis, doi:10.1093/cid/ciab421 (2021).
35 Bergwerk, M. et al. Covid-19 Breakthrough Infections in Vaccinated Health Care Workers. N Engl J Med, doi:10.1056/NEJMoa2109072 (2021).
36 Hay, J. A. et al. Estimating epidemiologic dynamics from cross-sectional viral load distributions. Science, doi:10.1126/science.abh0635 (2021).
37 Walker, A. S. et al. Ct threshold values, a proxy for viral load in community SARS-CoV-2 cases, demonstrate wide variation across populations and over time. Elife 10, doi:10.7554/eLife.64683 (2021).

18
38 National Sars-CoV-Serology Assay Evaluation Group. Performance characteristics of five immunoassays for SARS-CoV-2: a head-to-head benchmark comparison. Lancet Infect Dis, doi:10.1016/S1473-3099(20)30634-4 (2020).
39 Pan American Health Organisation. Interim guidelines for detecting cases of reinfection by SARS-CoV-2 (https://www.paho.org/en/documents/interim-guidelines-detecting-cases-reinfection-sars-cov-2, accessed 4 August 2021). (2020).
40 National Health Service. NHS Test and Trace Statistics (England): methodology. https://www.gov.uk/government/publications/nhs-test-and-trace-statistics-england-methodology/nhs-test-and-trace-statistics-england-methodology (accessed 4 August 2021). . (2021).
41 English Indices of Deprivation 2019 (Ministry of Housing, Communities and Local Government, 2019); https://www.gov.uk/government/statistics/english-indices-of-deprivation-2019.
42 Welsh Index of Multiple Deprivation (Full Index Update with Ranks): 2019 (Statistics for Wales, 2019); https://gov.wales/welsh-index-multiple-deprivation-full-index-update-ranks-2019.
43 Scottish Index of Multiple Deprivation 2020 (Scottish Government, 2020); https://www.gov.scot/collections/scottish-index-of-multiple-deprivation-2020/
44 Northern Ireland Multiple Deprivation Measure 2017 (NIMDM2017) (Northern Ireland Statistics and Research Agency, 2017); https://www.nisra.gov.uk/statistics/deprivation/northern-ireland-multiple-deprivation-measure-2017-nimdm2017
45 Urban–Rural Classification (Northern Ireland Statistics and Research Agency, 2017); https://www.nisra.gov.uk/support/geography/urban-rural-classification
46 Rural Urban Classification (Department for Environment, Food and Rural Affairs, 2016); https://www.gov.uk/government/collections/rural-urban-classification
47 Scottish Government Urban Rural Classification 2016 (Scottish Government, 2018); https://www.gov.scot/publications/scottish-government-urban-rural-classification-2016/pages/2/
48 Harrell, F. E. Regression modeling strategies: with applications to linear models, logistic and ordinal regression, and survival analysis. (Springer, 2015).

19
Figure 1. (A) Protection against all new PCR-positive episodes, those with Ct<30, or with self-reported
symptoms in those 18-64 years in the Delta-dominant period (B) Protection against all new PCR-positive
episodes in those 18+ years in both the Alpha- and Delta-dominant period.
Note: Vaccine effectiveness estimates (=100%*(1-OR)) in Table 1 and 2 for 18 years and 18 to 64 years
respectively.

20
Figure 2 Protection against all new PCR-positive episodes over time from second dose, overall and by subgroups in those 18-64 years in the Delta-dominant period. Note: lthc=self-reporting a long term health condition. See Figure S3 for effects on PCR-positive episodes with Ct<30. Overall odds ratio per 30 days
longer from from 14 days after second vaccination 1.22 (95% CI 1.06-1.41) for BNT162b2 and for ChAdOx1 OR 1.07 (95% CI 0.98-1.18) (heterogeneity p=0.14). See Table S3 for estimates of VE within subgroups 14 days after second vaccination (intercept on panels
below).

21
Figure 3 Ct values in new positive episodes in those 18y and older (A) by vaccination/reinfection status and (B) vaccine type if 14 days after second dose over
time. (C) shows observed Ct values from (B) with the marginal density (black) and the densities estimated from a two-component mixture distribution. (D) shows
the probability that each new PCR-positive in (B) and (C) falls into the higher viral shedding class over time. Boxes in (A) are median (IQR).
A
B
C
D

22
Figure 4 Ct values in new PCR-positives 14d after second ChAdOx1 or BNT162b2 vaccination by (A)
months since second vaccination (N=1,736), (B) age (N=1,736) and (C) most recent anti-trimeric spike IgG
antibody measurement (N=846). Note: antibody measurements taken median 30 (IQR 28-54) [range 25-91]
days before the new PCR-positive, at or before the most recent prior negative swab and 14 days or more
after first vaccination. 42ng/ml is the positivity threshold. Months since second dose truncated at 95th
percentile to avoid undue influence of outliers. Overall association with Ct Spearman rho=-0.09 (p=0.004)
for time since second vaccination (A), 0.08 (p=0.002) for age (B), and 0.10 (p=0.002) for IgG (C).
A
B
C

23
Table 1 Vaccine effectiveness (95% CI) (A) and comparisons between vaccines and with previous infection (B) in those aged 18 years and older in Alpha-dominant and Delta-dominant periods (A) Vaccine effectiveness (VE)
BNT162b2: one
dose 21 days
ChAdOx1: one
dose 21 days
BNT162b2: second dose 0-13 days ago
ChAdOx1: second dose 0-13 days ago
BNT162b2: second
dose 14 days
ChAdOx1: second
dose 14 days
Not vaccinated, previously positive*
VE: All infections
1 Dec 2020 – 16 May 2021 (Alpha) 59% (52-65%) 63% (55-69%) 77% (66-84%) 72% (50-84%) 78% (68-84%) 79% (56-90%) 60% (50-68%)
17 May 2021- (Delta) 57% (50-63%) 46% (35-55%) 82% (75-87%) 71% (64-77%) 80% (77-83%) 67% (62-71%) 72% (58-82%)
Heterogeneity p 0.60 0.004 0.29 0.99 0.50 0.23 0.12
VE: Ct<30
1 Dec 2020 – 16 May 2021 (Alpha) 70% (65-74%) 74% (69-79%) 83% (75-89%) 79% (62-88%) 94% (91-96%) 86% (71-93%) 87% (84-90%)
17 May 2021- (Delta) 62% (56-68%) 50% (41-59%) 81% (73-86%) 69% (61-76%) 84% (82-86%) 70% (65-73%) 77% (66-85%)
Heterogeneity p 0.04 <0.0001 0.57 0.25 <0.0001 0.04 0.02
VE: Self-reported symptoms
1 Dec 2020 – 16 May 2021 (Alpha) 73% (68-76%) 73% (67-77%) 92% (88-95%) 84% (72-91%) 97% (96-98%) 97% (93-98%) 80% (75-84%)
17 May 2021- (Delta) 58% (51-64%) 40% (28-50%) 93% (90-95%) 73% (66-79%) 84% (82-86%) 71% (66-74%) 82% (73-88%)
Heterogeneity p <0.0001 <0.0001 0.71 0.08 <0.0001 <0.0001 0.59
(B) Heterogeneity tests
BNT162b2 vs ChAdOx1: one
dose 21 days
BNT162b2 vs ChAdOx1: second dose 0-13 days ago
BNT162b2 vs ChAdOx1: second dose
14 days
BNT162b2: second
dose 14 days vs not vaccinated, previously positive*
ChAdOx1: second
dose 14 days vs not vaccinated, previously positive*
BNT162b2: second
dose 14 days vs
one dose 21 days
ChAdOx1: second
dose 14 days vs
one dose 21 days
All infections
1 Dec 2020 – 16 May 2021 (Alpha) 0.34 0.54 0.85 0.0007 0.12
17 May 2021- (Delta) 0.01 0.01 <0.0001 0.12 0.38 <0.0001 <0.0001
Ct<30
1 Dec 2020 – 16 May 2021 (Alpha) 0.08 0.44 0.03 <0.0001 0.10
17 May 2021- (Delta) 0.003 0.02 <0.0001 0.09 0.15 <0.0001 <0.0001
Self-reported symptoms
1 Dec 2020 – 16 May 2021 (Alpha) 0.93 0.04 0.52 <0.0001 <0.0001
17 May 2021- (Delta) 0.0001 <0.0001 <0.0001 0.59 0.01 <0.0001 <0.0001

24
* re-infection will be a variable amount of time previously but not possible to split this due to low numbers. Note: VE (vaccine effectiveness)=100%*(1- odds ratio (OR)). Calendar time split into two epochs when the majority of cases detected in the survey were ORF1ab+N positive (Alpha-compatible) and then when triple positives became dominant (Delta-compatible) (Figure S1). Estimates from the former are similar to those
amongst 16 years old previously published on data to 8 May 2021, but with slightly wider 95% confidence intervals due to splitting time after second dose at 14 days in this analysis. Heterogeneity p-values unadjusted. VE post second doses changes over time from vaccination (see Figures 2 and S3 for changes in those aged 18-64y) so estimates in this table are an average over follow-up included in this analysis.
25
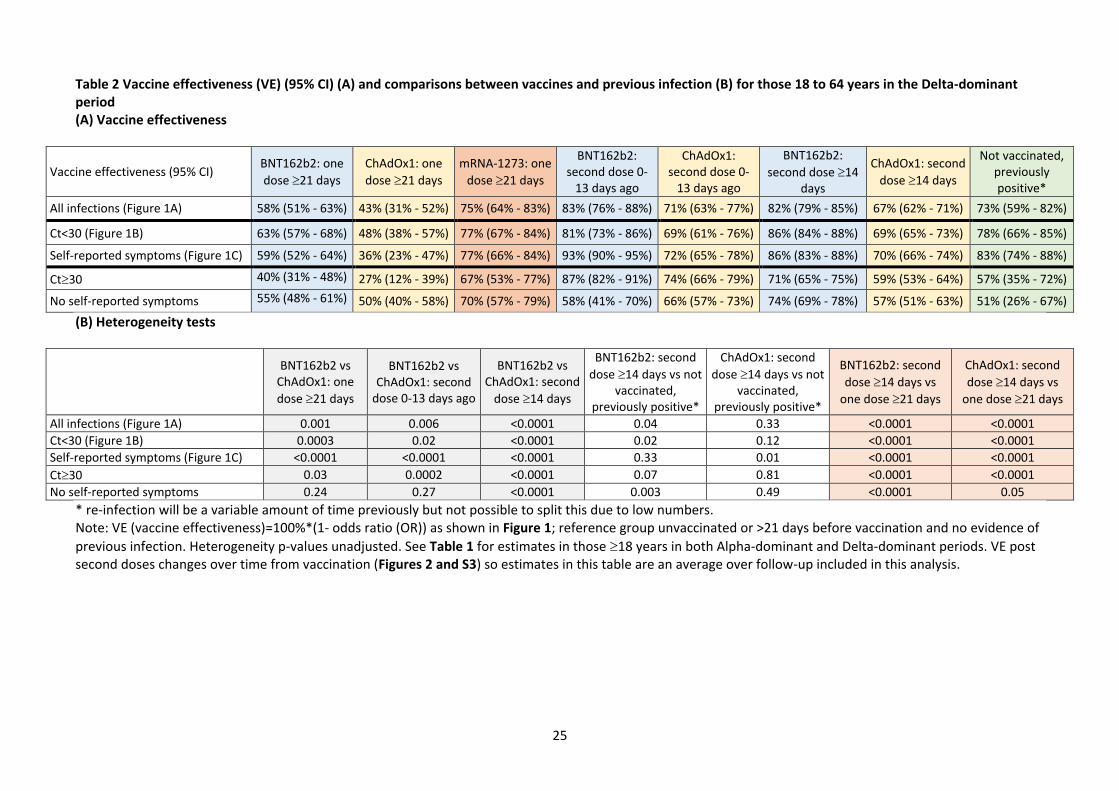
Table 2 Vaccine effectiveness (VE) (95% CI) (A) and comparisons between vaccines and previous infection (B) for those 18 to 64 years in the Delta-dominant period (A) Vaccine effectiveness
Vaccine effectiveness (95% CI) BNT162b2: one
dose 21 days
ChAdOx1: one
dose 21 days
mRNA-1273: one
dose 21 days
BNT162b2: second dose 0-
13 days ago
ChAdOx1: second dose 0-
13 days ago
BNT162b2:
second dose 14 days
ChAdOx1: second
dose 14 days
Not vaccinated, previously positive*
All infections (Figure 1A) 58% (51% - 63%) 43% (31% - 52%) 75% (64% - 83%) 83% (76% - 88%) 71% (63% - 77%) 82% (79% - 85%) 67% (62% - 71%) 73% (59% - 82%)
Ct<30 (Figure 1B) 63% (57% - 68%) 48% (38% - 57%) 77% (67% - 84%) 81% (73% - 86%) 69% (61% - 76%) 86% (84% - 88%) 69% (65% - 73%) 78% (66% - 85%)
Self-reported symptoms (Figure 1C) 59% (52% - 64%) 36% (23% - 47%) 77% (66% - 84%) 93% (90% - 95%) 72% (65% - 78%) 86% (83% - 88%) 70% (66% - 74%) 83% (74% - 88%)
Ct30 40% (31% - 48%) 27% (12% - 39%) 67% (53% - 77%) 87% (82% - 91%) 74% (66% - 79%) 71% (65% - 75%) 59% (53% - 64%) 57% (35% - 72%)
No self-reported symptoms 55% (48% - 61%) 50% (40% - 58%) 70% (57% - 79%) 58% (41% - 70%) 66% (57% - 73%) 74% (69% - 78%) 57% (51% - 63%) 51% (26% - 67%)
(B) Heterogeneity tests
BNT162b2 vs
ChAdOx1: one
dose 21 days
BNT162b2 vs ChAdOx1: second
dose 0-13 days ago
BNT162b2 vs ChAdOx1: second
dose 14 days
BNT162b2: second
dose 14 days vs not vaccinated,
previously positive*
ChAdOx1: second
dose 14 days vs not vaccinated,
previously positive*
BNT162b2: second
dose 14 days vs
one dose 21 days
ChAdOx1: second
dose 14 days vs
one dose 21 days
All infections (Figure 1A) 0.001 0.006 <0.0001 0.04 0.33 <0.0001 <0.0001
Ct<30 (Figure 1B) 0.0003 0.02 <0.0001 0.02 0.12 <0.0001 <0.0001
Self-reported symptoms (Figure 1C) <0.0001 <0.0001 <0.0001 0.33 0.01 <0.0001 <0.0001
Ct30 0.03 0.0002 <0.0001 0.07 0.81 <0.0001 <0.0001
No self-reported symptoms 0.24 0.27 <0.0001 0.003 0.49 <0.0001 0.05
* re-infection will be a variable amount of time previously but not possible to split this due to low numbers. Note: VE (vaccine effectiveness)=100%*(1- odds ratio (OR)) as shown in Figure 1; reference group unvaccinated or >21 days before vaccination and no evidence of
previous infection. Heterogeneity p-values unadjusted. See Table 1 for estimates in those 18 years in both Alpha-dominant and Delta-dominant periods. VE post second doses changes over time from vaccination (Figures 2 and S3) so estimates in this table are an average over follow-up included in this analysis.

26
Supplementary Material
Figure S1 In new PCR-positive episodes in those 18 years, gene positivity pattern overall (A) and
restricted to episodes with cycle threshold (Ct) <30 (B), and mean Ct value in all positives (C). Note:
ORF1ab+N+S (black) are compatible with wild-type and Delta variants (S-gene positive); ORF1ab+N (gray)
are compatible with the Alpha variant (S-gene negative). Those PCR-positives where only a single gene (N
or ORF1ab were detected) cannot be classified (vast majority Ct>30). The percentage of PCR-positives with
Ct<30 that were ORF1ab+N+S, compatible with Delta, increased from 6% the week commencing 10 May
2021, to 67% and 92% the weeks starting 17 May and 14 June 2021, respectively.
A
B
C

27
Figure S2 Visits included in analysis over time by vaccination status Note: The graphs (with different scales
for the axes) show the number of visits by vaccination status, by calendar time and age category (dark: 18-
34 year olds, intermediate: 35-64 year olds; light: 65+ year olds. The vertical line at 25 weeks indicates the
start of the period dominated by Delta.

28
Figure S3 Protection against all new PCR-positive episodes with Ct<30 over time from second dose,
overall and by potential subgroups in those 18-64 years in the Delta-dominant period. Note: lthc=self-
reporting a long term health condition. See Figure 2 for effects on all PCR-positive episodes. Overall odds
ratio per 30 days longer from 14 days after second vaccination 1.52 (95% CI 1.26 to 1.84) (p<0.0001) for
BNT162b2 and for ChAdOx1 OR=1.09 (95% CI 0.0.97 to 1.22) (p=0.14) (heterogeneity p=0.003). See Table
S3 for estimates of VE within subgroups 14 days after second vaccination (intercept on panels below).

29
Figure S4 Protection against all new PCR-positive episodes with reported symptoms over time from
second dose, overall and by potential subgroups in those 18-64 years in the Delta-dominant period. Note:
lthc=self-reporting a long term health condition. See Figure 2 for effects on all PCR-positive episodes. See
Table S3 for estimates of VE within subgroups 14 days after second vaccination (intercept on panels below).

30
Figure S5 Symptoms reported in new PCR-positives aged 18 years by vaccination/reinfection status
31
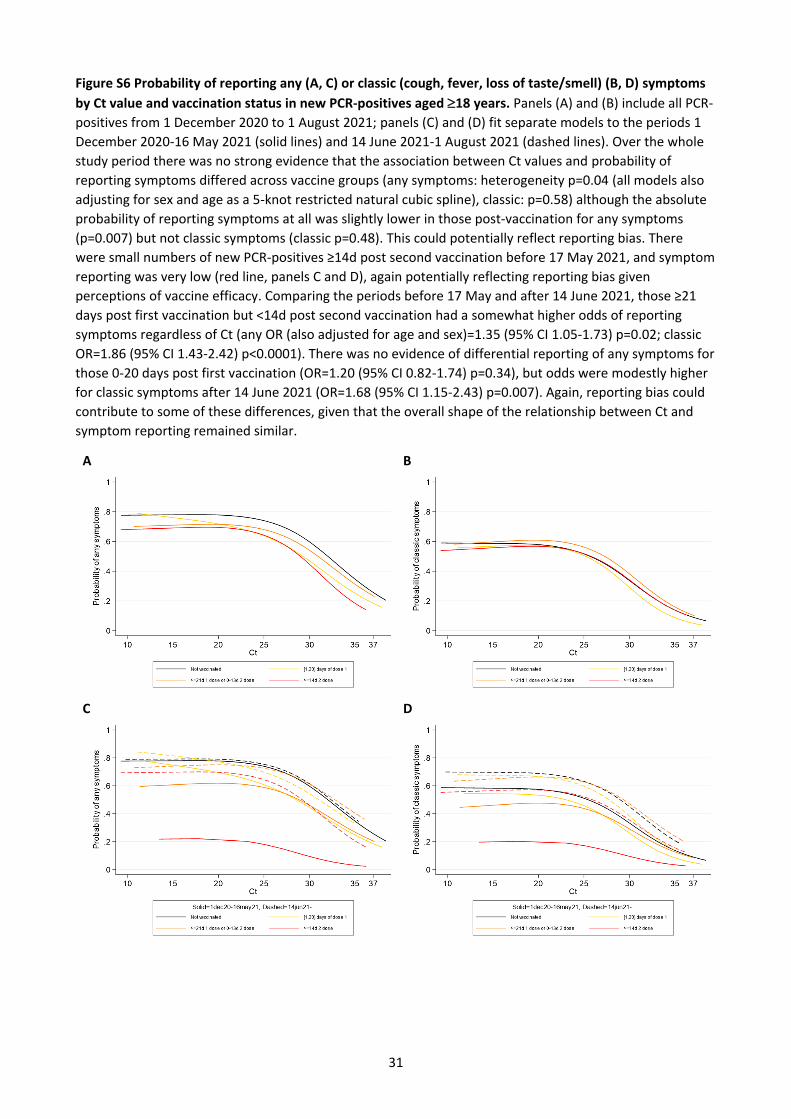
Figure S6 Probability of reporting any (A, C) or classic (cough, fever, loss of taste/smell) (B, D) symptoms
by Ct value and vaccination status in new PCR-positives aged 18 years. Panels (A) and (B) include all PCR-
positives from 1 December 2020 to 1 August 2021; panels (C) and (D) fit separate models to the periods 1
December 2020-16 May 2021 (solid lines) and 14 June 2021-1 August 2021 (dashed lines). Over the whole
study period there was no strong evidence that the association between Ct values and probability of
reporting symptoms differed across vaccine groups (any symptoms: heterogeneity p=0.04 (all models also
adjusting for sex and age as a 5-knot restricted natural cubic spline), classic: p=0.58) although the absolute
probability of reporting symptoms at all was slightly lower in those post-vaccination for any symptoms
(p=0.007) but not classic symptoms (classic p=0.48). This could potentially reflect reporting bias. There
were small numbers of new PCR-positives ≥14d post second vaccination before 17 May 2021, and symptom
reporting was very low (red line, panels C and D), again potentially reflecting reporting bias given
perceptions of vaccine efficacy. Comparing the periods before 17 May and after 14 June 2021, those ≥21
days post first vaccination but <14d post second vaccination had a somewhat higher odds of reporting
symptoms regardless of Ct (any OR (also adjusted for age and sex)=1.35 (95% CI 1.05-1.73) p=0.02; classic
OR=1.86 (95% CI 1.43-2.42) p<0.0001). There was no evidence of differential reporting of any symptoms for
those 0-20 days post first vaccination (OR=1.20 (95% CI 0.82-1.74) p=0.34), but odds were modestly higher
for classic symptoms after 14 June 2021 (OR=1.68 (95% CI 1.15-2.43) p=0.007). Again, reporting bias could
contribute to some of these differences, given that the overall shape of the relationship between Ct and
symptom reporting remained similar.
A B
C D

32
Figure S7 Adjusted effects of vaccine type and months since second vaccination on probability of
belonging to the low Ct sub-population (A) and Ct values within the low Ct sub-population (B), and of
calendar time on Ct values within the low Ct sub-population (C) in new PCR-positives 14 days after
second vaccination in those aged 18 years. Note: estimated at the reference category for other factors
(27 April 2021, male, no previous PCR/antibody-positive, not reporting a long-term health condition). In (C),
test for non-linearity in effect of calendar date p=0.003 for low and <0.0001 for high Ct sub-population.
A
B
C

33
Figure S8 Antibody changes after new PCR-positive 14 days after second ChAdOx1 (N=60) (A) or
BNT162b2 (N=51] (B) vaccinations. Median second vaccination date (IQR) 24 Apr 2021 (15 April-18 May)
for ChAdOx1 and 5 April (9 January-16 April 2021) for BNT162b2. Median (IQR) new PCR-positive date 13
June (30 May-19 June) for ChAdOx1 and 25 May 2021 (20 February-16 June) for BNT162b2.
A
B

34
Table S1: Characteristics of visits included in the analyses Note: analysis is based on visits rather than
participants and restricted to those either being unvaccinated or vaccinated with ChAdOx1, BNT162b2 or
mRNA-1273: factors above and vaccination exposure (detailed in Table S2) could change over time
Characteristic 1 Dec 2020-16 May 2021 (Alpha-dominant)
18 years old Total, n (%) or median (IQR)
17 May 2021 – 2 August (Delta-dominant)
18 years old Total, n (%) or median (IQR)
17 May 2021 – 2 August (Delta-dominant) 18-34 years Total, n (%) or median (IQR)
17 May 2021 – 2 August (Delta-dominant) 35-64 years Total, n (%) or median (IQR)
Female 1,383,521 (53.6) 439,890 (54.2) 62,747 (54.6) 234,514 (55.8)
White ethnicity 2,418,424 (93.7) 756,724 (93.2) 101,134 (87.9) 385,946 (91.9)
Age 56 (41,68) 57 (42,69) 28 (23,32) 52 (44,58)
Region / country
London 451,476 (17.5) 140,057 (17.3) 29,154 (25.3) 77,441 (18.4)
North West England 290,953 (11.3) 83,529 (10.3) 11,435 (9.9) 42,585 (10.1)
North East England 95,547 (3.7) 30,158 (3.7) 3,892 (3.4) 15,091 (3.6)
Yorkshire 204,631 (7.9) 69,546 (8.6) 9,105 (7.9) 36,058 (8.6)
West Midlands 187,801 (7.3) 62,202 (7.7) 8,843 (7.7) 31,657 (7.5)
East Midlands 158,924 (6.2) 50,893 (6.3) 6,943 (6.0) 26,228 (6.2)
South East England 322,740 (12.5) 106,483 (13.1) 12,721 (11.1) 55,197 (13.1)
South West England 199,878 (7.7) 56,290 (6.9) 5,966 (5.2) 27,392 (6.5)
East England 259,811 (10.1) 67,086 (8.3) 7,974 (6.9) 34,334 (8.2)
Northern Ireland 73,296 (2.8) 22,399 (2.8) 3,146 (2.7) 12,158 (2.9)
Scotland 211,833 (8.2) 73,518 (9.1) 9,841 (8.6) 38,064 (9.1)
Wales 123,131 (4.8) 49,463 (6.1) 6,003 (5.2) 23,914 (5.7)
Household size
1 491,866 (19.1) 168,423 (20.8) 12,886 (11.2) 74,749 (17.8)
2 1,246,647 (48.3) 388,494 (47.9) 46,117 (40.1) 166,359 (39.6)
3 397,242 (15.4) 122,254 (15.1) 27,504 (23.9) 80,720 (19.2)
4 315,769 (12.2) 95,518 (11.8) 18,769 (16.3) 73,227 (17.4)
5+ 128,497 (5.0) 36,935 (4.6) 9,747 (8.5) 25,064 (6.0)
Multigenerational household
111,165 (4.3) 35,389 (4.4) 4,825 (4.2) 28,576 (6.8)
Rural-urban classification
Major urban 915,065 (35.5) 292,442 (36) 53,528 (46.5) 156,941 (37.4)
Urban city/town 1,095,963 (42.5) 344,593 (42.5) 45.766 (39.8) 177,297 (42.4)
Rural town 279,076 (10.8) 86,148 (10.6) 8,470 (7.4) 42,239 (10.1)
Rural village 289,917 (11.2) 88,441 (10.9) 7,259 (6.3) 43,642 (10.4)
Deprivation centile (1 = most deprived, 10 = least deprived)
6 (3,8) 6 (3,8) 5 (3,7) 6 (3,8)
Ever reported to be a care home worker
30,050 (1.2) 9,266 (1.1) 1,742 (1.5) 6,739 (1.6)
Ever reported to be a person-facing healthcare worker
66,238 (2.6) 20,850 (2.6) 4,134 (3.6) 15,219 (3.6)
Ever reported to be person-facing social care worker
29,691 (1.2) 10,261 (1.3) 1,705 (1.5) 7,687 (1.8)

35
Characteristic 1 Dec 2020-16 May 2021 (Alpha-dominant)
18 years old Total, n (%) or median (IQR)
17 May 2021 – 2 August (Delta-dominant)
18 years old Total, n (%) or median (IQR)
17 May 2021 – 2 August (Delta-dominant) 18-34 years Total, n (%) or median (IQR)
17 May 2021 – 2 August (Delta-dominant) 35-64 years Total, n (%) or median (IQR)
Ever reported to have a long-term health condition
722,819 (28.0) 231,416 (28.5) 20,099 (17.5) 101,659 (24.2)
Days since previous visit
>14 days 1.772,532 (68.7) 707,099 (87.1) 97,880 (85.1) 367,294 (87.4)
<= 14 days 662,234 (25.7) 78,135 (9.6) 12,671 (11.0) 39,603 (9.4)
Enrolment 145,255 (5.6) 26,390 (3.3) 4,472 (3.9) 13,222 (3.1)
Smoking status
Non-smoker 2,325,890 (90.2) 731,654 (90.1) 101,670 (88.4) 370,618 (88.2)
Tobacco smoker 195,301 (7.6) 61,758 (7.6) 9,915 (8.6) 37,509 (8.9)
Only vape 58,830 (2.3) 18,212 (2.2) 3,438 (3.0) 11,992 (2.9)
Contact with hospital in last 28 days
Missing (n) 34,645 2,607 369 1,320
No 1,995,000 (78.4) 604,317 (74.7) 84,146 (73.4) 312,112 (74.5)
Yes, I have 347,145 (13.6) 138,498 (17.1) 17,817 (15.5) 71,921 (17.2)
No, but someone in household has 203,231 (8.0) 66,202 (8.2)
12,691 (11.1) 34,766 (8.3)
Contact with care home in last 28 days
Missing (n) 42,063 3,628 527 1,821
No 2,452,588 (96.6) 766,973 (94.9) 108,837 (95.1) 394,263 (94.3)
Yes, I have 49,649 (2.0) 26,407 (3.3) 2,722 (2.4) 15,791 (3.8)
No, but someone in household has 35,721 (1.4) 14,616 (1.8)
2,937 (2.6) 8,244 (2.0)
.

36
Table S2: Vaccination and previous infection status for visits included in analysis (18 years and older) Note: analysis is based on visits rather than participants:
factors (Table S1) and vaccination exposure could change over time. See methods for definition of PCR-positive episodes of infection and prior positivity. Cells with
zeros only are by definition. NA indicates to few visits to estimate effectiveness.
1 Dec 2020 – 16 May 2021 (Alpha-dominant) 17 May 2021 – 2 August (Delta-dominant)
Vaccination and previous infection status
No prior study or national testing programme swab-positive and no antibody positive Number of visits (row %) [number of positives]
Prior study or national testing programme swab-positive or antibody positive Number of visits (row %) [number of positives]
No prior study or national testing programme swab-positive and no antibody positive Number of visits (row %) [number of positives]
Prior study or national testing programme swab-positive or antibody positive Number of visits (row %) [number of positives]
Not vaccinated, no prior positive, >21 days before vaccination
1,561,154 (100%) [14,440] 0 (0%) [0] 27,135 (100%) [351] 0 (0%) [0]
Not vaccinated, no prior positive, 1-21 days before vaccination
220,749 (100%) [665] 0 (0%) [0] 16,754 (100%) [51] 0 (0%) [0]
Vaccinated 0-20 days ago, ChAdOx1 127,572 (95%) [293] 4,169 (5%) [11] 4,435 (92%) [4] 387 (8%) [0]
Vaccinated 0-20 days ago, BNT162b2 70,837 (98%) [419] 1,562 (2%) [6] 23,387 (90%) [175] 2,496 (10%) [10]
Vaccinated 0-20 days ago, mRNA-1273 NA NA 2,941 (91%) [19] 275 (9%) [1]
≥ 21 days after 1st dose, no second dose ChAdOx1
236,306 (95%) [227] 11,390 (5%) [11] 64,232 (91%) [194] 6,377 (9%) [20]
≥ 21 days after 1st dose, no second dose, BNT162b2
141,968 (96%) [278] 5,259 (4%) [11] 38,505 (91%) [410] 3,998 (9%) [12]
≥ 21 days after 1st dose, no second dose, mRNA-1273
NA NA 5,710 (91%) [30] 534 (9%) [2]
0-13 days after second dose ChAdOx1 32,239 (95%) [14] 1,657 (5%) [2] 44,879 (91%) [91] 4,429 (9%) [1]
0-13 days after second dose, BNT162b2 34,406 (96%) [28] 1,542 (4%) [0] 11,146 (90%) [40] 1,184 (10%) [1]
≥ 14 days after second dose ChAdOx1 30,178 (95%) [9] 1,562 (5%) [1] 303,511 (92%) [1,175] 27,166 (8%) [61]
≥ 14 days after second dose, BNT162b2 70,058 (96%) [39] 3,231 (4%) [4] 199,411 (93%) [422] 16,166 (7%) [25]
Not vaccinated, prior positive 0 (0%) [0] 24,256 (100%) [80] 0 (0%) [0] 5,753 (100%) [25]

37
Table S3: Vaccine effectiveness by subgroups during the Delta-dominant period in those aged 18-64 years Note: obtained using a model with logit-linear slopes
on time since ≥14 days after second ChAdOx1 or BNT162b2 vaccination. The effect estimates in the table relate to the effectiveness on the 14th day after the
second dose (‘intercept’ of the second dose effect). Potential waning of effectiveness as a function of time since ≥14 days after the second vaccination is obtained
from the same model by including logit-linear time terms for BNT162b2 and ChAdOx1 that are not varied by subgroup due to insufficient numbers to estimate
different slopes by the combination of vaccine type and subgroup effects (potential waning effects shown in Figure 2, Figure S3 & Figure S4). P-values<0.01 shown
in bold (0.01 threshold used given the number of tests performed).
VE against all infections VE against infections with Ct<30
VE against infections with reported symptoms
By evidence of prior infection
No evidence of prior
infection
Evidence of prior
infection
Hetero-geneity p-value
No evidence of prior
infection
Evidence of prior
infection
Hetero-geneity p-value
No evidence of
prior infection
Evidence of prior infection
Hetero-geneity p-value
≥21 days after 1st dose, no second vaccination BNT162b2
57% (50-63%) 91% (84-95%) <0.0001 62% (54-68%) 96% (88-98%) <0.0001 58% (50-65%) 94% (87-98%) <0.0001
≥21 days after 1st dose, no second vaccination ChAdOx1
43% (30-54%) 53% (24-71%) 0.45 45% (30-57%) 78% (49-90%) 0.03 34% (16-48%) 83% (55-94%) 0.007
≥21 days after 1st dose, no second vaccination mRNA-1273
76% (64-83%) 86% (44-97%) 0.43 76% (62-85%) 100%
(100-100%) <0.0001 76% (62-85%) 100% (100-100%) <0.0001
14 days after 2nd dose BNT162b2
85% (79-90%) 93% (87-96%) 0.006 92% (87-95%) 98% (94-99%) 0.004 93% (89-97%) 99% (96-100%) 0.002
14 days after 2nd dose ChAdOx1
68% (61-73%) 88% (83-92%) <0.0001 69% (61-75%) 92% (87-95%) <0.0001 72% (64-78%) 94% (89-97%) <0.0001
By age Aged 18-34
years old Aged 35-64
years old
Hetero-geneity p-value
Aged 18-34 years old
Aged 35-64 years old
Hetero-geneity p-value
Aged 18-34 years old
Aged 35-64 years old
Hetero-geneity p-value
≥21 days after 1st dose, no second vaccination BNT162b2
64% (57-70%) 36% (14-53%) 0.0009 68% (60-74%) 46% (22-62%) 0.01 66% (58-72%) 32% (0-53%) 0.002
≥21 days after 1st dose, no second vaccination ChAdOx1
43% (11-64%) 18% (-9-39%) 0.18 57% (21-77%) 22% (-9-45%) 0.10 37%
(-7% -63%) 0% (-43-31%) 0.16

38
VE against all infections VE against infections with Ct<30
VE against infections with reported symptoms
≥21 days after 1st dose, no second vaccination mRNA-1273
82% (70-89%) 56% (23-75%) 0.02 81% (66-90%) 64% (27-83%) 0.18 85% (72-92%) 48% (-1-73%) 0.008
14 days after 2nd dose BNT162b2
90% (85-93%) 77% (65-85%) 0.0001 95% (91-97%) 88% (79-93%) 0.002 96% (93-98%) 88% (78-94%) <0.0001
14 days after 2nd dose ChAdOx1
73% (65-80%) 54% (40-65%) 0.002 74% (64-81%) 57% (41-69%) 0.02 76% (67-83%) 57% (39-70%) 0.007
By interval between first and second doses
Dosing interval <9
weeks
Dosing interval ≥9
weeks
Hetero-geneity p-value
Dosing interval <9
weeks
Dosing interval ≥9
weeks
Hetero-geneity p-value
Dosing interval <9
weeks
Dosing interval ≥9 weeks
Hetero-geneity p-value
14 days after 2nd dose BNT162b2
85% (78-90%) 85% (78-90%) 0.89 93% (88-96%) 92% (86-95%) 0.49 93% (88-96%) 93% (88-96%) 0.97
14 days after 2nd dose ChAdOx1
68% (60-75%) 67% (61-73%) 0.80 69% (60-77%) 69% (61-75%) 0.89 74% (65-80%) 71% (64-78%) 0.47
By self-reported long-term health conditions
No long-term health
conditions
Long-term health
conditions
Hetero-geneity p-value
No long-term health
conditions
Long-term health
conditions
Hetero-geneity p-value
No long-term health
conditions
Long-term health conditions
Hetero-geneity p-value
≥21 days after 1st dose, no second vaccination BNT162b2
58% (50-64%) 62% (39-77%) 0.65 62% (54-69%) 66% (40-80%) 0.76 58% (49-66%) 66% (40-81%) 0.48
≥21 days after 1st dose, no second vaccination ChAdOx1
45% (32-55%) 7% (-48-41%) 0.04 46% (30-58%) 28%
(-27-59%) 0.35 38% (19-52%) 5% (-66-46%) 0.18
≥21 days after 1st dose, no second vaccination mRNA-1273
77% (65-84%) 59%
(-17-85%) 0.31 78% (65-87%)
59% (-35-88%)
0.33 80% (66-88%) 44 (-61-81%) 0.09
14 days after 2nd dose BNT162b2
86% (80-90%) 81% (69-89%) 0.23 92% (87-95%) 92% (85-96%) 0.96 94% (89-96%) 92% (84-96%) 0.38
14 days after 2nd dose ChAdOx1
69% (62-74%) 58% (39-71%) 0.10 70% (62-76%) 65% (46-77%) 0.48 73% (65-79%) 64% (44-77%) 0.23

39
Table S4: Independent associations with Ct values in new PCR-positives 14 days after second vaccination 18 years and older
Low Ct vs high Ct: odds of class membership
Low Ct sub-population: mean Ct High Ct sub-population: mean Ct Het low vs high mean
OR 95% CI p Effect 95% CI p Effect 95% CI p p
Overall mean Ct +21.2 +18.5,+23.8 <0.0001 33.0 +32.4,+33.5 <0.0001 <0.0001
Per month post 1 Jan 2021 (reference 27 April) 2021
1.76 1.41,2.20 <0.0001 Fig S5C 0.0002 Fig S5C 0.0004
Vaccine: 14 days post second dose
ChAdOx1 1.00 (ref) - 0.0 (ref) - 0.0 (ref) -
BNT162b2 0.33 0.16,0.67 0.002 +4.0 +1.4,+6.6 0.003 +0.5 -0.2,+1.2 0.16 0.008
Vaccine: per month later post second dose
ChAdOx1 0.97 0.79,1.19 0.78 -0.2 -0.8,+0.3 0.45 -0.1 -0.3,+0.2 0.66 0.58
BNT162b2 1.43 1.07,1.91 0.01 -1.6 -2.5,-0.6 0.002 -0.0 -0.3,+0.3 0.82 0.01
Previously PCR/antibody-positive 0.35 0.21,0.57 <0.0001 0.58 0.10
Report having a long-term health condition 0.69 0.53,0.90 0.006 0.78 0.52
Sex: Male 0.34 0.0 (ref) - 0.0 (ref) -
Female - +0.0 -0.7,+0.7 0.98 +0.3 +0.0,+0.6 0.04 0.39
Age 0.19 0.24 0.64
Ethnicity (white vs non-white) 0.96 0.65 0.85
Patient facing healthcare worker 0.63 0.90 0.28
Deprivation percentile 0.60 0.94 0.91
Interval between first and second dose 0.83 0.64 0.16
Note: where effect size not shown (gray cells), p-values in italics show the additional effect of adding this term into the model for either class membership or for
and effect on mean Ct in the two sub-populations. Test for interaction between effect of vaccine type and time since second dose: p=0.02 for membership of high
vs low Ct sub-population, p=0.01 for low mean Ct, p=0.89 for high mean Ct. Excluding 17 positives occurring ≥14 days after second vaccination but not reporting
either two ChAdOx1 or two BNT162b2 doses. There was no evidence of interaction between vaccine type and age for class probability (p=0.09) or mean Ct (p>0.1);
nor was there evidence of interaction between vaccine type and date for class probability (p=0.69) or mean Ct (p>0.4).
Top Related