


Languages
Pages
Legal


IMMIGRATION AS A STRATEGIC
VECTOR FOR THE SOCIO-ECONOMIC
AND INSTITUTIONAL DEVELOPMENT
OF BRAZIL
Strategic Studies of Public Policies
VOLUME 1ISBN: 978-85-64878-14-3

4

5
SUMMARY
PRESENTATION..............................................................................................................................................
EXECUTIVE SUMMARY................................................................................................................................
1. INTRODUCTION.............................................................................................................................................
2. DEVELOPMENT...............................................................................................................................................
2.1 The phenomenon of immigration in the contemporary world: Interdependence,
Control and Impact ...........................................................................................................................
2.2 Migrations, public policies and the brain drain.......................................................................
2.3 The need for public immigration policies for skilled workers in Brazil:
demographic aspects........................................................................................................................
2.4 The creation of human capital as a bottleneck for development in the BRIC
countries (Brazil, Russia, India and China)...............................................................................
2.5 Immigrant populations as the subject of analysis: approaches and the demo-
graphic profile of the immigrant population in Brazil..........................................................
2.5.1 Descriptive analysis of the profile of immigrants in Brazil.......................................
2.6 Unemployment rates in European countries and brief analyses, including the US..
2.7 Institutional structure necessary for the operationalization of immigration policies........
3. CONCLUSION AND SUMMARY OF MAIN POINTS ..........................................................................
APPENDICES ..................................................................................................................................................
07
11
15
21
22
27
41
44
51
54
75
83
89
99

6

7
PRESENTATION

8
Brazil has demonstrated resilience in relation to the recent economic crises and has an auspicious development potential
projected for the coming decades, which, linked to the globalization process, provides important opportunities for our
people. Gradually we have established ourselves as one of the leading nations in the world and we have become a reference
in questions linked to economic equilibrium, development, energy, agriculture and the environment. This international
recognition favors the exchange of experiences with other cultures, governments and organizations, bringing with it the
possibility of stimulating a dynamic process of development and innovation.
Among the various factors necessary for this potential to be achieved, we have to strengthen our capacity to create, attract
and retain highly skilled professionals. This is one of the principal determinants of success of countries in terms of their
social and economic development, through innovation and technological advances in areas which impact on productive
chains in strategic industries.
Effective policies for attracting and retaining skilled professionals can stimulate development in the area of Science,
Technology and Innovation (CT&I), contributing to the dynamism of the economy. Immigration policies should, thus,
be linked to analyses of skill deficits in the Brazilian labor market, in accordance with short, mid and long term strategic
perspectives.
The preparation of public policies concerned with administrating a mobility system is one of the great challenges we
will face in the coming decades. Immigration has to be recognized as a vector of development for human capital. To
prepare efficient policies to administer immigration, institutional integration has to be expanded and effective tools have
to be created for coordination, the alignment of information flows, data collection and analysis and the construction of
consensus.
One of the pillars of FGV Foundation is the mission to contribute in an efficient form to innovation and the modernization
of Brazilian institutions, based on strong standards of excellence and quality. As a form of expanding debate in this area,
FGV Foundation, an institution committed to development for almost 70 years, is publishing Immigration as a Strategic
Vector for the Socio-Economic and Institutional Development of Brazil. The launch of this publication, the first in a
series of strategic studies of public policies, the fruit of a partnership which brings together the technical and empirical
knowledge accumulated by FGV Projetos with the applied research of the Directorate of Public Policies Analysis (DAPP),
highlights the importance of association between research and the application of knowledge to propose fundamental
tasks for the national public agenda.
Cesar Cunha Campos
Director, FGV Projetos
Marco Aurélio Ruediger
Director of Public Policies Analysis, FGV Foundation
9

10

EXECUTIVE SUMMARY
12
This report demonstrates that in Brazil at present there is an urgent need for public policies aimed at the attraction and
retention of highly qualified professionals in areas that are strategic for national socio-economic policy. This does not
involve seeking to increase of competition for workers in the Brazilian labor market, but to the contrary, promoting the
development of strategic industries and advances in the area of science, technology and innovation (ST&I), recognizing
immigration as a vector of development for human capital.
It is fundamental that public policies aimed at attracting highly qualified immigrants as a form of promoting socio-
economic development take into consideration other important axes of immigration policy, such as the analysis of factors
which condition migratory flows, the need to guarantee human rights and the integration of migratory populations, and
the imperative for the maintenance of national security. These policies should also take into account economic, social and
political impacts, from the point of view of the populations from the countries of origin and the destination countries, as
well as the migratory populations themselves, in order to contribute to responsible political action.
The capacity to create, attract, and retain talents in accordance with a national development strategy is one of the
principal factors which determines the success of countries, in terms of their social and economic development in the
contemporary world. Most developed countries have specific policies aimed at the attraction and retention of highly
skilled professionals in the international market. With the recent increase in governmental investment in education
and the development of advanced research in Brazil, the country risks suffering the growth of the so-called brain drain.
Moreover, Brazil is now going through a process of demographic transition and needs, in the space of a generation, to
promote a process of exponential increase in its indices of productivity. The scarcity of human resources is one of the
principal bottlenecks which threatens the economic development of the BRIC countries (Brazil, Russia, India and China).
In Brazil specifically, the results of the lack of proper investment in education in recent decades are now appearing, since
investment in education has an incremental nature and takes time to produce results. The attraction of highly skilled
immigrants can allow the deficit of proper investment in the past to be overcome, so that better advantage can be taken
of the ‘demographic bonus.’
Due to the recent Brazilian resilience to the cycle of global crises which began in 2008, the country has become an
increasingly more attractive destination for migrants, which constitutes an unequalled opportunity to attract talents in the
international market. Brazil has received an increasing quantity of immigrants with average levels of skills. Although this
has increased the critical mass of the country and generated benefits for some industries, in some cases scarce positions
are disputed with Brazilian labor. Nevertheless, as we will see, there are still very few highly skilled immigrants, apt to
occupy positions for which there are no Brazilian workers and in this way to accelerate the development of new industries.
Brazil should, thus, create policies concerned with immigration linked with national geopolitical and commercial
strategies, since migratory flows produce significant ties and can improve relations between nations. However, for these
policies to be successful, it is fundamental that institutional integration be expanded and effective tools are created for
coordination, the alignment of information flows, the collection and analysis of data and the construction of consensus.
In summary, it is necessary to break with the verticalization of bureaucratic structures and the narrow focus on the limits
of jurisdiction of the different ministries and bodies involvement in the national policy of the monitoring, administration
and control of immigrants. In fact, Brazil could benefit from the creation of a specific agency, capable of catalyzing
initiatives, articulating the multiple institutional actors involved in immigration administration, and contributing to
achieving its strategic visions.

13
The set of reflections developed in this study allows us establish some directives which should guide the preparation of
rational, systemic, and well grounded public policies, aimed at the attraction of skilled immigrants as a vector for the
socio-economic development of the country. These are:
• Be based on the analysis of the conditioning factors of migratory flows and the projection of the impacts of
migrations.
• Consider the perspectives of the populations of countries of origin, of Brazilian society and the migrant
population to achieve responsible policies.
• Guarantee the human rights of the immigrant population.
• Harmoniously integrate immigrants in Brazilian society.
• Protect Brazilian workers.
• Ensure the maintenance of national security.
• Consider demographic development, as well as economic cycles and tendencies.
• Ensure socio-economic development at the national, regional and local levels.
• Overcome skill deficits in the Brazilian labor market.
• Complement the national development strategy in the area of Science, Technology and Innovation (ST&I).
• Be connected with the stimulation of the innovative business sector and the strengthening of
entrepreneurialism.
• Seek to contribute to an increase in productivity and to contribute to the aggregate value of the production
of industries based in Brazil.
• Contribute to the development of commercial partnerships at the international level.
• Integrate with geopolitical strategy, taking into account negotiations carried out with multilateral agencies.
• Involve civil society through a wide-ranging public debate.
• Create faster means, with less bureaucracy, to regularize the situation of highly skilled immigrants.
• Integrate the various state agencies concerned with immigration policy and provide means for the negotiation
of consensus.
• Provide effective tools for coordination, the alignment of information flows, and the accumulation, cross-
tabulation and analysis of data.
• Provide institutional means for effective administration, through the creation of an immigration agency with
multiple jurisdictions, integrating and institutionally strengthening existing state structures.

14

15
I
INTRODUCTION
16
With the constant reduction in the costs of transport and with the emergence and popularization of new
telecommunications technologies, the phenomenon of globalization has resulted in a significant increase in
mobility at the international level. An intensification of the trans-frontier circulation of people can be noted,
as well as wide-ranging diversification in migratory corridors. Ban Ki-moon, Secretary-General of the United
Nations (UN), argues that we are entering an ‘era of mobility:’
“[...] when people will cross borders in ever greater numbers in pursuit of opportunity and a better
life. They have the potential to chip away at the vast inequalities that characterise our time, and
accelerate progress throughout the developing world.”1
The so-called ‘era of mobility’ is characterized by an important transformation in daily experience, which provides
the foundations for concepts such as ‘social group’ and ‘national frontier.’ In this context, national frontiers,
more than mere geographical limits of the territory of a given nation state, have been increasingly perceived
as selective mechanisms for controlling the flow of people, goods, services, capital and information, i.e., as
the conditions of permeability which define the constitution of collectivities, based on the initial conditions
given by different historic-cultural matrices and political projects from different countries within the concerto
of nations. Moreover, with the advance of information and communication technology among different social
groups, communities of interest have emerged, connected in networks which go beyond geographic, political
and legal boundaries.
In the age of mobility, nation states are faced with renewed challenges and opportunities. It is fundamental to
understand the various factors which impel individuals to migrate and the multiple impacts of migrations, taking
into account the complexity created by the coexistence between a global economy that is increasingly integrated
and interdependent, and a space of international relations still strongly marked by differences in relation to
political regime, governmental instruments, and the diacritical cultural traits which define the mechanisms of
sociability and the identity of peoples. According to the assumption of canonic studies of migrations, what have
to be taken into account are endogenous conditions, i.e., problems which push the migrant out of his country of
origin, and exogenous condition, such as incentives and attraction, whether intentional of not, which are offered
by the destination country. Among the principal endogenous motivations are political conflicts and oppression,
economic crises, environmental catastrophes, fleeing from obligations or legal and/or fiscal punishments, ethnic
or religious persecutions, etc. In relation to the exogenous motivations, we can cite opportunities in the labor
market, wage differentials, education opportunities, a search for a better quality of life, matrimonial alliances, and
even environmental attractions, such as climate and landscape. What has to be considered is not just the benefits,
but also the costs which migration incurs. Among these we can cite some tangible costs, such as transport costs,
or bureaucracy, the abandonment of properties and the selling of material goods, and intangible costs, which
are sometimes more relevant, such as the separation of relatives, difficulties in adapting to new cultures and
integration in dissimilar societies. It is fundamental that we take into consideration the way in which the period
of social and paradigmatic changes, such as those generated by important technological changes (especially in

17
the area of telecommunications and transport), which we are currently experiencing, involves alterations in the
perception of the costs and benefits involved in the decision to emigrate.2
Saskia Sassen was one of the first to argue that it was necessary to identify the processes which transform the
factors that condition migrations as a requirement for the creation of mechanisms to allow migratory flows to
be taken advantage of as a vector for socio-economic development.3 As a result of the restructuring of the global
economy, the circulation of workers should increasingly be considered according to their inter-relations with
the circulation of capital, services, information, etc. According to Sasaki and Assis, foreign investment, for
example, has become a fundamental variable for understanding international migratory flows.4 At present in
most countries in the so-called developed world there exist public policies specifically aimed at the regulation
of migratory flows and, in a stricter sense, for attracting immigrants with determined qualification profiles.
The objective of the establishment of specific categories of entry authorization is to favor the entrance of
immigrants with certain intellectual, technical, and/or professional profiles, in accordance with each country’s
development strategy and their needs in their respective labor markets.5

18
The international attraction of talent, central in this analysis, is associated with the phenomenon of the
exodus of highly skilled individuals from countries which in some form pay for the costs of their education.
We know that some Brazilians with high professional and educational qualifications emigrate not only due to
the existence of attractions, such as better opportunities for salaries, quality of life, or the solidity of research
institutions, but also due to the existence of assertive and institutionalized public policies aimed at regularizing
the legal permanence of highly skilled immigrants in the countries which receive them. It has to be kept in mind
that developed nations methodically observe this type of policy, which are used in a more or less extensive
form in accordance with their strategic interests. In this case, what is at stake is not only knowing whether
Brazil needs to revise its current policy, but also to highlight institutional arrangements necessary to allow the
implementation of an immigration management policy, whatever it may be.
Due to the growing importance of Brazil in the global economic scenario, and given the mechanisms used in other
developed countries for attracting skilled foreign professionals, it can be noted that there is a lack of strategic
focus orienting Brazilian migration policy so as to take advantage of its new status in international political
and economic strategy. In fact, the growing attractiveness of the Brazilian economy, added to the lack of skilled
labor in various sectors in the country’s economy, indicates that there is need for an urgent formulation of a
set of public policies aimed at attracting qualified immigrants, especially if we take into account the enormous
effort that the federal government has been making to increase scientific and intellectual production, technical
qualification and the country’s technological potential.
According to George Firmeza, the debate about migration, whether in the sphere of international bodies, public
agencies or academia, is centered on four large thematic axes.6 The first is concerned with understanding the
causes of migrations. The second consists of understanding ways of guaranteeing human rights for migrant
populations. The third deals with the debate about whether or not to include irregular migrations in the
perspective of national security. Finally, the fourth axis focuses on the evaluation of the possible effects of
migrations on the economic and social development of countries.
The aim of this study is to frontally approach one of the dimensions of the fourth axis, namely the attraction of
qualified immigrants as a vector for national development, without, however, losing sight of the perspectives
of the other three axes which precede this. Good immigration administration, responsibly done, must take
into account the possible benefits and costs in play for the population of immigrants countries of origin, for
Brazilian society which receives them, and for the migrants themselves.
To present our argument, this publication is divided into three parts. After the brief conceptualization presented
in this Introduction, Part Two, Development, is divided into seven subsections. In subsection 2.1, we show
the need for public policies dealing with immigration through a brief contextualization of the phenomenon
of migration in the contemporary world, indicating the growing relevance of its impacts; in subsection 2.2,
we are concerned with conceptualizing the phenomenon of ‘brain drain’ through the presentation of a brief
panorama about public policies concerned with the dispute for talent in the international market; in subsection
2.3, we show the need to implement public immigration policies qualified in Brazil through the analysis of
19
demographic aspects, observing a singular historic opportunity to adopt a strategic position; in subsection
2.4 we establish which problems related to human capital are among the principal development bottlenecks
for countries from the BRIC group (Brazil, Russia, India and China), showing the historic deficit of investment
and proper administration of the education system in Brazil; in subsection 2.5 we seek to introduce emergent
perspectives which allow us to look at how to use research on immigration as a contribution for the preparation
of public policies, as well as presenting in a descriptive manner the profile of the immigrant population in
Brazil; in subsection 2.6, we make a brief analysis of unemployment among European countries, with the
objective of highlighting the existence of skilled labor apt to be attracted to Brazil; in subsection 2.7 we draw
a map of Brazilian governmental institutions and a tree of the macro-processes involved in the implementation
and administration of immigration policy in Brazil. Finally, in the Conclusion we highlight some innovation
in public immigration policies, in order to provide institutional means to achieve effectiveness in the strategic
administration of immigrant workers.

20

21
IIDEVELOPMENT

22
2.1 THE PHENOMENON OF IMMIGRATION IN THE CONTEMPORARY WORLD: INTERDEPENDENCE, CONTROL AND IMPACT
According to the 2009 report of the United Nations Program for Development (PNUD), in 2005 there existed 195 million
migrants in the world, amounting to about 3% of the world population. In 2010 this rose to 214 million, among whom
128 millions had as receiver countries were the so-called developed countries.7
The contemporary economic system is characterized by a growing interdependence among the markets of different
countries. In fact, in the world at the present there are no countries capable of reaching desirable levels of socio-
economic development without dealing in some form with numerous exchanges with other nations. The economic
connections between countries constitute an important conditioning factor for migratory flows. According to Patarra,
the recent globalization process brought with it the growth of a liberalizing ideology, which propelled the flexibilization
of national barriers to the circulation of capitals and merchandise.8 Martine observes that liberalization incentives have
not impacted on the barriers which restrict the circulation of people between countries, with the exception of countries
belonging to integrated blocs, such as the European Union, and more recently – and only partially – the Common
Market of the South (Mercosul).9
According to the 2011 annual study of the Organization for Economic Cooperation and Development (OECD),
an increase in the vulnerability of immigrants has been observed, as well as a growing hostility on the part of the
population of receiving countries, focusing on immigrants with low skills and belonging to cultures or ethnicities
• Global interdependence, which characterizes contemporaneity, contributes to the increase and
the diversification of migratory flows.
• Most developed countries have selective policies and control for the regulation of immigration.
• It is necessary to understand the different factors which condition migrations to anticipate its impacts
and to prepare adequate policies.
• The alteration of migratory flows, especially in periods of crisis, presents important economic,
social and political impacts, both for countries of origin, and for migrants’ destination countries.
• Effective mechanisms are fundamental to monitor and control the entrance and departure of foreigners,
such as analyses and projections about the impact of immigrations, as a necessary foundation for the
preparation of any immigration management.
SUMMARY
23
different from those which predominate in destination countries.10 Increased human mobility does not appear to be
a process free of contradictions or conflicts, while the continuous intensification of international migratory flows has
been accompanied by the intensification of the establishment of physical barriers (walls and fences) by the creation
of restrictive or selective policies on the part of the countries which receive large influxes of immigrants. According
to United Nations data, the percentage of developed countries whose governments adopted restrictive immigration
policies grew continually from the end of the 1990s, rising from 18% in 1976, to 38% in 1986, reaching 60% in 1996.
Nevertheless, with the ageing of the population of some developed countries in Europe, an important reduction in this
figure was noted, which fell to 33% in 2003. As a result of the fateful events of 2001, involving the terrorist attack on
the twin towers of the World Trade Center in New York, immigration policies have strongly returned to strengthening
control and security structures. In fact, an apparent contradiction could be involved in the developed world with
increased freedom for the international circulation of information, goods, services and capital, accompanied by
attempts to restrict the circulation of people.11
Attempts to restrict the flow of people have to be seen in broad manner, as global interdependence does not just occur
among markets. Increasingly there is also an interconnection between areas of conflict – poppy farmers in Afghanistan
and heroin users in the large American metropoles, hunger in the Horn of Africa and African immigration in Western
European countries, terrorist attacks and the growth of religious intolerance, etc. We live in a world in which political
tensions, ethnic conflicts, economic crises and environmental catastrophes in one part of the planet generate intense
migratory pressures and reactive restrictions in others. According to a IMO (International Migration Organization)
report, the drafting of public policies dealing with migration now occurs in a very complex context, with the increased
dependence of national economies on migrant workers, and the parallel growth of the attention paid to the links
between migratory flows and questions related to the maintenance of national security:
“[...] In other words, migration impacts are likely to have wider ramifications than before, and it is more
important than ever that migration policies are sensitive to the wider political, economic and social context
for international migration.”12
More especially, mutual impacts and connections between the cycles of economic crises and migratory flows have to
be understood. According to the IMO report:
“The 2008–2009 economic crisis, as well as prior episodes of recession, drew attention to the multiple
impacts on migrants, countries of origin and countries of destination, including on return, remittances
transfers, unemployment among migrant workers, and public attitudes towards migrants. While migrant
workers in certain, more cyclical sectors of the economy were hit hardest, there is evidence that other
sectors have remained relatively unscathed, or have flourished during the crisis. Periods of “boom and
bust” will continue to punctuate national and global economic activity and policymakers are struggling
with the question if and how migration flows can be managed in relation to such cycles. Some of the main
challenges concern the uncertainty of short- and medium-term labour market projections, the return of
migrants to home countries during times of economic difficulty, and the time lag between economic recession
or recovery and any reaction in migration flows. This session will provide an opportunity to analyse how
different governments have adjusted their migration policies in response to the recent crisis, with a view to
extracting lessons for the future.13”

24
The table below, produced by the IOM, presents a simplified typology to identify the principal negative impacts in
economic, social and political terms, especially in periods of crisis, to be taken into account by countries which send
or receive migrants.
Table 2.1.1
Typology of negative impacts of migrations, based on alterations
caused by previous financial crises
Source: IOM, 2009, p.19.
Impacts Countries which send emigrants Countries which receive immigrants
Economic
•Increaseinunemploymentastheresultofa
loss of foreign placements for national workers
(Philippines).
• Crease of unemployment as a result of the
returning workers (Bangladesh, Indonesia,
Thailand).
•‘Braindrain’(Argentina,Russia).
•Reductioninremittances(Asia,America).
• Increase in competition between migrant
workers and nationals.
•Increaseinirregularimmigration
(Korea, Malaysia).
•Lossofhighlyskilledexpatriates
(Indonesia).
• Reduction in number of foreign students
(United Kingdom).
Social
• Growing role of ‘intermediaries’ and
migration agents (Indonesia, Thailand).
•Increasedratesofemploymentamongwomen
(USA).
•Exploitationofmigrantworkers
(USA, Malaysia, Thailand)
•Appearance of new ethnicminorities in the
long term (Western Europe).
Political
• Weakening of the control of central
government over population distribution
(Russia).
•Socialagitationresulting fromthereturnof
urban unemployed to rural areas (Thailand).
•Increaseinxenophobia,anti-Semitismand
popular vigilantism. (Canada, France, USA,
Indonesia,Thailand).
• Increase in irregular migratory flows
(Western Europe, Russia).
•Politicalmobilizationofethniccommunities
(USA).
25
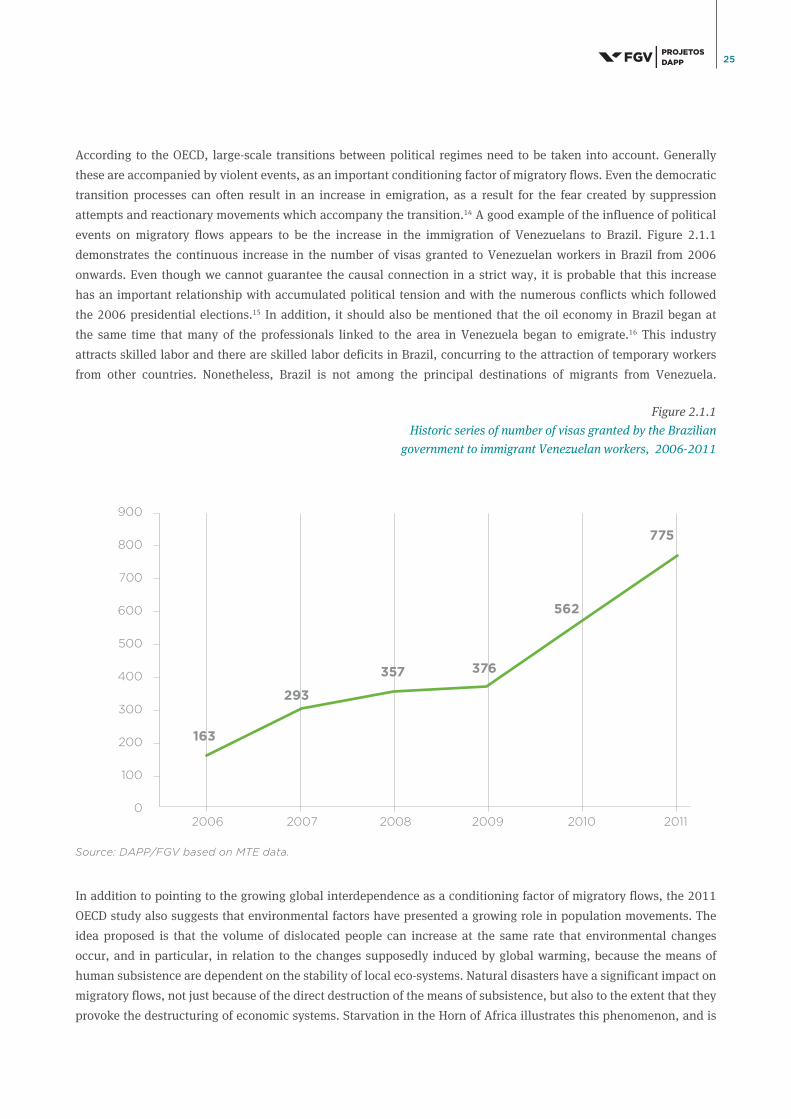
According to the OECD, large-scale transitions between political regimes need to be taken into account. Generally
these are accompanied by violent events, as an important conditioning factor of migratory flows. Even the democratic
transition processes can often result in an increase in emigration, as a result for the fear created by suppression
attempts and reactionary movements which accompany the transition.14 A good example of the influence of political
events on migratory flows appears to be the increase in the immigration of Venezuelans to Brazil. Figure 2.1.1
demonstrates the continuous increase in the number of visas granted to Venezuelan workers in Brazil from 2006
onwards. Even though we cannot guarantee the causal connection in a strict way, it is probable that this increase
has an important relationship with accumulated political tension and with the numerous conflicts which followed
the 2006 presidential elections.15 In addition, it should also be mentioned that the oil economy in Brazil began at
the same time that many of the professionals linked to the area in Venezuela began to emigrate.16 This industry
attracts skilled labor and there are skilled labor deficits in Brazil, concurring to the attraction of temporary workers
from other countries. Nonetheless, Brazil is not among the principal destinations of migrants from Venezuela.
Figure 2.1.1
Historic series of number of visas granted by the Brazilian
government to immigrant Venezuelan workers, 2006-2011
In addition to pointing to the growing global interdependence as a conditioning factor of migratory flows, the 2011
OECD study also suggests that environmental factors have presented a growing role in population movements. The
idea proposed is that the volume of dislocated people can increase at the same rate that environmental changes
occur, and in particular, in relation to the changes supposedly induced by global warming, because the means of
human subsistence are dependent on the stability of local eco-systems. Natural disasters have a significant impact on
migratory flows, not just because of the direct destruction of the means of subsistence, but also to the extent that they
provoke the destructuring of economic systems. Starvation in the Horn of Africa illustrates this phenomenon, and is
900
800
700
600
500
400
300
200
100
02006
163
293
357 376
562
775
2007 2008 2009 2010 2011
Source: DAPP/FGV based on MTE data.

26
one of the principal determinant factors of international migration. In 2010 more than two million people affected by
natural disasters were assisted by the UN High Commission for Refugees (UNHCR).17 One example of the influence of
environmental disasters on migratory flows was the increase of the immigration of Haitian workers in Brazil after 2010.
Figure 2.1.2 demonstrates the abrupt increase in the number of visas granted to Haitian immigrants after 2010, when
an enormous earthquake (seven on the Richter Scale) devastated the country. Also important is the fact that Brazil
leads the UN mission in Haiti, MINUSTAH, and had an important role in efforts to rebuild the country.
Figure 2.1.2
Historic series of the number of visas granted by the Brazilian
government to immigrant Haitian workers, 2006-2011
A striking fact about contemporary migrations is that, to the contrary of what we might imagine, the majority of
migrants from Southern hemisphere countries moved to other countries in the Southern hemisphere. According to
a 2005 estimate, 58.4 million migrants from developing countries (55%) moved to other developing countries, as
opposed to 55.9 million (48%), who moved to developed countries, and only 1.5 million (1,3%) who migrated to
countries with economies in transition.18 It is thus fundamental to consider the impacts of migrations on developing
countries, both in the condition as being countries of origin, and as destination countries for migrants.
800
700
600
500
400
300
200
100
02006
114
615
720
2007 2008 2009 2010 2011
Source: DAPP/FGV based on MTE data.
27
Any public policy concerned with immigration has to take into account economic, social and political impacts from
the perspective of the population of the countries of origin and the destination countries, as well as the perspective
of migrant populations themselves.19 Moreover, even though we are looking at immigration policies in relation to
their role in attracting skilled immigrants for the purposes of national socio-economic development, it is important
to highlight once again the need not to lose sight of issues such as guaranteeing human rights, the harmonious
integration of immigrant populations, and the maintenance of national security. It is fundamental that there be
effective mechanisms to monitor and control the entrance and departure of foreigners, as well as analyses and
projections about the impacts of immigration, as a necessary foundation for drafting any immigration administration
policies.
2.2 MIGRATIONS PUBLIC POLICIES AND THE BRAIN DRAIN
• There is growing demand and competition for talent in the international labor market.
• In Brazil there is an effective risk, represented by the ‘brain drain, which needs to be undermined by
the drafting of efficient public policies, with the objective of creating, attracting and guaranteeing the
permanence of highly skilled labor.
• The capacity to create, attract and retain talent, in accordance with a national development strategy,
with the aim of increasing productivity and increasing the valve of national production through
innovation processes, is one of the principal factors which determines the success of a country in the
contemporary world.
• Brazil now has relatively balanced flows of the entrance and departure of highly skilled people, a fact
that facilitates the construction of social networks and the transfer of technology.
• While Brazil currently enjoys exceptional conditions to draft public policies to attract skilled
immigrants, there is a very high risk associated with political inertia in relation to the question, since
the country does not have a sufficient amount of highly skilled professionals, taking into account the
need to maintain and strengthen its social welfare structure.
• Throughout the world, the demand for foreign workers principally occurs at the two extremes of
professional qualification, highly and poorly skilled immigrants. In Brazil there is a prevalence and
tendency to increase the number of iimmigrants with average qualifications, in other words, those
with between 9 and 15 years of study.
• Given this scenario, the government of Brazil has to assume a strategic position and to prepare
effective policies to attract and retain skilled immigrants, especially in areas that are strategic for
national development, and in which there is a lack of professionals with adequate skills.
SUMMARY
28
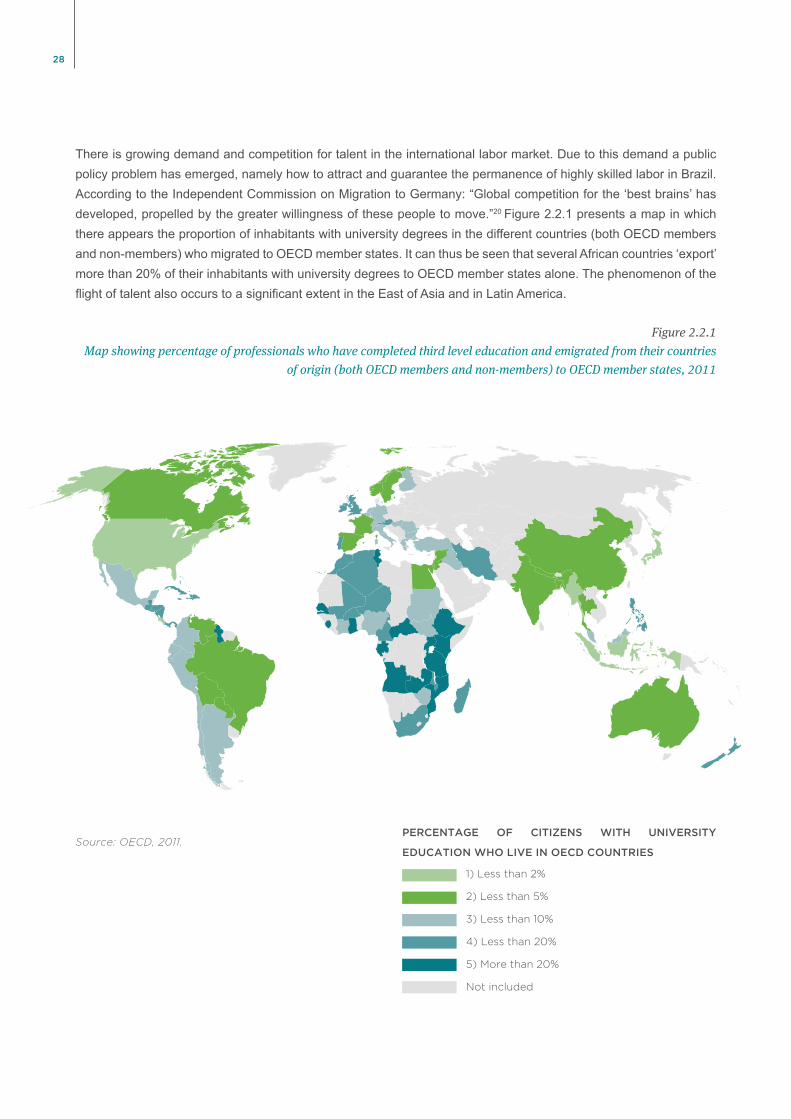
There is growing demand and competition for talent in the international labor market. Due to this demand a public policy problem has emerged, namely how to attract and guarantee the permanence of highly skilled labor in Brazil. According to the Independent Commission on Migration to Germany: “Global competition for the ‘best brains’ has developed, propelled by the greater willingness of these people to move.”20 Figure 2.2.1 presents a map in which there appears the proportion of inhabitants with university degrees in the different countries (both OECD members and non-members) who migrated to OECD member states. It can thus be seen that several African countries ‘export’ more than 20% of their inhabitants with university degrees to OECD member states alone. The phenomenon of the flight of talent also occurs to a significant extent in the East of Asia and in Latin America.
Figure 2.2.1
Map showing percentage of professionals who have completed third level education and emigrated from their countries
of origin (both OECD members and non-members) to OECD member states, 2011
Source: OECD, 2011.PERCENTAGE OF CITIZENS WITH UNIVERSITY
EDUCATION WHO LIVE IN OECD COUNTRIES
1) Less than 2%
2) Less than 5%
3) Less than 10%
4) Less than 20%
5) More than 20%
Not included

29
According to Goza, from 1996 to 2006 the emigration of skilled Brazilians to the United States increased by 185%.
Also according to the data collected by this author, from 1990 to 2000 the proportion of Brazilians who had completed
third level education living in Europe, Asia and North America increased by 94.11%. According to Accioly, this data
principally refers to professionals who have already graduated and who qualified in Brazil, or who graduated abroad,
returned to Brazil and emigrated later.21 This information needs to be broken down in order not only to count university
graduates, but also technicians in strategic areas and researchers with advanced scientific qualifications, different skill
profiles, and the effective impact of the departure of these people.
To refine our analysis, it is necessary to comprehend key concepts used in the literature about policies for attracting
skilled immigrants, such as: brain drain, brain waste, brain gain, and brain circulation. However, more than anything,
it is necessary to precisely define the concept of highly skilled labor. According to Accioly (2009):
“[...] High Skilled workers are considered to be individuals with education of at least 16 years. In other words, a
complete graduation which includes various professionals with bachelor’s degrees: scientists, administrators,
accountants, engineers, amongst others. While Less Skilled workers are those with educations of less than 16 years,
which can include occupations with very heterogeneous levels of education, including technicians, police officers,
treasurers, and secretaries, or waiters, salespersons, mechanics and drivers, even building workers22.”
In this paper we use three categories for foreign labor, based on the education of the worker and the date of reference when the work
visawasissuedbytheMinistryofLaborandEmployment(MinistryofLaborandEmployment),namely:lowlevelofeducation,
covering foreign workers with up to eight years of study, or who at the most have completed fundamental education; average level
of education, for foreign workers with 9 - 15 years of study, or from those who have incomplete second level to those who have
started a post-graduate course; and high level of education, indicating foreign workers who have 16 years of study or more, in
other words from a complete post-graduate course to those who are studying for or have completed a masters degree or doctorate.
A special focus was created to identify foreign workers with very high levels of education, considered those with 17 years of study
or more. In the analyses in which we used data from the 2010 Census, three categories were created to capture the skill profiles of
immigrants in Brazil, based on the highest academic qualifications acquired by the immigrant, namely not-graduated, graduates,
and masters/doctors. Although it is useful for the purposes of this study, this construct is based on simplified evidence, since some
of the most disputed professionals in the international market need only technical knowledge, and do not depend on a third level
education, such as information and communication technology (ICT) technicians and welders for the shipbuilding industry.
The expression brain drain23 was coined by the Royal Society to describe the flow of scientists and technicians to the
US from the 1920s onwards.24 After policies aimed at attracting skilled labor were implemented in various developed
countries, the term came to be widely related to the departure of professionals with high academic qualifications from
developing countries for the more developed countries. For the `brain drain` concept to be applied, the amount of
migrants has to be large enough for there to occur negative impacts on the economy of the country of origin.
“The occurrence of this phenomenon is generally related to negative consequences for migrants’ countries
of origin – especially in developing countries –, as it results in the loss of productive capacity, innovative
capacity and scientific weakness.”25

30
In a recent debate, Dr. Michiu Kaku, a theoretical physicist famous for being the co-author of string field theory, created
controversy when he stated in a public debate, that Visa H-1B, granted by the American government with the purpose
of the temporary hiring of foreigners with great knowledge in determined areas of specialty, is the ‘secret weapon’ of
the US educational system, without which the US economy would be at risk of collapsing since the scientific production
of researchers with a foreign origin should be seen as the “engine of prosperity.”26 According to Borjas and Friedberg:
“Another important policy change that took place during the 1990s was the expansion, most notably
in the late 1990s, of the H-1B visa program. H-1Bs are temporary, employer-sponsored visas for college
graduates who work in “specialty”occupations. In 2001, 58% of H-1B visa holders were in computer-
related occupations, with another 12% in engineering and architecture. Over 40% had at least a Masters
degree, and half of them were from India. An H- 1B visa can be renewed for up to six years, and people on
H-1Bs can apply to remain in the U.S. permanently.”27
Figure 2.2.1 shows the number of admissions of H-1B visas between 1989 and 2004. In 1985, 47,322 work visas were
granted to temporary highly skilled workers. After the Immigration Act this number increased to around 100,000. In
1996 the amount increased again, this time to 144,548. Following the 1998 American Competitiveness and Workforce
Improvement Act, the number rose to 240,947. In 2000 the number of H-1B was above 355,000.
Figure 2.2.1
Historic series of number of H-1B visas granted by the US government, 1989-2004
Source: INS Statistical Yearbook, 1996 e 1999; U.S. Department of Homeland Security,
Office of Immigration Statistics Yearbook apud Borjas e Friedberg.
500.000
400.000
300.000
200.000
100.000
0
1989 1990 1991 1992 1993 1994 1995 1996 1998 1999 2000 2001 2002 2003 2004
Year
Nu
mb
er
of
H1-
B V
isas

31
Governments can do much to undermine the problems caused by ‘brain drain,’ especially by policies in the areas of
Science, Technology and Innovation (CT&I). It is known that developing centers of excellence for scientific research
and creating conditions for innovation and entrepreneurialism are some of the measures which can make a country
attractive for a highly skilled population, whether of a national or foreign origin. The United Kingdom, for example,
plans to increase the salaries of post-doctors by 25% and to increase funds for hiring university professors. In France
more than 7,000 professor-researcher positions have been created since 1997 to retain talent and to encourage the
return of post-doctors working abroad.28
The risk of brain drain is effective. However, countries can create opportunities for research, innovation and
entrepreneurialism at home to stimulate the return of migrants, thereby wining access to international innovation
networks. According to Straubhaar:
“The creation of human capital faces a number of problems, not least of which is the fact that subsidy of
human capital production can lead to subsidy of other countries if the highly skilled emigrate. Thus, the result
arises that, in order to keep and accumulate human capital, countries have to make themselves attractive to
the highly skilled in terms of openness to innovation, strong links between research and industry, openness
to foreigners, a flexible system and low taxes etc. These man-made political factors of relative attractiveness
complement natural elements, like clean air and water, that are considered attractive by the highly skilled,
who can choose their place of residence by maximising the return on their human capital investments.”
“Therefore, attractiveness plays a large role in the accumulation of human capital. It does start with a high
standard ambitious education system. But this first step is not enough. Education needs to be supported by
the existence of factors that will hold the highly educated and attract the highly skilled from other areas/
countries”.29
Public migration policies should reinforce the role of migrants who return to their countries of origin in stimulating
socioeconomic development. According to the 2010 report of the International Migration Organization:
“[...] Participants recognized that return migration in its variety of forms has the potential, under certain
conditions and circumstances, to contribute to development. Returnees participate in their home country’s
development by bringing skills, know-how and technology they have developed or acquired abroad, and
financial capital they have accrued in the forms of savings or social benefits. Some create entrepreneurial
projects, sometimes backed by investments and professional, academic and social networks.”30
In Brazil some very interesting policies were created with the aim of ensuring the return of students after they
qualified abroad. The principal measure adopted was the implementation of the so-called Sandwich Grants, which
stipulate that the time spent abroad should be complemented by a period of studies in Brazil in which the students
have to remain linked to the institution which mediated the financing of their studies with the responsible public
agency.
Brain gain is the name given to the positive effects of skilled migration, both for the destination country and the
migrant’s country of origin. For the country which receives the migrant, the benefits are evident, and expressed in
the incorporation of their skills and experience in the local labor market. Among the possible benefits that the country

32
of origin can obtain, we can mention the following: increase in capital remittances (sent by workers abroad to their
families), increase in commercial exchanges with the destination country and increased rates of foreign investment.
Furthermore, as has already been mentioned, in regards to their eventual return, emigrants bring with them new
knowledge and professional experiences.
It is known that emigrants can stimulate trade between countries and increase the propensity to invest in their countries
of origin, as shown by the experience of immigrants from Taiwan, India and China, who created hi-tech companies in
Silicon Valley.31
Recently the Brazilian government has been investing massively in study grants for Brazilians in foreign
universities in the Science without Frontiers Program. 75,000 grants will be awarded up to 2015, including not
just grants for Brazilians abroad, but also grants for young scientists of great talent (860 grants) and special
visiting researchers (390 grants) interested in coming to Brazil. Without a doubt these efforts will be fundamental
for the socio-economic development of Brazil, though they need to be complemented with a set of initiatives
aimed at increasing the number of grants for foreigners interested in living in Brazil and attracting Brazilians
qualified abroad back to the country, even if only in the long term.
According to Coentro, there is an important cleavage among two public policy matrices for the attraction and admission
of skilled labor. The first is concerned with the demand of companies for specialized labor, and the second, the offer of
this labor at the global level.32 The first matrix for admission policies for skill immigrants is based on demand, and is
centered on the action of employers. In this system, employers are responsible for requesting from the government the
hiring of skilled immigrants, as well as for proving to the relevant governmental agencies the non-existence of these
skills in the internal labor market.33 For obvious reason this system results in high levels of immigrant employability,
as well as being quite dynamic as it involves the participation of private enterprise.
The second matrix of migration policies for the admission of skilled immigrants is based on the global offer of labor, not
always taking into account the availability of labor or the exact location of skill deficits in the internal market. In this
system foreign workers complete a questionnaire on the basis of which they will be assigned points in accordance with
their educational and technical qualifications. Admission criteria to the country depend on this score. This system,
based on offer, assumes the need that the individuals have education, skills, and sufficient knowledge of the country’s
language, so that they can create economic and social benefits for the country that receives them.34 Skilled immigrants
authorized to enter the country do not always directly correspond to the needs of the labor market and in this way can
face difficulties in finding employment.35
The offer based system can facilitate a focus on the integration of the immigrant, as well as allowing the emergence of
evolving development strategies, which are a priori unpredictable, through the increase of national critical mass. Also
present in texts about migratory flows, the concept of brain waste is based on the evaluation of the immigrants being
able to work in areas related to their technical or theoretical knowledge in the destination country. In cases where
immigrants are underused in relation to their qualification in the destination country, they come to be considered as
cases of ‘brain waste.’ In these cases, both the country of origin and the destination country do not benefit from their
knowledge. In practice most of the successful immigration administration systems are based on the composition of
elements from both public matrices (focus on demand and on supply).

33
The consequences of brain drain are, for obvious reasons, higher in developing countries. Generally speaking, it
is assumed that migrants from developing countries have a greater propensity to remain in host countries that are
developed. In the case of the migration of scientists between developed countries, what almost always occurs is what
is conventionally called brain circulation, characterized by constant reallocation which allows different countries
to overcome specific qualification deficits through the circulation of professionals. Research about the number of
foreign doctoral students in the science and technology areas in the USA shows that 79% of graduates from India
and 88% of those from China in 1990-91 were still working in the US in 1995. In contrast only 11% of Koreans and
15% of Japanese who got degrees in the sciences and engineering in 1990-91 were still working in the US in 1995.36
The international mobility of skilled workers can generate benefits through the improvement of flows of knowledge
and a dynamic of complementary equilibrium between demands for skills and specific knowledge.
Although the contribution of skilled foreign workers to the economic growth of their countries of origin is being
increasingly recognized, it is also necessary to bear in mind that only a few countries have been successful in
attracting talented emigrants back again. iOM estimated that 300,000 highly qualified professionals from Africa live
and work outside the continent, especially in Europe and North America. According to estimates, around one third
of professionals qualified in research and development in developing countries live in OECD countries.37
The available data about the migration of highly skilled workers is incomplete and difficult to compare,
nonetheless it is possible to comprehend from the available sources that during the 1990s there was an increase
in the migration of skilled labor, especially from Asian countries, to countries such as the US, Canada, Australia
and the United Kingdom. This increase was allowed by the existence of selective immigration policies in favor
of highly skilled immigrants, especially in areas linked to science, technology and innovation, with information
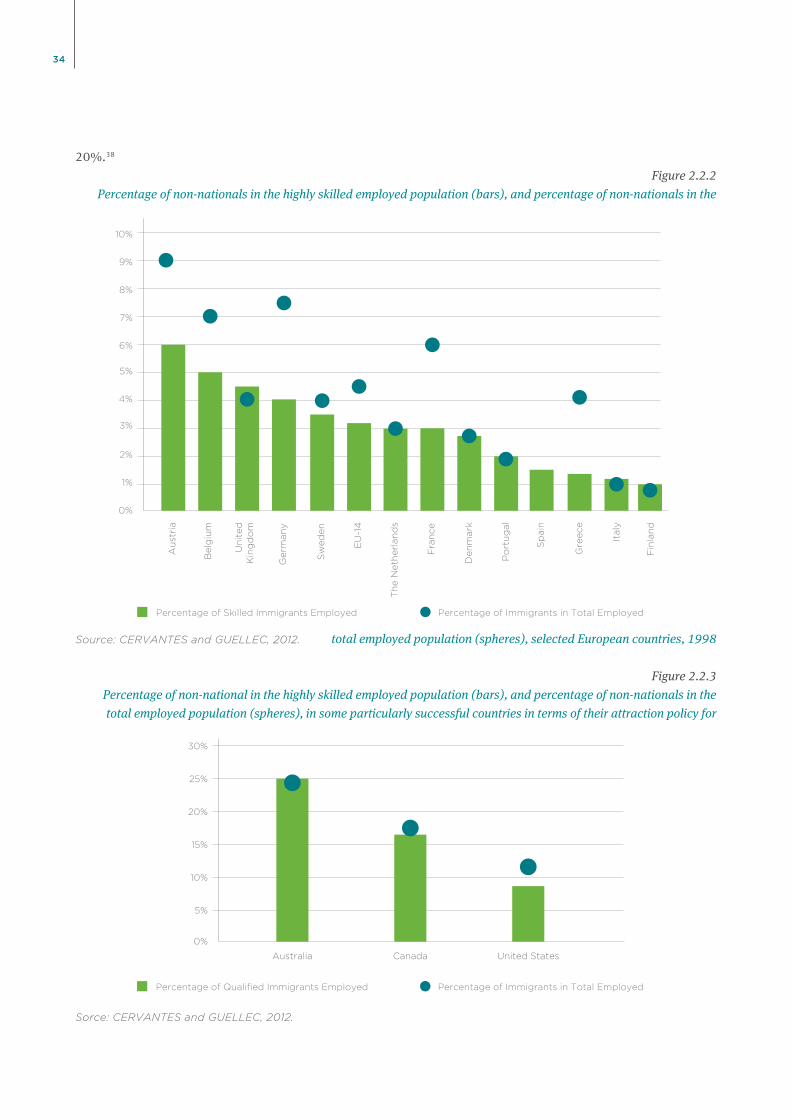
technology being particularly important from the 1990s onwards. Figures 2.2.2 and 2.2.3, found in Cervantes
and Guellec’s text, show the percentage of non-nationals in the highly skilled population (bars), and the
percentage of non-nationals in the total employed populations (spheres).
Among the European countries, Austria, Germany, France and Belgium stand out for having a great difference
in the ratio between the low number of highly skilled foreigner professionals in comparison with the total
proportion of foreigners holding positions in the labor market. It can also be noted that countries such as
Australia, the United Kingdom and Canada, to the contrary of countries such as France and Germany, seem to
attract similar proportions of highly skilled professionals and total employed in relation to the composition of
their labor markets, which indicates a very balanced immigration policy. Nevertheless, it can be argued that
this results, at least in part, from the fact that these countries possess, due to their geographic and geopolitical
position, better objective conditions for controlling their borders. In Australia approximately 25% of its
productive force who are classified as highly skilled are foreigners, followed by Canada, with approximately
34
20%.38
Figure 2.2.2
Percentage of non-nationals in the highly skilled employed population (bars), and percentage of non-nationals in the
total employed population (spheres), selected European countries, 1998
Figure 2.2.3
Percentage of non-national in the highly skilled employed population (bars), and percentage of non-nationals in the
total employed population (spheres), in some particularly successful countries in terms of their attraction policy for
Sorce: CERVANTES and GUELLEC, 2012.
Source: CERVANTES and GUELLEC, 2012.
5%
4%
3%
2%
1%
10%
9%
8%
7%
6%
0%
10%
5%
25%
30%
20%
15%
0%
Percentage of Skilled Immigrants Employed Percentage of Immigrants in Total Employed
Percentage of Qualified Immigrants Employed Percentage of Immigrants in Total Employed
Au
stri
a
Belg
ium
Un
ited
K
ing
do
m
Germ
an
y
Sw
ed
en
EU
-14
Th
e N
eth
erl
an
ds
Fra
nce
Den
mark
Po
rtu
gal
Sp
ain
Gre
ece
Italy
Fin
lan
d
Australia Canada United States

35
skilled immigrants, 2011
In absolute numbers the US is the greatest center of attraction of skilled foreign workers, with 40% of its enormous
adult population with a foreign origin having third level education. However, when we look solely at the permanent
visas granted for economic reasons (as opposed to kinship reasons), we can see that Australia and Canada have
considerably more aggressive policies. In part this is due to the importance of the temporary H-1B visa in the US
recruitment strategy. According to a recent report in The Economist, policies of countries such as Canada, Australia,
Great Britain, New Zealand and even Chile have a greater focus than the US in attracting entrepreneurs. According to
Figure 2.2.4, in recent decades, Canada has presented an impressive increase in the proportion of visas granted for
economic reasons in relation to the total number of visas. Between 1991 and 2011, this proportion rose from 18% to
67%, while in the US it fell from 18% to 13%.39
Figure 2.2.4
Historic series of the percentage of permanent visas granted for economic reasons by the governments of Australia,
Canada and the US, 1991-2011
Canadian immigration policy has been particularly aggressive and successful, consisting in encouraging in plural
forms the entrance of skilled labor into the country. Skilled foreign labor is extremely valorized by the Canadian
government which has established the so-called ‘points system’ as part of the Federal Skilled Worker Program, intended
to de-bureaucratize entrance to the country. This system classifies candidates for future Canadian citizens according
to criteria which run from education, knowledge of English or French, and previous work experience. Moreover,
applicants have to prove that they have sufficient money to sustain themselves and their families. Only after complying
with these requirements can foreigners get a permanent visa. Companies based in Canada also actively participate in
the attraction of highly qualified immigrants, recruiting, partially through letters of invitation, talent from the most
varied parts of the world.
Source: The Economist, 2012.
50
60
70
80
40
30
20
10
0
1991 2001 2011
Australia
Canada
United States

36
Table 2.2.1 analyzes, in accordance with OECD figures, non-selective migrations in some OECD countries in 2003. The
first axis analyses the amount of permanent immigration the country receives, with the United States being in first place
among the selected countries, i.e., the one which receives most permanent migrants, followed by the United Kingdom,
Canada, France, and much below Switzerland and Sweden. The table also shows the percentage of permanent migration
caused by discretionary policies on the part of the state; and also if the migration is accepted for humanitarian or family
reasons (such as the taking in of political refuges or persons fleeing natural catastrophes, or migration motivated by
kinship), or simply the free circulation of people, without control. In Switzerland and Sweden the percentage of non-
discretionary migration is above ninety percent, followed by France, with 83%. The other countries analyzed have
lower percentages, with the lowest being Canada, with 28%, all of which is due to humanitarian or kinship reasons.
Total Permanent
Immigration
(thousands)
Amount
Non-Discretionary
(percentage)
Components
Family + Humanitarian
(percentage)
Free Circulation
(percentage)
Canada 221 28 28 -
US 706 39 39 -
France 173 83 61 21
United Kingdom 244 49 23 25
Sweden 41 95 73 22
Switzerland 82 94 31 63
Table 2.2.1
Non-Discretionary Migration in Selected OECD Countries, 2003
Interesting research carried out using data from the National Bureau of Economic Research of the United States offers
an approximate vision of which countries ‘export’ their talents and which benefit from the immigration of scientists. The
data was obtained from a survey involving a questionnaire given to 47,304 scientists from 16 countries, who published in
selected journals in the areas of biology, chemistry, earth sciences and environmental sciences in 2011, of whom 17,182
sent sufficient responses to determine if they were immigrants, their countries of origin and destination countries. Each
of them was asked about where they were currently living, the country they had lived in until they were 18, if they had
worked abroad previously, and their reasons for moving. According to the data produced in this research, among the
countries researched Switzerland was the one with the greatest proportion of scientists with a foreign origin, followed by
Canada and Australia. India was the country with the lowest percentage, followed by Italy and Japan. India was also the
greatest victim of “brain drain.”40
Source: OECD (2006). The total data for permanent immigration is harmonized in accordance
with OECD methodology, the numbers may thus differ from the official numbers provided by each
of the different countries mentioned.

37
Figure 2.2.5
Percentage of 17,182 scientists from the 16 countries researched, who published in selected journals in the areas of
biology, chemistry, earth sciences and environmental sciences, who emigrated from, and immigrated to,
each of the countries, 2011
Figure 2.2.6
Total numbers, among 17,182 scientists from the 16 countries researched, who published in selected journals in the areas of
biology, chemistry, earth sciences and environmental sciences, who emigrated from, and immigrated to,
each of the countries,2011
500
2000
1500
1000
280
46
423187
69
45
275
96
89
396
274
1.735
146
118239
50
57 145 172
292 321
7658
24
314
31
454
85 87
5299
500
0
Source: United States National Bureau of Economic Research, apud GIBNEY, 2012.
Source: United States National Bureau of Economic Research, apud GIBNEY, 2012.
20
40
60
80
60
40
45
18
4757
33
22 2328
26
33
25
38
5
38
17
7
22 24
13
23
40
18
8 13 1614
13 57
3 8
20
0
Pe
rce
nta
ge
Nu
mb
er
of
Scie
nti
sts
Percentage of foreigner researchers Percentage of native researchers living abroad
Percentage of foreigner researchers Percentage of native researchers living abroad
Au
stra
lia
Belg
ium
Un
ited
K
ing
do
m
Germ
an
y
Sw
ed
en
Th
e N
eth
erl
an
ds
Fra
nce
Den
mark
Bra
zil
Can
ad
a
Ind
ia
Italy
Jap
an
Sp
ain
Sw
itzerl
an
d
Un
ited
Sta
tes
Au
stra
lia
Belg
ium
Un
ited
K
ing
do
m
Germ
an
y
Sw
ed
en
Th
e N
eth
erl
an
ds
Fra
nce
Den
mark
Bra
zil
Can
ad
a
Ind
ia
Italy
Jap
an
Sap
in
Sw
itzerl
an
d
Un
ited
Sta
tes
38
Analyzing the total numbers produced in the research, the importance of the United States as a center of attraction
for highly qualified scientists is even more clear. To a great extent this is due to the excellence of its universities and
public policies, both selective and aimed at attracting skilled foreigners. The country which lost most in its intellectual
production capacity is India. Among the respondents, India lost last year 321 high yielding researchers, while it
received only four, and is thus a clear victim of ‘brain drain.’ In relation to Brazil, Fernandes and Diniz’ comment is
relevant:
“It is clear that we are witnessing two conflicting tendencies in terms of international migration. On the
one hand, Brazil functions as a country of emigrants, sending thousands of skilled workers abroad and
thus suffers from ‘brain drain.’ On the other hand, there is a contrary movement, marked by the increasing
arrival of immigrants with increasing levels of qualifications; a fact which makes Brazil a country which
benefits from “brain gain.” This tendency becomes even more relevant with highly education Brazilians
returning from abroad are taken into account.
This conflicting situation can actually indicate a growing insertion of Brazil in the global economy, with
the entrances and departures of highly skilled persons mutually cancelling each other. At the same time
the impact of these exchanges in terms of development for the country can be very positive, facilitating the
construction of social networks and the transfer of technology.”41
Countries such as Germany and France have sought to create policies to attract foreign students, researchers and
workers in the technical and scientific area. In 2000 Germany launched a type of ‘green-card’ scheme (as the temporary
German work visa, similar to the US H-1B, is called) to recruit 20,000 foreigners specialized in IT, and at the end of the
following year they had already contracted half of this number, principally from Eastern Europe. In addition, dynamic
Asian economies, such as Singapore have tried to meet their demand for IT professionals through immigrants from
neighboring countries, such as Malaysia and China.42
In Coentro’s study there are three principal factors which, according to Chiswick, explain the increase of the demand
for skilled workers by developed countries in the last 50 years.43 For this author the first factor is related to the
informational technology and computer revolutions, which gained scale and substance in the 1980s and 1990s. The
second is associated with the globalization of the economy which demanded new professional qualifications to meet
the necessities of new international business. The third explanatory factor for the increase in the demand for skilled
laborwaslinkedtotheneedtocompensatetheentranceofagrowingnumberoflowlyskilledimmigrantsfromLatin
America, Africa and the Middle East into developed countries.
It can be said that Brazil is among the countries which to some extent suffer from “brain drain.” It is reasonable to
assume that the country’s increased investment in ST&I should lead to a growing enticement of national skilled labor.
CoentroalsocitesarecentstudyfromtheSistemaEconômicoLatino-AmericanoedoCaribe(SELA–LatinAmerican
and Caribbean Economic System), according to which the increase in the contingent of skilled emigrants in the world
rose from 12.2 million in 1990 to 25.8 million in 2007 (an increase of 111%). According to the same study, the rate
of emigration of the skilled population around the world was around 5.6% in 2007 (against 5.0% in 1990). In the
Braziliancase,in2007thecountryhadaskillednativepopulation(accordingtoSELAcriteria)ofaround9.5million
people and a skilled emigration rate of 2.3%. Although it has a rate lower than the global rate (of 5.6%), it also needs
to be noted that the number of skilled emigrants with a Brazilian origin destined for OECD countries rose by 41.4%

39
between 2000 and 2007, while the skilled native population rose by only 24.6% during the same period. In other
words, according to this data, a considerable evolution in the proportion of skilled Brazilian emigrants can be found
in relation to the total number of skilled Brazilians.44 In this way, we can link the relative optimism of Fernandes and
Diniz to the warning of Rios-Neto:
“The literature about questions of brain drain in Brazil is scarce. (...) A word of warning is needed: the flight
of brains from Brazil could become a hot subject in the country in the next decade. This will happen to the
extent that the decline of Brazilian fertility is strongest among the families with the highest education. If the
few children from these families emigrate in large numbers in the next decade, then the young generations
entering the market will be less qualified, imposing negative productivity shocks on the labor market”45
Actually the effects of the decline of fertility among the families with the highest education mentioned by Rios-
Neto, are undermined by the formidable process of educational inclusion which is being promoted in Brazil, as well
as the process of the ascension of a ‘new C class.’ Nonetheless, it is worth stating that while it is true that Brazil is
currently enjoying exceptional conditions for the preparation of public policies to attract qualified immigrants, the risk
associated with political inertia in relation to the question is very high, since the country still does not have a sufficient
quantity of highly skilled professionals for the maintenance and strengthening of its social welfare structure. In light
of this scenario, the government should, with the utmost urgency, assume a strategic position. Viable solutions for
this problem exist, many of which involve investing in education and guaranteeing the ‘counter- balancing’ of the
departure of Brazilian talent through the attraction of foreign talents, producing a adjustment in the ‘brain market’
which allows the filling of the professional deficits in the country, i.e., it will work in such a way to transform ‘brain
drain’ into the ‘circulation of brains.’
Coentro highlights the importance of some definitions. According to the definition contained in the UN report, migrants
are considered to be those who are living outside their countries of origin for more than a year, whether or not there is
an intention of permanence, thereby also including temporary workers.46 The report in question points to some of the
important characteristics of contemporary migratory flows, which we should take into account in the contextualization
of the following analyses, namely: i) in receiving countries the demand for foreign workers occurs more strongly at the
two extremes of professional qualifications, i.e., highly skilled individuals and people with low skills; ii) the majority
of migrants are youths or young adults aged between 15 and 30; iii) the United States is the principal destination
country for international migrants; iv) the average level of education of immigrants is usually higher than the average
education level of their countries of origin, which helps us to reaffirm the importance of the phenomenon of ‘brain
drain.’47
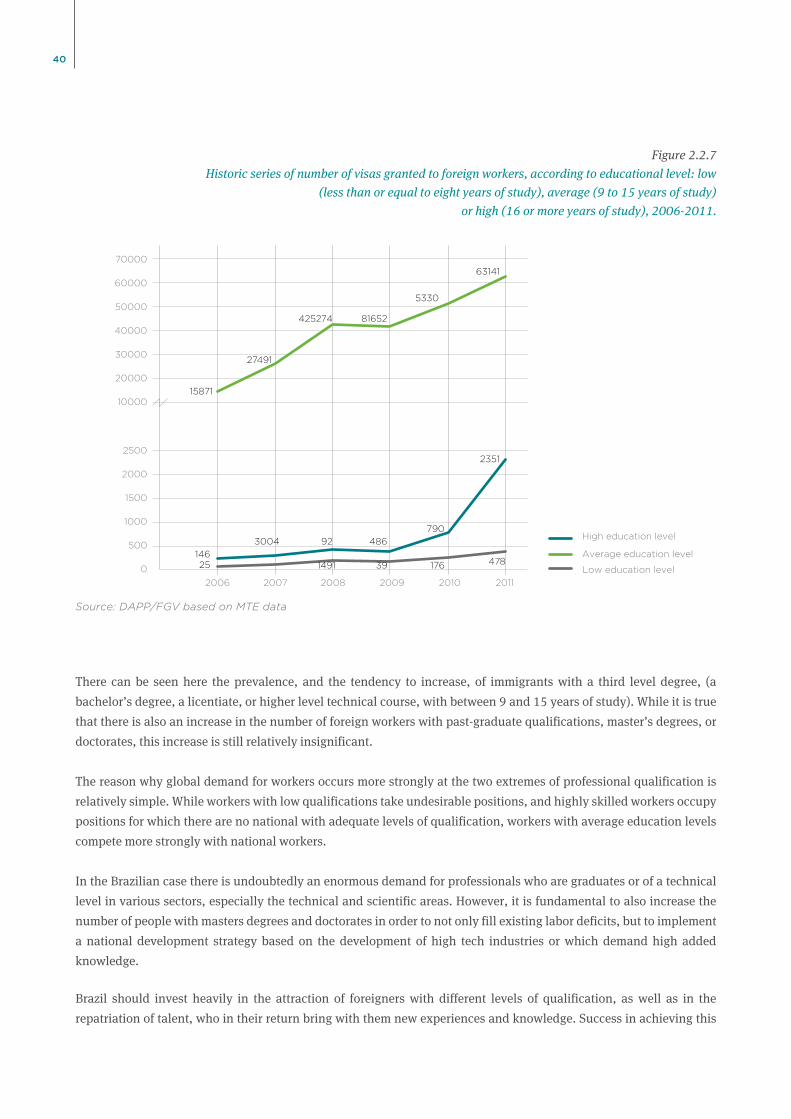
According to a classification based on three levels – low (less than or equal to eight years of study), average (nine
to fifteen years of study) or high (16 or more years of study) –, we can see than in Brazil the highest growth took
place among immigrants located at the center of the spectrum of professional qualifications. In accordance with Figure
2.2.7,preparedusingdatafromtheMinistryofLaborandEmployment,thenumberofimmigrantsinBrazilwithonly
undergraduate degrees has grown enormously. It can be seen in the figure that in 2006, 16,042 foreign workers were
granted visas. Until 2010 this number grew repeatedly until it reached the level of 42,277, declining slightly in 2008
and 2009.
40
Figure 2.2.7
Historic series of number of visas granted to foreign workers, according to educational level: low
(less than or equal to eight years of study), average (9 to 15 years of study)
or high (16 or more years of study), 2006-2011.
There can be seen here the prevalence, and the tendency to increase, of immigrants with a third level degree, (a
bachelor’s degree, a licentiate, or higher level technical course, with between 9 and 15 years of study). While it is true
that there is also an increase in the number of foreign workers with past-graduate qualifications, master’s degrees, or
doctorates, this increase is still relatively insignificant.
The reason why global demand for workers occurs more strongly at the two extremes of professional qualification is
relatively simple. While workers with low qualifications take undesirable positions, and highly skilled workers occupy
positions for which there are no national with adequate levels of qualification, workers with average education levels
compete more strongly with national workers.
In the Brazilian case there is undoubtedly an enormous demand for professionals who are graduates or of a technical
level in various sectors, especially the technical and scientific areas. However, it is fundamental to also increase the
number of people with masters degrees and doctorates in order to not only fill existing labor deficits, but to implement
a national development strategy based on the development of high tech industries or which demand high added
knowledge.
Brazil should invest heavily in the attraction of foreigners with different levels of qualification, as well as in the
repatriation of talent, who in their return bring with them new experiences and knowledge. Success in achieving this
Source: DAPP/FGV based on MTE data
2500
2000
1500
1000
500
40000
30000
60000
70000
50000
20000
10000
0
2006 2009 20102007 2008 2011
25146
3004 92 486
1491 39
790
2351
15871
27491
425274 81652
5330
63141
176 478
High education level
Average education level
Low education level
41
objective depends on great investment in science and technology and in the creation of infrastructure to increase
production and innovation through the entrance of foreigners and the return of expatriates to the country, offering
them research institutions and labor market opportunities suited to their qualifications – there should also be a specific
concern with creating paths of integration between academia and dynamic sectors of the economy, for the benefit of
both and to allow the emergence of a stimulating and attractive environment for the most skilled professionals. In
order to optimize the presence of foreign workers in the country, temporary work programs can be created for skilled
foreigners, associated with the transfer of skills and knowledge, as well as creating mechanisms which allow skilled
immigrants to be retained. The relatively positive situation of the Brazilian economy will help in the promotion of a
national policy for attracting skilled immigrants.
2.3 THE NEED FOR PUBLIC IMMIGRATION POLICIES IN BRAZIL FOR SKILLED WORKERS: DEMOGRAPHIC ASPECTS
• Brazil has the chance, for approximately a generation, to benefit from the ‘demographic bonus.’
• This favors economic development. However, for this development to be sustainable in the long term, it is
necessary that there be large-scale investment in education and innovation, as a basis to create the gains
in productivity necessary for the future support of the social insurance system.
• With the fall in birth rates, the question of immigration should be of increasing importance on the
national agenda.
• Public policies must be urgently drafted to take advantage of the opportune coincidence between
the momentum of the Brazilian population in the demographic transition process and the fact that
Brazil has become increasingly attractive for migrants from all over the world.
SUMMARY
The global economic crisis that erupted in 2008 had a direct impact on the unemployment rates in the central countries,
principally the US, Japan, and the Western Europe nations. In 2006 the US had an unemployment rate of 4.4%, with
the crisis this number rose to 8.3% in 2012.48 In Brazil the effects of the crisis were comparatively reduced and short
lasting, with the unemployment rate having fallen from 8.4% to 4.7% in 2011.49 The reconfiguration of the global
political and economic context, associated with the lack of labor observed in various segments of national industry,
explains the flow of foreigners interested in working in the country. In 2006, the number of foreigners formally
authorized to work in Brazil was 25,500. In 2011 this jumped to 70,000. Moreover, the long term ageing tendency for
the Brazilian population is obvious, highlighting the possibility of future problems for sustaining and strengthening
the structure of the Brazilian social welfare system. At the moment the majority of the population is located in the age
group that is considered economically active (around 70% of the total of the population is in the age group between
15 and 64). We will now look in greater detail at the ageing cycle of a population, inserted in which is the concept of
demographic transition.
42
This cycle has as an initial state a population with high gross birth and mortality rates and consequently low vegetative
growth (the difference between the gross birth rate and the gross mortality rate). At a second moment, a progressive
reduction in the mortality rate is observed, accompanied by the maintenance of high birth rates, producing a constant
increase in population growth, and the resulting prevalence of a young population. The effective reversal begins with
the decline of birth rates, producing a reduction of the rate of population growth and, due to the high birth rates of
previous periods, a proportional increase in population at an active age can be observed. Finally, birth and mortality
rates remain low and population growth is gradually reduced until it is zero, or even negative, creating an increase
in the proportion of elderly in the population, with the proportion of children, and of the population at an active age,
being considerably reduced.50
According to an IBGE study (2009), transformation in the demographic pattern of the age structure of Brazil started to
occur from the 1940s onward, when a consistent decline was noted in the general levels of mortality, which were not
accompanied by a similar process in relation to the birth rate. In two decades the gross mortality rate fell to a level of 21
to 10 deaths per thousand inhabitants. In the 1960s the changes accelerated as a result of significant falls in fertility,
to such an extent that, in comparison with what was experienced by other countries, Brazil underwent one of the faster
demographic transitions in the world.
It is important to point out that the country has approximately for one generation the chance to benefit from the
‘demographic bonus’, namely the period when the active population is larger than the economically dependent
population. According to Alves:
“On the demographic side, never in the history of Brazil have the conditions been as favorable for breaking
with the vicious circle of the poverty trap. In the first half of the twenty-first century, Brazil will have a
population growing at an ever lower rate, with an increase in the proportion of people at working age and
lower dependency rates, greater female insertion in the labor market and with a growing number of men
and women with higher education levels and thus greater productive potential. The fall in child mortality
and the increase in life expectancy signify longer years of life, which can be transformed into human capital
at the service of raising the standard of living and increasing social capital.”52
In conjunction with other factors, this should favor economic development. However, for this development to be
sustainable in the long term, great investment in education and innovation is necessary, as the foundation for creating
the gains in productivity and competitiveness required for the future support of the social insurance system. When
the reversal process commences, for this investment to be allocated in an efficient form, it is also necessary that the
country will have a sufficient number of highly skilled workers in strategic areas, trained in the previous generation
and capable of leading this process of change. In this context, the attraction of highly skilled immigrants should play
a fundamental role in overcoming in the short term the deficit in the skills and knowledge required for the necessary
rapid jump in productivity, and which can in a longer period, be provided through investment in education.
Brazil is currently at the beginning of the transition, with the birth rate starting to fall and mortality rate remaining
stable. Brito et al. (2008) estimate that until 2050 the Brazilian population will increasingly age, with people above
65 reaching around 20% of the total population. In 1980 the population aged 65 and over amounted to only 4% of
the Brazilian population. Along with this, the improvement in various socio-economic indicators can be noted in areas
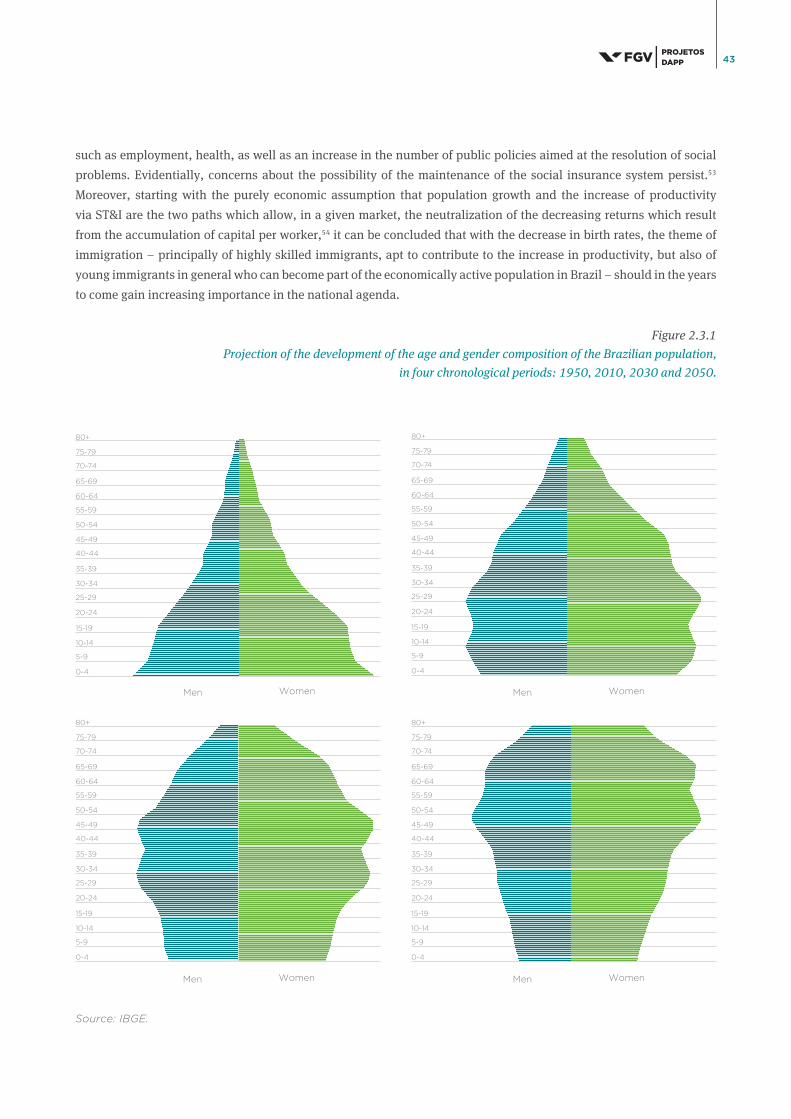
43
such as employment, health, as well as an increase in the number of public policies aimed at the resolution of social
problems. Evidentially, concerns about the possibility of the maintenance of the social insurance system persist.53
Moreover, starting with the purely economic assumption that population growth and the increase of productivity
via ST&I are the two paths which allow, in a given market, the neutralization of the decreasing returns which result
from the accumulation of capital per worker,54 it can be concluded that with the decrease in birth rates, the theme of
immigration – principally of highly skilled immigrants, apt to contribute to the increase in productivity, but also of
young immigrants in general who can become part of the economically active population in Brazil – should in the years
to come gain increasing importance in the national agenda.
Figure 2.3.1
Projection of the development of the age and gender composition of the Brazilian population,
in four chronological periods: 1950, 2010, 2030 and 2050.
Source: IBGE.
80+
75-79
70-74
65-69
60-64
55-59
50-54
45-49
40-44
35-39
30-34
25-29
20-24
15-19
10-14
5-9
0-4
80+
75-79
70-74
65-69
60-64
55-59
50-54
45-49
40-44
35-39
30-34
25-29
20-24
15-19
10-14
5-9
0-4
80+
75-79
70-74
65-69
60-64
55-59
50-54
45-49
40-44
35-39
30-34
25-29
20-24
15-19
10-14
5-9
0-4
80+
75-79
70-74
65-69
60-64
55-59
50-54
45-49
40-44
35-39
30-34
25-29
20-24
15-19
10-14
5-9
0-4
Men Women Men Women
Men Women Men Women
44
In an extract from the OIM report which describes the conference theme, the challenge is notably summarized:
“Economic cycles and demographic trends, while operating on different timescales, are both intricately
linked to migration. Migration policymakers are challenged to balance demographic, economic and
labour market considerations in their approaches to labour mobility, temporary versus permanent
migration, family and student migration, labour market access for migrants and their families – to
name but a few. The scene-setting presentation will summarize the main findings on the implications
of the last economic crisis for migration trends and patterns. It will also provide participants with an
overview of current and projected global demographic trends and some of the ways in which they may
affect migration flows. Lastly, the presentation will outline key areas for capacity-building – such as
data and statistics, labour market assessment and international cooperation – relevant to the subject
at hand”55
In the Brazilian case, public policies are urgently needed which can take advantage of the opportune coincidence
between the momentum of the Brazilian population in the demographic transition process and the fact that the country
has become ever more attractive to migrants from all over the world, due to its recent resilience to the cycle of global
economic crises, which commenced in 2008, and is also associated with the global projection which results from the
implementation of large-scale social development programs.
2.4 THE CREATION OF HUMAN CAPITAL AS A BOTTLENECK FOR DEVELOPMENT IN THE BRIC COUNTRIES (BRAZIL, RUSSIA, INDIA AND CHINA)
• The deficit in human capital constitutes an important bottleneck risk to the economic development of the
BRIC countries.
• Brazil has advanced much in recent years, but still possesses a historic deficit of adequate investment in
education.
• The attraction of highly skilled immigrants should play a fundamental role in overcoming in the short
term the deficit of adequate investment in education in previous decades.
• Brazil is a country with solid democratic institutions and relatively few political, ethnic, or religious
conflict, factors which make the country an attractive local for skilled professionals.
SUMMARY
With the economic crisis that began in 2008, the resulting increase in unemployment rates, principally in the US and Western
Europe, and the concomitant increase of the global economic importance of developing countries, especially those that are
part of the so-called BRIC group, there emerged the possibility of important alterations in migratory flows. According to John
McGurk, the four BRIC countries share some important characteristics, including rapid economic growth in the last decade
and the implementation of programs by their respective governments aimed at strengthening their competitive position
through the development of human capital.56

45
Human capital is a fundamental determinant of economic growth. Highly skilled workers increase the productive
capacity of the economy.57 Recent evidence suggests that the quality of teaching and the development of cognitive
abilities is of particular importance for the qualification of human capital and, consequently, for the economic growth
of different countries.58
InarecentarticleFoongandLimdescribe,usingtheAonHewittpeopleriskindex,59 the risks associated with the
hiring of staff or the renewal of human capital in the principal cities in the BRIC countries.60 They demonstrate that
in the last decade the BRIC countries’ share of global GDP rose, reaching 7.1%, while the IMF estimates that in 2015
this should reach 29.1%. This economic growth is shown by the Foreign Direct Investment which these countries
havebeenreceiving.Nonetheless,accordingtoFoongandLim,humancapitalisoneofthefactorsthatneedsbe
taken into account to analyze the sustainability and continuity of this growth. Their article, thus, seeks to show
the risks related to human capital in the BRIC countries. Specifically, the Aon Hewitt people risk index takes into
account the three principal risks linked to human capital, present in each of the stages of the employment cycle,
namely: recruitment risk, unemployment risk, and reallocation risk. In the article in question, only recruitment risk
is analyzed.
AccordingtoFoongandLim,Brazilhasconsiderableproblemsinrelationtoitseducationalsystem.Theseproblems
threaten to become a bottleneck for the country’s economic growth. Figure 2.4.1 presents the total risks associated
with recruitment and one of its components, the specific risks related to educational systems in the principal cities in
the BRIC group.
Figure 2.4.1
Aon Hewitt index of the risk associated with the education system (bars) and the general recruitment risk (lines) for the
principal cities in countries belonging to the BRIC group, 2011
Source: FOONG and LIM, Op. cit.
20
10
50
40
30
0
100
80
60
40
20
200
180
160
140
120
0
Risks Linked to the Education System General Recruitment Risk
Ed
ucati
on
Sy
ste
m R
isk
Beijing
Ge
ne
ral R
ecru
itme
nt R
isk
Shanghai São Paulo Rio de JaneiroMumbai Delhi Moscow St. Petersburg

46
Among the eight BRIC cities analyzed in the research, Rio de Janeiro is equal fourth with New Delhi, while São
Paulo is the fifth in the ranking of general recruitment risks. In relation to the educational system risk, Rio
de Janeiro and São Paulo are drawn in fifth place, with lower risks than the Asian cities and higher than the
Russian. Also according to the authors, the problems in the Brazilian educational system result in part from
its decentralized structure, which is expensive and inefficient, and implemented by states and municipalities,
as well as poor administration and teacher training. Moreover, the large allocation of educational investment
in the university system, to the detriment of basic education, results in the fact that most of the investment in
education is not reverted to the benefit of the part of the population who most need this investment. Here, a
counterpoint needs to be made. Aghion and Howitt, for example, suggest a distinction between different types
of expenditure with education, attributing to investment in third level education the role of increasing the
capacity of a country to generation innovations, produce up-to-date knowledge and to create productivity.61
Ardichvil, Zavyalova and Minina demonstrate that there exist significant differences among the BRIC countries, both
in the indices and in relation to their strategies of national development. While Russia and Brazil lead in the Human
Development Index (HDI) and the Knowledge Economy Index (KEI),63 as illustrated in Table 2.4.2, a more detailed
examination of the other indicators, shown in Table 2.4.3, provides a more nuanced vision which shows, for example,
the low number of scientists and engineers in Brazil.64
Table 2.4.2
Comparison of BRIC countries in accordance with the Human Development Index (HDI)
and the Knowledge Economy Index (KEI), 2012
Source: World Bank, 2009 and Human Development Bulletins
(2010) apud ARDICHVIL, ZAVYALOVA and MININA, 2012.
Programs / Factors
Countries
Brazil Russia India China
National Human Capital Development
Program+ +
Human Development Index (HDI) 0,813 0,817 0,612 0,772
Knowledge Economy Index (KEI) 5,66 5,55 3,09 4,47
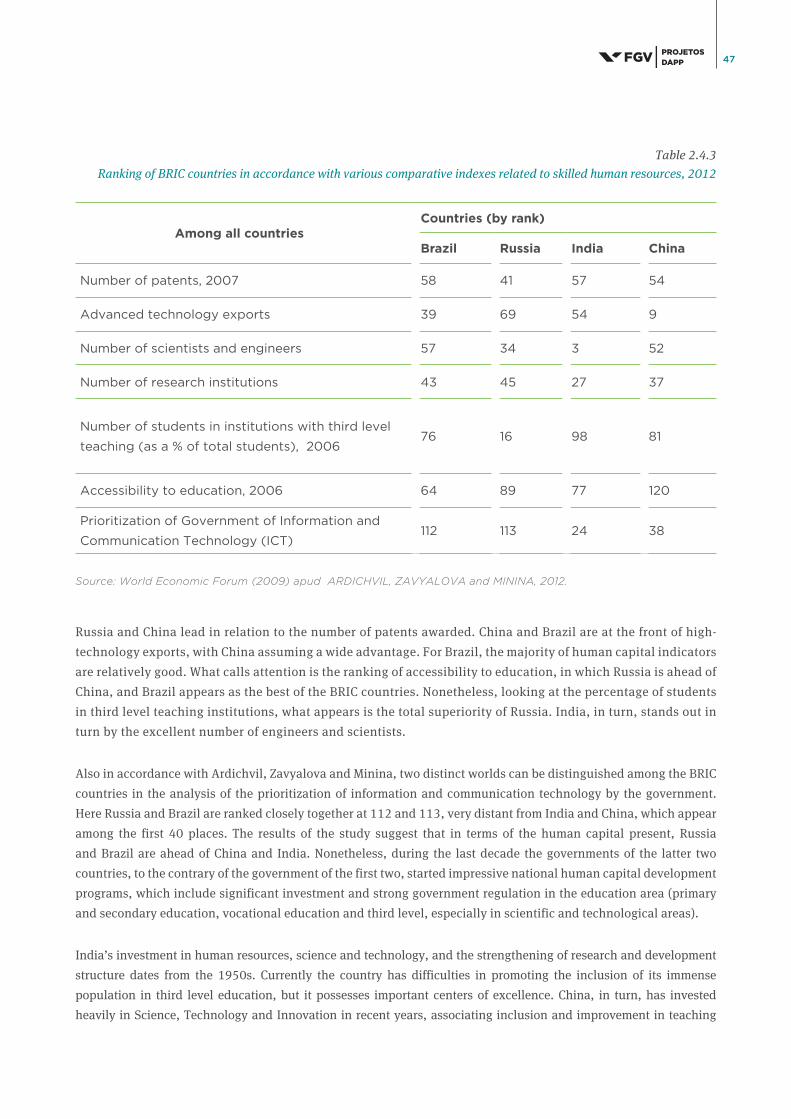
47
Table 2.4.3
Ranking of BRIC countries in accordance with various comparative indexes related to skilled human resources, 2012
Russia and China lead in relation to the number of patents awarded. China and Brazil are at the front of high-
technology exports, with China assuming a wide advantage. For Brazil, the majority of human capital indicators
are relatively good. What calls attention is the ranking of accessibility to education, in which Russia is ahead of
China, and Brazil appears as the best of the BRIC countries. Nonetheless, looking at the percentage of students
in third level teaching institutions, what appears is the total superiority of Russia. India, in turn, stands out in
turn by the excellent number of engineers and scientists.
Also in accordance with Ardichvil, Zavyalova and Minina, two distinct worlds can be distinguished among the BRIC
countries in the analysis of the prioritization of information and communication technology by the government.
Here Russia and Brazil are ranked closely together at 112 and 113, very distant from India and China, which appear
among the first 40 places. The results of the study suggest that in terms of the human capital present, Russia
and Brazil are ahead of China and India. Nonetheless, during the last decade the governments of the latter two
countries, to the contrary of the government of the first two, started impressive national human capital development
programs, which include significant investment and strong government regulation in the education area (primary
and secondary education, vocational education and third level, especially in scientific and technological areas).
India’s investment in human resources, science and technology, and the strengthening of research and development
structure dates from the 1950s. Currently the country has difficulties in promoting the inclusion of its immense
population in third level education, but it possesses important centers of excellence. China, in turn, has invested
heavily in Science, Technology and Innovation in recent years, associating inclusion and improvement in teaching
Source: World Economic Forum (2009) apud ARDICHVIL, ZAVYALOVA and MININA, 2012.
Among all countries Countries (by rank)
Brazil Russia India China
Number of patents, 2007 58 41 57 54
Advanced technology exports 39 69 54 9
Number of scientists and engineers 57 34 3 52
Number of research institutions 43 45 27 37
Number of students in institutions with third level
teaching (as a % of total students), 200676 16 98 81
Accessibility to education, 2006 64 89 77 120
Prioritization of Government of Information and
Communication Technology (ICT)112 113 24 38

48
quality, culminating with the recent launch of a project to develop 100 universities with high levels of excellence at
a global level. Russia and Brazil stand out for inclusion and have as targets programs in some of the area mentioned
above, however, they lack wide-ranging strategies for the mid and long term, capable of covering the entire field of
education and coordinating the efforts of various state agencies and political institutions.65
Figure 2.4.4 shows the percentage of the population who have third level education per age group for 2005. It can
be noted that Brazil starts from a much lower level in relation to countries such as Chile and Russia. Moreover, what
calls attention is the fact that Brazil, unlike the other countries analyzed, has not had a significant increase in the
percentage of the graduate population in generation between 25 - 34 years of age in the year of reference (represented
by triangles) in relation to this percentage in the generation aged between 55 and 64 years of age (represented by
squares). This is precisely the effect of the deficit in investment in education in previous generations, which are now
responsible for educating coming generations, a deficit which programs aimed at attracted skilled immigrants will
undermine.
Figure 2.4.4
Percentage of population with third level education in two age groups
(25 - 34 years and 55 - 64 years), BRIC countries, South Africa, and Chile, 2005
Figure 2.4.5 below presents a comparison between the gross rate of third level education for the BRIC countries and
South Korea between 1971 and 2001, indicating the relationship between the total registrations, irrespective of age,
for the population in the age group which officially corresponds to the level of education shown. What is obvious
here is the relative stagnation of Brazil in relation to the incredible advance of South Korea, included in the figure
20
10
50
40
30
0
55 - 64 25 - 34
Source: FGV/DAPP based on OECD data.
Pe
rce
nta
ge
of
po
pu
ltati
on
wit
h t
hir
d le
ve
l e
du
cati
on
Brazil China India Russia South Africa Chile
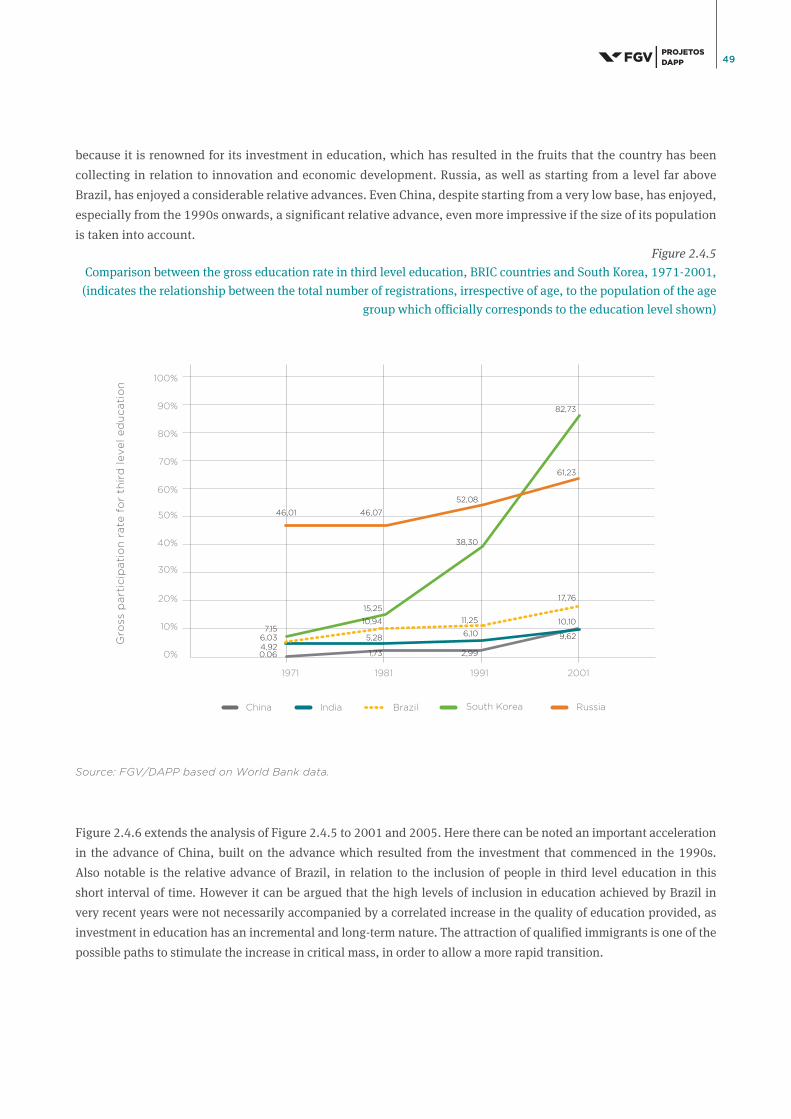
49
because it is renowned for its investment in education, which has resulted in the fruits that the country has been
collecting in relation to innovation and economic development. Russia, as well as starting from a level far above
Brazil, has enjoyed a considerable relative advances. Even China, despite starting from a very low base, has enjoyed,
especially from the 1990s onwards, a significant relative advance, even more impressive if the size of its population
is taken into account.
Figure 2.4.5
Comparison between the gross education rate in third level education, BRIC countries and South Korea, 1971-2001,
(indicates the relationship between the total number of registrations, irrespective of age, to the population of the age
group which officially corresponds to the education level shown)
Figure 2.4.6 extends the analysis of Figure 2.4.5 to 2001 and 2005. Here there can be noted an important acceleration
in the advance of China, built on the advance which resulted from the investment that commenced in the 1990s.
Also notable is the relative advance of Brazil, in relation to the inclusion of people in third level education in this
short interval of time. However it can be argued that the high levels of inclusion in education achieved by Brazil in
very recent years were not necessarily accompanied by a correlated increase in the quality of education provided, as
investment in education has an incremental and long-term nature. The attraction of qualified immigrants is one of the
possible paths to stimulate the increase in critical mass, in order to allow a more rapid transition.
Source: FGV/DAPP based on World Bank data.
1971 1981 1991 2001
50%
40%
30%
20%
10%
100%
90%
80%
70%
60%
0% 0.064,926,03
10,94
15,25
38,30
82,73
61,23
52,08
46,0746,01
11,25
17,76
7,15
1,73 2,99
6,105,28
10,10
9,62Gro
ss p
art
icip
ati
on
rate
fo
r th
ird
le
ve
l e
du
cati
on
BrazilChina India RussiaSouth Korea

50
Figure 2.4.6
Comparison between the gross enrollment rate for third level, BRIC countries and South Korea, 2001-2005 (indicates
the relationship between the total number of registrations, irrespective of age, to the population of the age group which
officially corresponds to the education level shown)
As Coentro observed, Brazil has actually enjoyed a substantial improvement in education indicators in recent years. Not only
in basic level education, but also third level. According to IBGE data, between 1999 and 2009, the average years of study of
Brazilians aged 10 or over increased from 5.8 years to 7.2.66 Together with an increase of 20.3% in the economically active
population (EAP), which occurred between 2001 and 2009, the part of the population who have at least completed third
level education advanced by 82.6%. In the same period the number of individuals who obtained each year masters degrees
(both academic and ‘professional’) and doctorates almost doubled (an increase of 93%), rising from 26,000 in 2001 to
50,200 in 2009.67 A 2010 publication from the Center of Strategic and Management Studies,68 based on data from the 2000
IBGE census, calculated that in 2000, approximately 305,000 individuals aged 25 or more had studied at least one year of a
masters or doctoral course. 68% of this contingent resided in the Southeastern Region.69 Among them approximately 14,000
(4.7%) were born abroad. Nevertheless, it can be said that despite the considerable improvement in the indicators referring
to education in recent years, there still seems to persist, as a result of the historic lack of adequate investment in education,
a lack of specialized labor, especially technical and scientific staff, in various Brazilian industries, including shipbuilding,
petrochemical, and information technology.70
While the country spent around 5% of its Gross Domestic Product (GDP) on education, Brazilian students have been
achieving very low positions in international evaluations,71 as shown in Table II of the Annex. It is also true that higher
level education in Brazil, despite the existence of some ‘islands of excellence’, has serious problems, which implies
2001 2002 2003 2004 2005
50%
40%
30%
20%
10%
100%
90%
80%
70%
60%
0%9,6210,10
20,09
61,23
66,54 66,3070,21
72,16
82,73
90,2187,71
85,72
93,49
22,25 23,81
17,76
10,181 0,70
15,4512,76
17,74
11,06
25,63
19,41
10,82
Source: FGV/DAPP based on World Bank data
BrazilChina India RussiaSouth Korea
Gro
ss R
ate
of
Th
ird
Level E
du
cati
on
51
that employers are obliged to pay part of the costs of training and qualification. According to recommendations made
by the OECD in 2010 about the stimulation of socio-economic prosperity in Brazil, among the principal problems to
be overcome are the coverage of basic level education and the quality of higher level education as a barrier to the
promotion of innovation. In the same report it is argued that the quality of education in Brazil can be improved through
an increase in the cost-efficiency relationship of public education, since the levels of expenditure are already relatively
high.
Educational deficiencies in Brazil threaten to harm the country’s growth. We can take the problem to be even greater if
we also take into account that Brazil does not have sufficient human resources to, shall we say, ‘educate the educators’
at a sufficient speed. It is precisely in this way that the attraction of talent must be part of the national development
strategy. Unlike what occurred with India and China, Brazil is a country with solid democratic institutions and relatively
few political, ethnic or religious conflicts, factors which make the country an attractive local for skilled professionals.
2.5 IMMIGRANT POPULATIONS AS THE SUBJECT OF ANALYSIS: APPROACHES AND THE DEMOGRAPHIC PROFILE OF THE IMMIGRANT POPULATION IN BRAZIL
• In addition to the strictly economic relations which are created by the supply and demand of
employment positions in determined labor markets, what also has to be considered is the way in which
belonging to different collectivities (families, ethnic or cultural groups, religions, etc.) condition the
decision to emigrate.
• Growing control and reflection on the phenomenon of migration has created an unprecedented
amount of information about the characteristics of immigrants (gender, age, religion, precedence,
level of education, etc.). However, in the Brazilian case there is not much data available.
• There has been a considerable increase in the proportion of skilled immigrant workers who have
received visas to work in the country.
• There is a need for an immigration policy aimed at skilled immigrants as a vector for national
development which takes into account opportunities for development at the regional and local levels.
• The Brazilian government can, through policies that are strategically oriented at the attraction and
retention of skilled professionals, take better advantage of its current status in the international
scenario, in order to continue recent advances in the economic, social and geopolitical levels.
SUMMARY
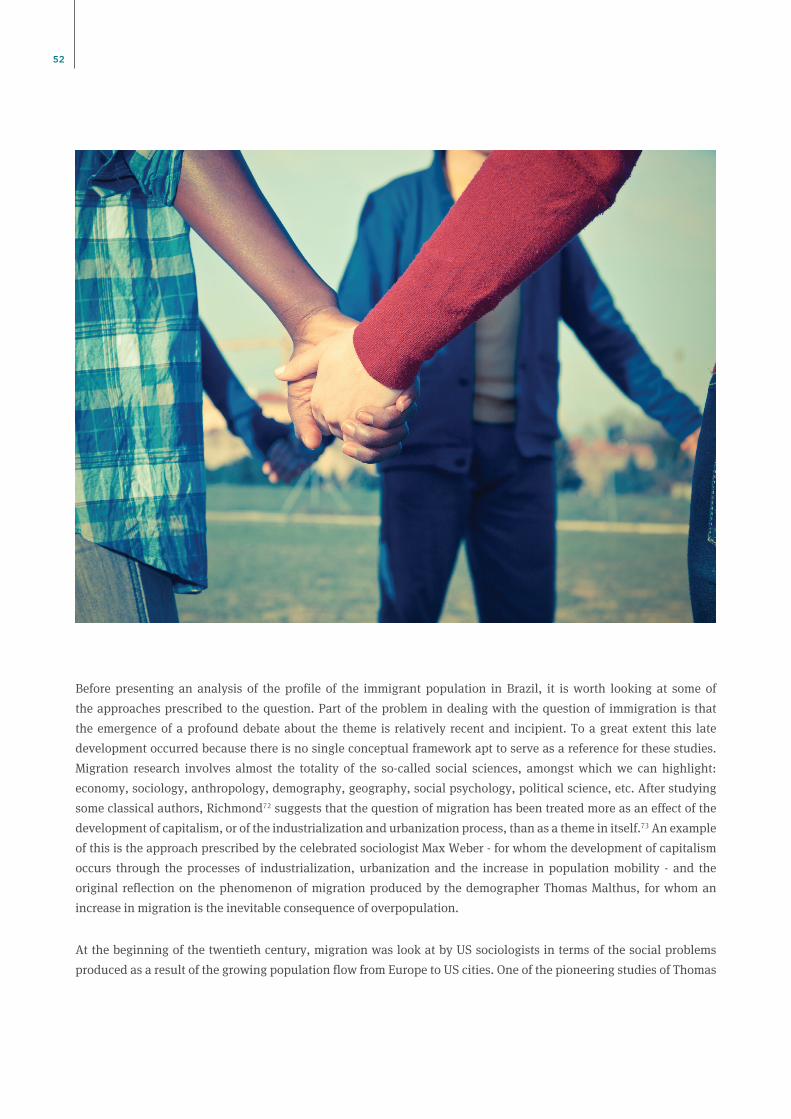
52
Before presenting an analysis of the profile of the immigrant population in Brazil, it is worth looking at some of
the approaches prescribed to the question. Part of the problem in dealing with the question of immigration is that
the emergence of a profound debate about the theme is relatively recent and incipient. To a great extent this late
development occurred because there is no single conceptual framework apt to serve as a reference for these studies.
Migration research involves almost the totality of the so-called social sciences, amongst which we can highlight:
economy, sociology, anthropology, demography, geography, social psychology, political science, etc. After studying
some classical authors, Richmond72 suggests that the question of migration has been treated more as an effect of the
development of capitalism, or of the industrialization and urbanization process, than as a theme in itself.73 An example
of this is the approach prescribed by the celebrated sociologist Max Weber - for whom the development of capitalism
occurs through the processes of industrialization, urbanization and the increase in population mobility - and the
original reflection on the phenomenon of migration produced by the demographer Thomas Malthus, for whom an
increase in migration is the inevitable consequence of overpopulation.
At the beginning of the twentieth century, migration was look at by US sociologists in terms of the social problems
produced as a result of the growing population flow from Europe to US cities. One of the pioneering studies of Thomas

53
and Znaiecki demonstrated how the migration process functioned to break traditional ties of solidarity, particularly
of the family system, throwing immigrants into a new world predominantly ruled by social ties created through labor
relations and market exchanges.74 Ethnic minorities, immigrants and women were likely to remain in industries
and labor markets seen as marginal. Immigrants did not count on protection networks, and were even frequently
prevented from participating in trade unions. As a result of institutionalized discrimination, immigrants, especially
those belonging to minorities, were more likely to accept low paid work and precarious working conditions, as well as
temporary work without labor guarantees.
According to Gabaccia, growing contemporary interest in the migration phenomenon is considerably marked by
economic analyses, which see immigrants more as individuals than as being part of social relations networks75. He
also argues that a new approach to international migrations has been emerging, taking as a starting point the creation
of a transnational space of relations, which runs across cultural, geographic, political and legal frontiers. According
to this approach, immigrants appear as parts of transnational networks which connect people, projects, interests and
institutions in different parts of the globe.
The economic approach identified in the neo-classical cannon argues that most international migratory flows are
induced by regulation between the supply and demand of employment positions, resulting in wage differences in
various labor markets. For neo-classical authors the decision to migrate results from the calculation of the costs and
benefits involved in migration. The success of the migrant is determined by factors such as education, work experience,
time spent in the destination, etc.76
Authors such as Portes have criticized the neo-classical approach as they believe that economic relations should not be
overvalued to the detriment of socially oriented expectations.77 In other words, migrants should not be seen primarily
as maximizing individuals, extirpated from their social relations, but rather as members of social structures with
complex behavior which conditions their spatial and socio-economic mobility.78
In recent years the so-called new migration economists have challenged the hypotheses and conclusions of neo-classical
theory.79 Authors such as Massey and Sasaki and Assis, for example, suggest that the principal contribution of the new
approach lies in the fact that the reasons for migration are better understood by taking as a reference groups of people
and not atomized individuals involved in a decision making process.80 The feeling of belonging to different ethnic
and cultural groups, to religious beliefs, etc. conditions the decision to emigrate, as well as the choice of destination
country. These authors suggest that families, or domiciliary units, as well as other culturally established production
and consumption units, and relational networks, prevail over individual interests, and should be the principal focus
of analysis when trying to understand the question of migration. In this way, in addition to the differences in income
and public policies aimed at attracting migrants, it is necessary to take into account the protection networks created
by immigrants, also as an artifice for the minimization of the risks inherent to fluctuations in labor markets. A classic
example is the network of immigrants in Greater Boston coming from the Brazilian city of Governador Valadares.81
Nevertheless, it is fundamental when drafting immigration policies that we are capable of taking into account economic
questions, questions related to the model of society we intend to construct, and the way we intend to integrate
immigrants into this. According to the IOM report:
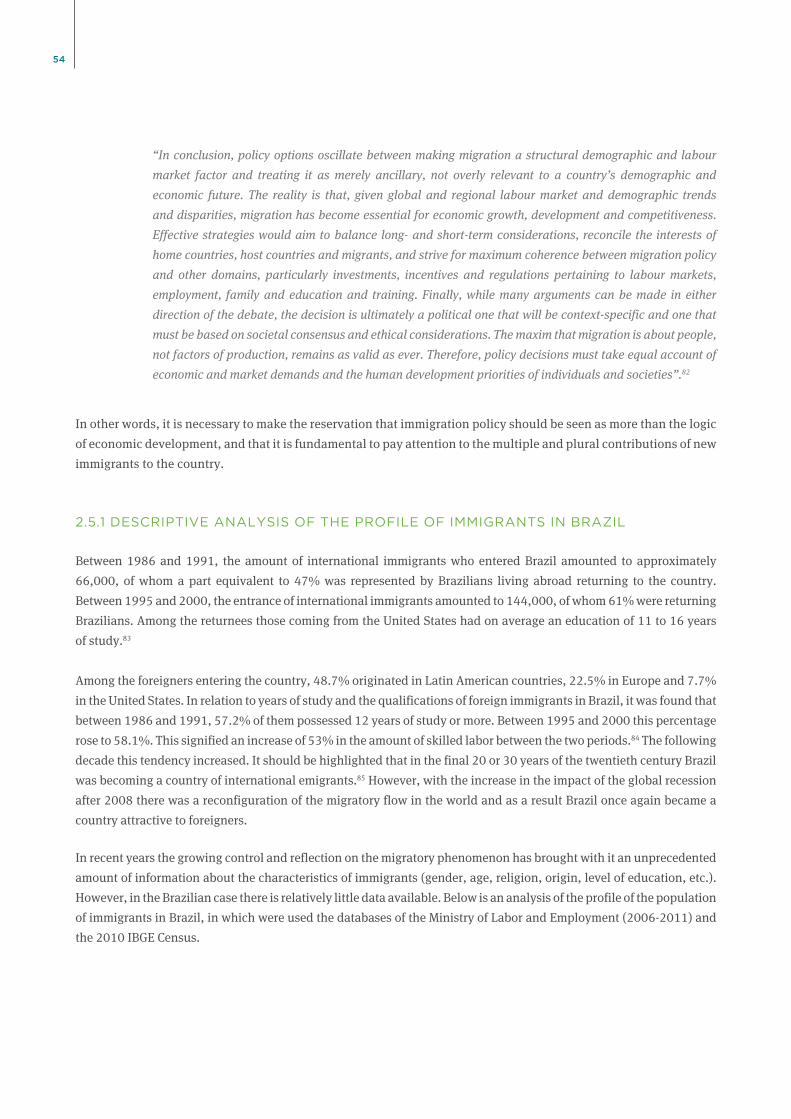
54
“In conclusion, policy options oscillate between making migration a structural demographic and labour
market factor and treating it as merely ancillary, not overly relevant to a country’s demographic and
economic future. The reality is that, given global and regional labour market and demographic trends
and disparities, migration has become essential for economic growth, development and competitiveness.
Effective strategies would aim to balance long- and short-term considerations, reconcile the interests of
home countries, host countries and migrants, and strive for maximum coherence between migration policy
and other domains, particularly investments, incentives and regulations pertaining to labour markets,
employment, family and education and training. Finally, while many arguments can be made in either
direction of the debate, the decision is ultimately a political one that will be context-specific and one that
must be based on societal consensus and ethical considerations. The maxim that migration is about people,
not factors of production, remains as valid as ever. Therefore, policy decisions must take equal account of
economic and market demands and the human development priorities of individuals and societies”.82
In other words, it is necessary to make the reservation that immigration policy should be seen as more than the logic
of economic development, and that it is fundamental to pay attention to the multiple and plural contributions of new
immigrants to the country.
2.5.1 DESCRIPTIVE ANALYSIS OF THE PROFILE OF IMMIGRANTS IN BRAZIL
Between 1986 and 1991, the amount of international immigrants who entered Brazil amounted to approximately
66,000, of whom a part equivalent to 47% was represented by Brazilians living abroad returning to the country.
Between 1995 and 2000, the entrance of international immigrants amounted to 144,000, of whom 61% were returning
Brazilians. Among the returnees those coming from the United States had on average an education of 11 to 16 years
of study.83
Amongtheforeignersenteringthecountry,48.7%originatedinLatinAmericancountries,22.5%inEuropeand7.7%
in the United States. In relation to years of study and the qualifications of foreign immigrants in Brazil, it was found that
between 1986 and 1991, 57.2% of them possessed 12 years of study or more. Between 1995 and 2000 this percentage
rose to 58.1%. This signified an increase of 53% in the amount of skilled labor between the two periods.84 The following
decade this tendency increased. It should be highlighted that in the final 20 or 30 years of the twentieth century Brazil
was becoming a country of international emigrants.85 However, with the increase in the impact of the global recession
after 2008 there was a reconfiguration of the migratory flow in the world and as a result Brazil once again became a
country attractive to foreigners.
In recent years the growing control and reflection on the migratory phenomenon has brought with it an unprecedented
amount of information about the characteristics of immigrants (gender, age, religion, origin, level of education, etc.).
However, in the Brazilian case there is relatively little data available. Below is an analysis of the profile of the population
ofimmigrantsinBrazil,inwhichwereusedthedatabasesoftheMinistryofLaborandEmployment(2006-2011)and
the 2010 IBGE Census.
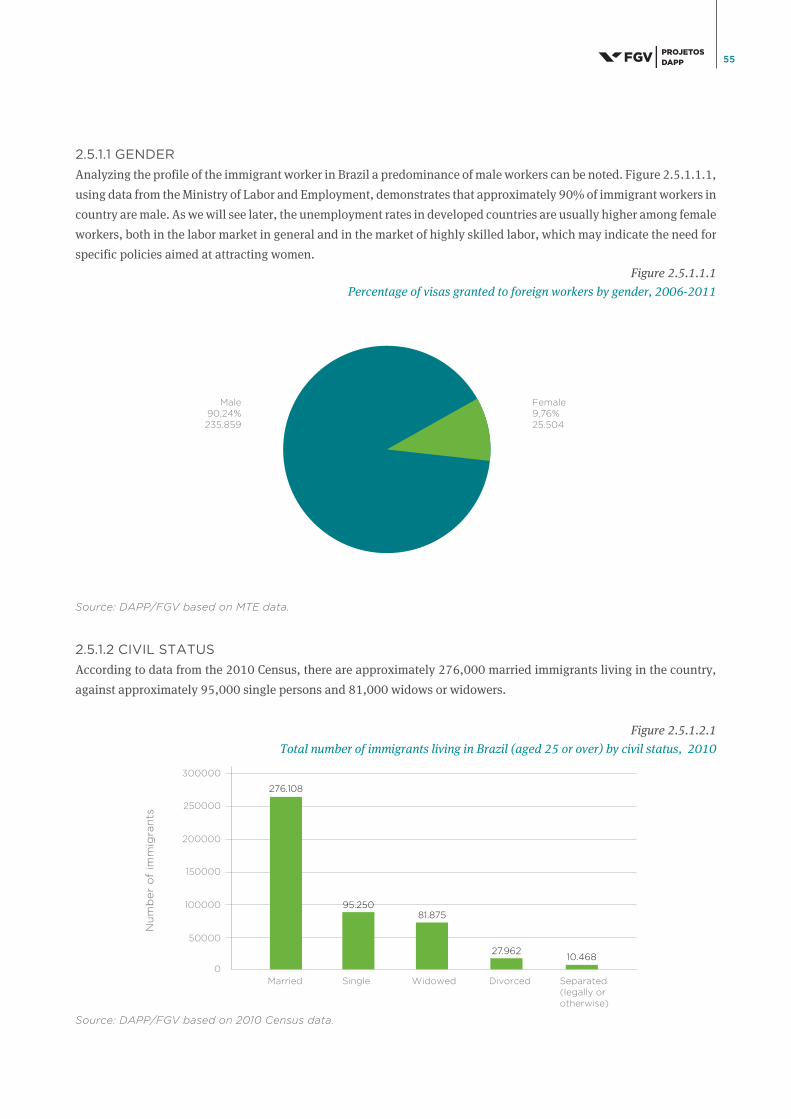
55
2.5.1.1 GENDER
Analyzing the profile of the immigrant worker in Brazil a predominance of male workers can be noted. Figure 2.5.1.1.1,
usingdatafromtheMinistryofLaborandEmployment,demonstratesthatapproximately90%ofimmigrantworkersin
country are male. As we will see later, the unemployment rates in developed countries are usually higher among female
workers, both in the labor market in general and in the market of highly skilled labor, which may indicate the need for
specific policies aimed at attracting women.
Figure 2.5.1.1.1
Percentage of visas granted to foreign workers by gender, 2006-2011
2.5.1.2 CIVIL STATUS
According to data from the 2010 Census, there are approximately 276,000 married immigrants living in the country,
against approximately 95,000 single persons and 81,000 widows or widowers.
Figure 2.5.1.2.1
Total number of immigrants living in Brazil (aged 25 or over) by civil status, 2010
50000
100000
150000
200000
250000
300000
0
276.108
27.96210.468
95.25081.875
Source: DAPP/FGV based on 2010 Census data.
Source: DAPP/FGV based on MTE data.
Male90,24%235.859
Female9,76%25.504
Nu
mb
er
of
imm
igra
nts
Married Single Widowed Divorced Separated (legally or otherwise)

56
Also according to the 2010 Census data, when only highly qualified immigrants (those with masters or doctorates) in the country
are analyzed, around 7,000 were married, 2,000 single, 1,000 divorced and only 350 widowed.
Figure 2.5.1.2.2
Total number of immigrants with master’s degrees or doctorates living in Brazil
(people aged 25 or over) by civil status, 2010
2.5.1.3 AGE GROUP
While in the world the majority of immigrants are individuals aged between 15 and 30 years86, in Brazil there is a
predominance of immigrants in the 66 and above age group, followed by the 46 - 65 group (Figure 2.5.1.3.1).
Figure 2.5.1.3.1
Total number of immigrants living in Brazil by age group (persons aged 25 and over), 2010
1000
2000
3000
4000
5000
6000
7000
8000
0
6.942
352 188
2.045
973
Source: DAPP/FGV based on data from the 2010 Census
SOURCE: DAPP/FGV based on data from the 2010 Census.
50000
100000
150000
200000
250000
0
67.109
196.480
61.814
166.260
Nu
mb
er
of
imm
igra
nts
wit
h m
ast
ers
or
do
cto
rate
s
Married Single Widowed Divorced Separated (legally or otherwise)
Nu
mb
er
of
imm
igra
nts
25-35 years 36-45 years 46-65 years 66 years or over

57
2.5.1.4 TIME OF RESIDENCE
The predominance of immigrants of an advanced age is justified by the arrival of retired persons or professionals
at the end of their career, but also as the result of the ageing of a population of immigrants, since the majority of
the population of immigrants who live in Brazil established residence in the country before 1996. A new increase in
the growth of the population of immigrants can be found in the 2000s, especially in the second half of the decade.
Figure 2.5.1.4.1
Percentages of total immigrants living in Brazil per period in which they established residence country
(individuals aged 25 and over), 2010
2.5.1.5 ENROLLMENT RATES
According to the information revealed in Figure 2.5.1.5.1, the large majority of immigrants who live in Brazil were not
in the year of reference continuing their studies (approximately 95%). It can be stated that the population of foreign
immigrants in Brazil consists, above all, of workers with few skills, since according to the information presented in Figure
2.5.1.5.2, approximately 76% of them are not even university graduates. Immigrants with undergraduate and postgraduate
qualifications only consist of approximately 22% of those analyzed. It should be noted that the proportion of immigrant
workers with master’s degrees and/or doctorates is only 2%.
Source: DAPP/FGV based on data from the 2010 Census
76,60%376.624
10,52%51.742
6,96%34.226
5,91%29.071
From 2007 to 2012
From 2002 to 2006
From 1997 to 2001
up to 1996
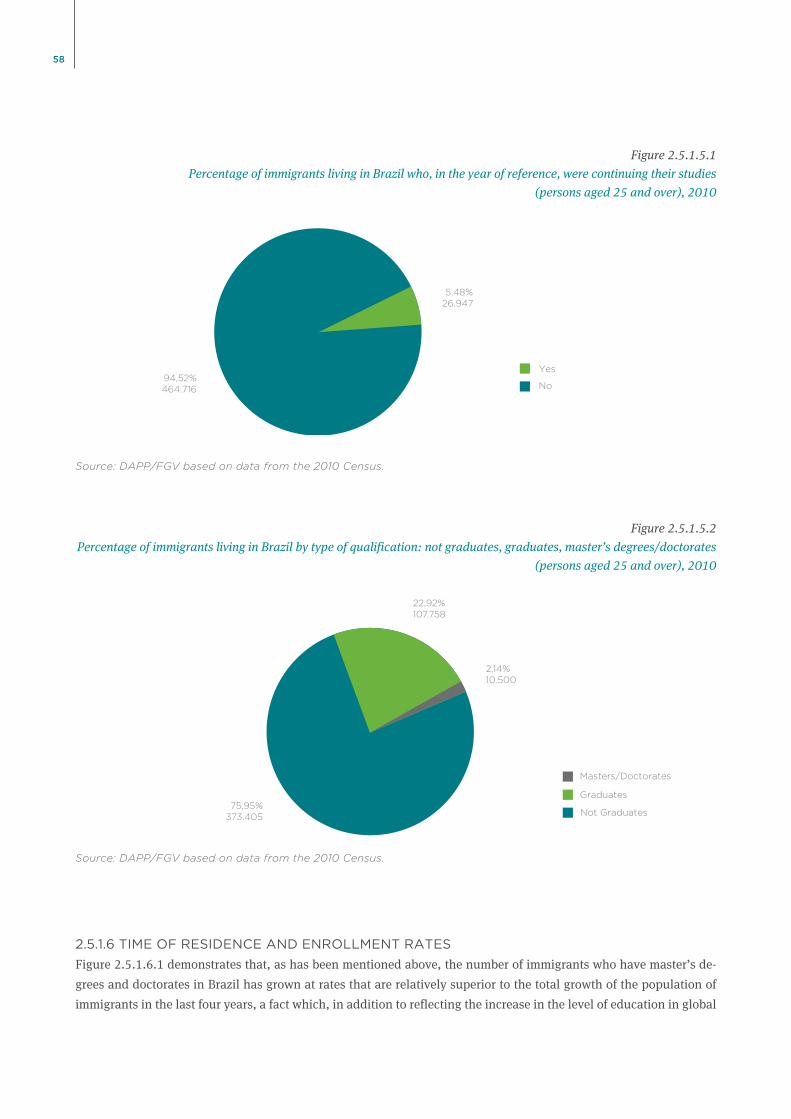
58
Figure 2.5.1.5.1
Percentage of immigrants living in Brazil who, in the year of reference, were continuing their studies
(persons aged 25 and over), 2010
Figure 2.5.1.5.2
Percentage of immigrants living in Brazil by type of qualification: not graduates, graduates, master’s degrees/doctorates
(persons aged 25 and over), 2010
Source: DAPP/FGV based on data from the 2010 Census.
Source: DAPP/FGV based on data from the 2010 Census.
2.5.1.6 TIME OF RESIDENCE AND ENROLLMENT RATES
Figure 2.5.1.6.1 demonstrates that, as has been mentioned above, the number of immigrants who have master’s de-
grees and doctorates in Brazil has grown at rates that are relatively superior to the total growth of the population of
immigrants in the last four years, a fact which, in addition to reflecting the increase in the level of education in global
94,52%464.716
5,48%26.947
o
Yes
No
Masters/Doctorates
Graduates
Not Graduates

59
terms is related to the consequences of the 2008 economic crisis, which resulted in a greater interest of this type of
worker in Brazil. What also should be noted is the importance of the development of shipbuilding and oceanic industry
inthewakeofnewdiscoveries,aswellasinvestmentsintheoilarea.LookingatFigure2.5.1.6.2,itcanbeseenthat
there is a large contingent of immigrants who have not completed third level education, who reached the country in
1996 or before.
Figure 2.5.1.6.1
Percentages of immigrants with masters/doctorates living in Brazil by the period in which they established residence in
the country (persons aged 25 and over), 2010
Source: DAPP/FGV based on data from the 2010 Census.
Source: DAPP/FGV based on data from the 2010 Census.
Figure 2.5.1.6.2
Percentage of non-graduate immigrants living in Brazil by the period in which they established residence in the country
(persons aged 25 and over), 2010
60,21%6.322
23,71%2.490
8,90%935
7,18%753
6
79,09%295.319
8,88%33.164
6,43%24.026
5,60%20.895
2007-2012
2002-2006
1997-2001
up to 1996
2007-2012
2002-2006
1997-2001
up to 1996

60
2.5.1.7 DOMICILE SITUATION
It is interesting in the description of the profile of immigrants in Brazil that they almost always live in urban areas, which
reflects the fact that most of the foreigners who arrive in Brazil come in search of work opportunities.
Figure 2.5.1.7.1
Percentage of immigrants living in Brazil per domicile situation: urban versus rural
(individuals aged 25 and over), 2010
2.5.1.8 TYPOLOGY OF VISAS
Figure 2.5.1.8.1 shows that the large majority, 94%, of visas issued for foreign workers are temporary visas.
Figure 2.5.1.8.1
Percentage of permanent work visas versus temporary visas granted by the Brazilian government,
2006-2011
Source: DAPP/FGV based on MTE data.
Source: DAPP/FGV based on MTE data.
3,62%17.777
96,38%473.886
Rural
Urban
Definitive Permanence0.77%2005
Permanenct (4years)5.20%13,579
Temporary94.04%245,779
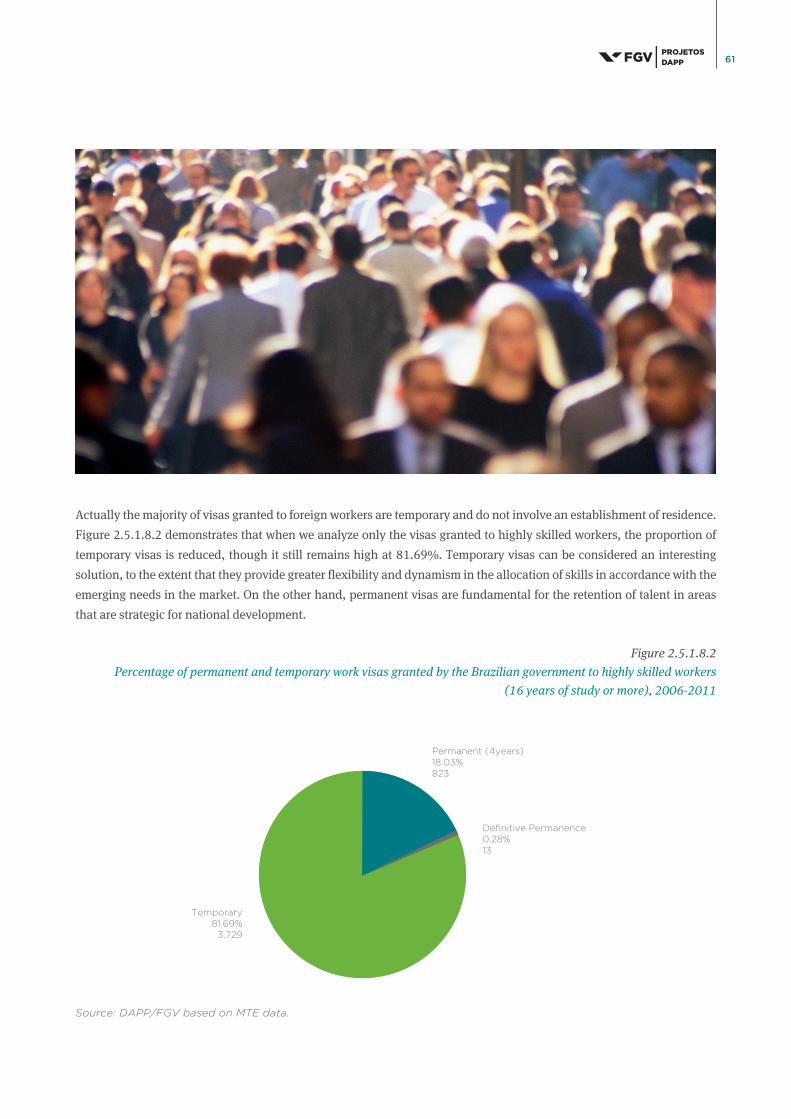
61
Actually the majority of visas granted to foreign workers are temporary and do not involve an establishment of residence.
Figure 2.5.1.8.2 demonstrates that when we analyze only the visas granted to highly skilled workers, the proportion of
temporary visas is reduced, though it still remains high at 81.69%. Temporary visas can be considered an interesting
solution, to the extent that they provide greater flexibility and dynamism in the allocation of skills in accordance with the
emerging needs in the market. On the other hand, permanent visas are fundamental for the retention of talent in areas
that are strategic for national development.
Figure 2.5.1.8.2
Percentage of permanent and temporary work visas granted by the Brazilian government to highly skilled workers
(16 years of study or more), 2006-2011
Source: DAPP/FGV based on MTE data.
Definitive Permanence0.28%13
Permanent (4years)18.03%823
Temporary81.69%
3,729

62
As shown by Figure 2.5.1.8.4, the types of visa most issued to foreign workers in Brazil refer to occupations usually
filled by individuals who just have a third level degree. The enormous importance of occupation in maritime labor can
be noted, propelled by the growth of the oil industry and by the correlated growth of the shipbuilding industry. Also
worth noting, in comparison with the other categories, is the significant number of visas granted to workers admitted
for the transfer of technology or to provide technical assistance or services. On the other hand, the low number of visas
granted to university professors or researchers also calls attention.
5000
70000
60000
50000
30000
40000
20000
10000
0
17.056
26.922
41.266 40.540
53.226
66.769
2006 2007 2008 2009 2010 2011
1.5312.566 2.725 2.358 2.558
3.846
Source DAPP/FGV based on MTE data.
Figure 2.5.1.8.3 shows an increase in the total number of work visas granted. Between 2006 and 2011, it can be
noted that the number of visas for stays of four years or more grew by a little more than double, while the number of
temporary visas almost quadrupled.
Figure 2.5.1.8.3
Historic series of number of visas granted by the Brazilian government to foreign workers per length of stay
(temporary versus stay of four years or more), 2006-2011
Visa of 4 years or more Temporary visa

63
Figure 2.5.1.8.4
Numbers of different types of work visas issued by the Brazilian government, 2006-2011
144.842
44.933
40.242
11.839
5.233
6.250
1.859
1.975
1.418
1.305
493
114
46
44
23
12
7
4
724
20000 40000 60000 80000 100000 120000 140000 160000
• The category of Maritime Work covers all activities carried out on vessels or maritime platforms, including
the oil industry, tourism and fishing vessels.
• Transfer of Technology is understood to be any type of cooperation accord or agreement, whether or not any
employment is involved, so that foreigners can work in areas related to technical assistance (specifically
excluded from technical assistance are administrative, financial and managerial functions) or the actual
transfer of technology.
• The social condition of refugee is granted by the Ministry of Justice to individuals who for reasons related to
their ethnicity, religion, social group or political position, are persecuted in their country of origin or other
country. This decision of the Ministry of Justice is followed by other governmental agencies, such as the
MinistryofLaborandEmployment.
• AccordingtotheMinistryofLaborandEmployment,visasaregrantedtoforeignprofessorsandresearchers,
scientists, top level researchers, or professionals with renowned knowledge to work in Brazilian universities
or research centers.
Source: DAPP/FGV based on MTE data
Maritime work
Artistic or sporting
Transfer of technology
Employed in Brazilian multinational
Investor
Temporary work
Executive of multinational company
Internship or training
Family reasons
Special visa
Refugee
Professor or researcher
Diplomats
Government work
Third sector
Retired
Work visa for Portuguese citizens
Health Treatment
Others
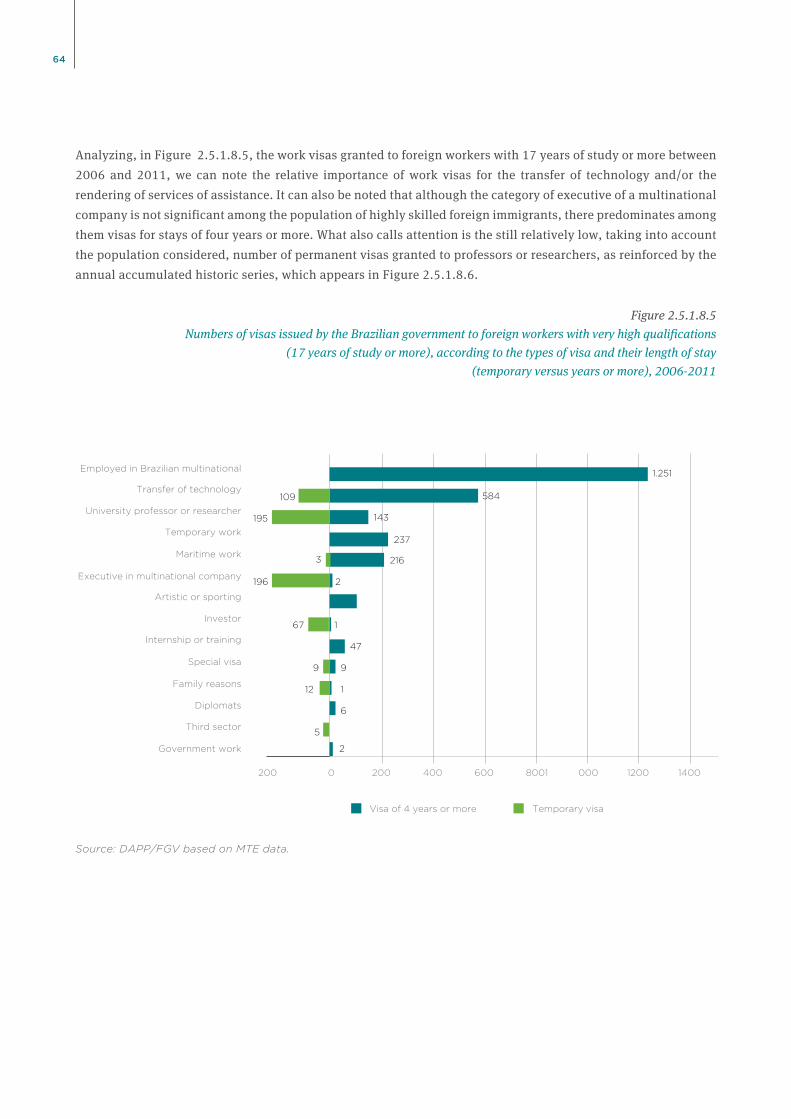
64
Analyzing, in Figure 2.5.1.8.5, the work visas granted to foreign workers with 17 years of study or more between
2006 and 2011, we can note the relative importance of work visas for the transfer of technology and/or the
rendering of services of assistance. It can also be noted that although the category of executive of a multinational
company is not significant among the population of highly skilled foreign immigrants, there predominates among
them visas for stays of four years or more. What also calls attention is the still relatively low, taking into account
the population considered, number of permanent visas granted to professors or researchers, as reinforced by the
annual accumulated historic series, which appears in Figure 2.5.1.8.6.
Figure 2.5.1.8.5
Numbers of visas issued by the Brazilian government to foreign workers with very high qualifications
(17 years of study or more), according to the types of visa and their length of stay
(temporary versus years or more), 2006-2011
2000200 400 600 8001 000 1200 1400
584
1.251
143
237
2196
167
47
99
112
6
5
3
2
216
195
109
Source: DAPP/FGV based on MTE data.
Employed in Brazilian multinational
Transfer of technology
University professor or researcher
Temporary work
Maritime work
Executive in multinational company
Artistic or sporting
Investor
Internship or training
Special visa
Family reasons
Diplomats
Third sector
Government work
Visa of 4 years or more Temporary visa
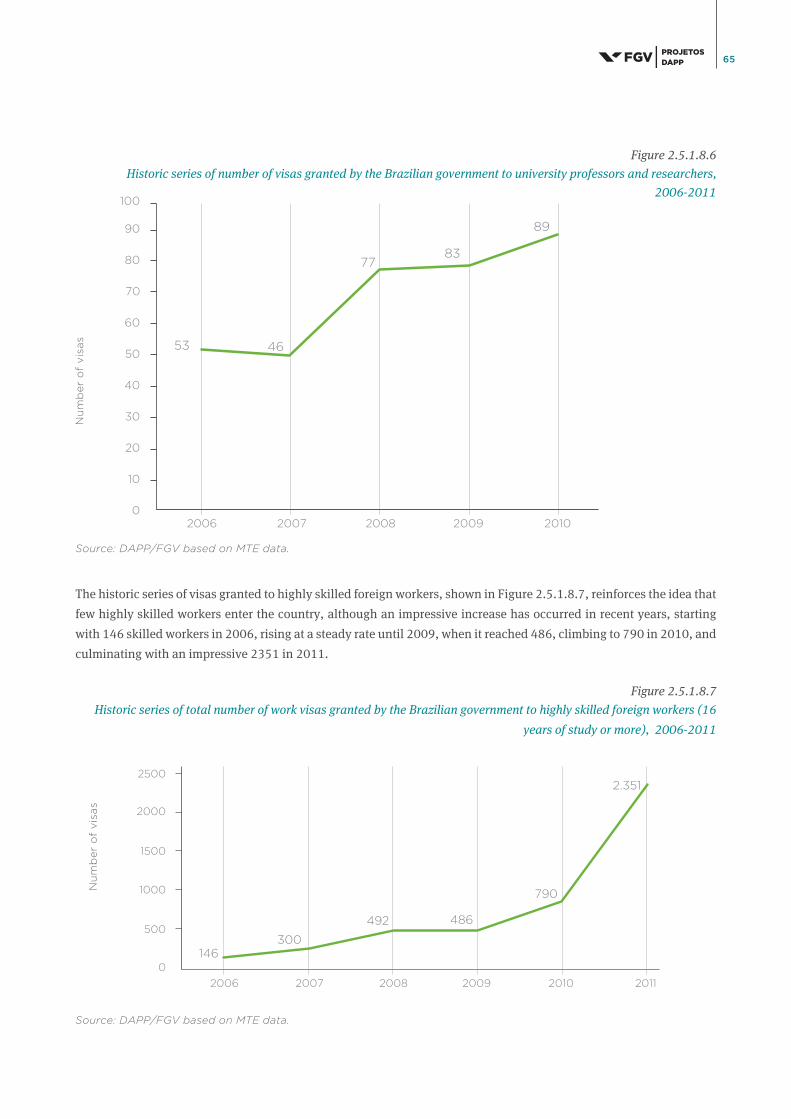
65
Figure 2.5.1.8.6
Historic series of number of visas granted by the Brazilian government to university professors and researchers,
2006-2011
Source: DAPP/FGV based on MTE data.
The historic series of visas granted to highly skilled foreign workers, shown in Figure 2.5.1.8.7, reinforces the idea that
few highly skilled workers enter the country, although an impressive increase has occurred in recent years, starting
with 146 skilled workers in 2006, rising at a steady rate until 2009, when it reached 486, climbing to 790 in 2010, and
culminating with an impressive 2351 in 2011.
Figure 2.5.1.8.7
Historic series of total number of work visas granted by the Brazilian government to highly skilled foreign workers (16
years of study or more), 2006-2011
2500
2000
1500
1000
500
0
2006
146300
492 486
790
2.351
2007 2008 2009 2010 2011
100
80
70
60
50
40
30
20
10
02006
53 46
7783
89
2007 2008 2009 2010
90
Source: DAPP/FGV based on MTE data.
Nu
mb
er
of
vis
as
Nu
mb
er
of
vis
as

66
When we look in greater detail at the historic series which only considers visas for four years or more, granted to
individuals with 17 years of study or more, as shown in Figure 2.5.1.8.7, we can observe that few skilled professionals
come to Brazil for long periods. In 2011, out of the total of 2351 visas granted to foreign workers with high levels of
education, only 369 were issued for a period of four years or more, which may indicate the absence of a policy aimed
at retaining talent.
Figure 2.5.1.8.8
Annual historic series of number of work visas for four years or more granted by the Brazilian government to highly
skilled foreign workers (16 years of study or more), 2006-2011
2.5.1.9 COUNTRIES OF ORIGIN
The analysis of the 2010 Census data, as shown in Figure 2.5.1.9.1, reveals that most of the immigrants living
in Brazil come from countries which have geographic, historic, and/or cultural-linguistic proximity. Among
the eight countries which most sent immigrants to Brazil, seven (Portugal, Italy, Spain, Bolivia, Argentina,
Paraguay and Uruguay) speak Latin languages and four are located in South America. In addition to the
Brazilian economic hegemony in South America, as well as the evident historic ties which link Brazil and
Portugal, the important roles of Japan, Italy and Germany should be highlighted. These are countries which
have historic ties with Brazil, and from where departed the last great waves of populations which colonized the
country, at the beginning of the nineteenth century in the German case, at the end of the same century in the
Italian, and the beginning of the twentieth in the Japanese. Among the countries included in the figure, we also
should highlight the relative importance of China, a country which has been establishing itself since 2009 as
thelargestcommercialpartnerofBrazil.Whenweanalyzethemorerecentimmigrations,theLatinAmerican
countries and China gain importance in comparison with the other countries mentioned above.
Source: DAPP/FGV based on MTE data.
Nu
mb
er
of
vis
as

67
Figure 2.5.1.9.1
Number of immigrants living in Brazil by country of origin (Ranking of the first 20) and the period in which they
established residence in the country (individuals aged 25 and over), 2010
Source: DAPP/FGV based on data from the 2010 Census
140000
120000
100000
60000
80000
40000
20000
0
Germ
an
y
Fra
nce
Italy
Jap
an
Sp
ain
Un
ited
Sta
tes
Po
rtu
gal
Bo
livia
Arg
en
tin
a
Para
gu
ay
Uru
gu
ay
Ch
ina
Ch
ile
Peru
Leb
an
on
Rep
ub
lic o
f K
ore
a
An
go
la
Co
lom
bia
Po
lan
d
Sco
tlan
d
Until 1996 1997 to 2001 2002 to 2006 2007 to 2010

68
Figure 2.5.1.9.2
Historic series of the number of visas granted by the Brazilian government to foreign workers from different countries,
showing the four countries which most sent legal workers, 2006-2011
Figure 2.5.1.9.3 shows the four countries from where the largest number of highly skilled foreigners came to
work in Brazil. This small list includes countries such as the United States and France, which in addition to
possessing important investment in the country, have suffered from the 2008 crisis and are still facing difficulties
in recovering their markets.87 The presence of Japanese and Chinese among the highly skilled foreigners who
come to the country can be explained to a great extent by the important presence of multinationals from those
countries in Brazil. According to data from the Central Bank and Federation of Industry of the State of São Paulo,
Source: DAPP/FGV based on MTE data.
When we analyze the immigrant population, using data about visas granted to immigrant workers obtained in the
MTE database, we can see the phenomenon of immigration in Brazil from a new perspective. Figure 2.5.1.9.2 shows
that in the countries which most sent migrants with work visas to Brazil in recent years, the numbers sent almost
always rose, with the exception of the period 2008-2009. During this period the US was the country which most sent
workers with visas to Brazil. What calls attention is the large number of individuals coming from the Philippines,
justifiable by the high volume of nationals from this country who come for jobs in the naval and oceanic industries.
Germany India Great Britain Philippines USA
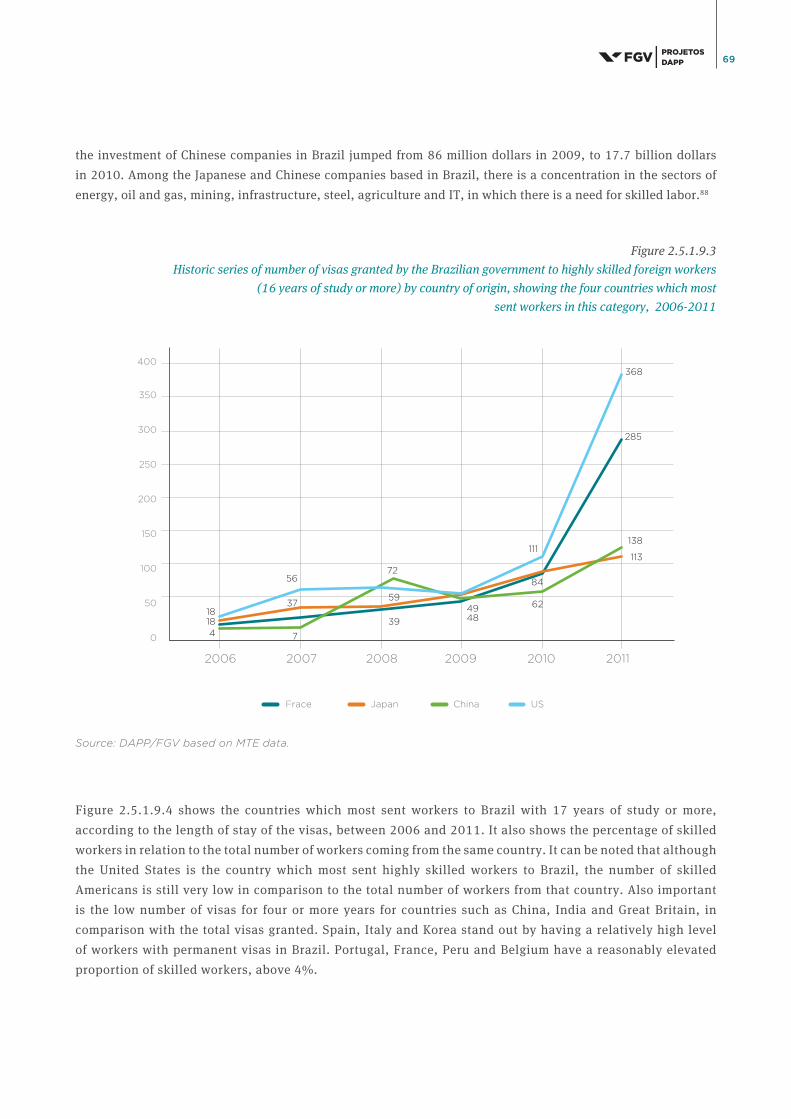
69
the investment of Chinese companies in Brazil jumped from 86 million dollars in 2009, to 17.7 billion dollars
in 2010. Among the Japanese and Chinese companies based in Brazil, there is a concentration in the sectors of
energy, oil and gas, mining, infrastructure, steel, agriculture and IT, in which there is a need for skilled labor.88
Figure 2.5.1.9.3
Historic series of number of visas granted by the Brazilian government to highly skilled foreign workers
(16 years of study or more) by country of origin, showing the four countries which most
sent workers in this category, 2006-2011
Source: DAPP/FGV based on MTE data.
Figure 2.5.1.9.4 shows the countries which most sent workers to Brazil with 17 years of study or more,
according to the length of stay of the visas, between 2006 and 2011. It also shows the percentage of skilled
workers in relation to the total number of workers coming from the same country. It can be noted that although
the United States is the country which most sent highly skilled workers to Brazil, the number of skilled
Americans is still very low in comparison to the total number of workers from that country. Also important
is the low number of visas for four or more years for countries such as China, India and Great Britain, in
comparison with the total visas granted. Spain, Italy and Korea stand out by having a relatively high level
of workers with permanent visas in Brazil. Portugal, France, Peru and Belgium have a reasonably elevated
proportion of skilled workers, above 4%.
285
Frace Japan China US
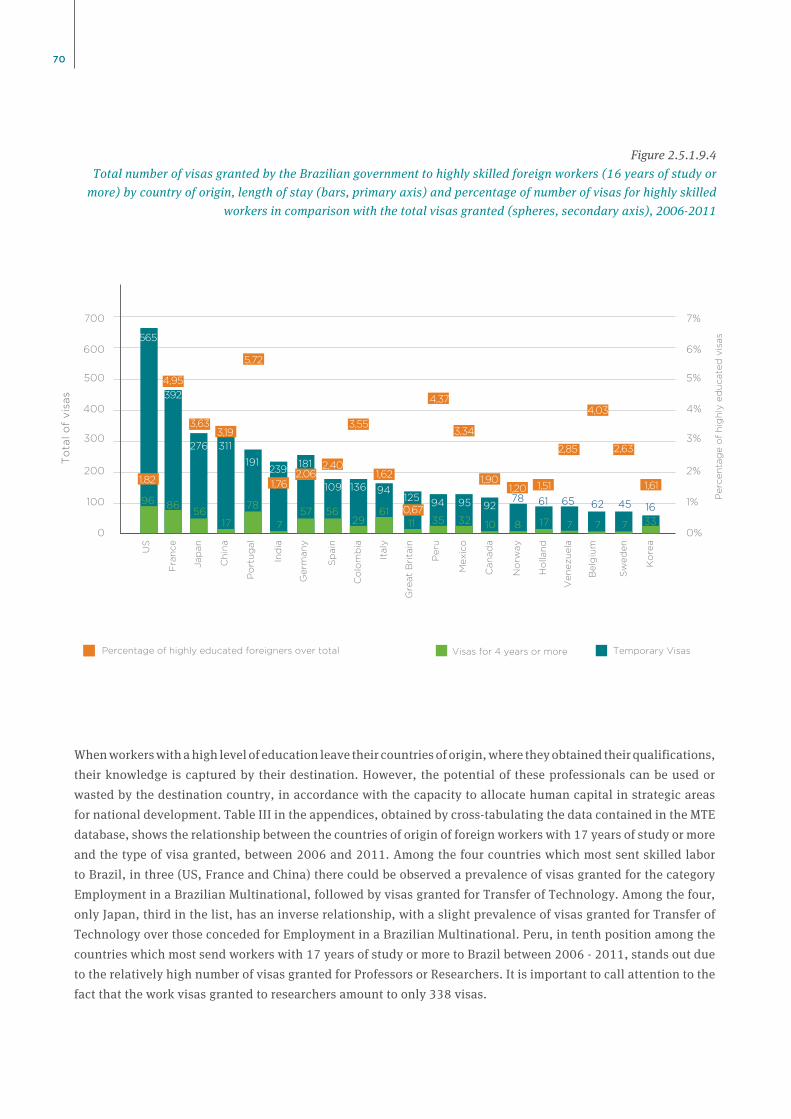
70
Figure 2.5.1.9.4
Total number of visas granted by the Brazilian government to highly skilled foreign workers (16 years of study or
more) by country of origin, length of stay (bars, primary axis) and percentage of number of visas for highly skilled
workers in comparison with the total visas granted (spheres, secondary axis), 2006-2011
When workers with a high level of education leave their countries of origin, where they obtained their qualifications,
their knowledge is captured by their destination. However, the potential of these professionals can be used or
wasted by the destination country, in accordance with the capacity to allocate human capital in strategic areas
for national development. Table III in the appendices, obtained by cross-tabulating the data contained in the MTE
database, shows the relationship between the countries of origin of foreign workers with 17 years of study or more
and the type of visa granted, between 2006 and 2011. Among the four countries which most sent skilled labor
to Brazil, in three (US, France and China) there could be observed a prevalence of visas granted for the category
Employment in a Brazilian Multinational, followed by visas granted for Transfer of Technology. Among the four,
only Japan, third in the list, has an inverse relationship, with a slight prevalence of visas granted for Transfer of
Technology over those conceded for Employment in a Brazilian Multinational. Peru, in tenth position among the
countries which most send workers with 17 years of study or more to Brazil between 2006 - 2011, stands out due
to the relatively high number of visas granted for Professors or Researchers. It is important to call attention to the
fact that the work visas granted to researchers amount to only 338 visas.
Perc
en
tag
e o
f h
igh
ly e
du
cate
d v
isas
Germ
an
y
Fra
nce
Italy
Jap
an
Sp
ain
Ho
llan
d
Po
rtu
gal
Ch
ina
Mexic
o
Peru
Can
ad
a
Co
lom
bia
US
Ind
ia
Gre
at
Bri
tain
No
rway
Ven
ezu
ela
Belg
ium
Sw
ed
en
Ko
rea
To
tal o
f v
isas
Percentage of highly educated foreigners over total Visas for 4 years or more Temporary Visas
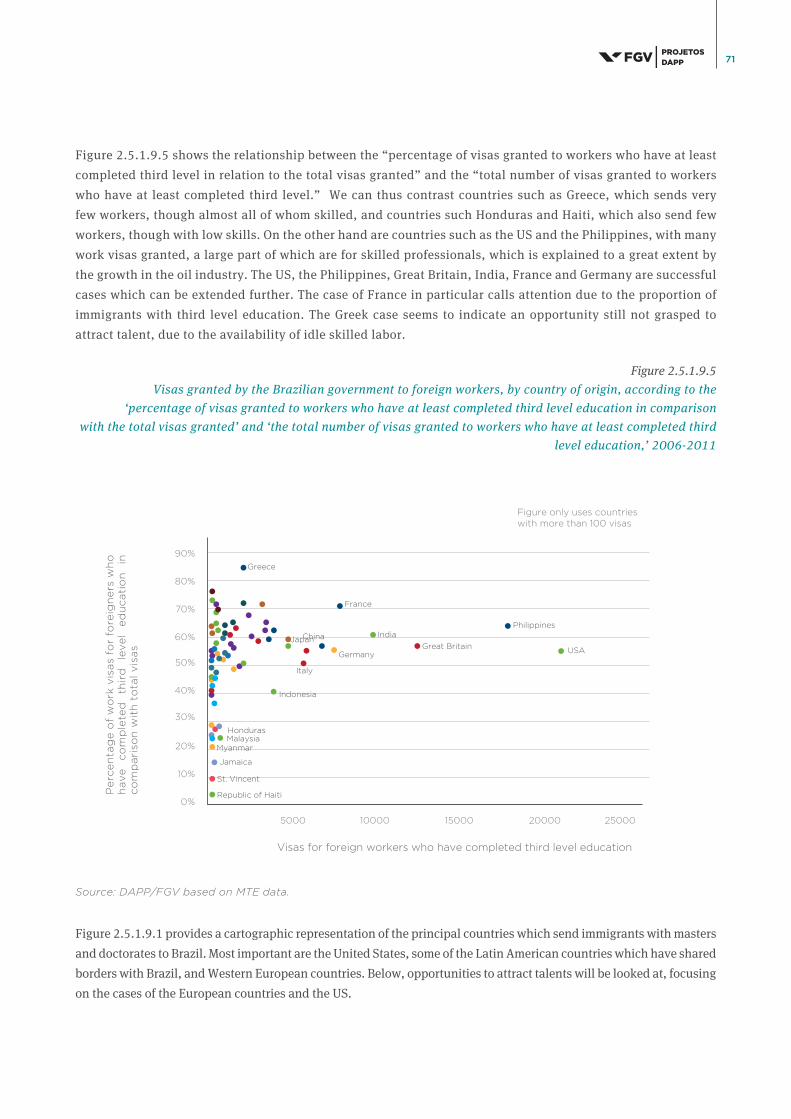
71
Figure 2.5.1.9.5 shows the relationship between the “percentage of visas granted to workers who have at least
completed third level in relation to the total visas granted” and the “total number of visas granted to workers
who have at least completed third level.” We can thus contrast countries such as Greece, which sends very
few workers, though almost all of whom skilled, and countries such Honduras and Haiti, which also send few
workers, though with low skills. On the other hand are countries such as the US and the Philippines, with many
work visas granted, a large part of which are for skilled professionals, which is explained to a great extent by
the growth in the oil industry. The US, the Philippines, Great Britain, India, France and Germany are successful
cases which can be extended further. The case of France in particular calls attention due to the proportion of
immigrants with third level education. The Greek case seems to indicate an opportunity still not grasped to
attract talent, due to the availability of idle skilled labor.
Figure 2.5.1.9.5
Visas granted by the Brazilian government to foreign workers, by country of origin, according to the
‘percentage of visas granted to workers who have at least completed third level education in comparison
with the total visas granted’ and ‘the total number of visas granted to workers who have at least completed third
level education,’ 2006-2011
Source: DAPP/FGV based on MTE data.
Figure 2.5.1.9.1 provides a cartographic representation of the principal countries which send immigrants with masters
anddoctoratestoBrazil.MostimportantaretheUnitedStates,someoftheLatinAmericancountrieswhichhaveshared
borders with Brazil, and Western European countries. Below, opportunities to attract talents will be looked at, focusing
on the cases of the European countries and the US.
Pe
rce
nta
ge
of
wo
rk v
isas
for
fore
ign
ers
wh
o
hav
e
co
mp
lete
d
thir
d
lev
el
ed
ucati
on
in
co
mp
ari
son
wit
h t
ota
l v
isas
Visas for foreign workers who have completed third level education
Figure only uses countries with more than 100 visas
Greece
France
ChinaJapan
Germany
India
Italy
Indonesia
HondurasMalaysia
Jamaica
Philippines
Great Britain USA
Myanmar
St. Vincent
Republic of Haiti
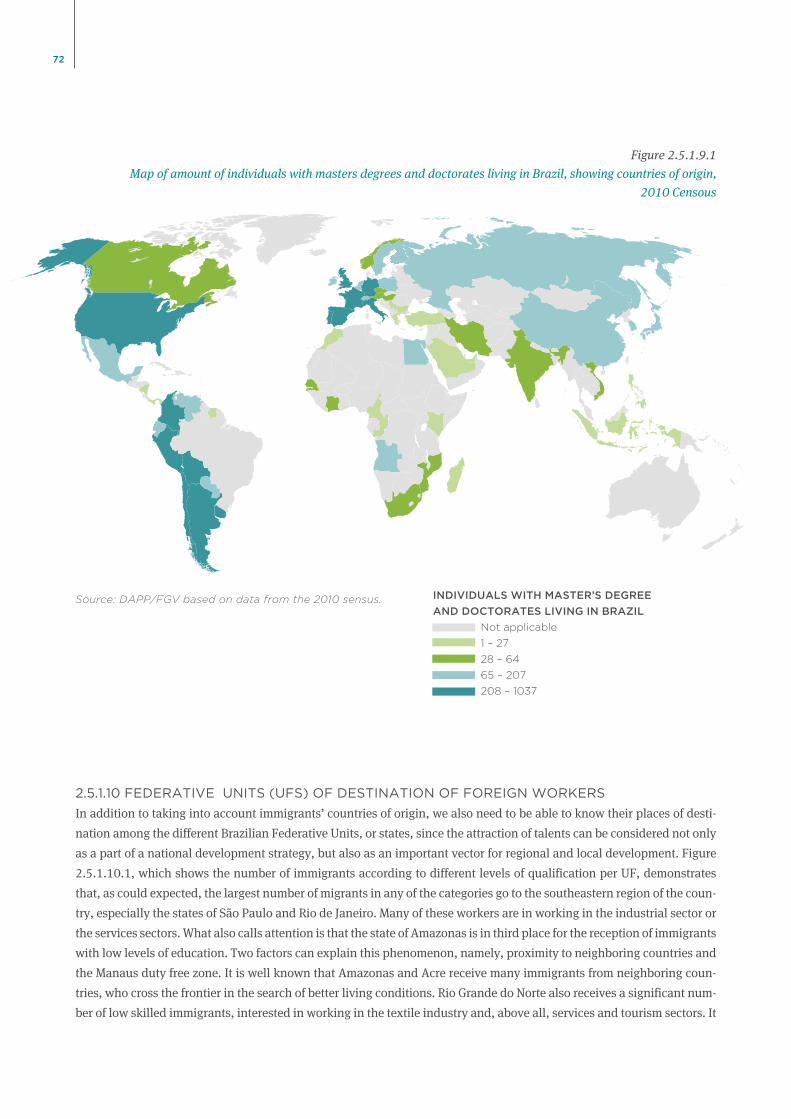
72
Figure 2.5.1.9.1
Map of amount of individuals with masters degrees and doctorates living in Brazil, showing countries of origin,
2010 Censous
2.5.1.10 FEDERATIVE UNITS (UFS) OF DESTINATION OF FOREIGN WORKERS
In addition to taking into account immigrants’ countries of origin, we also need to be able to know their places of desti-
nation among the different Brazilian Federative Units, or states, since the attraction of talents can be considered not only
as a part of a national development strategy, but also as an important vector for regional and local development. Figure
2.5.1.10.1, which shows the number of immigrants according to different levels of qualification per UF, demonstrates
that, as could expected, the largest number of migrants in any of the categories go to the southeastern region of the coun-
try, especially the states of São Paulo and Rio de Janeiro. Many of these workers are in working in the industrial sector or
the services sectors. What also calls attention is that the state of Amazonas is in third place for the reception of immigrants
with low levels of education. Two factors can explain this phenomenon, namely, proximity to neighboring countries and
the Manaus duty free zone. It is well known that Amazonas and Acre receive many immigrants from neighboring coun-
tries, who cross the frontier in the search of better living conditions. Rio Grande do Norte also receives a significant num-
ber of low skilled immigrants, interested in working in the textile industry and, above all, services and tourism sectors. It
Source: DAPP/FGV based on data from the 2010 sensus. INDIVIDUALS WITH MASTER’S DEGREE
AND DOCTORATES LIVING IN BRAZIL
Not applicable
1 – 27
28 – 64
65 – 207
208 – 1037

73
is clear that most Brazilian states receive a very low number of immigrants, and if we consider only highly skilled immi-
grants the number is almost insignificant, a fact which indicates the virtual non-existence of local development strategies
based on the attraction of qualified immigrants. It should be highlighted that the concentration of qualified immigrants
in certain places, with the aim of creating clusters of excellence, can be considered an adequate development strategy.
Figure 2.5.1.10.1
Number of visas granted by the Brazilian government to foreign workers per destination States with high (16 years of study
or more), average (9 to 15 years of study) and low (less than or equal to 8 years of study) levels of education, 2006-2011
Figure 2.5.1.10.2 shows the total of foreign researchers per UF. Once again São Paulo and Rio de Janeiro stand out
as the principal centers for receiving foreigners. However, it is interesting that Rio de Janeiro surpasses São Paulo in
relation to the number of immigrants working as professors or researchers. This is due to the large concentration of
centersofexcellenceinthecityofRiodeJaneiro,suchasIMPAandCOPPE/UFRJ.LookingatthesiteoftheInstitute
of Pure and Applied Mathematics (IMPA), at the present (20/08/2012) there are 117 foreigners with doctorates and
post-doctorates in this institution alone, which shows the grandiose impact of the pioneering institutional policy,
established by the former director of the institution and current president of the Brazilian Academy of Science, Jacob
Palis. It is probable that the choice of UF is also due to the low variations in salaries in the sector, which means that
Source: DAPP/FGV based on MTE data.
5000
4000
3000
2000
1000
7000
8000
6000
12000
10000
0
ES
GOSP
PA
AC
RS
PR
AM
RN
MG
PE
MARJ
CE
SC
DF
BA
2443
107313
323
964
96266
248
210
7374
8
94
4223
143
152
11
94
21
21
6
74
99
67
73
20
12
60
4
49
7
29
2
17
2
7
12
21
13066
3
42
895
3592
2900 2492
2342
1883
1060
2121
940 5143 71623
399
Low education level High education level Average education level
Oth
er
Sta
tes

74
other factors, such as landscape, international reputation and quality of life,come to be more relevant at the moment of
the choice of city where it is intended to work. Nonetheless, it is clear that Brazil, as a whole, does not have an efficient
policy for the attraction and maintenance of highly qualified immigrants, especially in relation to the attraction of
researchers as a regional or local development strategy.
Figure 2.5.1.10.2
Number of visas granted to foreign workers in the category
of professor or researcher by state of destination, 2006-2011
Source: DAPP/FGV based on MTE data.
50
40
30
20
10
100
90
80
70
60
0
ES
GO
PB
SE
MS
SP PI
RS
PR
AM
MT
PA
RN
MG
PE
MARJ
CE
SC
DF
BA
92
67
28 2625
19
15 1211 10
7 6 64
Table IV, which can be analyzed in appendices, shows the cross-tabulation between destination State of foreign
workers with 17 years of study or more and the category of visa granted between 2006 and 2011. In both the principal
destination states, the main category of work visa granted is Employed in a Brazilian Multinational, followed by
Transfer of Technology. The divergence occurs in relation to third position which in São Paulo is Temporary Work,
and in Rio de Janeiro Professor or Researcher.
Table V, which appears in the appendices, presents a cross-tabulation between the country of origin (Top 10) and
the destination UF of foreigners who have work visas and 17 years of study or more (2006-2011). From this it can
be seen that the destination of migrants with high levels of education is the São Paulo-Rio axis. São Paulo state has
the highest level of foreigners from any of the ten countries considered. Among the immigrants who go to São Paulo,
the largest group are the Americans, followed by Japanese and French. In the case of immigrants who go to Rio de
Janeiro, the majority are American, followed by French and Chinese.
5 53 3 2 1 1
Nu
mb
er
of
vis
as

75
During its history Brazil has received various waves of immigration. However, in the last three decades Brazil has
gradually stopped being a destination country to become a country of origin for migrants. The economic crises of
the 1980s and 1990s were determinant in this transition. Nonetheless, due to good economic results, and the social
advances and political protagonism in the international scenario achieved in recent years, the country may return to
be an important destination for migrants.
A significant increase in the number of immigrants coming to Brazil is already noticeable. There also has been a
considerable increase in the proportion of skilled workers receiving visas to work in the country. A change in the
profile of immigrants has also been noted in relation to the principal countries of origin, with the number of immigrants
comingfromLatinAmericancountries,theUSandChinahavingincreased.Inrelationtothehighlyskilledimmigrants,
the US, France, Japan and China are important as countries of origin. Taking into account the total of immigrants with
at least third level, the US and the Philippines stand out, the latter with an even higher proportion of immigrants with
third level in relation to the total of immigrants from the same origin.
Part of this immigration is propelled by the significant presence of multinational corporations in the country, with the
development of the oil and maritime industries deserving special mention. However, it is important to highlight that
most of the visas granted to foreign workers in recent years are temporary. A prevalence of immigration with destinations
of urban centers can be observed. The most important destinations are the states of São Paulo and Rio de Janeiro. There
is thus a need for a policy aimed at the attraction of skilled immigrants as a vector of national development which can
also take into account development opportunities at the regional and local levels. The Brazilian government can, by
implementing policies strategically oriented towards the attraction and retention of skilled professionals, take better
advantage of its current status in the international scenario in order to continue with the advances already achieved in
the economic, social and geopolitical fields.
2.6 UNEMPLOYMENT RATES IN EUROPEAN COUNTRIES AND BRIEF ANALYSES, INCLUDING THE US
• Opportunities for policies to attract highly skilled professionals from European countries due to the
unemployment caused by the international crisis.
• Taking as a universe the European countries and the United States, Brazil should look for highly skilled
laborasapriorityintheUS,Latincountries(France,Portugal,ItalyandSpain),GermanyandGreatBritain.
• We have to be able to prepare public policies to attract skilled labor which can take into account the deficits
in the Brazilian labor market and the availability of skilled labor in other countries, in accordance with a
strategic perspective of national development.
SUMMARY

76
According to UN data, in 2009 global unemployment rose 0.9% in comparison with two years previously, reaching
6.6%. From 2008 to 2009, the unemployment rate in the G7 countries jumped from an average of 5.9% to around 8%.
The estimate for the end of 2012 is 7.7%.89 This increase in unemployment rates constitutes an opportunity for Brazil
in the search for skilled labor in the global market, with the aim of overcoming the specific needs of its market through
the hiring of foreigners. In this subsection we use the example of European countries, including the US in some cases,
by way of example, due to the great abundance of data available in the Eurostat database.90
The lack of opportunities is present in all the sectors of the labor market. Even in sectors such as ‘Sciences, Mathematics
and Computing’ and ‘Engineering, Industry and Construction,’ of which Brazil has a flagrant need, we can observe
rates of unemployment of 7.5% and 5.4%.
Figure 2.6.1
Unemployment rate in European countries, per area of study and age groups, 2003-2007
9,7
7,5 7,5
5,4
7,9
4,5
2,6
5,1
3,83,6
3,12,8
2,2
4,4
2,3
3,8 3,63,1
4
3,5
1,6
3,9
10%
8%
6%
4%
2%
0%
Source: DAPP/FGV based on Eurostat data
Figure 2.6.2 shows that the unemployment rate among people with at least third level education and aged between
20 - 34 years is very high in various European countries, including ones which traditionally send migrants to
Brazil. such as Italy (12%), Turkey (11%), Portugal (10%), Spain (10%) and France (7.5%). The European Union,
6,0
7,0
20 - 34 years35 - 44 years 45 - 54 years
Education
Services
Arts and Humanities
Social Science, Business and Law
Sciences, Math and Computing
Engineering, Industry and Construction
Agriculture and Veterinary Medicine
Health and Welfare
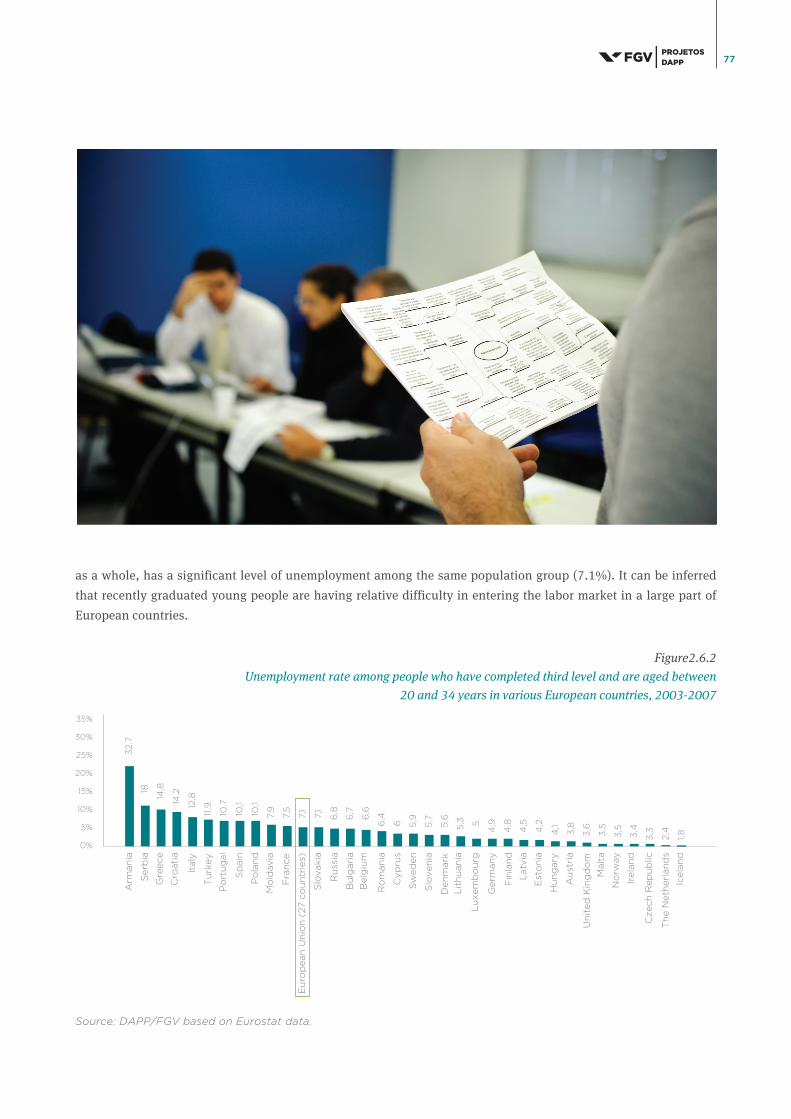
77
as a whole, has a significant level of unemployment among the same population group (7.1%). It can be inferred
that recently graduated young people are having relative difficulty in entering the labor market in a large part of
European countries.
Figure2.6.2
Unemployment rate among people who have completed third level and are aged between
20 and 34 years in various European countries, 2003-2007
Source: DAPP/FGV based on Eurostat data.
Tur
qu
ia
Po
rtu
gal
Esp
an
ha
Mo
ldávia
Po
lôn
ia
Arm
ên
ia
Sérv
ia
Gré
cia
Cro
ácia
Itália
Bélg
ica
Ro
mên
ia
Ch
ipre
Esl
ovên
ia
Din
am
arc
a
Lit
uân
ia
Lu
xem
bu
rgo
Ale
man
ha
Fin
lân
dia
Letô
nia
Est
ôn
ia
Hu
ng
ria
Áu
stri
a
Rein
o U
nid
o
Malt
a
No
rueg
a
Irla
nd
a
Rep
úb
lica T
ch
eca
Ho
lan
da
Islâ
nd
ia
Su
écia
Fra
nça
Esl
ováq
uia
Rú
ssia
Bu
lgári
a
11,9
10,7
10,1
7,910
,1
32.7
18
14,8
14,2
12,8
6,6
6,4
6 5,7
5,6
5,3 5
4,9
4,8
4,5
4,2
4,1
3,8
3,6
3,5
3,5
3,4
3,3
2,4
1,8
5,97
,5
7,1
7,1
6,8
6,7
25%
35%
30%
20%
15%
10%
5%
0%
Po
rtu
gal
Sp
ain
Lu
xem
bo
urg
Icela
nd
Italy
Tu
rkey
Irela
nd
Ru
ssia
Ro
man
ia
Slo
ven
ia
Lit
hu
an
ia
Fin
lan
d
Au
stri
a
No
rway
Fra
nce
Bu
lgari
a
Po
lan
d
Arm
an
ia
Serb
ia
Un
ited
Kin
gd
om
Eu
rop
ean
Un
ion
(27 c
ou
ntr
ies)
Sw
ed
en
Th
e N
eth
erl
an
ds
Gre
ece
Slo
vakia
Mo
ldavia
Latv
ia
Est
on
ia
Cyp
rus
Malt
a
Belg
ium
Czech
Rep
ub
lic
Cro
ati
a
Germ
an
y
Den
mark
Hu
ng
ary
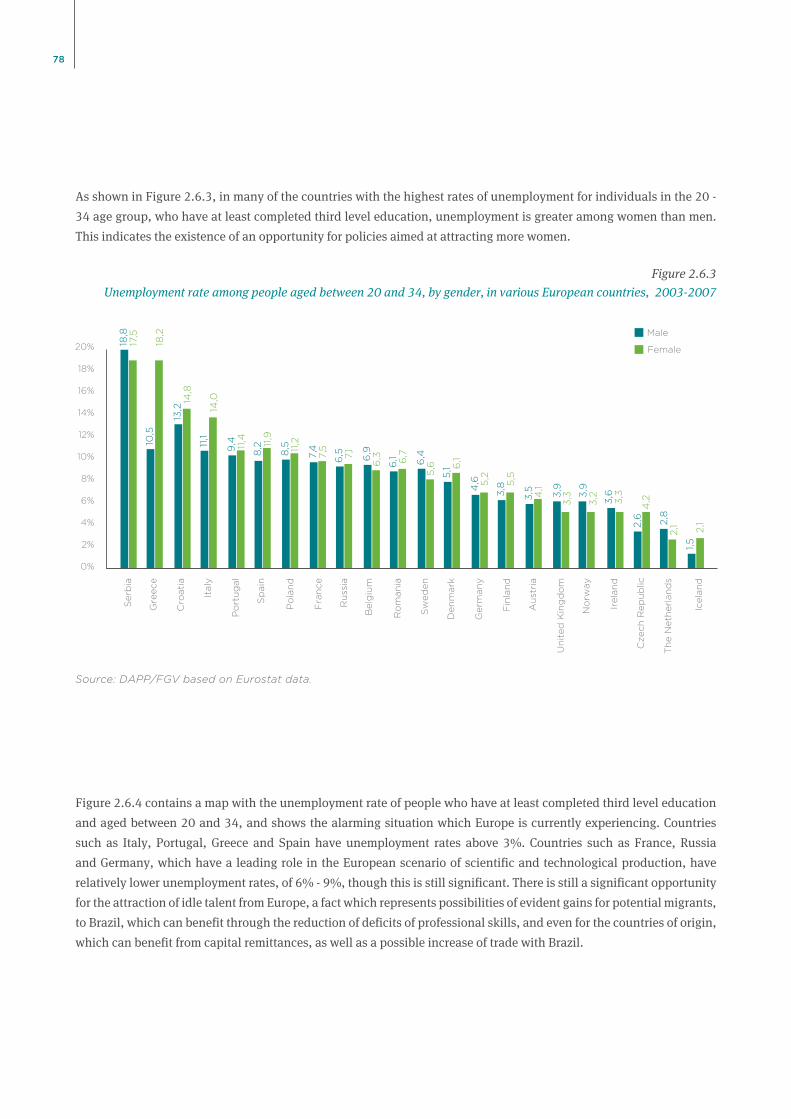
78
As shown in Figure 2.6.3, in many of the countries with the highest rates of unemployment for individuals in the 20 -
34 age group, who have at least completed third level education, unemployment is greater among women than men.
This indicates the existence of an opportunity for policies aimed at attracting more women.
Figure 2.6.3
Unemployment rate among people aged between 20 and 34, by gender, in various European countries, 2003-2007
Figure 2.6.4 contains a map with the unemployment rate of people who have at least completed third level education
and aged between 20 and 34, and shows the alarming situation which Europe is currently experiencing. Countries
such as Italy, Portugal, Greece and Spain have unemployment rates above 3%. Countries such as France, Russia
and Germany, which have a leading role in the European scenario of scientific and technological production, have
relatively lower unemployment rates, of 6% - 9%, though this is still significant. There is still a significant opportunity
for the attraction of idle talent from Europe, a fact which represents possibilities of evident gains for potential migrants,
to Brazil, which can benefit through the reduction of deficits of professional skills, and even for the countries of origin,
which can benefit from capital remittances, as well as a possible increase of trade with Brazil.
Po
rtu
gal
Esp
an
ha
Po
lôn
ia
Sérv
ia
Gré
cia
Cro
ácia
Itália
Bélg
ica
Ro
mên
ia
Din
am
arc
a
Ale
man
ha
Fin
lân
dia
Áu
stri
a
Rein
o U
nid
o
No
rueg
a
Irla
nd
a
Rep
úb
lica T
ch
eca
Ho
lan
da
Islâ
nd
ia
Su
écia
Fra
nça
Rú
ssia
17,5
18,8
18,2
10,5
14,8
13,2
11,1
11,4
9,4 11,9
8,2 11,2
8,5
7,5
7,4
7,1
6,5
6,36,9
6,7
6,1
5,66
,4
6,1
5,1
5,2
4,6 5,5
3,8
4,1
3,5
3,23
,9
3,33
,9
3,3
3,6
4,2
2,6
2,12
,8
2,1
1,5
16%
20%
18%
14%
12%
10%
2%
8%
0%
6%
4%
Source: DAPP/FGV based on Eurostat data.
14,0
Po
rtu
gal
Sp
ain
Icela
nd
Italy
Ru
ssia
Ro
man
ia
Fin
lan
d
Au
stri
a
Fra
nce
Po
lan
d
Serb
ia
Un
ited
Kin
gd
om
Sw
ed
en
Th
e N
eth
erl
an
ds
Gre
ece
Belg
ium
Cro
ati
a
Germ
an
y
Den
mark
Irela
nd
No
rway
Czech
Rep
ub
lic
Male
Female
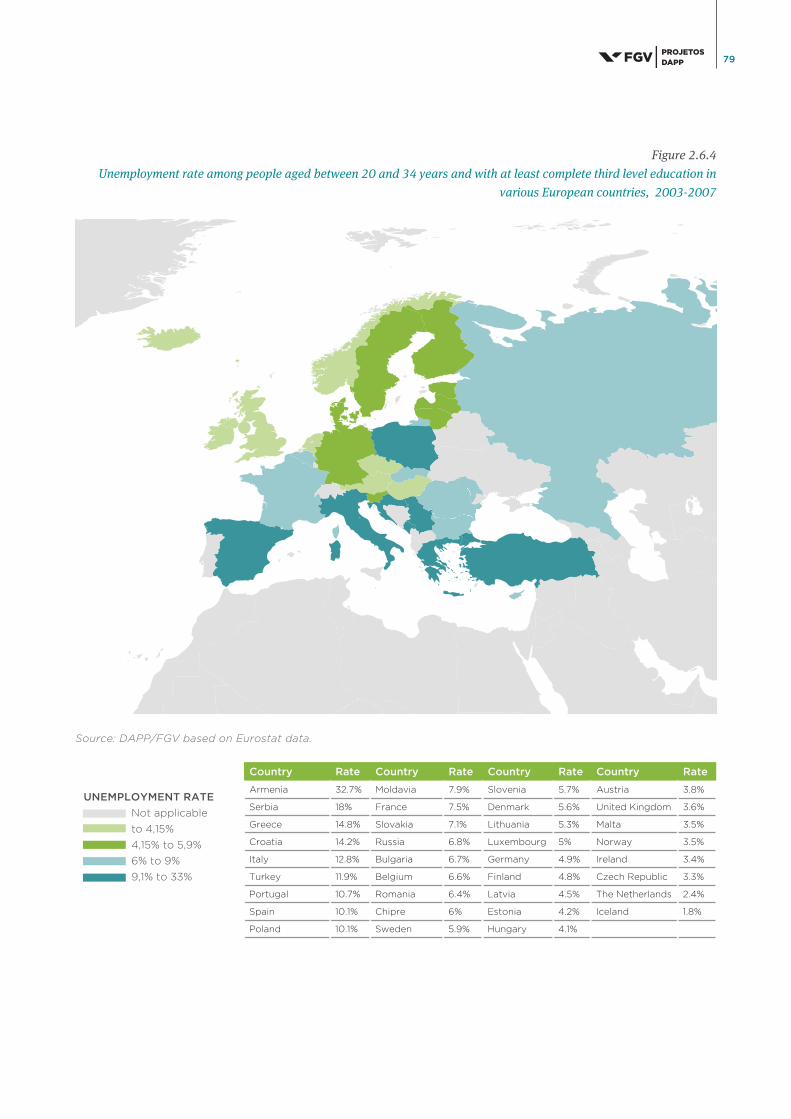
79
Figure 2.6.4
Unemployment rate among people aged between 20 and 34 years and with at least complete third level education in
various European countries, 2003-2007
UNEMPLOYMENT RATE
Not applicable
to 4,15%
4,15% to 5,9%
6% to 9%
9,1% to 33%
Source: DAPP/FGV based on Eurostat data.
Country Rate Country Rate Country Rate Country Rate
Armenia 32.7% Moldavia 7.9% Slovenia 5.7% Austria 3.8%
Serbia 18% France 7.5% Denmark 5.6% United Kingdom 3.6%
Greece 14.8% Slovakia 7.1% Lithuania 5.3% Malta 3.5%
Croatia 14.2% Russia 6.8% Luxembourg 5% Norway 3.5%
Italy 12.8% Bulgaria 6.7% Germany 4.9% Ireland 3.4%
Turkey 11.9% Belgium 6.6% Finland 4.8% Czech Republic 3.3%
Portugal 10.7% Romania 6.4% Latvia 4.5% The Netherlands 2.4%
Spain 10.1% Chipre 6% Estonia 4.2% Iceland 1.8%
Poland 10.1% Sweden 5.9% Hungary 4.1%
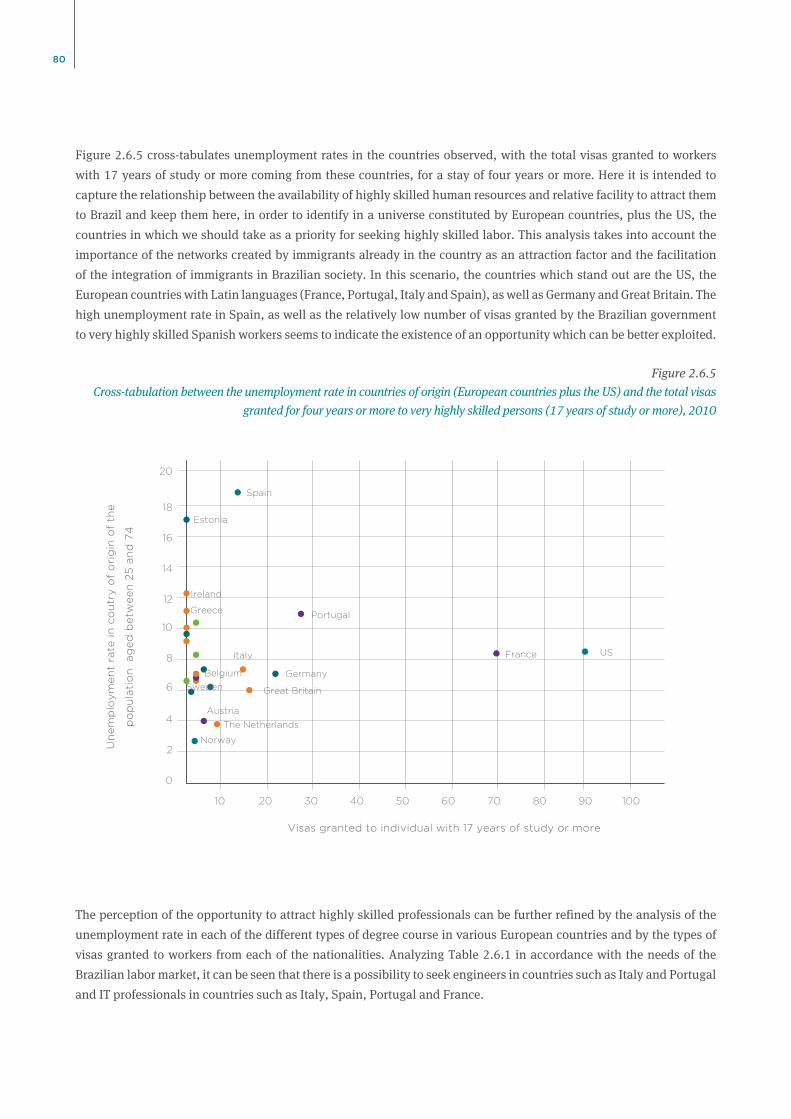
80
Figure 2.6.5 cross-tabulates unemployment rates in the countries observed, with the total visas granted to workers
with 17 years of study or more coming from these countries, for a stay of four years or more. Here it is intended to
capture the relationship between the availability of highly skilled human resources and relative facility to attract them
to Brazil and keep them here, in order to identify in a universe constituted by European countries, plus the US, the
countries in which we should take as a priority for seeking highly skilled labor. This analysis takes into account the
importance of the networks created by immigrants already in the country as an attraction factor and the facilitation
of the integration of immigrants in Brazilian society. In this scenario, the countries which stand out are the US, the
EuropeancountrieswithLatinlanguages(France,Portugal,ItalyandSpain),aswellasGermanyandGreatBritain.The
high unemployment rate in Spain, as well as the relatively low number of visas granted by the Brazilian government
to very highly skilled Spanish workers seems to indicate the existence of an opportunity which can be better exploited.
Figure 2.6.5
Cross-tabulation between the unemployment rate in countries of origin (European countries plus the US) and the total visas
granted for four years or more to very highly skilled persons (17 years of study or more), 2010
The perception of the opportunity to attract highly skilled professionals can be further refined by the analysis of the
unemployment rate in each of the different types of degree course in various European countries and by the types of
visas granted to workers from each of the nationalities. Analyzing Table 2.6.1 in accordance with the needs of the
Brazilian labor market, it can be seen that there is a possibility to seek engineers in countries such as Italy and Portugal
and IT professionals in countries such as Italy, Spain, Portugal and France.
10 20 30 40 50 60 70 80 90 100
10
8
6
4
2
18
20
16
14
12
0
Un
em
plo
ym
en
t ra
te in
co
utr
y o
f o
rig
in o
f th
e
po
pu
lati
on
ag
ed
be
twe
en
25
an
d 7
4
Portugal
Spain
Italy
Austria
Norway
France
Sweden
The Netherlands
Greece
Estonia
Belgium Germany
Ireland
US
Great Britain
Visas granted to individual with 17 years of study or more

81
Table 2.6.1
Unemployment rate among people who have at least completed third level and aged between 20 and 34 years, by
selected degree areas (selected countries in accordance with previous figures), 2003-2007
Source: FGV/DAPP based on Eurostat data.
Countries Education
Social Sciences.
Business
And Law
Sciences.
Maths and
Computing
Engineering.
Industry
and
Construction
Agriculture
and
Veterinary
Medicine
Health and
Well-being
Belgium 4,7 7 5,8 4,6 7,2 3,3
Germany 3,9 4,2 5,6 4,7 3,4 4,2
Spain 11,5 10,4 10,7 5,9 13,2 9,1
France 2,1 8,7 7,5 6,3 6,4 3,3
Italy 10,1 13,5 12,8 8,6 15,9 6,6
Portugal 13,7 9,7 10,8 8,5 7,5 6,5
United Kingdom 1,6 3,3 4 2,3 3,6 1,7
Norway 1,7 2,8 3,5 3,5 7,2 1

82
50
40
30
20
10
70
80
90
100
60
0
7
5
8
16
54
11
8
21
38
37
5
13
25
33
9
12
419
32
9
2
244
8
Figure 2.6.6 shows the type of visas by country of origin. The great importance of France can be noted, followed by the
US, for visas granted in the areas of science and technology or the provision of technical assistance services. Spain was
in third, having a considerable proportion of its total visas in this category. In relation to visas granted to professors or
researchers, the US and France are in joint first place, followed by Portugal.
Figure 2.6.6
Number of visas granted by the Brazilian government to very highly skilled foreign workers
(17 years of study or more), by countries of origin (countries selected in accordance with previous figures), 2010
Source: FGV/DAPP based on MTE data.
Others: Foreigner individual investor, third level or professional intern, artistic or sporting, cases omit-
ted by the National Immigration Council, working on board foreign vessels or platforms.
Portugal SpainItalyFrance GermanyUSA Great Britain
Employed by an organization established in Brazil
Administrator, manager, executive director with administrative powers, of a civil or commercial company, group, or economic conglomerate
Transfer of technology and/or rendering of technical assistance services
Visas for professors or researchers
Others
83
The preceding analyses can be broken down still further in accordance with specific needs. If, for example, we consider as
an objective the promotion of development in advanced scientific areas, an adequate path would be to carry out specific
research about renowned professionals and promising young talents working in the areas listed as strategic in the Action
Plan - Science, Technology and Innovation for National Development, 2012-2015, published by the Ministry of Science and
Technology (MCT). These are to be attracted in each of the countries prioritized for obtaining talent.
There is great unemployment in Europe, including in areas which Brazil is suffering shortages, such as engineering and ICT.
Among the countries with the highest rates of unemployment, the proportion of unemployed women is in most cases higher
than the men. In Europe there are also elevated unemployment rates among young people with third level education. These
facts, as well as the opportunities created by them, have to be taken into account in the preparation of policies to attract
skilled professionals. In the universe constituted by European countries and the US, considering the relationship between the
availability of highly skilled human resources and relative facility to attract them, and the importance of the network created
byimmigrantsalreadyinthecountryasattractionfactors,theUS,someoftheEuropeancountrieswithLatinlanguages
(France, Portugal, Italy and Spain), as well as Germany and Great Britain, should be the privileged focus of Brazilian policy
for the attraction of talent. We have to be capable of implementing public policies to attract skilled labor which can take into
account the deficits in the Brazilian labor market and the availability of skilled labor in the other countries, in accordance
with a strategic perspective of national development.
2.7 INSTITUTIONAL STRUCTURE NECESSARY FOR THE OPERATIONALIZA-TION OF IMMIGRATION POLICIES
• BrazilianimmigrationpolicyiscurrentlyguidedbyLaw6815,dated19August1980,whichwasdrafted
under the emergency legislation enacted by the military regime, and lacks instruments to carry out an
immigration policy concerned with the national interests of economic development, being based on the
sole perspective of national security.
• The system for administering international migrations in Brazil is the result of the work of the National
Immigration Council (CNIg) and centers on the perspective of valorizing social inclusion and the
guarantee of human rights.
• A fragmentation of the monitoring of immigration in Brazil can be noted, since this function is distributed
amongfouragencies:MinistryofJustice,MinistryofLaborandEmployment,MinistryofForeignAffairs
and the Federal Police.
• There is an urgent need to promote instruments to allow the Federal Government to create an agenda for
the construction of efficient public immigration policies.
• The possibility of implementing a strategic policy in relation to the question of foreigners in Brazil
depends on greater coordination between the organs of the Brazilian government and the establishment
of the systemic sharing of information, which will allow better control, monitoring and administration.
SUMMARY
84
In the Brazilian case, the possibility of taking advantage of the positive consequences of international mobility are
stillhinderedbyaseriesofinstitutionalandjudicialobstacles.BrazilianimmigrationpolicyisstillguidedbyLaw
6.815, dated 19 August 1980, which was drafted under the emergency legislation enacted by the Military Regime,91
and lacks instruments to guide an immigration policy aimed at the national interest of economic development. This
policy is based on the exclusive perspective of the question of national security,92 although, even in this case, it is
insufficient to take account of the features which the question of borders now assumes.
The current system for administering international migrations in Brazil is the result of the work of the National
Immigration Council (CNIg). CNIg’s work is most important in the attempt to valorize social inclusion and the
collective participation public policies instruments in Brazil. However, the institution restricts its work principally to
the most structural questions, which place immigrants in social situations of risk. These are the lack of integration,
bad working conditions, and the illegal exploitation of child labor, among the other social ills to which they are
exposed. CNIg plays an important role in the administration of migrations in Brazil. However, the institution is not
responsible for the task of formulating long-term migratory policy with the objective of socio-economic development.
Nevertheless,itisworthnotingthespiritofthecurrentForeignersLaw,whichstatesinarticle16:
Sole paragraph –Immigration shall aim at, above all, the provision of specialized labor in various sectors of
the national economy, targeting the National Development Policy and all of its aspects, especially increased
productivity, the assimilation of technology and the raising of resources for specific sectors.
In order to present data which can help give a dimension of the flows of skilled migrants from different countries
toBrazil,thisstudydrawsondatafromdifferentsources,namely,theMinistryofJustice,theMinistryofLaborand
Employment (2006 to Dec. 2011) and the 2010 Census. One of the most staggering conclusions of our analyses is that
thereareseriousproblemswiththeMinistryofLabordatabases.Here,amongthe264,476workvisasresearched,3113
duplicated records were found. In addition, we found problems with erroneous dates of birth (for example 11/06/0070
or 16/02/0078), dates of birth after the date of entering Brazil, children with work visas, ages inconsistent with level
of education (for example secondary school completed at the age of 11, or university degrees at 15), amounting to 225
corrected cases.
A fragmentation of the monitoring of immigration in Brazil can be perceived, since this function is distributed among four
principalagencies:MinistryofJustice(MJ),MinistryofLaborandEmployment(MTE),MinistryofForeignAffairs(MRE)
and the Federal Police (PF). However, the division of jurisdictions is not clear, since some of these agencies function as an
interface for the actions of the others, which can create confusion about the delimitation of their jurisdiction. The low level of
integration of data between ministries means that information about the profile of foreigners who enter Brazil is lost, and the
Federal Government is not given the necessary support for the preparation of an agenda to construct efficient public policies
dealing with immigration.
We found that national control of immigration is both insufficient and inefficient. In fact the immigration control system is
fragmented; there is a low degree of control over the departure of foreigners, with only some inconsistent databases being
dispersed among the different agencies. The state structures concerned with security, internal control and border control are
in need of urgent improvement. Here we would like to highlight the risks of neglecting the creation and administration of
adequate policies for the control of immigration and the attraction of skilled labor. For this the first step has to be the proper
collection and analysis of data. There is thus an urgent need to anticipate future challenges, constructing scenarios about
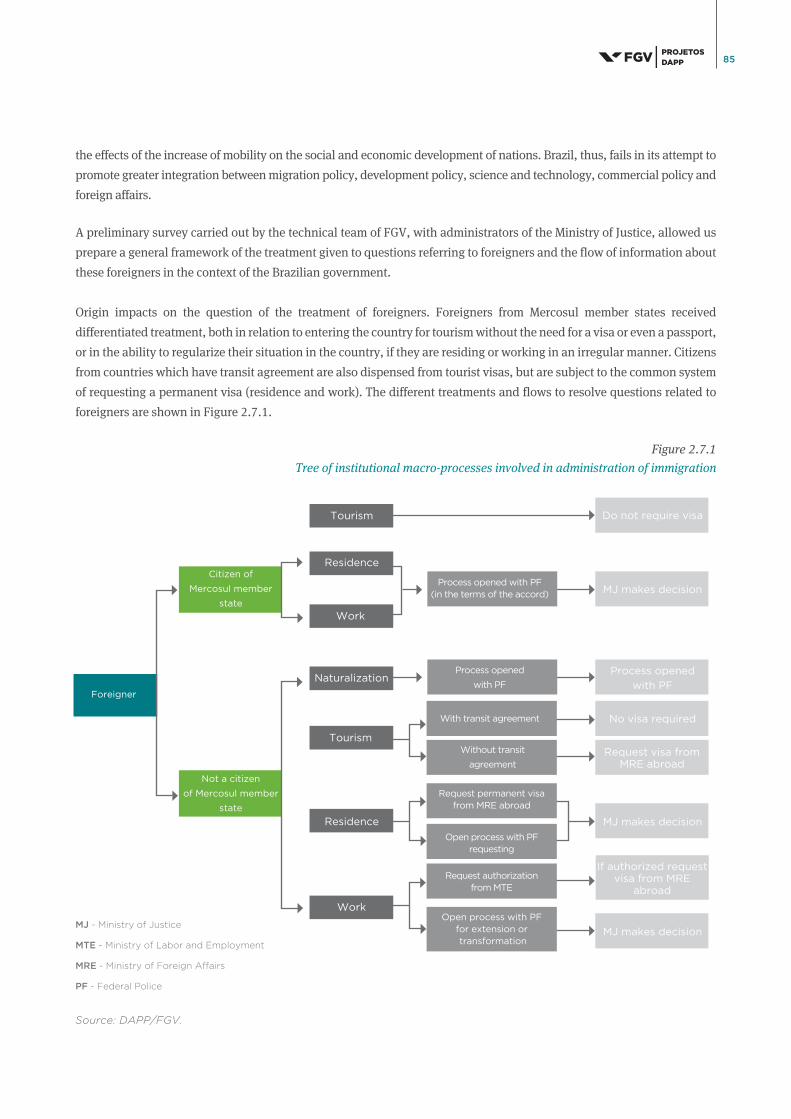
85
Source: DAPP/FGV.
Foreigner
Citizen of
Mercosul member
state
Process opened
with PF
With transit agreement
Without transit
agreement
Request permanent visa from MRE abroad
Open process with PFrequesting
Request authorization from MTE
Open process with PFfor extension or transformation
Process opened with PF (in the terms of the accord)
Tourism Do not require visa
MJ makes decision
Process opened
with PF
MJ makes decision
MJ makes decision
No visa required
Request visa from MRE abroad
If authorized request visa from MRE
abroad
Residence
Work
Naturalization
Tourism
Residence
Work
Not a citizen
of Mercosul member
state
the effects of the increase of mobility on the social and economic development of nations. Brazil, thus, fails in its attempt to
promote greater integration between migration policy, development policy, science and technology, commercial policy and
foreign affairs.
A preliminary survey carried out by the technical team of FGV, with administrators of the Ministry of Justice, allowed us
prepare a general framework of the treatment given to questions referring to foreigners and the flow of information about
these foreigners in the context of the Brazilian government.
Origin impacts on the question of the treatment of foreigners. Foreigners from Mercosul member states received
differentiated treatment, both in relation to entering the country for tourism without the need for a visa or even a passport,
or in the ability to regularize their situation in the country, if they are residing or working in an irregular manner. Citizens
from countries which have transit agreement are also dispensed from tourist visas, but are subject to the common system
of requesting a permanent visa (residence and work). The different treatments and flows to resolve questions related to
foreigners are shown in Figure 2.7.1.
Figure 2.7.1
Tree of institutional macro-processes involved in administration of immigration
MJ - Ministry of Justice
MTE - Ministry of Labor and Employment
MRE - Ministry of Foreign Affairs
PF - Federal Police

86
The flow in the format of a decision tree presented in Figure 2.7.1 shows that there are three principal types of
treatment. First, a dichotomy between foreigners from Mercosul member states and from other countries. There
is also a specific flow for questions referring to naturalization in which the treatment given to the foreigner
depends on their origin.
In the case of foreigners coming from Mercosul member states, there is no need for a tourist visa, while visas
for residency and work follow the usual procedures. For foreigners from other countries, whether or not there
is a need for a tourist visa depends on international transit agreements. Requests for permanent visas for these
foreigners follow different procedures, depending on whether they are in the country or abroad. Requests for
work visas always follow the same procedure.
It can be seen that the geo-political situation has a strong influence on questions related to foreigners, including
here both the country of which the foreigner is a citizen and the place where he is located (inside Brazil or
abroad). Questions related to foreigners outside the country are dealt with by MRE in Brazilian consulates in
other countries. MRE decides on questions of tourist visas for foreigners, its essential competence, and also
functions as an intermediary between foreigners outside Brazil and the MJ, for requests for permanent visas
(residency), and MTE, for requests for work visas.
In turn, the Federal Police (PF), implements migratory control on borders, its essential competence, but
also functions as an intermediary between foreigners in Brazil and the MJ, for requests for permanent visas
(residency), requests for extensions and transformations of work visas and requests for naturalization, as well
as work visas and permanent visas for foreigners from Mercosul member states. Only with explicit authorization
can foreigners make their request directly to the MJ. Requests for work visas for foreigners in the country, in
turn, have to be directly submitted to the MTE.
This profusion of competencies and the overlapping of procedures and mandates results in a proliferation
of autonomous and isolated computerized systems, which results in the fragmentation of information about
foreigners in Brazil.
The PF has several different registration systems, including the Foreigner Registration System (Sincre), the
International Trafficking System (Sinte) and the Process Monitoring System (Siapro), as well as an older version
of the International Trafficking System called STI. The MJ uses Siapro for processes in its jurisdiction and
possesses data referring to naturalization processes (of its exclusive jurisdiction), as well as access to other
systems administered by the PF.
The other agencies have their own systems, without any communication between them. Different flows and the
absence of coordination produces incomplete information, which creates negative impacts on the administration
of foreigners in Brazil and on the possibility of implementing effective policies related to the international
trafficking of persons.
87
An example of this problem is the isolation of the Federal Revenue Service (Receita Federal - RF) in regard to
the other agencies which have jurisdiction in relation to the question of foreigners in the country. RF databases
contain information about economically active foreigners who declare they have an income and pay tax in
Brazil. However, due to the absence of the exchange of information, it is not possible to know if they are legally
carrying out economic activity in the country. Nor, on the other hand, is it possible to know if the foreigners
who enter Brazil to carry out economic activity are declaring their incomes and paying taxes.
As a result the preliminary investigation of the information flow about foreigners in the different Brazilian
government agencies allows us draw some conclusions in the field of applied public policies. The implementation
and effectiveness of public policies concerning the international trafficking of people depends on the existence
of an information system which allows questions related to foreigners in Brazil to be identified, monitored and
administrated both at an individual level and in the treatment of aggregates which produce administrative
knowledge capable of guiding policymaking. The fragmentation of jurisdictions for questions related to
foreigners in Brazil has been accompanying the absence of a coordinated systematic between the agencies
which possess these jurisdiction. The possibility of formulating a public policy on foreigners in Brazil depends
on greater coordination between Brazilian government agencies and the establishment of a systemic sharing
of information, in order to allow greater control, monitoring and administration of foreigners who live in the
country.

88
89
IIICONCLUSION
AND SUMMARY OF MAIN POINTS
90
The increase in human mobility, caused by the revolution in transport, associated with the explosion in the
communication of information allowed by the development of telecommunications and information technology,
converging on an increasingly integrated global economy, with increasingly interdependent national markets,
implies that the political unity of nation states is increasingly thought of in terms of their permeability to the
flows of persons, goods, services and information.
In first place migration policies need to be discussed together with economic and commercial policies, in the
wake of negotiations carried out in multilateral bodies. The lack of cooperation between countries of origin,
transit and destination causes a challenge in terms of the regulation of migration flows, especially in the
current context of global interdependence. Unlike market and capital flows, migration policies tend to be
unilateral and restrictive. While the World Trade Organization (WTO) observes market negotiations, and the
International Monetary fund (IMF), together with the Global Financial Board (GFB), manages capital mobility,
no organizations regulate migration.
Another important challenge results from the fact that state bureaucracies are vertically structured, and
that the limits of jurisdiction of different governmental agencies are distributed in accordance with specific
themes. Public immigration policies need to orthogonally cut across these bureaucratic agencies and spheres
of responsibility, and thus require an extraordinary capacity for coordination among government agencies, in
relation to both planning and implementation. Immigration control policies have to take into account themes
as diverse as skill deficits in the labor market, strategic planning of ST&I policy, partnerships and nexus of
cooperation which are intended to be developed in the area of foreign affairs, the internal security system of
the country, the translating and validation of documents from different education systems, questions related to
the administration of ethnic conflicts, and social integration, amongst others.
The preparation of an immigration policy should take into account a large number of themes, involving various
government agencies (justice, labor, education, minority rights, security, social insurance, development etc.).
In addition, it is important to note that the responsibility for the administration of a mobility system is not solely
that of the individual states, but is distributed among different levels of governance: sub-national governments;
national governments in unilateral, bilateral, or multi-lateral arrangements; regional arrangements (including
supra-national actors such as Mercosul); global organizations (such as the World Trade Organization), and even
multinational mega-corporations. The importance of each of these actors varies in function of socio-historical
scenarios and specific geopolitical arrangements.
In a new international mobility system government can no longer be guided by abstract or ideological debates.
What is involved is the search for sets of incentives and restrictions, taking into account skill deficits in the labor
market and the national development strategy in order to attract individuals with determined professionals
profiles, in accordance with the necessary characteristics and qualifications, the expected length of stay, the
propensity to participate in strategic networks, etc. In seeking a strategy to take advantage of migratory flows, it
is fundamental that the different trade-offs be taken in account, in relation to development, achieving balance in
the social insurance system, national security, the promotion of CT&I development, the supporting of minority
rights and national integration, etc. One of the great advances in the political scenario seems to have been the
91
widespread acceptance of the importance of education as a vector for political, economic and civilizational
development. Nevertheless, there is the evident problem that education policies need to be considered in the
mid and long term. A policy for attracting skilled immigrants can offer a much more agile response to the
demand for market skills and also to shorten the generational transition, accelerating the maturation process of
an adequate educational system through the recruitment of skilled staff to train future generations. Immigration
policies have to be implemented together with fundamental reforms in the education and professional training
systems, labor market regulation reforms, and reforms in the health and public security systems, with the aim
of creating competitive economies which can properly serve national interests in the global economy.
92
It is highly probable that human mobility will continue to grow globally. It can also be assumed that Brazilian
demand for immigrants with different levels of skill will continue to grow. As a result, a wide range of public
policies need to be created to control access to the labor market, and which allow the identification, attraction
and retention of highly skilled workers in areas considered strategic for the development of the country.
Attracting talents abroad can be difficult, due to great global competition, especially in the fields of health,
science, information technology, etc. For a successful talent attraction policy, market realities and the best
incentives to be offered to prospective immigrants have to be considered, as well as relational networks and the
role of different social groups in decision making.
Brazil has been capable throughout its history of molding instruments of state to help meet the challenges it
has faced. Currently in relation to themes such as models of development in a globalized economy, questions
such as the relationship between socio-economic development, advanced ST&I development, and immigration
policies concerned with attracting qualified immigrants, emerge as increasingly urgent challenges. There can
thus be observed a deficit of the integration of normative, policy, and analysis instruments as the foundation
for the preparation and monitoring of efficient public policies concerned with the theme of immigration as a
vector for development. Brazil needs to improve the integration of its immigration policies with its industrial
development, ST&I, human rights, security, labor, and foreign policies. At the present historic moment there
is a need for the responsible institutions and their intra-governmental agreements to be improved in order to
stimulate in a concerted manner the normative and institutional advances necessary for the implementation of
an immigration policy which can meet the national interest.
In order to more efficiently make public policies to regulate migratory flows, it is essential that there are efficient
methods to collect and systematize data, and that there is a statistical analysis capacity, as well as methods
of sharing data among countries. Brazil counts on the advantage of having solid state structures. As well as
updating normative frameworks, the country could benefit from the creation of a specific agency, capable of
catalyzing initiatives, institutionally strengthening the existing structures and integrating its administration in
the joint political command of the ministries involved.
The set of reflections developed in this study allowed us establish some directives which should guide the
preparation of rational, systemic and well founded public policies, aimed at attracting skilled immigrants as a
vector of the socio-economic development of the country. These are:
• Be based on the analysis of the conditioning factors of migratory flows and the projection of the
impacts of migrations.
• Consider the perspectives of the populations of countries of origin, of Brazilian society and the migrant
population to achieve responsible policies.
• Guarantee the human rights of the immigrant population.
• Harmoniously integrate immigrants in Brazilian society.
• Protect Brazilian workers.
• Ensure the maintenance of national security.

93
• Consider demographic development, as well as economic cycles and tendencies.
• Ensure socio-economic development at the national, regional and local levels.
• Overcome skill deficits in the Brazilian labor market.
• Complement the national development strategy in the area of Science, Technology and Innovation
(ST&I).
• Be connected with the stimulation of the innovative business sector and the strengthening of
entrepreneurialism.
• Seek to contribute to an increase in productivity and to contribute to the aggregate value of the
production of industries based in Brazil.
• Contribute to the development of commercial partnerships at the international level.
• Integrate with geopolitical strategy, taking into account negotiations carried out with multilateral
agencies.
• Involve civil society through a wide-ranging public debate.
• Create faster means, with less bureaucracy, to regularize the situation of highly skilled immigrants.
• Integrate the various state agencies concerned with immigration policy and provide means for the
negotiation of consensus.
• Provide effective tools for coordination, the alignment of information flows, and the accumulation,
cross-tabulation and analysis of data.
• Provide institutional means for effective administration, through the creation of an immigration
agency with multiple jurisdictions, integrating and institutionally strengthening existing state
structures.
94
N0TES
1. Cf.KEELEY,2009,p.12
2. Cf.KEELEY,Op.cit.
3. Cf. SASSEN, 1988.
4. Cf. SASAKI and ASSIS, 2000.
5. Cf. COENTRO, 2011.
6. Cf. FIRMEZA, 2007.
7. Cf. PNUD, 2009.
8. Cf. PATARRA, 2006; and COENTRO, 2011.
9. Cf. MARTINE, 2005; and COENTRO, 2011.
10. Cf. OCDE, 2011b.
11. Cf. COENTRO, Op. cit.
12. Cf. OIM, 2009, p19.
13. Cf. OIM, 2012, p. 68.
14. According to Gouveia, Saenz and Cogua (2011), Venezuela is experiencing increasing political agitation and
alarming levels of criminality. Combined with ideological polarization, this has helped transform Venezuela from
a country of immigrants into a country of emigrants.
15. Cf. OCDE, 2011.
16. Vázquez (2012) argues that the government’s reaction to the general strikes of 2002 and 2003 in the Venezuelan
state oil company triggered a great diaspora of professionals from the oil sector, which continued despite the
increase in the price of a barrel of oil and the international crisis.
17. Cf. OCDE, 2011b.
18. Cf. OCDE, Op.cit.
19. Cf. OCDE, Op.cit.
20. Comissão Independente sobre Migração para Alemanha, 2001, p.26.
21. GOZAapudACCIOLY,2009.
22. Cf.ACCIOLY,2009,p.3.
23. The term ‘brain drain’ – explained as the “migration of intellectuals, the exodus of skills, the migration of talents,
andtheinversetransferoftechnology”(GASERapudACCIOLY,1999,p.16)–isusedhereinthefigurativesense,
without any intention of evoking a biological meaning for the term.
24. ACCIOLY,2009.
25. Cf. COENTRO and MARTES, 2009 apud COENTRO, Op. cit., p.20

95
26. Debate available at: http://www.youtube.com/watch?v=NK0Y9j_CGgM: Below is a transcription of an extract of
whatDr.Kakusays:“HowcomethescientificestablishmentintheUnitedStatesdoesnotcollapse?Letmetellyou
something. Some of you may not know this. America has a secret weapon, that secret weapon is the H1B. Without
the H1B, the scientific establishment of this country would collapse. Forget Google! Forget Silicon Valley! There
would be no Silicon Valley without the H1B. And you know what the H1B is? It is the genius visa, ok? Do you
realize that in the United States 50% of all PhD candidates are foreign born? At my system, one of the biggest in the
United States, 100% of PhD candidates are foreign born. The United States is a magnet sucking up all the brains of
the world, but now the brains are going back.”
27. BORJAS and FRIEDBERG, 2009, p.
28. Cf.CERVANTESandGUELLEC,2012,
29. STRAUBHAAR, 2000, pp.20-21.
30. Cf. IOM, 2010 a, p.11.
31. Cf.CERVANTESandGUELLEC,Op.cit.
32. Cf. COENTRO, Op. cit., p.18.
33. Cf. MARTIN 2006 apud COENTRO Op. cit.
34. Cf. COENTRO, Op. cit., p.19.
35. Cf. COENTRO, Op. cit.
36. Cf.CERVANTESandGUELLEC,Op.cit.
37. Cf. MARU, 2009.
38. CERVANTESandGUELLEC,Op.cit.
39. THE ECONOMIST, 2012.
40. Cf. GIBNEY, 2012.
41. Cf. FERNANDES and DINIZ, 2009.
42. Cf.CERVANTESandGUELLEC,Op.cit.
43. Cf. CHISWICK, 2005 apud COENTRO, Op. cit., p.43.
44. Cf.SELA,2009apudCOENTRO,Op.cit.
45. Cf. RIOS-NETO, 2005.
46. Cf. UNFPA, Op. cit.
47. Cf. COENTRO, Op. cit.
48. Cf. United States Department of Labor, Bureau of Labor Statistics. Data from January 2012 with a seasonal
adjustment, available at: http://www.bls.gov/eag/eag.us.htm.
49. Cf. Data referring to December in the respective years for the population aged 10 or more, calculated for six Brazilian
metropolitan regions: Recife, Salvador, Belo Horizonte, Rio de Janeiro, São Paulo and Porto Alegre, available at the
IBGE site, accessed on 20/06/2012.

96
50. 50. Cf. COENTRO, Op.cit.
51. Cf.ALVES,2008.
52. Cf.ALVES,Op.Cit.p.11.
53. Cf. BRITO, F., 2010.
54. Cf.MAGALHÃES,J.P.deAlmeidainSAMPAIO,1988.
55. OIM, 2012, p.67.
56. MCGURK, 2010.
57. Cf. OCDE 2010b.
58. Cf. HANUSHEK e WOESSMANN, 2008 apud OCDE 2010b.
59. The Aon Hewitt People Risk Index classifies risk in relation to difficulties with recruitment, the employment and
reintegration of people, comparing 30 factors in 131 locations in the world on scales constructed in accordance
with a common rationality. Each of the 30 factors has a scale of 10 points associated with five statements. The
lowest possible classification in general (no risk) is 25 points and the highest possible classification (maximum
risk) is 250 points. The 30 factors are organized in five categories, or clusters: (i) Demographic Risks: associated
withthesupplyoflabor,theeconomyandsociety;(ii)RisksLinkedwithGovernmentalSupport:associatedwith
governmentalaction,whetherpositiveornegative,inrelationtotheadministrationofpeople;(iii)RisksLinked
totheEducationalSystem:associatedwiththedifficultyoffindingskilledprofessionals;(iv)RisksLinkedtothe
Development of Talent: deals with the quality and availability of resources for recruitment and training; and (V)
RisksLinkedtoEmploymentPractices:seeks toevaluate therisksassociatedwithhiringpeople.Formore:Cf.
Table I in the appendices.
60. Cf.FOONGandLIM,2011.
61. Cf. AGHION and HOWITT, 2006 apud OCDE 2010b.
62. The Human Development Index (HDI) is a measure consisting of data about life expectation at birth, education
and per capita GDP (as an indicator of the standard of living) collected at the national level. Every year UN member
states are classified according to these measures.
63. The Knowledge Economy Index (KEI) takes into account whether the environment of the country is suitable for
knowledge to be used effectively for economic development. KEI is calculated based on the average score of the
performance of the region related to the knowledge economy – economic incentive and institutional regime,
education and human resources, the innovation system and government prioritization of information and
communication technology (ICT).

97
64. Cf.ARDICHVIL,ZAVYALOVAandMININA,2012.
65. Cf.ARDICHVIL,ZAVYALOVAandMININA,Op.cit.
66. Cf. IBGE, 2009.
67. Cf.BRASIL,MEC-CAPES,2010.
68. Cf. CGEE, 2010.
69. Cf. IBGE, 2000.
70. For the complete paragraph Cf. Coentro, Op. cit., p.69.
71. Cf. OCDE, 2009.
72. Cf. RICHMOND, 1988.
73. Cf. SASAKI and ASSIS, 2000.
74. Cf. THOMAS and ZNAIECKI, 1984.
75. Cf. GABACCIA, 1992.
76. Cf. HARRIS and TODARO, 1970 apud SASAKI and ASSIS, Op. cit.
77. Cf. PORTES,1976.
78. Cf. SASAKI and ASSIS, Op. cit.
79. Cf.STARKandBLOOM,1985apudSASAKIandASSIS,Op.cit.
80. Cf. MASSEY, 1997 apud SASAKI and ASSIS, Op. cit.
81. Cf. BECKER, 2006.
82. OIM, 2012, p.83.
83. Cf. Brasil/MTE, 2012.
84. Cf.CARVALHO,2006.
85. Cf. REZENDE, 2005, p.130.
86. Cf. UNFPA, Op. cit.
87. Cf.GONÇALVES,2008.
88. Revista Você S/A. Os chineses continuam chegando. 08/04/2011. Available at: http://vocesa.abril.com.br/
desenvolva-sua-carreira/materia/chineses-continuam-chegando-628255.shtml
89. Cf. FMI, 2012.
90. The choice of European countries was due to the abundance of EUROSTAT data and not to any form of Eurocentrism.
91. The period of the dictatorship in Brazil.
92. Law6.964,dated9December1981–AltersthedispositionsofLaw6.815.

98

99
APPENDICES
100
ACCIOLY,T.A.Mobilidadedamãodeobraqualificada
no mundo atual: discutindo os conceitos de brain
drain, brain gain, brain waste e brain exchange. In:
ENCONTRONACIONALDAASSOCIAÇÃOBRASILEIRA
DEESTUDOSPOPULACIONAIS,6,2009,Belo
Horizonte. Belo Horizonte: ABEP, 2009.
AGHION, P.; HOWITT, P. Appropriate Growth Policy:
A Unifying Framework, Journal of the European
Economic Association, Vol.4, 2006.
ALEMANHA.TheIndependentCommissionon
Migration to Germany. Structuring Immigration,
Fostering Integration. Berlim, 2001 Disponível em:
http://www.bmi.bund.de/SharedDocs/Downloads/
EN/Broschueren/Structuring_Immigration_-_
Fostering_Id_14625_en.pdf?__blob=publicationFile
acessado em 02/05/2012
ALVES,JoséEustáquioDiniz.Atransiçãodemográfica
e a janela de oportunidade. Instituto Fernand Braudel
de Economia Mundial. São Paulo, 2008.
ANDERSON, B. (org.). Nação e Consciência Nacional.
São Paulo: Ática, 1989. 191 p.
ARDICHVIL,A.,ZAVYALOVA,E.,MININAV.Human
capital development: comparative analysis of BRICs.
Journal of Training and Development, Vol. 36, p.213-
233, 2012.
BALAKRISNAN,G.(org.).Ummapadaquestão
nacional. Rio de Janeiro: Contraponto, 2000. p.334.
BAUER, T.K.; KUNZE, A. The Demand for High-Skilled
Workers and Immigration Policy. RWI Discussion
Paper Series, Nº 11. Alemanha: IZA, p.27, 2003.
BECKER, D.B. The Brazilian Immigrant
Experience: A Study on the Evolution of a
Brazilian Community in Somerville and the
Greater Boston Area. Urban Borderlands. Medley,
MA: Tufts University, p.81, 2006.
BORJAS, G.J. e FRIEDBERG, R.M. Recent Trends in
The Earnings of New Immigrants to the United States.
NBER Working Paper Series. Working Paper 15406.
National Bureau of Economic Research. Cambridge,
MA: 2009. Disponível em: http://www.nber.org/
papers/w15406, acessado em: 20/08/12.
BRASIL.MinistériodaCiênciaeTecnologia.Estratégia
Nacional de Ciência, Tecnologia e Inovação. Plano
de Ação 2012-2015, Balanço das Atividades
Estruturantes 2011. Brasília: 2012.
BRASIL.MinistériodoTrabalhoeEmprego/
Coordenação-Geral de Imigração (Brasil/MTE - CGIg).
Guia de Procedimentos – Autorização de Trabalho
a Estrangeiro. Brasília: MTE, 2012. Disponível
em http://www.mte.gov.br/trab_estrang/Guia_
Procedimentos.pdf, acessado em 20/05/12.
______. Estatísticas – Coordenadoria Geral de
Imigração, 2012. Disponível em http://portal.mte.gov.
br/geral/estatisticas.htm, acessado em 14/06/2012.
______. Resolução Normativa nº 84, de
10 de fevereiro de 2009. Disciplina a
concessão de autorização para fins de
obtenção de visto permanente para investidor
estrangeiro – pessoa física. Disponível
em: http://portal.mte.gov.br/data/files/
FF8080812BA5F4B7012BA713454612E5/
rn_20090210_84.pdf, acessado em 06/08/12.
APPENDIX IBIBLIOGRAPHIC REFERENCES AND BIBLIOGRAPHY
101
______. Resolução Normativa nº 82, de 3 de dezembro
de 2008. Disciplina a concessão de visto a cientista,
professor, pesquisador ou profissional estrangeiro que
pretenda vir ao país para participar de conferências,
seminários, congressos ou reuniões na área de
pesquisa e desenvolvimento ou para a cooperação
científico-tecnológica, e a estudantes de qualquer
nível de graduação ou pós-graduação. Disponível em:
http://portal.mte.gov.br/data/files/
FF8080812D14FB21012D2CE5AD4811C1/
rn_20081203_82.pdf, acessado em 06/08/12.
______. Resolução Normativa nº 80, de 16 de outubro
de 2008. Disciplina a concessão de autorização
de trabalho para a obtenção de visto temporário
a estrangeiro com vínculo empregatício no Brasil.
Disponível em:
http://portal.mte.gov.br/data/files/
FF8080812BA5F4B7012BA738E7092751/
rn_20081016_80.pdf, acessado em 06/08/12.
______. Resolução Normativa nº 62, de 8 de
dezembro de 2004. Disciplina a concessão de
autorização de trabalho e de visto permanente
a estrangeiro, Administrador, Gerente, Diretor,
Executivo, com poderes de gestão, de Sociedade Civil
ou Comercial, Grupo ou Conglomerado econômico.
Disponível em http://portal.mte.gov.br/trab_estrang/
resolucao-normativa-n-62-de-08-12-2004.htm,
acessado em 06/08/12.
______. Resolução Normativa nº 61, de 8 de
dezembro de 2004. Disciplina a concessão de
autorização de trabalho e de visto a estrangeiro
sob contrato de transferência de tecnologia e/ou
deprestaçãodeserviçodeassistênciatécnica,de
acordo de cooperação ou convênio, sem vínculo
empregatício ou em situação de emergência.
Disponível em:
http://portal.mte.gov.br/data/files/
FF8080812BA5F4B7012BAFF7CE364479/
rn_20041208_61.pdf, acessado em 06/08/12.
______. Resolução Normativa nº 1, de 29 de
abril de 1997. Concessão de visto para professor
ou pesquisador de alto nível e para cientistas
estrangeiros. Disponível em http://portal.mte.
gov.br/trab_estrang/resolucao-normativa-n-1-
de-29-04-1997.htm, acessado em 06/08/12.
BRITO, Fausto. A Reinvenção da Transição
Demográfica: Envelhecer antes de Enriquecer?.
CEDEPLAR/FACE/UFMG.BeloHorizonte,2010.
Disponível em:
www.cedeplar.ufmg.br/pesquisas/td/TD%20401.pdf,
acessado em 15/07/2012.
CARVALHO,JoséAlbertoMagno.Migrações
internacionaisdoBrasilnasduasúltimasdécadasdo
séculoXX:Algumasfacetasdeumprocessocomplexo
eamplamentedesconhecido.In:BRASIL.Migrações
internacionais e a Previdência Social. Brasília: MPAS,
SPS, CGEP, 2006: p.9-32.
CERVANTES,M.;GUELLEC,D.TheBrainDrain:Old
myths, new realities. 2002. OECD Observer Nº. 230,
2009. Disponível em:
http://www.OCDEobserver.org/news/archivestory.
php/aid/673/The_brain_drain:_Old_myths,_new_
realities.html, acessado em 18/06/2012
CHISWICK, Barry R. High skilled immigration in the
international arena. IZA Discussion Paper Series Nº
1782. Alemanha: IZA, 2005.
102
COENTRO,L.U.PolíticasPúblicaseGestãodas
Migrações Internacionais no Brasil: Uma reflexão
sobre os migrantes qualificados. São Paulo: FGV,
2011. p.170, Dissertação (mestrado) – Escola
de Administração de Empresas de São Paulo.
Disponível em http://bibliotecadigital.fgv.br/dspace/
handle/10438/8239, acessado em 20/05/2012.
COENTRO,L.U.;MARTES,A.C.B.Emigraçãode
estudantes e profissionais qualificados: Há fuga
decérebrosnoBrasil?In:ENCONTROANUALDA
ANPOCS, 33, 2009, Caxambu. Caxambu: ANPOCS,
2009. Disponível em:
http://www.anpocs.org.br/portal/component/
option,com_docman/task,cat_view/gid,77/
Itemid,85/, acessado em 30/06/2012.
COMISSÃOEUROPEIA.MovingEurope:EUResearch
on migration and policy needs. Directorate-General for
Research Socio-economic Sciences and Humanities,
Bruxelas, 2009. Disponível em: http://ec.europa.eu/
research/social-sciences/pdf/policy-review-migration-
publication_en.pdf, acessado em 24/05/12.
DOCQUIER,F.,LOHEST,O.,MARFOUK,A.BrainDrainin
Developing Countries. The World Bank Economic Review,
Oxford University Press, Vol 21 , Nº2, p.193-218, 2007.
DOCQUIER, F., MARKFOUK, A. International
migration by education attainment, 1990-2000. In:
SCHIFF, M. and ÖZDEN, Ç. International migration,
remittances, and the brain drain. Nova Iorque:
Palgrave Macmillan, 2006.
ESTADOSUNIDOS,DepartmentofLabor,Bureauof
LaborStatistics.Dadosdomêsdejaneirode2012com
ajuste sazonal, disponível em: http://www.bls.gov/
eag/eag.us.htm
______. Department of State. Bureau of Consular
Affairs, 2012. Disponível em http://travel.state.gov/
visa/frvi/ineligibilities/ineligibilities_1364.html,
acessado em 18/06/2012.
EUROSTAT, 2012. Disponível em: http://epp.eurostat.
ec.europa.eu/portal/page/portal/eurostat/home/
FERNANDES, D., DINIZ, A. 2009. Brain drain or brain
gain? In which direction does the Brazilian diaspora
go?In:IUSSPINTERNATIONALPOPULATION
CONFERENCE, 26, Marrakech, 2009. Marrakech:
IUSSP, 2009. Disponível em:
http://iussp2009.princeton.edu/abstractViewer.
aspx?submissionId=91830, acessado em 20/08/2012.
FOONG,A.,LIM,T.ComparativeEmploymentRisks
in the BRIC Countries. HR Connect – Asia Pacific.
Vol.4, Nº 2, Aon Hewitt, 2011. Disponível em http://
www.aon.com/thought-leadership/asia-connect/
Attachments/leadership-and-talent/Leadership-
Talent-2011Mar_Comparing_Employment_Risks_in_
BRIC.pdf, acessado em 09/08/2012.
FIRMEZA, George Torquato. Brasileiros no exterior.
Brasília: Fundação Alexandre de Gusmão, 2007.
FUNDODEPOPULAÇÃODASNAÇÕESUNIDAS
(UNFPA). State of World Population 2006 – A passage
of hope: Women and International Migration. Nova
Iorque: UNFPA, 2006. Disponível em: www.unfpa.
org/swp/2006/pdf/en_sowp06.pdf, acessado em
20/07/2012.
FUNDOMONETÁRIOINTERNACIONAL.IMFData
Mapper, 2012. Disponível em: http://www.imf.
org/external/datamapper/index.php, acessado em
28/07/12.
FRANÇA,L.Oschinesescontinuamchegando.Revista
Você S/A, 08/04/2011. Disponível em: http://vocesa.
abril.com.br/desenvolva-sua-carreira/materia/
chineses-continuam-chegando-628255.shtml
FRANZOLINI,C.,SCELLATO,G.,STEPHAN,P.
Foreign Born Scientists: Mobility Patterns for Sixteen
Countries. National Bureau of Economics, Cambridge,
2012. Disponível em: http://www.nber.org/papers/
w18067, acessado em 28/08/2012.
GABACCIA, Donna. Seeking common ground:
multidisciplinarity studies of immigrant women in the
UnitedStates.Londres:Praeger,1992.

103
GIBNEY, Elizabeth. Import/export model: brain drain
and gains among major scientific nations. Times
higher education, 2012. Disponível em:
http://www.timeshighereducation.co.uk/story.
asp?storycode=420053#.T73vRhyGB5M, acessado em
18/06/2012.
GODOY, D., GÓIS, A. País perde cada vez mais
“cérebros”paraoexterior.FolhadeSãoPaulo,
02/12/2007. Disponível em: http://www1.folha.uol.
br/fsp/cotidian/ff0212200701.htm, acessado em
06/09/2012.
GONÇALVES,P.C.Mercadoresdebraços:riquezae
acumulação na organização da emigração europeia
para o Novo Mundo, 2008. Tese (Doutorado em
HistóriaEconômica)–FaculdadedeFilosofia,Letras
e Ciências Humanas, Universidade de São Paulo, São
Paulo, 2008. Disponível em: http://www.teses.usp.
br/teses/disponiveis/8/8137/tde-30092008-162725,
acessado em 06/09/2012.
GOUVEIA,L.,SAENZ,R.,eCOUGUA,J.From
Disney to Chavez: Venezuelan Migrants in the U.S..
In:CONGRESSODAREDEINTERNACIONALDE
MIGRAÇÃOEDESENVOLVIMENTO,4,2011,Quito:
FLACSO.Disponívelem:
http://www.flacsoandes.org/web/
imagesFTP/1308864822.Ponencia_Lourdes_
Gouveia_Saenz_Cogua.pdf
GOZA, Franklin. Brazil, Modern Era Migration. In
Encyclopedia of Global Human Migration, Immanuel
Ness (ed.), Wiley Blackwell Publishers, 2011.
______. Brazilian Immigrants. In Multicultural
America: An Encyclopedia of the Newest Americans,
Ronald Bayor (ed.), Santa Barbara, CA: Greenwood
Press, p.149-203, 2011.
______. Immigrant Social Networks: The Brazilian
Case. Working Paper Series. Center for Family and
Demographic Research, 2005. Disponível em: http://
www.bgsu.edu/downloads/cas/file35391.pdf,
acessado em 06/09/2012.
HABERMAS, J. Mudança estrutural da esfera pública:
investigação quanto a uma categoria da sociedade
burguesa. Rio de Janeiro: Tempo Brasileiro, 1984.
HARRIS, J.R., TODARO, M.P. Migration,
unemployment and development: a two sector
analysis. American Migration Review, vol.60 nº1,
p.126-142, 1970.
INSTITUTOBRASILEIRODEGEOGRAFIAE
ESTATÍSTICA. Censo Demográfico IBGE, 2010.
Disponível em: http://www.censo2010.ibge.gov.br/,
acessado em 06/08/12.
______. Pesquisa Nacional por Amostra de
Domicílios 2001/2009, IBGE, 2009. Disponível
em: http://seriesestatisticas.ibge.gov.br/series.
aspx?vcodigo=PD295, acessado em 18/06/2012.
KEELEY,Brian.TheMigrationDebate.International
Migration: The Human Face of Globalization, OECD
Publishing, 2009. Disponível em: http://www.
oecd-ilibrary.org/social-issues-migration-health/
international-migration_9789264055780-en,
acessado em 20/07/2012.
MAGALHÃES,J.P.Almeida.Prefácio,In:SAMPAIO,
L.S.C.LógicaeEconomia.RiodeJaneiro:Instituto
Cultura Nova, 1988.
MALTHUS,Thomas.AnEssayonthePrinciple
ofPopulation.Londres,1798.Disponívelem:
http://129.237.201.53/books/malthus/population/
malthus.pdf, acessado em 11/06/2012.
MARTIN, Susan. US Employment-based admissions:
Permanent and temporary. Migration Policy Institute,
Policy Brief 15, 2006.
MARTINE, George. A Globalização Inacabada:
migraçõesinternacionaisepobrezanoséculoXXI.São
Paulo em Perspectiva Vol. 19(3), p.3-22, 2005.

104
MARU, Mehari Taddele. Brain Drain Development
Support Policy Coherence. Paper apresentado no
workshop preparatório na Comissão para a União
Africana, 2008.
MASSEY, Douglas et al. The social organization
of migration – the social process of international
migration from Western Mexico. Berkeley: University
of California Press, 1990, p.139-171.
MCGURK, John. Talent Development Countries in the
BRIC Countries. CIPD Hot Topics, 2010. Disponível
em:
http://www.cipd.co.uk/NR/rdonlyres/EB69B9A5-
BAC0-4D67-94EA-C65B5601A0AA/0/Talent_
development_BRIC_countries.pdf.
ORGANIZAÇÃOPARACOOPERAÇÃOE
DESENVOLVIMENTOECONÔMICO.International
Migration Outlook 2011. Development Centre Studies,
OECD Publishing, 2011a.
______. Tackling the Policy Challenges of Migration:
Regulation, Integration, Development. OCDE
Publishing, 2011b.
______. International Migration Outlook 2010.
Development Centre Studies, OCDE Publishing, 2010a.
______. OECD Economic Reforms, 2010 Going for
Growth. OECD Publishing, 2010b.
______. PISA 2009 Results: What Students Know
and Can Do: Student Performance in Reading,
Mathematics and Science, 2010c.
Disponível em: http://www.oecd.org/pisa/
pisaproducts/48852548.pdf, acessado em 20/06/2012.
_____. International Migration Outlook 2008.
Development Centre Studies, OCDE Publishing, 2008.
ORGANIZAÇÃOINTERNACIONALPARAAS
MIGRAÇÕES.EconomicCycles,Demographic
Change and Migration. Migration Policy Research,
International Dialogue on Migration nº 19, 2012.
______. Enhancing the Role of Return Migration in
Fostering Development. Migration Policy Research,
International Dialogue on Migration nº 15, 2010a.
______. Migration and Social Change. Migration Policy
Research, International Dialogue on Migration nº 17,
2010b.
______. The Impact of Financial Crises on
International Migration. Migration Policy Research,
Migration Research Series nº 37, 2009.
______.MigrationfromLatinAmericatoEurope.
Migration Policy Research, Migration Research Series
nº 18, 2004.
ORGANIZAÇÃODASNAÇÕESUNIDAS.Relatório
do Secretário-Geral sobre Migrações Internacionais
edesenvolvimento.InASSEMBLEIAGERAL,
2010. Disponível em http://www.gfmd.org/
documents/65th-UNGA_Report-of-UN-Sec-Gen.pdf,
acessado em 30/07/2012.
PATARRA,NeideLopes.Migraçõesinternacionais:
Teorias, políticas e movimentos sociais. Disponível em
http://www.scielo.br/pdf/ea/v20n57/a02v2057.pdf,
acessado em 14/06/2012.
PATARRA, N., BAENINGER, R. Migrações
internacionais recentes: o caso do Brasil. In:
PATARRA, N. (Coord.). Emigração e Imigração
Internacionais no Brasil Contemporâneo. São Paulo:
FNUAP, 1995.
PORTES, A. Determinants of the Brain Drain.
International Migration Review, Vol.10, Nº 4. The
Center for Migration Studies, Nova Iorque, 1976.
PROGRAMADASNAÇÕESUNIDASPARAO
DESENVOLVIMENTO.RelatóriodeDesenvolvimento
Humano 2009. Nova Iorque: Palgrave Macmillan,
2009. Disponível em http://hdr.undp.org/en/
media/HDR_2009_PT_Complete.pdf, acessado em
05/09/2012.

105
REZENDE, D.F. Reflexões sobre os sistemas de
migração internacional: proposta para uma análise
estrutural dos mecanismos intermediários, 2005,
p.204. Tese (Doutorado em Ciências Econômicas)
– Centro de Desenvolvimento e Planejamento,
Universidade Federal de Minas Gerais. Belo
Horizonte, 2005.
RICHMOND, Anthony H. Immigration and ethnic
conflict,Londres:MacMillanPress,p.218,1988.
RIOS-NETO, Eduardo. Managing Migration: The
BrazilianCase.BeloHorizonte:CEDEPLAR/FACE/
UFMG. Texto para discussão nº 249, 2005. Disponível
em: http://cedeplar.ufmg.br/pesquisas/td/TD%20
249.pdf
SASAKI, E., ASSIS G.O. Teorias das migrações
internacionais.In:ENCONTRONACIONAL
DAASSOCIAÇÃOBRASILEIRADEESTUDOS
POPULACIONAIS,12,2000,Caxambu:ABEP,2000.
Disponível em:
http://www.abep.nepo.unicamp.br/docs/anais/
pdf/2000/Todos/migt16_2.pdf, acessado em
30/05/2012.
SASSEN, Saskia. The mobility of labor and capital:
a study in international investment and labor flow.
Nova Iorque, Cambridge University Press, 1988.
SISTEMAECONÔMICOLATINO-AMERICANOEDO
CARIBE. Migración de recursos humanos calificados
ydesarollohumanoenAméricaLatinayelCaribe.
Caracas, 2010.
STARK,O.,BLOOM,D.E.Theneweconomicsoflabour
migration. American Economic Review, vol. 75,
p.173-8, 1985.
STRAUBHAAR, Thomas. International mobility of
the highly skilled: brain gain, brain drain or brain
exchange, HWWA Discussion Paper, Nº. 88, 2000.
Disponível em:
http://hdl.handle.net/10419/19463.
THEECONOMIST.VisaforEntrepreneurs(Letthe
job-creators in: America’s government should give
more visas to people with ideas / Where creators are
welcome:. Australia, Canada and even Chile are more
open than America), 2012. Disponíveis em:
http://www.economist.com/
node/21556579?frsc=dg%7Ca, acessado em
10/08/2012.
THOMAS, W.I., ZNANIECKI, F. The Polish Peasant
in Europe and America. 1818 (1ªed.), Chicago:
University of Illinois Press, 1984.
TURNER, B.S. Max Weber: From history to modernity.
Londres:Routledge,1992.
VÁZQUEZ, G. An Evaluation of Brain Drain in the Case
of Venezuela’s Petroleum Company. Tese (Master of
Arts) University of Miami, 2012. Disponível em:
http://scholarlyrepository.miami.edu/cgi/
viewcontent.cgi?article=1353&context=oa_theses.
WEBER, M. Economia e Sociedade. Brasília: Editora
Universidade de Brasília,1991.

106
APPENDIX 2ADDITIONAL INFORMATION
Risk Areas of Human Capital Risk Factors of Human Capital
Demographic
1. Size of Economically Active Population
2. Immigration /Emigration*
3. Productivity of Labor Force
4. Aging of Population.
5. Availability of Labor Force in the Future*
Government Support
6. Planning Risk of Future Workforce*
7. Political and Terrorism Risks*
8. Rates of Crimes and Violence
9. Government Relations
10. Corruption
Educational System
11. Literacy Rates
12. Capacity of the Educational System
13. Secondary School Graduates
14. Enrollment in Higher Education
15. Educational Spending
Talent Development
16. Quality of Available Talent
17. Quality of Training
18. Quality of Training Management
19. Languages Spoken
20. Brain Drain
Employment Practices
21. Bias and Favoritism
22. Labor Relations
23. Staff Turnover
24. Health Benefits
25. Retirement Benefits
26. Equal Opportunity
27. Executive Recruitment
28. Health and Safety Occupation
29. Redundancy Restrictions*
30. Rigidity with Staff Costs
TABLE I – HUMAN CAPITAL AREAS AND FACTORS OF HUMAN RISK

107
TABLE II – RESULTS OF PISA (EVALUATION OF INTERNATIONAL STUDENTS PROGRAM-
ME): WHAT STUDENTS KNOW AND CAN DO (2009)
On the scale
of total reading
On the reading subscale
Mathematical Scale
Science Scale
Access and retrieve in-formation
Integrate and
interpret
Reflect and
evaluate
Continuous texts
Non-Continuous
Texts
Shanghai – China 556 549 558 557 564 539 600 575
Korea 539 542 541 542 538 542 546 538
Finland 536 532 538 536 535 535 541 554
Hong Kong - China 533 530 530 540 538 522 555 549
Singapore 526 526 525 529 522 539 562 542
Canada 524 517 522 535 524 527 527 529
New Zealand 521 521 517 531 518 532 519 532
Japan 520 530 520 521 520 518 529 539
Australia 515 513 513 523 513 524 514 527
The Netherlands 508 519 504 510 506 514 526 522
Belgium 506 513 504 505 504 511 515 507
Norway 503 512 502 505 505 498 498 500
Estonia 501 503 500 503 497 512 512 528
Switzerland 501 505 502 497 498 505 534 517
Poland 500 500 503 498 502 496 495 508
Iceland 500 507 503 496 501 499 507 496
United States 500 492 495 512 500 503 487 502
Lichtenstein 499 508 498 498 495 506 536 520
Sweden 497 505 494 502 499 498 494 495
Germany 497 501 501 491 496 497 513 520
Ireland 496 498 494 502 497 496 487 508
France 496 492 497 495 492 498 497 498
Taipei 495 496 499 493 496 500 543 520
Denmark 495 502 492 493 496 493 503 499
UK 494 491 491 503 492 506 492 514
Hungary 494 501 496 489 497 487 490 503
Portugal 489 488 487 496 492 488 487 493
Macau - China 487 493 488 481 488 481 525 511
Italy 486 482 490 482 489 476 483 389
Latvia 484 476 484 492 484 487 482 494
Slovenia 483 489 489 470 484 476 501 512
Greece 483 468 484 489 487 472 466 470
Spain 481 480 481 483 484 473 483 488
Czech Republic 478 479 488 462 479 474 493 500
Slovak Republic 476 491 481 466 489 471 497 490
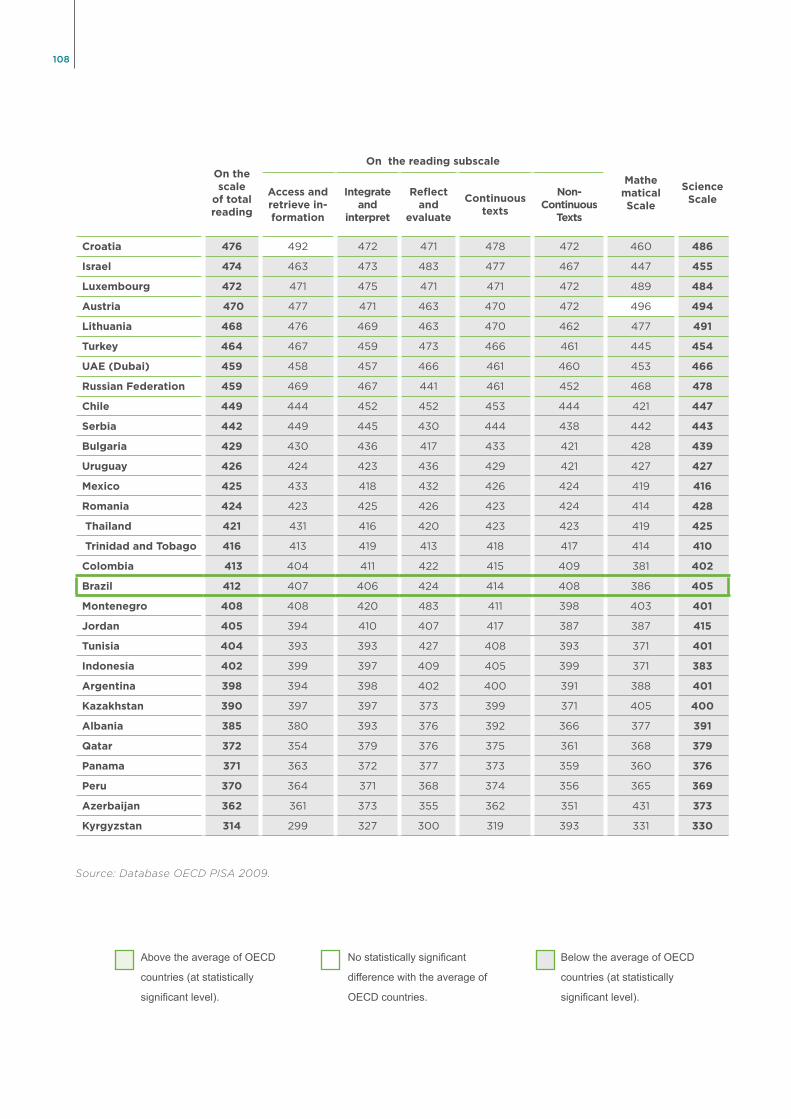
108
On the scale
of total reading
On the reading subscale
Mathematical Scale
Science Scale
Access and retrieve in-formation
Integrate and
interpret
Reflect and
evaluate
Continuous texts
Non-Continuous
Texts
Croatia 476 492 472 471 478 472 460 486
Israel 474 463 473 483 477 467 447 455
Luxembourg 472 471 475 471 471 472 489 484
Austria 470 477 471 463 470 472 496 494
Lithuania 468 476 469 463 470 462 477 491
Turkey 464 467 459 473 466 461 445 454
UAE (Dubai) 459 458 457 466 461 460 453 466
Russian Federation 459 469 467 441 461 452 468 478
Chile 449 444 452 452 453 444 421 447
Serbia 442 449 445 430 444 438 442 443
Bulgaria 429 430 436 417 433 421 428 439
Uruguay 426 424 423 436 429 421 427 427
Mexico 425 433 418 432 426 424 419 416
Romania 424 423 425 426 423 424 414 428
Thailand 421 431 416 420 423 423 419 425
Trinidad and Tobago 416 413 419 413 418 417 414 410
Colombia 413 404 411 422 415 409 381 402
Brazil 412 407 406 424 414 408 386 405
Montenegro 408 408 420 483 411 398 403 401
Jordan 405 394 410 407 417 387 387 415
Tunisia 404 393 393 427 408 393 371 401
Indonesia 402 399 397 409 405 399 371 383
Argentina 398 394 398 402 400 391 388 401
Kazakhstan 390 397 397 373 399 371 405 400
Albania 385 380 393 376 392 366 377 391
Qatar 372 354 379 376 375 361 368 379
Panama 371 363 372 377 373 359 360 376
Peru 370 364 371 368 374 356 365 369
Azerbaijan 362 361 373 355 362 351 431 373
Kyrgyzstan 314 299 327 300 319 393 331 330
Above the average of OECD
countries (at statistically
significant level).
No statistically significant
difference with the average of
OECD countries.
Below the average of OECD
countries (at statistically
significant level).
Source: Database OECD PISA 2009.

109
Co
un
trie
s o
f O
rig
in
Art
isti
c o
rS
po
rtin
g
Dip
lom
ats
Em
plo
ym
en
t in
Bra
zil
ian
M
ult
inati
on
al
Inte
rnsh
ip o
r Tra
inin
g
Exe
cu
tive
of
Mu
ltin
ati
on
al
En
terp
rise
Inve
sto
r
Pro
fess
or
or
Re
searc
he
r
Fam
ily R
eu
nio
n
Th
ird
Se
cto
r
Go
ve
rnm
en
t W
ork
Mari
tim
e
Wo
rk
Tem
po
rary
Wo
rk
Tra
nsf
er
of
Tech
no
log
y
Sp
ecia
l V
isa
Tota
l
US 20 0 226 4 34 13 24 1 0 0 33 30 112 1 498
France 4 0 183 22 22 10 30 1 0 0 9 16 32 7 336
Japan 0 0 73 2 30 0 0 0 0 0 73 28 103 0 309
China 0 0 128 0 5 1 2 0 0 0 0 15 23 0 174
Germany 7 0 58 5 11 7 28 0 1 0 3 19 18 2 159
Portugal 1 0 84 1 19 4 19 0 1 0 3 6 9 1 148
India 0 0 33 1 0 0 3 0 0 0 14 3 89 0 143
Italy 1 0 42 1 5 13 30 1 0 0 0 6 13 0 112
Spain 2 0 43 1 10 3 14 1 0 0 3 3 24 0 104
Peru 2 0 33 0 1 1 47 1 0 0 1 13 2 1 102
Columbia 6 0 28 1 2 0 28 1 0 0 1 9 8 1 85
Britain 1 0 36 3 2 1 9 0 0 0 8 7 15 0 82
Mexico 0 1 34 0 9 1 2 0 0 0 2 7 26 0 82
Canada 13 2 15 1 4 1 4 0 0 1 6 5 22 0 74
Norway 4 0 4 0 4 1 2 0 0 0 7 0 47 0 69
Holand 0 0 31 0 1 4 3 1 2 0 2 14 6 0 64
Belgium 2 0 21 0 1 1 3 0 0 0 10 3 19 0 60
Sweden 0 0 14 3 2 1 2 0 0 0 3 5 15 0 45
Venezuela 1 0 23 1 2 0 2 0 0 0 0 4 5 1 39
Korea 0 0 5 0 16 1 0 0 0 0 1 3 11 0 37
Argentina 0 0 3 0 1 0 20 0 0 0 0 3 5 0 32
Finland 0 0 10 0 0 0 0 0 0 0 4 7 10 0 31
Poland 1 0 5 0 0 0 0 0 0 0 10 1 9 0 26
Russia 2 0 5 0 1 0 13 0 0 0 2 0 1 1 25
Australia 0 0 6 0 2 1 0 0 0 0 2 1 9 0 21
Denmark 1 0 9 0 1 0 1 0 0 0 3 2 4 0 21
Switzerland 7 0 6 1 0 1 1 0 0 0 0 2 3 0 21
Chile 0 1 2 0 2 0 8 1 0 0 0 3 2 1 20
Austria 3 0 6 0 1 1 1 1 0 0 0 1 3 0 17
Cuba 0 0 1 0 0 0 13 0 0 0 0 2 0 0 16
Equador 0 0 12 0 1 0 1 0 0 0 0 1 0 0 15
TABLE III - COUNTRIES OF ORIGIN FOR FOREIGN WORKERS WITH 17 OR MORE YEARS
OF STUDY, BY CATEGORY OF VISA ISSUED (2006-2011)
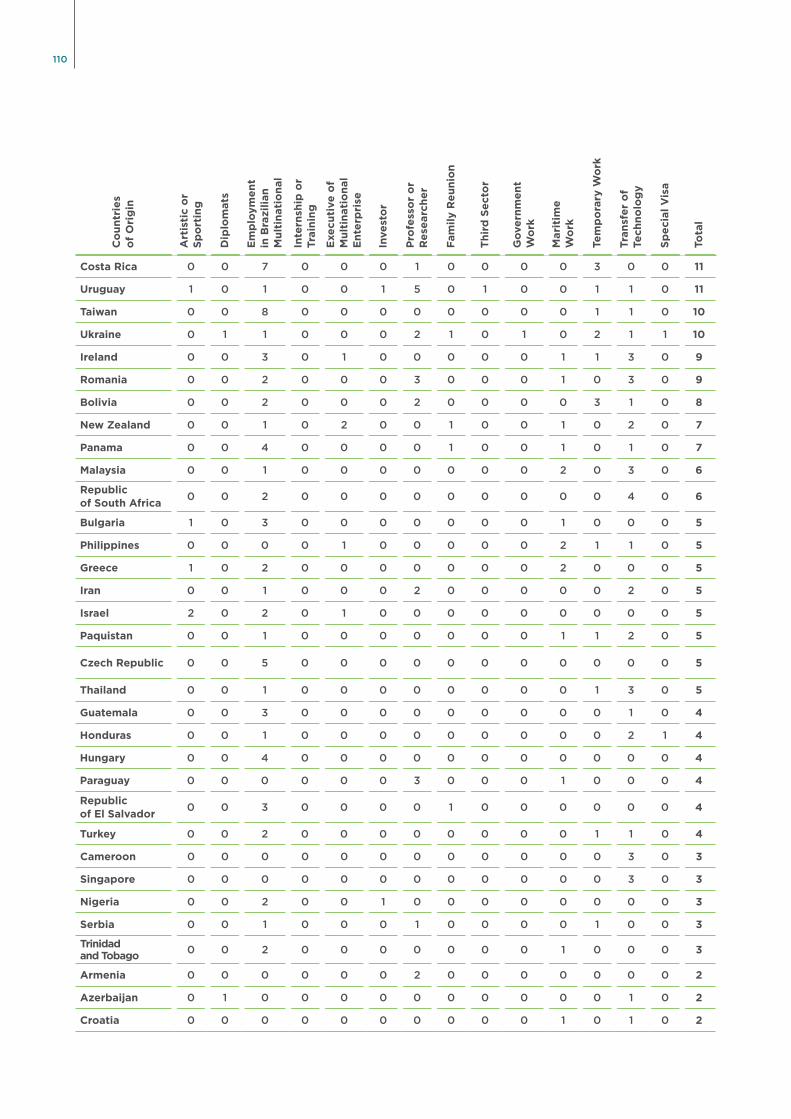
110
Costa Rica 0 0 7 0 0 0 1 0 0 0 0 3 0 0 11
Uruguay 1 0 1 0 0 1 5 0 1 0 0 1 1 0 11
Taiwan 0 0 8 0 0 0 0 0 0 0 0 1 1 0 10
Ukraine 0 1 1 0 0 0 2 1 0 1 0 2 1 1 10
Ireland 0 0 3 0 1 0 0 0 0 0 1 1 3 0 9
Romania 0 0 2 0 0 0 3 0 0 0 1 0 3 0 9
Bolivia 0 0 2 0 0 0 2 0 0 0 0 3 1 0 8
New Zealand 0 0 1 0 2 0 0 1 0 0 1 0 2 0 7
Panama 0 0 4 0 0 0 0 1 0 0 1 0 1 0 7
Malaysia 0 0 1 0 0 0 0 0 0 0 2 0 3 0 6
Republic of South Africa
0 0 2 0 0 0 0 0 0 0 0 0 4 0 6
Bulgaria 1 0 3 0 0 0 0 0 0 0 1 0 0 0 5
Philippines 0 0 0 0 1 0 0 0 0 0 2 1 1 0 5
Greece 1 0 2 0 0 0 0 0 0 0 2 0 0 0 5
Iran 0 0 1 0 0 0 2 0 0 0 0 0 2 0 5
Israel 2 0 2 0 1 0 0 0 0 0 0 0 0 0 5
Paquistan 0 0 1 0 0 0 0 0 0 0 1 1 2 0 5
Czech Republic 0 0 5 0 0 0 0 0 0 0 0 0 0 0 5
Thailand 0 0 1 0 0 0 0 0 0 0 0 1 3 0 5
Guatemala 0 0 3 0 0 0 0 0 0 0 0 0 1 0 4
Honduras 0 0 1 0 0 0 0 0 0 0 0 0 2 1 4
Hungary 0 0 4 0 0 0 0 0 0 0 0 0 0 0 4
Paraguay 0 0 0 0 0 0 3 0 0 0 1 0 0 0 4
Republic of El Salvador
0 0 3 0 0 0 0 1 0 0 0 0 0 0 4
Turkey 0 0 2 0 0 0 0 0 0 0 0 1 1 0 4
Cameroon 0 0 0 0 0 0 0 0 0 0 0 0 3 0 3
Singapore 0 0 0 0 0 0 0 0 0 0 0 0 3 0 3
Nigeria 0 0 2 0 0 1 0 0 0 0 0 0 0 0 3
Serbia 0 0 1 0 0 0 1 0 0 0 0 1 0 0 3
Trinidadand Tobago
0 0 2 0 0 0 0 0 0 0 1 0 0 0 3
Armenia 0 0 0 0 0 0 2 0 0 0 0 0 0 0 2
Azerbaijan 0 1 0 0 0 0 0 0 0 0 0 0 1 0 2
Croatia 0 0 0 0 0 0 0 0 0 0 1 0 1 0 2
Co
un
trie
s o
f O
rig
in
Art
isti
c o
rS
po
rtin
g
Dip
lom
ats
Em
plo
ym
en
t in
Bra
zil
ian
M
ult
inati
on
al
Inte
rnsh
ip o
r Tra
inin
g
Exe
cu
tive
of
Mu
ltin
ati
on
al
En
terp
rise
Inve
sto
r
Pro
fess
or
or
Re
searc
he
r
Fam
ily R
eu
nio
n
Th
ird
Se
cto
r
Go
ve
rnm
en
t W
ork
Mari
tim
e
Wo
rk
Tem
po
rary
Wo
rk
Tra
nsf
er
of
Tech
no
log
y
Sp
ecia
l V
isa
Tota
l
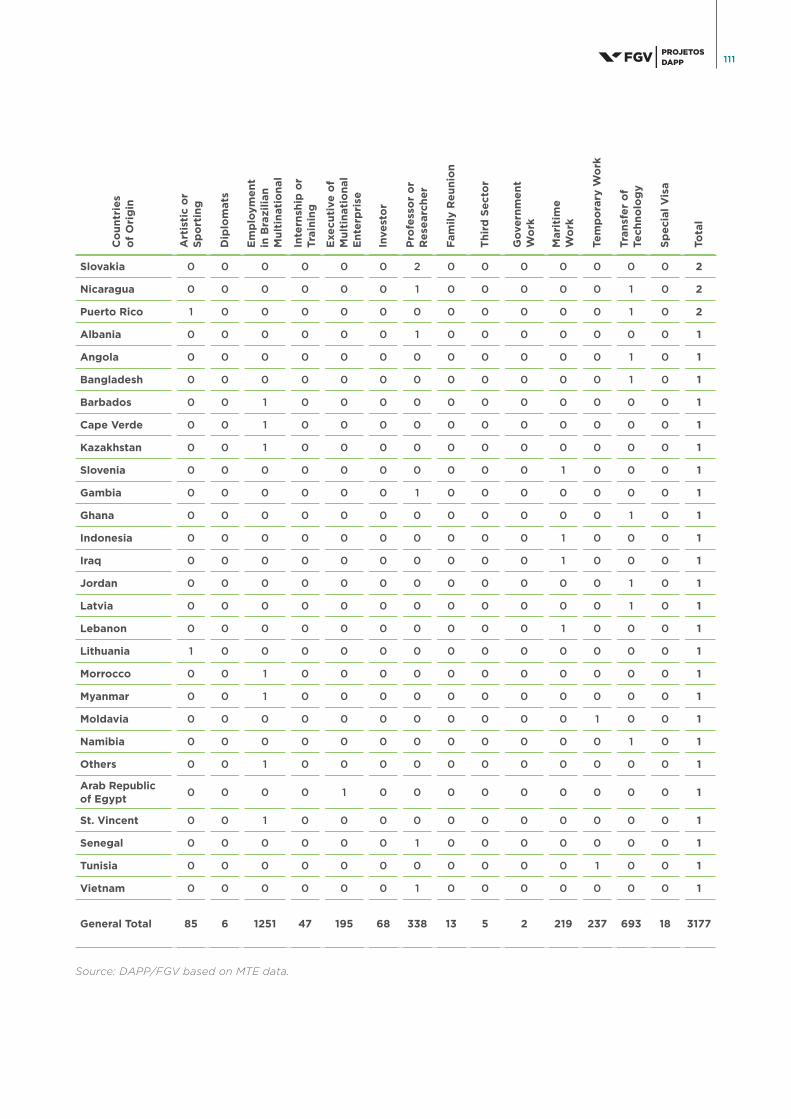
111
Slovakia 0 0 0 0 0 0 2 0 0 0 0 0 0 0 2
Nicaragua 0 0 0 0 0 0 1 0 0 0 0 0 1 0 2
Puerto Rico 1 0 0 0 0 0 0 0 0 0 0 0 1 0 2
Albania 0 0 0 0 0 0 1 0 0 0 0 0 0 0 1
Angola 0 0 0 0 0 0 0 0 0 0 0 0 1 0 1
Bangladesh 0 0 0 0 0 0 0 0 0 0 0 0 1 0 1
Barbados 0 0 1 0 0 0 0 0 0 0 0 0 0 0 1
Cape Verde 0 0 1 0 0 0 0 0 0 0 0 0 0 0 1
Kazakhstan 0 0 1 0 0 0 0 0 0 0 0 0 0 0 1
Slovenia 0 0 0 0 0 0 0 0 0 0 1 0 0 0 1
Gambia 0 0 0 0 0 0 1 0 0 0 0 0 0 0 1
Ghana 0 0 0 0 0 0 0 0 0 0 0 0 1 0 1
Indonesia 0 0 0 0 0 0 0 0 0 0 1 0 0 0 1
Iraq 0 0 0 0 0 0 0 0 0 0 1 0 0 0 1
Jordan 0 0 0 0 0 0 0 0 0 0 0 0 1 0 1
Latvia 0 0 0 0 0 0 0 0 0 0 0 0 1 0 1
Lebanon 0 0 0 0 0 0 0 0 0 0 1 0 0 0 1
Lithuania 1 0 0 0 0 0 0 0 0 0 0 0 0 0 1
Morrocco 0 0 1 0 0 0 0 0 0 0 0 0 0 0 1
Myanmar 0 0 1 0 0 0 0 0 0 0 0 0 0 0 1
Moldavia 0 0 0 0 0 0 0 0 0 0 0 1 0 0 1
Namibia 0 0 0 0 0 0 0 0 0 0 0 0 1 0 1
Others 0 0 1 0 0 0 0 0 0 0 0 0 0 0 1
Arab Republic of Egypt
0 0 0 0 1 0 0 0 0 0 0 0 0 0 1
St. Vincent 0 0 1 0 0 0 0 0 0 0 0 0 0 0 1
Senegal 0 0 0 0 0 0 1 0 0 0 0 0 0 0 1
Tunisia 0 0 0 0 0 0 0 0 0 0 0 1 0 0 1
Vietnam 0 0 0 0 0 0 1 0 0 0 0 0 0 0 1
General Total 85 6 1251 47 195 68 338 13 5 2 219 237 693 18 3177
Source: DAPP/FGV based on MTE data.
Co
un
trie
s o
f O
rig
in
Art
isti
c o
rS
po
rtin
g
Dip
lom
ats
Em
plo
ym
en
t in
Bra
zil
ian
M
ult
inati
on
al
Inte
rnsh
ip o
r Tra
inin
g
Exe
cu
tive
of
Mu
ltin
ati
on
al
En
terp
rise
Inve
sto
r
Pro
fess
or
or
Re
searc
he
r
Fam
ily R
eu
nio
n
Th
ird
Se
cto
r
Go
ve
rnm
en
t W
ork
Mari
tim
e
Wo
rk
Tem
po
rary
Wo
rk
Tra
nsf
er
of
Tech
no
log
y
Sp
ecia
l V
isa
Tota
l

112
TABLE IV – DESTINATION UF OF FOREIGN WORKERS WITH 17 YEARS OF STUDY OR
MORE, BY TYPE OF VISA (2006-2011)
Sta
te o
f d
est
inati
on
Art
isti
c o
r sp
ort
ing
Dip
lom
ats
Em
plo
ye
d i
n B
razil
ian
mu
ltin
ati
on
al
Inte
rnsh
ip o
r Tra
inin
g
Exe
cu
tive
of
mu
ltin
ati
on
al
co
mp
an
y
Inve
sto
r
Pro
fess
or
or
Re
searc
he
r
Fam
ily R
easo
ns
Th
ird
Se
cto
r
Go
ve
rnm
en
t W
ork
Mari
tim
e W
ork
Tem
po
rary
Wo
rk
Tra
nsf
er
of
Tech
no
log
y
Sp
ecia
l V
isa
Ge
ne
ral
Tota
l
AL 0 0 0 0 0 1 1 0 0 0 0 0 0 0 2
AM 0 0 24 1 6 0 10 0 0 1 9 12 13 1 77
AP 0 0 5 0 1 0 0 0 0 0 3 2 3 0 14
BA 0 0 27 0 1 4 9 0 0 0 0 5 4 0 50
CE 0 0 7 0 0 12 9 0 0 0 1 0 11 0 40
DF 1 5 25 0 1 0 23 1 2 1 2 6 4 3 74
ES 0 0 2 0 0 0 4 0 0 0 1 2 6 0 15
GO 0 0 1 0 1 2 2 1 0 0 2 0 2 1 12
MA 0 0 2 0 0 1 1 0 0 0 0 0 0 0 4
MG 20 0 41 2 7 5 18 1 0 0 1 11 38 1 145
MS 0 0 2 0 0 0 1 0 0 0 0 0 1 0 4
MT 0 0 2 0 0 0 2 0 0 0 0 1 0 0 5
PA 0 0 2 1 2 0 7 0 0 0 0 0 6 0 18
PB 0 0 0 0 0 1 3 0 0 0 0 0 0 0 4
PE 0 0 9 0 1 0 23 0 0 0 0 3 1 0 37
PI 0 0 0 0 0 0 0 0 0 0 0 0 0 1 1
PR 4 0 44 1 8 0 18 0 0 0 1 18 10 0 104
RJ 16 1 229 7 39 12 96 4 1 0 85 24 207 2 723
RN 0 0 1 0 0 2 9 0 0 0 2 1 0 0 15
RS 0 0 30 0 2 2 15 0 0 0 0 9 13 0 71
SC 0 0 9 0 3 2 10 0 0 0 0 10 7 2 43
SE 0 0 0 0 0 0 2 0 0 0 1 0 0 0 3
SP 42 0 734 35 115 21 53 6 2 0 109 133 344 4 1598
TO 0 0 1 0 0 0 0 0 0 0 0 0 0 0 1
NotStated
2 0 54 0 8 3 22 0 0 0 2 0 23 3 117
General
Total85 6 1251 47 195 68 338 13 5 2 219 237 693 18 3177
Source: DAPP/FGV based on MTE data.
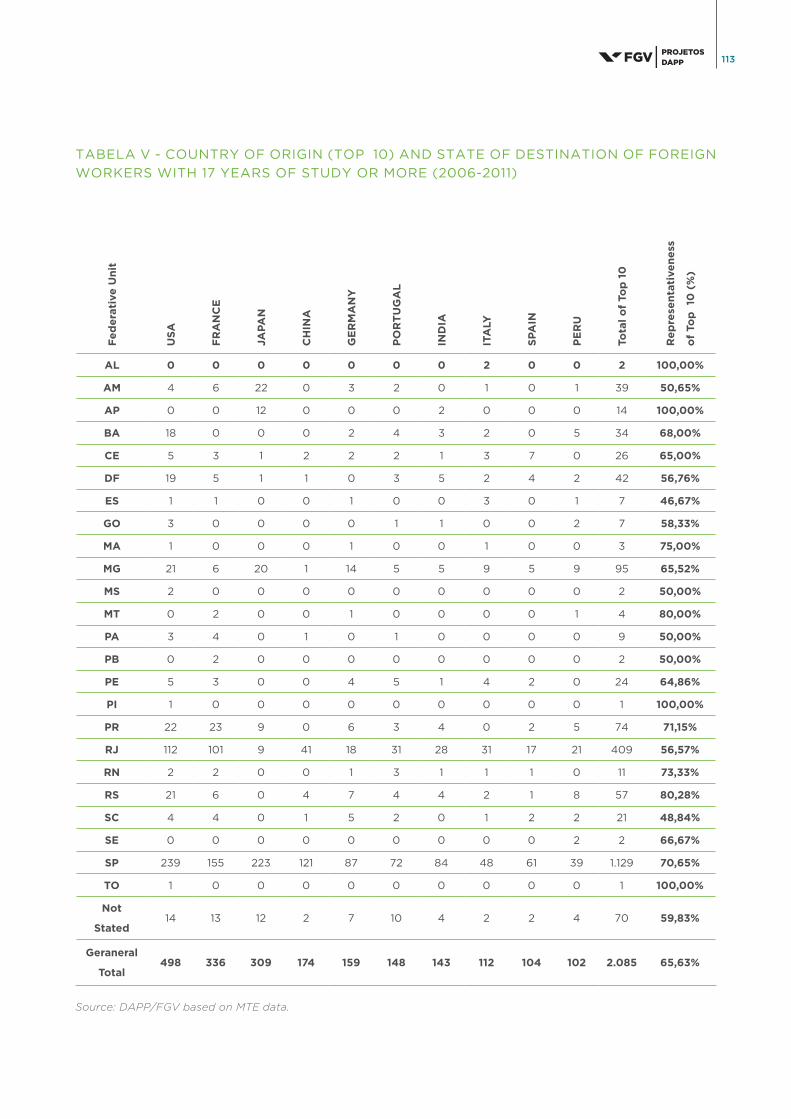
113
TABELA V - COUNTRY OF ORIGIN (TOP 10) AND STATE OF DESTINATION OF FOREIGN
WORKERS WITH 17 YEARS OF STUDY OR MORE (2006-2011)
Source: DAPP/FGV based on MTE data.
Fe
de
rati
ve
Un
it
US
A
FR
AN
CE
JAPA
N
CH
INA
GE
RM
AN
Y
PO
RT
UG
AL
IND
IA
ITA
LY
SPA
IN
PE
RU
Tota
l o
f To
p 1
0
Re
pre
sen
tati
ve
ne
ss
of
Top
10
(%
)
AL 0 0 0 0 0 0 0 2 0 0 2 100,00%
AM 4 6 22 0 3 2 0 1 0 1 39 50,65%
AP 0 0 12 0 0 0 2 0 0 0 14 100,00%
BA 18 0 0 0 2 4 3 2 0 5 34 68,00%
CE 5 3 1 2 2 2 1 3 7 0 26 65,00%
DF 19 5 1 1 0 3 5 2 4 2 42 56,76%
ES 1 1 0 0 1 0 0 3 0 1 7 46,67%
GO 3 0 0 0 0 1 1 0 0 2 7 58,33%
MA 1 0 0 0 1 0 0 1 0 0 3 75,00%
MG 21 6 20 1 14 5 5 9 5 9 95 65,52%
MS 2 0 0 0 0 0 0 0 0 0 2 50,00%
MT 0 2 0 0 1 0 0 0 0 1 4 80,00%
PA 3 4 0 1 0 1 0 0 0 0 9 50,00%
PB 0 2 0 0 0 0 0 0 0 0 2 50,00%
PE 5 3 0 0 4 5 1 4 2 0 24 64,86%
PI 1 0 0 0 0 0 0 0 0 0 1 100,00%
PR 22 23 9 0 6 3 4 0 2 5 74 71,15%
RJ 112 101 9 41 18 31 28 31 17 21 409 56,57%
RN 2 2 0 0 1 3 1 1 1 0 11 73,33%
RS 21 6 0 4 7 4 4 2 1 8 57 80,28%
SC 4 4 0 1 5 2 0 1 2 2 21 48,84%
SE 0 0 0 0 0 0 0 0 0 2 2 66,67%
SP 239 155 223 121 87 72 84 48 61 39 1.129 70,65%
TO 1 0 0 0 0 0 0 0 0 0 1 100,00%
Not
Stated14 13 12 2 7 10 4 2 2 4 70 59,83%
Geraneral
Total498 336 309 174 159 148 143 112 104 102 2.085 65,63%
114
APPENDICES 3LIST OF INDICES
LIST OF ACRONYMS:
UNHCR United Nations High Commission for Refugees
BRICs Brazil, Russia, India and China
CGIg Coordenação-Geral de Imigração (General Coordination for Immigration)
CNIg Conselho Nacional de Imigração (National Council of Immigration)
CT&I Ciência, Tecnologia e Inovação (Science, Technology and Innovation)
GFB Global Financial Board
HDI Human Development Index
IKE Index of Knowledge Economy
MERCOSUL Common Market of the South
MJ Ministry of Justice
MRE Ministry of Foreign Relations
MTE MinistryofLaborandEmployment
OCDE Organization for Economic Cooperation and Development
IOM International Organization for Migration
WTO World Trade Organization
UNO United Nations Organization
PF Federal Police
PNUD United Nations Development Programme
RF Federal Income Tax Service
SELA LatinAmericanandCaribbeanEconomicSystem
SIAPRO System for Monitoring Processes
SINCRE Foreigner Registration System
SINTE International Traffic System
IT Information Technology
ITC Information and Communication Technology
UF Federative Unit
UNFPA United Nations Fund for Population
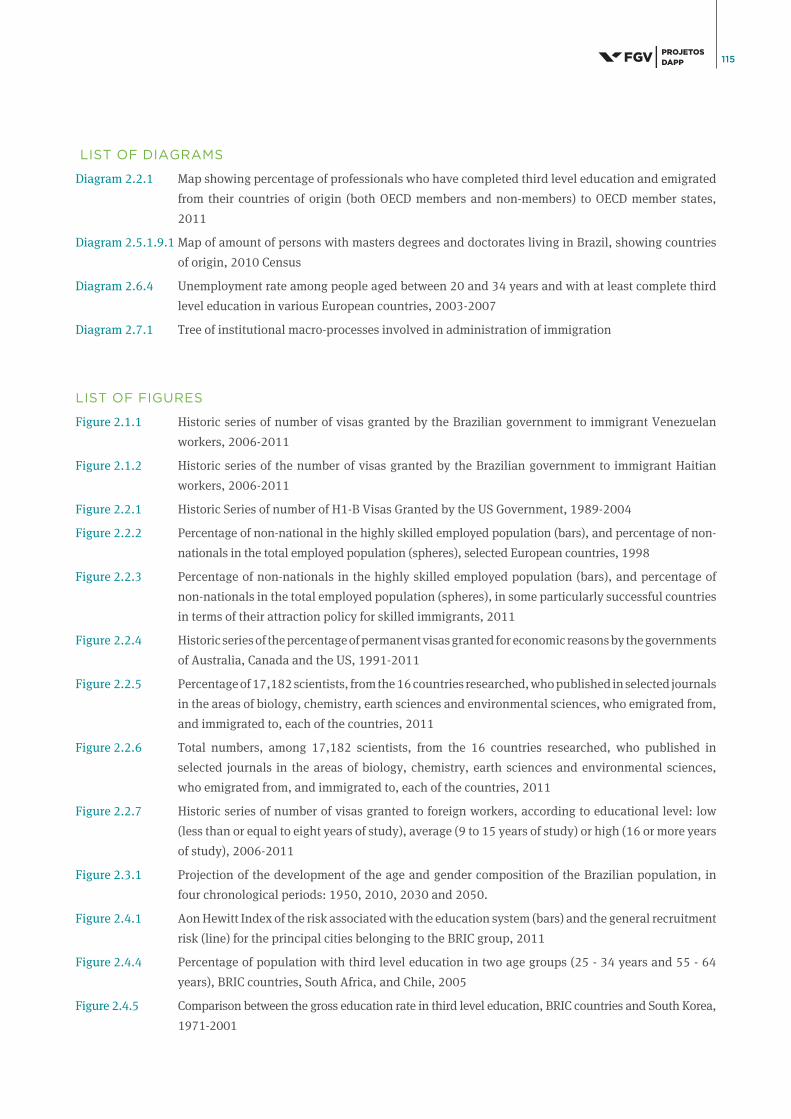
115
LIST OF ACRONYMS:
UNHCR United Nations High Commission for Refugees
BRICs Brazil, Russia, India and China
CGIg Coordenação-Geral de Imigração (General Coordination for Immigration)
CNIg Conselho Nacional de Imigração (National Council of Immigration)
CT&I Ciência, Tecnologia e Inovação (Science, Technology and Innovation)
GFB Global Financial Board
HDI Human Development Index
IKE Index of Knowledge Economy
MERCOSUL Common Market of the South
MJ Ministry of Justice
MRE Ministry of Foreign Relations
MTE MinistryofLaborandEmployment
OCDE Organization for Economic Cooperation and Development
IOM International Organization for Migration
WTO World Trade Organization
UNO United Nations Organization
PF Federal Police
PNUD United Nations Development Programme
RF Federal Income Tax Service
SELA LatinAmericanandCaribbeanEconomicSystem
SIAPRO System for Monitoring Processes
SINCRE Foreigner Registration System
SINTE International Traffic System
IT Information Technology
ITC Information and Communication Technology
UF Federative Unit
UNFPA United Nations Fund for Population
LIST OF DIAGRAMS
Diagram 2.2.1 Map showing percentage of professionals who have completed third level education and emigrated
from their countries of origin (both OECD members and non-members) to OECD member states,
2011
Diagram 2.5.1.9.1 Map of amount of persons with masters degrees and doctorates living in Brazil, showing countries
of origin, 2010 Census
Diagram 2.6.4 Unemployment rate among people aged between 20 and 34 years and with at least complete third
level education in various European countries, 2003-2007
Diagram 2.7.1 Tree of institutional macro-processes involved in administration of immigration
LIST OF FIGURES
Figure 2.1.1 Historic series of number of visas granted by the Brazilian government to immigrant Venezuelan
workers, 2006-2011
Figure 2.1.2 Historic series of the number of visas granted by the Brazilian government to immigrant Haitian
workers, 2006-2011
Figure 2.2.1 Historic Series of number of H1-B Visas Granted by the US Government, 1989-2004
Figure 2.2.2 Percentage of non-national in the highly skilled employed population (bars), and percentage of non-
nationals in the total employed population (spheres), selected European countries, 1998
Figure 2.2.3 Percentage of non-nationals in the highly skilled employed population (bars), and percentage of
non-nationals in the total employed population (spheres), in some particularly successful countries
in terms of their attraction policy for skilled immigrants, 2011
Figure 2.2.4 Historic series of the percentage of permanent visas granted for economic reasons by the governments
of Australia, Canada and the US, 1991-2011
Figure 2.2.5 Percentage of 17,182 scientists, from the 16 countries researched, who published in selected journals
in the areas of biology, chemistry, earth sciences and environmental sciences, who emigrated from,
and immigrated to, each of the countries, 2011
Figure 2.2.6 Total numbers, among 17,182 scientists, from the 16 countries researched, who published in
selected journals in the areas of biology, chemistry, earth sciences and environmental sciences,
who emigrated from, and immigrated to, each of the countries, 2011
Figure 2.2.7 Historic series of number of visas granted to foreign workers, according to educational level: low
(less than or equal to eight years of study), average (9 to 15 years of study) or high (16 or more years
of study), 2006-2011
Figure 2.3.1 Projection of the development of the age and gender composition of the Brazilian population, in
four chronological periods: 1950, 2010, 2030 and 2050.
Figure 2.4.1 Aon Hewitt Index of the risk associated with the education system (bars) and the general recruitment
risk (line) for the principal cities belonging to the BRIC group, 2011
Figure 2.4.4 Percentage of population with third level education in two age groups (25 - 34 years and 55 - 64
years), BRIC countries, South Africa, and Chile, 2005
Figure 2.4.5 Comparison between the gross education rate in third level education, BRIC countries and South Korea,
1971-2001

116
Figure 2.4.6 Comparison between the gross enrollment rate for third level, BRIC countries and South Korea, 2001-
2005
Figure 2.5.1.1.1 Percentage of visas granted to foreign workers by gender, 2006-2011
Figure 2.5.1.2.1 Total number of immigrants living in Brazil (aged 25 or over) by civil status, 2011
Figure 2.5.1.2.2 Total number of immigrants with masters degrees or doctorates living in Brazil (people aged 25 or
over) by civil status, 2010
Figure 2.5.1.3.1 Total number of immigrants living in Brazil by age group (persons aged 25 and over), 2011
Figure 2.5.1.4.1 Percentages of total immigrants living in Brazil per period in which they established residence
country (persons aged 25 and over), 2010
Figure 2.5.1.5.1 Percentage of immigrants living in Brazil who, in the year of reference, were continuing their studies
(persons aged 25 and over), 2010
Figure 2.5.1.5.2 Percentage of immigrants living in Brazil by type of qualification: not graduates, graduates, masters
degrees/doctorates (persons aged 25 and over), 2010
Figure 2.5.1.6.1 Percentages of immigrants with masters/doctorates living in Brazil by the period in which they
established residence in the country (persons aged 25 and over), 2010
Figure 2.5.1.6.2 Percentage of non-graduate immigrants living in Brazil by the period in which they established
residence in the country (persons aged 25 and over), 2010
Figure 2.6.1.7.1 Percentage of immigrants living in Brazil per domicile situation: urban versus rural (persons aged
25 and over)
Figure 2.5.1.8.1 Percentage of permanent work visas versus temporary visas granted by the Brazilian government,
2006-2011
Figure 2.5.1.8.2 Percentage of permanent and temporary work visas granted by the Brazilian government to highly
skilled workers (16 years of study or more), 2006-2011
Figure 2.5.1.8.3 Historic series of number of visas granted by the Brazilian government to foreign workers per length
of stay (temporary versus stay of four years or more), 2006-2011
Figure 2.5.1.8.4 Numbers of different types of work visas issued by the Brazilian government, 2006-2011
Figure 2.5.1.8.5 Numbers of visas issued by the Brazilian government to foreign workers with very high qualifications
(17 years of study or more), according to the types of visa and their length of stay (temporary versus
years or more), 2006-2011
Figure 2.5.1.8.6 Historic series of total number of work visas granted by the Brazilian government to highly skilled
foreign workers (16 years of study or more), 2006-2011
Figure 2.5.1.8.7 Historic series of total number of work visas granted by the Brazilian government to highly skilled
foreign workers (16 years of study or more), 2006-2011
Figure 2.5.1.8.8 Figure 2.5.1.8.8 Historic series of number of visas granted by the Brazilian government to university
professors and researchers, 2006-2011
Figure 2.5.1.9.1 Number of immigrants living in Brazil by country of origin (Ranking of the first 20) and the period in
which they established residence in the country (persons aged 25 and over), 2010
Figure 2.5.1.9.2 Historic series of the number of visas granted by the Brazilian government to foreign workers from
different countries, showing the four countries which most sent legal workers, 2006-2011

117
Figure 2.5.1.9.3 Historic series of number of visas granted by the Brazilian government to highly skilled foreign
workers (16 years of study or more) by country of origin, showing the four countries which most sent
workers in this category, 2006-2011
Figure 2.5.1.9.4 Total number of visas granted by the Brazilian government to highly skilled foreign workers (16
years of study or more) by country of origin, length of stay (bars, primary axis) and percentage
of number of visas for highly skilled workers in comparison with the total visas granted (spheres,
secondary axis), 2006-2011
Figure 2.5.1.9.5 Visas granted by the Brazilian government to foreign workers, by country of origin, according to
the ‘percentage of visas granted to workers who have at least completed third level education in
comparison with the total visas granted’ and ‘the total number of visas granted to workers who have
at least completed third level education,’ 2006-2011
Figure 2.5.1.10.1 Number of visas granted by the Brazilian government to foreign workers per destination UF, with
high (16 years of study or more), average (9 to 15 years of study) and low (less than or equal to 8
years of study), levels of education, 2006-2011
Figure 2.5.1.10.2 Number of visas granted to foreign workers in the category of professor or researcher by destination
UF, 2006-2011
Figure 2.6.1 Unemployment rate in European countries, per area of study and age groups, 2003-2007
Figure 2.6.2 Unemployment rate among people who have completed third level and are aged between 20 and 34
years in various European countries, 2003-2007
Figure 2.6.3 Unemployment rate among people aged between 20 and 34, by gender, in various European
countries, 2003-2007
Figure 2.6.5 Cross-tabulation between the unemployment rate in countries of origin (European countries plus
the US) and the total visas granted for four years or more to very highly skilled persons (17 years of
study or more), 2010
Figure 2.6.6 Number of visas granted by the Brazilian government to very highly skilled foreign workers (17 years
of study or more), by countries of origin (countries selected in accordance with previous figures),
2010
LIST OF TABLES
Table 2.1.1 Typology of negative impacts of migrations, based on alterations caused by previous financial crises
Table 2.4.2 Comparison of BRIC countries in accordance with the Human Development Index (HDI) and the
Knowledge Economy Index (KEI), 2012
Table 2.2.1 Non-discretionary migration in selected OECD countries, 2003
Table 2.6.1 Unemployment rate among people who have at least completed third level and aged between 20 and 34
years, by selected degree areas (selected countries in accordance with previous figures), 2003-2007

118

119

Top Related