


Languages
Pages
Legal


ii
Copyright © 2014 Ghana Statistical Service

iii
PREFACE AND ACKNOWLEDGEMENTS
The mandate of the Ghana Statistical Service (GSS), like many other national statistical
offices, includes data collection, compilation and analysis as well as dissemination of
statistical information in an accessible and user-friendly manner. In order to satisfy the needs
of users, GSS is required to analyse and interpret statistics in a form that makes it easily
understood for people to appreciate the value of the statistical information. There is also the
need to disseminate widely all the statistics produced by GSS so that all data users including
potential data users can have access to it.
Ghana, like many other developing countries, relies mainly on survey and population census
data for planning at the national and the sub-national levels. Detailed analysis of such data
provides users with a wealth of information for planning and policy formulation. Analysis of
the 2010 Population and Housing Census data on topical issues, therefore, provides
information for effective planning at all levels.
Several reports, including six monographs, were prepared using the 2010 Census data and
published in 2012 and 2013. The published reports from the census data was a collaborative
effort between the GSS and Local consultants from research institutions and universities in
Ghana with funding from the Government of Ghana and various Development Partners
(DPs). In order to strengthen the report writing capacities of the Ghana Statistical Service
(GSS) and Ministries, Departments and Agencies (MDAs) which are engaged in population-
related activities, professional staff of GSS and these MDAs were paired up with consultant
writers to prepare the reports.
The monograph on ‘Urbanisation in Ghana’ is one of the additional eight monographs that
has been prepared from the 2010 Population and Housing Census data and is meant to inform
policy makers on issues relating to urbanisation in Ghana. The report focuses on population
distribution in Ghana relative to the locality of residence (urban/rural), levels, trends and
differentials in urbanisation in Ghana as well as the drivers of migration in Ghana.
The Ghana Statistical Service wishes to thank the United Nations Children’s Fund (UNICEF)
and the United Nations Population Fund (UNFPA) for providing funds for the preparation of
this monograph and the lead role UNFPA played in mobilizing resources from the UN
System and from other DPs for the 2010 PHC. Our appreciation also goes to Professor
Stephen O. Kwankye and Ms. Marian Kpakpah for the dedication and competence they
demonstrated during the preparation of this report.
Dr. Philomena Nyarko
Government Statistician

iv
TABLE OF CONTENTS
PREFACE AND ACKNOWLEDGEMENTS ..................................................................... iii
LIST OF TABLES .................................................................................................................. vi
LIST OF FIGURES ............................................................................................................... vii
ACRONYMS AND ABBREVIATIONS ............................................................................ viii
CHAPTER ONE: INTRODUCTION ................................................................................... 1 1.1 Background Information ............................................................................................. 1
1.2 Definition of Concepts ................................................................................................ 2 1.3 Structure of the Monograph ........................................................................................ 5
CHAPTER TWO: OVERVIEW OF LEGAL, INSTITUTIONAL AND POLICY
FRAMEWORKS FOR URBANISATION IN GHANA ..................... 6 2.1 Introduction ................................................................................................................. 6 2.2 A review of factors that determined urbanisation in Ghana........................................ 6 2.3 Policies and programmes that have contributed to the urbanisation process
in Ghana ...................................................................................................................... 9 2.4 Legal, policy and institutional frameworks for urban planning and management .... 13
2.5 Conclusion ................................................................................................................. 14
CHAPTER THREE: URBANISATION IN GHANA ....................................................... 16 3.1 Introduction ............................................................................................................... 16 3.2 Urban and rural population distribution of Ghana, population of large towns and cities .................................................................................................................... 16
3.3 Levels and trends in urbanisation and differentials in Ghana ................................... 18
3.4 Drivers of urbanisation in Ghana .............................................................................. 19 3.5 Conclusion ................................................................................................................. 23
CHAPTER FOUR: ANALYSIS OF LIVING CONDITIONS IN URBAN AREAS ...... 24 4.1 Introduction ............................................................................................................... 24 4.2 Socio-economic characteristics of urban dwellers .................................................... 24
4.3 Housing ..................................................................................................................... 35 4.4 Water and Sanitation ................................................................................................. 43 4.5 Energy ....................................................................................................................... 50
4.6 Employment and economic status ............................................................................. 54 4.7 Conclusion ................................................................................................................. 66
CHAPTER FIVE: ANALYSIS OF INFORMATION COMMUNICATION
FACILITIES IN URBAN AREAS AND URBAN PLANNING ...... 69 5.1 Introduction ............................................................................................................... 69 5.2 Use of the internet ..................................................................................................... 69 5.3 Use of computers ....................................................................................................... 70 5.4 Use of cell phones ..................................................................................................... 71 5.6 Conclusion ................................................................................................................. 73
CHAPTER SIX: URBAN MOBILITY ............................................................................... 74 6.4 Introduction ............................................................................................................... 74 6.2 Urban mobility and school attendance ...................................................................... 74 6.3 Urban mobility and health facility ............................................................................ 79 6.4 Urban mobility and place of work............................................................................. 83

v
6.5 Urban transport availability and reliability ............................................................... 86
6.6 Conclusion ................................................................................................................. 88
CHAPTER SEVEN: CONCLUSIONS, RECOMMENDATIONS AND POLICY
IMPLICATIONS ............................................................................. 90 7.1 Summary ................................................................................................................... 90
7.2 Conclusions ............................................................................................................... 93 7.3 Policy Recommendations .......................................................................................... 94 7.4 Policy Implications .................................................................................................... 96
REFERENCES ....................................................................................................................... 98
APPENDIX ........................................................................................................................... 101
vi
LIST OF TABLES
Table 3.1: Population by 5 year age groups, sex and type of locality i.e., urban and rural ... 17 Table 3.2: Population distribution by region, sex and locality of enumeration, 2010 ........... 18 Table 3.3: Trends in urbanisation, 1960 - 2010 ..................................................................... 19
Table 3.4: Volume of net-migration by region, 1984-2010 ................................................... 20 Table 3.5: Contribution of migration and rate of natural increase to urban population growth by region ................................................................................................... 22 Table 4.1: Urban population 11 years and older by sex, literacy status, language in which literate by region ................................................................................................... 26
Table 4.2: Urban population 3 years and older by sex, level of education and region .......... 28 Table 4.3: Population 12 years and older in urban localities by sex, marital status and region .................................................................................................................... 32
Table 4.4: Population 12 years and older in urban localities by sex, religious affiliation and region.............................................................................................................. 34 Table 4.5: Households in urban localities by type of dwelling and by region ....................... 36 Table 4.6: Households in urban localities by main construction material for outer wall,
floor and roof by region ........................................................................................ 38 Table 4.7: Households in urban localities by ownership type, tenure arrangement and region.............................................................................................................. 40 Table 4.8: Households in urban localities by number of rooms, sleeping rooms occupied
and region.............................................................................................................. 42 Table 4.9: Households in urban localities by main source of drinking water, source of
water for other domestic use and region ............................................................... 44 Table 4.10: Households in urban localities by type of bathing and toilet facilities and
region .................................................................................................................... 46 Table 4.11: Households in urban localities by method of solid waste and liquid waste disposal and region ............................................................................................... 49
Table 4.12: Households in urban localities by main source of lighting and region ................. 51 Table 4.13: Households in urban localities by main source of cooking fuel and type of
cooking space by region........................................................................................ 53 Table 4.14: Employed population 15 years and older in urban localities by sex, employment status and region .............................................................................. 55 Table 4.15: Employed population 15 years and older in urban localities by sex, occupation
and region............................................................................................................. 57 Table 4.16: Employed 15 years and older in urban localities by sex, employment sector and region............................................................................................................. 60 Table 4.17a:Employed population 15 years and older in urban localities by industry
and region............................................................................................................. 63 Table 4.17b:Employed male population 15 years and older in urban localities by sex, industry and region .............................................................................................. 64
Table 4.17c:Employed female population 15 years and older in urban localities by sex, industry and region .............................................................................................. 65 Table 6.1: Percent of persons in urban localities by average distance (km) from residence to school and region .............................................................................. 75 Table 6.2: Percent of persons in urban localities by waiting time for transport to school
and region.............................................................................................................. 77 Table 6.3: Percent of persons in urban localities by average travel time (minutes) to school and region .................................................................................................. 78

vii
Table 6.4: Main difficulties faced in going to school by region ............................................ 79
Table 6.5: Average distance (km) to health facility by region .............................................. 80 Table 6.6: Waiting time for transport to a health facility by region ...................................... 81 Table 6.7: Average travel time to health facility by region ................................................... 82 Table 6.8: Main obstacles faced visiting a health facility by region ..................................... 83
Table 6.9: Average distance (km) from residence to place of work ...................................... 84 Table 6.10: Average travel time to workplace by region......................................................... 85 Table 6.11: Availability of transport by region ....................................................................... 87 Table 6.12: Reliability of transport by region .......................................................................... 88
LIST OF FIGURES
Figure 5.1: Population of urban localities 12 years and above using internet by sex
and region............................................................................................................... 70
Figure 5.2: Urban Households with ownership of desktop and laptop computers by region .. 71
Figure 5.3: Urban Population 12 and above having mobile phones by sex and region ........... 72
Figure 5.4: Urban Households with ownership of fixed lines by region ................................. 72
viii
ACRONYMS AND ABBREVIATIONS
AFD Agence Française de Dévelopement
CAP 84 Town and Country Planning Ordinance
ERP Economic Recovery Programme
GPRS Ghana Poverty Reduction Strategy/Growth and Poverty Reduction Strategy
GSS Ghana Statistical Service
ICT Information Communication Technologies
IDA International Development Agency
IMF International Monetary Fund
KVIP Kumasi Ventilated Improved Pit
LPG Liquid Petroleum Gas
MDAs Ministries Departments and Agencies
MMDAs Metropolitan Municipal and District Assemblies
MTDP Medium-Term Development Plan
PHC Population and Housing Census
SAPs Structural Adjustment Programme
TC&PD Town and Country Planning Department
1
CHAPTER ONE
INTRODUCTION
1.1 Background Information
Ghana’s population has witnessed not only rapid growth but also rapid urbanisation since
independence. This has been fuelled by policies during the colonial period which have been
largely sustained through the post-independence era as well as the interplay between natural
population increase and migration. It is thus, often perceived that development in the urban
areas is relatively better compared to that in the rural places of residence because of the
development bias in favour of the urban areas. For example, Brown (1986) argues that after
many years of political independence, the living conditions of the rural majority have not
changed and consequently, the rural poor have not been able to share the benefits that have
arisen from national growth (Olatunbosun, 1976). In the area of health, it was observed that
there was a greater concentration of medical services, facilities and personnel in the towns
and large cities (Brown, 1986) although at the time about 70 percent of the population in the
country was in rural areas. These observations in the 1980s suggested that people in the urban
areas were better off compared to their counterparts in the rural areas. This perception has
since been sustained and has fuelled rural-urban migration in the country.
As a result of a combination of several factors, Ghana has moved from a more rural
population to urban with more than half (50.9%) of the country’s population reported to be
residing in urban localities in 2010. From the national population censuses, the proportion of
the population urban rose from a low of 23 percent in 1960 through 29 percent and 32 percent
respectively in 1984 and 2000 to its 2010 record of almost 51 percent (See the 1960-2010
census reports). Comparatively, the urban population has recorded a more rapid growth than
the rural. It has been recorded that the urban population grew by 4.7 percent per annum
during 1960-1970, declined to 3.3 percent in 1970-1984 and picked up again during 1984-
2000 with 4.6 parent annual growth rate. The corresponding growth rates for the rural
population during the same periods were 1.6 percent, 2.3 percent and 1.5 percent giving a
tempo of urbanisation of 3.2 percent, 1.1 percent and 3.1 percent respectively for the 1960-
1970, 1970-1984 and 1984-2000 intercensal periods (Ghana Statistical Service, 2005:399).
This indicates a big difference between the rate of growth of the urban and rural population in
Ghana, reflecting a shift of the population from rural to urban localities while at the same
time portraying that some rural localities have become urban over time.
It is also important to state that population distribution has largely been uneven as a result of
differences in the attraction of each locality based on a number of factors including historical
advantage or otherwise of each locality, natural resource availability and utilisation as well as
policies which directly or indirectly affect population re-distribution in the country. The
uneven spatial distribution of the population also suggests that Ghana is experiencing urban
primacy where only eight of the 88,656 localities recorded in 2000 had population of 100,000
or more but represented almost one-fifth of the total population of the country. At the same
time, all localities classified as urban numbered 366 in 2000 (i.e., 4.1% of all localities in the
country at the time) but had a population that was close to half of the country’s total
population (See Ghana Statistical Service, 2005).
2
To enhance rapid economic growth, development and poverty reduction, urbanisation is
important. However, the gains made will depend on its pattern across the country. With
Ghana depicting a situation of urban primacy, which is fraught with serious developmental
challenges, including overcrowding and housing problems, emergence and expansion of
slums, inadequate urban services and facilities, high rates of unemployment, environmental
sanitation as well as crime and other anomic social behaviours, it may be equally challenging
for the nation to reap the benefits of rapid urban growth. However, the dimensions of these
challenges and or benefits that could be derived from a rapidly urbanising population could
only be seen when they are subjected to in-depth analysis using data such as from the national
censuses.
Against this background, this monograph examines urbanisation in Ghana with the aim of
bringing out the challenges it poses to development and the opportunities it offers in the
country’s drive towards achieving a higher middle income economy. Specifically, it seeks to
present an overview of the legal and policy frameworks that have directly or indirectly
affected the pattern and trend of urbanisation in Ghana in order to better appreciate the
urbanisation situation in the country. It is also interested in assessing the living conditions
and socio-economic characteristics of urban dwellers in the country in order to make
appropriate recommendations towards addressing the challenges that are associated with
urbanisation in Ghana and ultimately improve the quality of life of Ghanaians.
The main source of data for the analysis is the 2010 Ghana Population and Housing Census
(PHC) with respect to the population reported to be resident in localities classified as urban.
In addition to the 2010 PHC, the Ghana Statistical Service (GSS) conducted a National
Household Transport Survey in 2007 and 2012 that provide relevant data to aid an analysis of
urban mobility and the challenges that urban dwellers are confronted with regarding their
intra-city movements. These two datasets are, therefore, used to examine the urban mobility
situations in Ghana in Chapter Six of the Monograph. Wherever it is applicable, however, the
results from the 2010 PHC and the two transport surveys are compared with earlier data to
see what changes might have occurred with time.
By way of methodology, the analysis relies on descriptive statistics in presenting the results.
Cross-tabulations using percentages are adopted throughout the report. It also uses a
comparative analytical approach in discussing the results of the analysis. Consequently,
regional comparisons are made to examine the urbanisation situation in the 10 administrative
regions in Ghana. Furthermore, comparison is made by sex wherever is applicable in order to
bring out the gender differences by region. Tables and charts where appropriate are used in
presenting the results. The analysis also uses the Gini concentration ratio to examine the level
of uneven distribution of the population in each region.
1.2 Definition of Concepts
The key concepts in this Monograph are urbanisation, urban locality/area, urban growth,
urban slum, large towns, small towns and cities, urban primacy and urban agglomeration. The
concept of urban has not only been defined but an attempt is made to examine its use in
Ghana over the years to assess its appropriateness in addressing what it is used for.
Urbanisation: The term Urbanisation is used to describe the process of growth or increase in
the population that is reported to live in localities classified as “urban” in Ghana. This is
presented relative to the population living in localities which are defined as rural. In censuses,
the proportion of the total population living in settlements defined as “urban” is used to show

3
how slow or rapid the process of growth of this population has been in the country. This
process involves some localities losing some of their population to other localities due to
several factors including migration. Again, some localities could increase their population
and thereby cross over from rural to urban. The process of urbanisation, therefore, brings in
its tray challenges including population increases and or the spread of the population over a
larger land space which in turn could create other challenges for socio-economic
development.
Urban locality/area or centre: The term urban may mean differently depending on which
country is involved. Therefore, no universally acceptable definition exists in the literature.
According to the Wikipedia, an urban area is characterised by higher population densities and
vast human features in comparison to the areas that surround it and these may be classified as
cities, towns or conurbations (www.en.wikipedia.org/wiki/Urban_area 07/11/13). These areas
are continuously being created as the drivers of urbanisation continue to operate.
It is, however, most convenient to use a threshold population size to determine localities that
can be considered as urban or rural. Based on this convenience, Ghana has over the years
defined an urban area to include all localities with 5,000 or more population. All national
censuses that have been organised in Ghana have so defined urban localities. Apart from its
convenience, it is simple and easier to determine at any given point in time which localities
can be classified as urban or otherwise based simply on the size of the population of the
localities. However, this approach to defining an urban locality is too simplistic and lends
itself to some weaknesses and often does not provide a standard basis for comparison since
the composition of the population in any two such localities with population size of 5,000 or
more may not necessarily be the same in terms of socio-economic activities or services
engaged in by the population.
It is perhaps against this background that in some countries, the population size alone is not
enough to classify an urban locality. Other considerations including the type of economic
activity that is largely depended upon by the population are considered. For example, if in
addition to the minimum population size, the majority of the population is engaged in non-
primary economic activities, it could be classified as urban. While this added requirement
may be good, it is not easy to monitor the economic activities of each locality to apply the
classification formulae as these activities are subject to change with time.
Furthermore, urban settlements have been determined through the application of
administrative criteria which may have little or no relationship with the actual physical extent
of the urban area (See National Urban Policy of Ghana). This is simply by administrative fiat
as a result of some unique policy that a government wants to implement to achieve the
purpose of some spatial equality in development. An urban status classification could also be
done based on the functions each settlement performs. For example, settlements whose
functions are largely non-agricultural could be presumed to be urban while others that
function as agricultural economies are considered as rural. In addition to all these, one could
make a case for the inclusion of the availability of certain minimum social facilities like
health facilities, educational infrastructure and energy consumption.
Admittedly, adding the functional classification and economic activities to the population size
in determining what an urban locality or centre should be may be quite complicated. Yet, it is
about time some mechanism is found to consider some of these other proposals so as not to
leave the classification based solely on a minimum population size in Ghana. This is because
4
an area could easily attain the 5,000 threshold population to qualify as urban but still maintain
its rural outlook based on the economic activities the residents may be engaged in. Besides, it
may not boast of any modern infrastructure or facility that urban dwellers are generally
expected to enjoy, including educational, health, energy and environmental facilities or
services.
In the light of these challenges and limitations the different definitions present, it is suggested
that Ghana takes a second look at the definition of urban locality in subsequent censuses. It is
thus proposed that an analysis is done on the main economic activities of the population and
every locality which has more than 60 percent of its residents to be engaged in non-
agricultural activities in addition to having a minimum population size of 5,000 is classified
as being an urban locality, area or centre. In the meantime, and for the purpose of the analysis
in this Monograph, however, an urban centre is still defined using the population size cut-off
of 5,000 or more. In line with this reasoning, therefore, all localities in Ghana with population
of 5,000 or more are classified as urban in this Monograph.
Urban growth: This is used to describe increases in the population of an urban locality or
area between two points in time. The growth in population may or may not involve spatial
expansion of the locality.
Urban slum: An urban slum is used to describe very low class settlements within or close to
cities or large towns which are unplanned and often spring up spontaneously. They are
usually densely populated and lack the basic infrastructure and facilities that most urban
localities are associated with including potable water, health facilities, schools, road network,
etc. Urban slums are usually major residential areas for the urban poor and recent migrants
into the city who may not be able to immediately afford descent housing and accommodation
at high and middle class residential areas in the city. Housing structures are usually
temporary and made up of poor materials including card boards, mud and thatch.
Urban agglomeration, conurbation or urban sprawl: This is used to describe the process
where a city or town rapidly grows spatially to annex other nearby localities which originally
were not part of the city or town such that it is difficult to find where the boundary of the city
or town ends and other “annexed” localities begin. Often, the localities that eventually
become part of the city or town may suffer from challenges of lack of basic household
facilities or services, including electricity, potable water supply, sanitation, health and
education.
Urban primacy: This concept describes the situation where rapid urbanisation is driven
largely by the growth in the size of a few cities or towns. In such situations, one or two cities
become more prominent among all the urban localities and that apart from these huge cities
and towns all other urban localities are small in size with a huge gap between them in terms
of size.
Large towns: Large towns refer to localities that have 20,000 or more population as has been
used in the 2000 PHC.
Small towns: These describe any locality with a population of between 5,000 and 19,999 in
Ghana.
Cities: Cities refer to Accra, Kumasi and Takoradi.
5
1.3 Structure of the Monograph
This Monograph is divided into seven chapters including the introduction. The introductory
chapter provides background information on urbanisation in Ghana since the pre-colonial
period and discusses the key concepts and the methodology. In Chapter Two, an overview of
the legal, institutional and policy framework for urbanisation in the country is presented,
highlighting some of the main policies and laws that have directly or indirectly affected the
process of urbanisation in Ghana. The Chapter also informs readers on the institutions and
structures in place that have been responsible for managing urban planning in the country in
addition to the role of organisations towards urban planning. Chapter Three examines
urbanisation comparing the distribution of population by type of locality looking at the levels
and trend of urbanisation in addition presenting the key drivers of urbanisation in Ghana.
Special attention is paid to an examination of natural increase and migration regarding which
of them is stronger in driving urbanisation in Ghana.
The Monograph further analyses in Chapter Four the living conditions and characteristics of
the population in urban areas in Ghana in terms of their education and literacy, religion,
housing, water and sanitation, energy, employment and economic characteristics. This is
followed with a discussion of the use of information communication facilities including the
internet, computers and mobile phones in the urban areas in the country in Chapter Five.
Further attention is paid to an examination of urban mobility in Chapter Six where the
obstacles urban dwellers face in terms of commuting to school, health facilities and work
daily are presented. Finally, Chapter Seven provides a summary of the key findings and
presents the conclusions, recommendations and policy implications.
6
CHAPTER TWO
OVERVIEW OF LEGAL, INSTITUTIONAL AND POLICY
FRAMEWORKS FOR URBANISATION IN GHANA
2.1 Introduction
This chapter presents a general overview of the legal, institutional and policy frameworks that
have informed, shaped or directed the process of urbanisation in Ghana since the pre-colonial
era. It provides a brief account of the relevant policies and historical as well as socio-
economic and environmental factors that have informed the pattern and pace of urbanisation
in the country. In addition, the institutional structures that have supported and continue to
support urban development have been examined. The presentation suggests that long before
colonial administration, conditions existed to support urbanisation in Ghana with some
settlements having earlier advantage in attracting more inhabitants than others. Later, policies
adopted by the colonial and post-colonial political administration have also reinforced the
urbanisation that had earlier commenced.
2.2 A review of factors that determined urbanisation in Ghana
Consistent with observed trends in the rest of Africa, Ghana has been experiencing rapid
urbanisation. Ghana’s urban population has grown from only 9.4 percent in 1931 to 13.9
percent in 1948, 23 percent in 1960, 28.9 percent in 1970, 31.3 percent in 1984, and 43.9
percent in 2000 to 50.9 percent in 2010. Using the census definition of an urban centre, more
than one in two people in Ghana lived in a town or city with more than 5000 people in 2010.
From available data, the rising pace of urbanisation in Ghana has been driven by rural-urban
migration, natural increases in towns and cities and the reclassification of villages as they
attain the threshold population of 5,000 (Ghana Statistical Service, 2013: 223). Most writers
have categorised Ghana’s urban and rural development in three distinct phases as pre-
colonial, colonial and post-colonial periods and these are very much related to the manner in
which the country has developed in space and time.
2.2.1 Pre Colonial Phase
It is evident that trade and commerce have been the foundation of the formation of many
towns in Ghana today. According to Songsore (2003), although urban settlements have been
widespread in Africa for centuries, urban life was not a feature of sub-Saharan Africa until
the mediaeval period. Despite this, sub-Saharan Africa featured a rich variety of civilisation
in which religion played a key role and formed the basis for the eventual transformation and
development of the urban centres. Due to the presence of the River Niger, Islamic civilisation
took root in the early centuries with many “Saharan” empires flourishing in the northern and
southern fringes of the Sahara along the desserts and grasslands. Some of these settlements
such as Gambaga, Nalerigu, Yendi and Wa emerged as important seats of government and
trading centres during trade with Western Sudan in the period between the 11th and 16th
centuries. Dickson (1970 and 1971 as cited by Songsore, 2003), shows that commercial
centres that developed within the same period included Walewale, Savelugu, Lawra and
Larabanga. Others, including Begho, Salaga and Kumasi developed further inland along
major trade routes in the north-eastern parts of northern Ghana.

7
By the end of the 16th Century, most ethnic groups constituting the modern Ghanaian
population had settled in their present locations. The fall of the Songhai Empire to Morocco
at the end of the 16th Century marked the close of an era of economic prosperity and urban
development for the forest areas of Ghana. By the middle of the 15th Century, the Portuguese
merchants arrived on the coast of West Africa. This was soon followed by the British and
French. The arrival of the European traders shifted the focus of economic activities from the
northern savannah areas. With the fall of the Western Sudan trade routes, West Africa as a
whole saw new trading opportunities with the Europeans across the Atlantic Ocean.
(Songsore 2003) documents that a string of towns developed along the coast, mainly in
Elmina, Cape Coast and Accra. This was followed by a complex set of middle towns that
emerged connecting the colonial forts and castles on the coast to the sources of raw materials
in the hinterland. A significant town was the Asante capital, Kumasi which also served as a
terminal point for the northern trade through Northern Ghana to Western Sudan which was in
decline.
These activities signaled the beginning of a redistribution of the spatial arrangement of
Ghana. In addition, a new urban system had emerged from the European costal trade.
Although trade was controlled on both sides, it was carried on by merchants and middlemen
acting as intermediaries between the Europeans and hinterland cities. This resulted in the
patterns of urban development, including sets of towns springing up around these trading
centres on the coast, middle and hinterland of Ghana some of which have remained to date
(Songsore, 2003). This period marked the beginning of the first phase of the urban and spatial
arrangements of the country where the coast and the forest areas became conditioned for
more urban development as a result of its better integration with European trade (Dickson,
1970).
2.2.2 Colonial Phase
The second phase of Ghana’s urbanisation process was the period of colonialism. The years
of British administration of the Gold Coast during the 20th Century were an era of significant
progress in social, economic and educational development. This development was uneven
and skewed in favour of the regions with already identified natural resources. As such, areas
that were suited for the growth of cash crops, timber exploitation and mining or close to the
coast benefitted from these investments. This situation further deepened the gap between
developments in the southern parts of the country compared to the northern half.
According to Adarkwa (2012), two main structures became evident in the spatial economy of
the country. A centre-periphery structure emerged under which the centre consisted of a
forest belt where production of raw materials was concentrated with Kumasi as the centre of
this system. The second type of growth region consisted of coastal towns which played a
crucial role in the import-export activities with Sekondi-Takoradi and Accra becoming the
most important centres. These three towns – Accra, Kumasi and Sekondi-Takoradi thus
monopolised much of the modern social infrastructure in the country (Songsore, 1979;
Songsore, 1989). The result was an increase in the population of these towns. Evidence from
census reports indicates that in 1921, 7.8 percent of the population lived in urban centres and
hit a little more than 50 percent in 2010. Along with this increasing population was the
increase in the concentration of the population in settlements of 5,000 or more, although this
concentration is dominated by Accra and Kumasi (Owusu, 2005). This, according to Dickson
(1968), partly accounts for the underdevelopment and least urbanised nature of the Upper
East, Upper West and Northern regions, which hitherto had persisted.
8
Thus, Ghana’s colonial towns did not develop as industrial centres, but rather as operational
centres meant to facilitate the extraction of raw materials and the politico-administrative
system on which this depended (Rakodi, 1997). Furthermore, and in a bid to support the
diverse demands of a thriving and growing market economy, as well as to provide the needed
administrative support to these commercial centres, transport infrastructure, especially
railways, was developed to connect the ports to their hinterlands (Gugler and Flanagan, 1978;
Mehretu, 1983; Coquery-Vidrovitch, 1991). Songsore (2003) argues that the “colonial city”
developed as a centre of commerce and administration rather than as a result of industrial
production. This led to the growth of urban centres in Accra for instance, where the
population doubled to 38,000 between 1911 and 1921 and reached 200,000 by the 1940s
(Collins, 2004), by which time Kumasi which was experiencing the cocoa boom grew to
70,000. As the colonial administrators and early settlers made their home in-country, their
health, living environment, education of their children and wards as well as other concerns
for social services became apparent. This gave rise to the establishment of rudimentary local
government (King, 1990). It was during this period that the then colonial governor, Governor
Guggisberg introduced the Infrastructure Development Plan spanning the period 1919-1926.
The implementation of this plan which resulted in the construction and establishment of
several schools and colleges as well as health facilities further gave a boost to the process of
urbanisation with settlements that benefited from such educational and health infrastructure
becoming urbanised within a short space of time.
The pattern of uneven regional development was a direct result of colonial policies and
strategies which in turn influenced the distribution of the country’s population.
2.2.3 Post-Independence Phase
Following independence of the country, the favoured development strategy was based on
modernisation, industrialisation, economic diversification, and indigenisation of the economy
(www.mongabay.com/history/ghana 08/10/13). Given the heavy reliance on the production of
raw materials in the colonial period, the infrastructure was already available in the large
towns of Accra, Sekondi-Takoradi and Kumasi thus supporting the emergence and growth of
the modern industries and markets. Post-independence strategies were directed at
industrialisation in these urban centres. It was expected that this top-down development
strategy in which capital investments were concentrated in urban centres would stimulate
growth that would trickle down to other sectors of the economy and to the rural and
peripheral zones. Unfortunately, this development strategy failed to transform the economy
and to bring about the much desired spatial integration and regional development (Yankson,
2006). According to Songsore (2003), however, the post-colonial import-substitution
industrialisation was merely replaced and legitimised by the manufacturing of the same
products locally.
In African countries, including Ghana, changes associated with independence increased the
attraction of cities. The growth of civil service, attempts to industrialise, and the
abandonment of remaining relics of influx control gave a boost to rural-urban migration. The
centralisation of politics and bureaucracy formed a further attraction to investors who needed
access to the state machinery, resulting in the emergence of many new towns along the
fringes of the main urban centres (Rakodi, 1992).
9
The cumulative result of this was a deepening of the rural-urban migration in the country
with a continued expansion of the urban centres. Songsore (2003) and Owusu (2005) both
indicate that although Ghana’s urban population has undergone a number of changes in the
last 30 years, the proportion of the total population living in these centres has changed little
over the years. Owusu (2005) concludes that government policies, e.g., the introduction of
cocoa centres and decentralisation were a major contributory factor to the growth and
proliferation of urban centres across the country.
2.3 Policies and programmes that have contributed to the urbanisation
process in Ghana
The close association between economic development and urbanisation has been well-
documented. In an examination of the impact of urbanisation on the socio-economic and
political development of Ghana, Adarkwa (2012) concludes that the spatial form, urban
infrastructure and urbanisation have changed tremendously since the pre-independence era.
He writes that the colonial development policies greatly influenced spatial and physical
development of towns in the country. This originated from the investment strategies of the
colonial authorities which concentrated development in areas with exploitable resources, thus
attracting population and development to some areas of the country relative to other parts.
(Owusu, 2005).
2.3.1 Colonial Polices and programmes
Land use in the pre-colonial days was governed by customary laws and social norms. By the
latter part of the 19th Century, there was a gradual shift from this traditional system of land
use planning as the form and structure of Accra changed. Accra had become the nerve centre
of the administrative, political and economic activities of the country. This caused an ever-
increasing demand for land by government, commercial firms and individuals alike for
developmental purposes such as roads, residential buildings and other public works and
government began to legislate for modern town planning.
In 1876, the Colonial Government enacted the Public Lands Ordinance in order to acquire
lands for the new seat of government and new capital. A Town Council was set up in Accra
under the Town Council Ordinance of 1876 with powers to deal with environmental
sanitation, the provision of infrastructure to ensure orderly planning of the town, the control
and erection of buildings and the layout of streets (Quarcopome, 1992).
On 21st April 1945, the Town and Country Planning Ordinance (Cap 84) came into force “to
provide for the orderly and progressive development of land, towns and other areas to
preserve and improve their amenities and for related matters.” This formed the basis for
zoning and building codes which were strictly enforced in the urban centres.
The colonial administration ensured that areas inhabited by Europeans were low-density
areas that were properly planned with adequate sanitation, recreational and spatial needs.
There was strict compliance with regulatory building standards. Only buildings with
materials of stone, concrete, brick and metal roofing materials were allowed. Efforts to
accommodate the country’s non-European population were, however, not matched with
similar efforts. In contrast, the indigenous population lived in unplanned areas with poor
sanitation. (Stanley 1876 as quoted by Grant and Yankson, 2002), described these areas as
“one of mass thatched buildings arranged in a haphazard manner and separated by crooked
streets.” The indigenous migrant population who were arriving from the rural areas as a

10
result of the attractions and development of the urban centres found themselves in fringes of
the urban areas such as Accra New Town and Nima which at that time were not part of Accra
proper. Coupled with colonial racial segregation policies, these areas that fell outside the
planning jurisdiction of Accra were, therefore, unregulated and quickly developed as squatter
settlements or shantytowns. This pattern set in motion a pattern of spatial segregation in
Ghanaian towns which continued to independence (Adarkwa, 2012).
Apart from the enactment of town planning legislations, colonial authorities influenced
spatial development other ways. Prominent among this was the creation and or designation of
existing towns as colonial administrative centres. For example, when the colonial authorities
relocated the colonial capital from Cape Coast to Accra in the 1870s, there was a rapid
increase in the population of Accra whilst there was a slow-down in the growth and
development of Cape Coast (Njoh, 2007). According to Owusu (2005), by 1950, 15.4 percent
of the population was living in urban centres, having doubled from 7.8 percent in 1921 with
3.4 percent and 1.9 percent domiciled in Accra and Kumasi respectively. This prompted the
then colonial governor, Sir Gordon Guggisberg to initiate plans to expand the city through the
launching of his Infrastructure Development Plan. Guggisberg’s Development Plan of 1920-
1930 set the foundation for the construction of infrastructural facilities in mineral and
agricultural endowed regions in Ghana, thus confining development to the forest and coastal
towns of Kumasi, Accra and Sekondi-Takoradi (Tetteh, 1992). A pattern of settlement
distribution was consequently set in motion and later reinforced by subsequent development
plans and policies in the post-colonial era (Tawiah, 1994: Songsore, 2009). Notable among
these was the construction of a bridge across the Korle Lagoon to open up the land west of
the Lagoon to human settlements. In addition, other government projects such as the building
of hospitals, schools and railroads altered the country’s spatial structure and increased the
population in the urban centres.
Ghana saw the emergence of an industrial core region made up of Kumasi, Accra and
Sekondi-Takoradi which together accounted for 86 percent of all registered industrial
enterprises in the country during the post-independence era (Songsore, 1979). Today,
population distribution in the country is dominated by these regions. Accra has undoubtedly
emerged as the city that has benefited the greatest from this trend of urbanisation in Ghana,
and government policies over time tend to reinforce this pattern. It has been singled out as a
growth pole under the West African ‘gateway concept’ and the Vision 2020 Policy document
for example anticipated that Accra, over time, will emerge as the financial capital of Africa
competing with Nairobi and Johannesburg (GoG, 1995). The story is no different when it
comes to investments.
A recent report on the distribution of in-flows indicated that 78.9 percent of all projects
registered in the first quarter of 2011 were located in the Greater Accra Region (Kunateh,
2011). This results in a promotion of polarisation of urban development in the country
(Songsore, 2009) and further undermines implementation of the objective of “adopting
measures to influence the volume and patterns of migration and to promote a more rational
distribution of population and development between urban and rural areas and between zones
and regions of the country” as stipulated under the National Population Policy of Ghana.
According to Ayinam (1994), such development strategies are among the principal causes of
inequalities in Ghana’s space economy and acts as an impetus for migration to major cities
such as Accra.

11
2.3.2 Post-Independence Policies
Following independence, Nkrumah sought to transform the country into a modern semi-
industrialised state, making the state machinery, the agent of development. He launched the
1963/64–1969/70 Plan for National Reconstruction and Development focusing on
industrialisation. Songsore (2010) observes that the industrialisation drive at that time was
concentrated in the “golden triangle” of Accra -Tema, Kumasi and Sekondi-Takoradi and did
little to eliminate the north-south divide that had been created as a result of concentrated
developments in the southern parts of the country. Accordingly, during this period, Accra-
Tema accounted for 59.1 percent of industrial establishments with Kumasi and Sekondi-
Takoradi accounting for 16.5 percent and 10.2 percent respectively. Nkrumah’s industrial
policy also saw the creation and expansion of infrastructure such as roads, railways,
communications and housing. Several kilometres of tarred roads were constructed connecting
major towns, most importantly the Accra-Takoradi-Axim-Tarkwa road, the Kumasi-Tamale
trunk road and the Sogakope Bridge over the Volta River linking the Volta Region with other
parts of the country. Other rail transport connecting Achiase in Huni Valley to the Accra-
Kumai rail line at Kotoku near Nsawam and the Achimota-Tema railroad contributed
substantially to the growth of towns along arterial roads (Owusu, 2005). Owusu concludes
that, the combination of these factors and the spill over effects from large urban centres, have
contributed to the growth of towns that eventually grew to become large urban centres.
Furthermore, the period of economic decline between 1972 and 1984 which saw cuts in
wages and massive retrenchment also saw the emergence of an informal sector which helped
in the alleviation of poverty in urban areas (Bawa, 1995). Many migrants found means of
livelihood in the informal sector in urban areas. From that time, the informal sector has
remained the single most significant source of employment in the country, engaging about 60
percent of the non-agricultural employment, as compared to 15.6 percent of the formal sector
(ILO/JASPA, 1989).
In the early 1980s, following the downtrend in economic performance, Ghana launched an
Economic Recovery Programme (ERP) in 1983 that sought to implement the prescriptions of
the World Bank and the International Monetary Fund (IMF). The first phase of the
programme covered four years, 1983-1986, followed by a second phase (ERP II) that
proceeded to 1991. The first phase of the programme focussed on stabilisation and
liberalisation and aimed to establish a new macro-economic policy framework to reverse the
downward trend of the economy and to put it back on the path of growth. The second phase
was meant to consolidate the gains and maintain the progress towards sustained growth.
Studies have indicated that the liberalisation policy introduced in Ghana in this period had an
impact on the manufacturing economy and employment and consequently on urban
development which has continued to date. Yankson (2005) shows that in the case of Accra,
trade liberalisation allowed easier access to commodities including building materials which
led to the development of residential properties around the perimeters of the city of Accra
extending to Tema Municipal and the Ga District, thus contributing to the physical expansion
of Accra. He goes on to indicate that similar developments have taken place in other urban
centres of the country, though to a lesser degree. In addition, liberalisation of the financial
sector has fuelled the growth of the housing industry as most of the transactions are
conducted in foreign currencies, therefore making it lucrative to own a property in an urban
centre. A classic example is the recent boom in the housing industry in Takoradi as a result of
the oil find in Ghana in 2010.

12
The World Bank/IMF Structural Adjustment Programmes (SAPs) of the 1980s further
widened the gap between the relatively well developed south and the deprived northern parts
of the country. According to some arguments, the removal of subsidies, the shrinking of the
formal sector and the high cost of living during this period reduced the attractions of the
urban centres and contributed to the return migration of migrants to the rural areas. The
implementation of the SAP significantly affected population growth and distribution in the
country. Development strategies prior to the SAP in the early 1980s had focused on large-
scale state-owned enterprises dependent on imported raw materials heavily protected by the
state. The chronic food shortages, mass poverty, and high inflation which peaked at 123
percent in 1983, and a deteriorating currency forced Government to adopt the SAP in 1983 to
adjust the structure of the Ghanaian economy to rid it of undue governmental control and
introduce liberalization measures
The SAPs greatly affected poor and vulnerable groups who disproportionately bore the cost
of withdrawal of subsidies, wage cuts and the promotion of exports at the expense of food
crops resulted in a plummet in food production (Bawa, 1995: Post, 2001). According to
Ayinam (1994), the traditional core economic regions (producing for export) benefited as
compared to the food producing regions of the North. This further widened the gap between
the North and the South and the subsequent migration of northern labour to cocoa farms and
other alternative sources of livelihood in the South.
In Ghana, the creation of slums is associated with the continuous rural-urban migration,
limited supply of land, and regulatory frameworks that are not addressing the needs of the
urban poor. According to Obeng-Odoom (2007), there seems to be a close association of the
urban growth rate (3 percent a year) and the slum growth rate (2 percent a year). In 2001, the
slum population of Ghana was estimated at 4,993,000 people, growing at a rate of 1.83
percent per annum and scattered in all the major cities. This population was expected to reach
5.8 million by 2010 (GoG 2005). This is against a backdrop of an overall urban growth rate
of 4.6 percent and the following intercensal growth rates in Ghana’s key cities from 1984 to
2000: Accra (3.4 percent), Kumasi (5.6 percent), Tamale and Sekondi-Takoradi (5.6 percent
and 2.8 percent respectively) according to GSS, 2000. The blight of rapid slum growth will
continue unabated if concrete population, planning and management steps are not pursued.
The growth of towns particularly Accra, Kumasi and Takoradi in terms of economic
activities, investments and population is largely undesirable. The lack of employment
coupled with planning and development control have resulted in the development of slums
with the proliferation of uncontrolled informal structures in almost every available open
space in these three cities.
In 1988, Ghana embarked on a decentralisation policy and local government reform
programme which established decentralised government machinery where the process of
governance is through the participatory and consultative process at the local level. A basic
goal of Ghana’s decentralisation is rural development as a means of reducing migration to the
large towns and cities. However, the establishment of new districts at any point in time in
itself served as a basis for the growth of hitherto rural settlements into urban centres and
hence increased the number of urban centres in the country (Owusu, 2005). The creation of
new districts attracted public infrastructure and influx of migrants allowing centres to rapidly
develop into towns thus, further aggravating the problems of spatial population distribution in
the country.

13
2.4 Legal, policy and institutional frameworks for urban planning
and management
Various legal and institutional frameworks have been put in place to address issues of urban
management and planning. Under the Local Government Act (Act 462, 1993), the Town and
Country Planning Department was charged with the overall planning and development
control within its jurisdiction. Other legislative instruments which back the establishment of
the department include, the Local Government Act 1993 (Act 462); National Development
Planning Commission Act, 1994 (Act 479); National Development Planning (Systems) Act,
1994 (Act 480), National Building Regulation, 1996 (LI 1630) and the Town and Country
Planning Ordinance, 1945 (Cap 84). The provisions of the Civil Service Law (PNDC Law
327) and the Local Government Act (462), decentralised the TC&PD in 1993 with its former
Regional and District branches integrated into regional coordinating councils and the
metropolitan, municipal and district assemblies.
In addition, there is a plethora of laws on planning and urban spatial management in Ghana.
Some of these include the Town and Country Planning Ordinance (Cap 84), Local
Government Act, 1993 (Act 462), Building Regulations (L.I. 1630), National Development
Planning Commission (Cap 86 & Act 33) Act 1994 (Act 479) and the National Development
Systems Act, 1994 (Act 480). The Local Government Act (Act 462) carries the legal mandate
of establishing Assemblies which are responsible for the development, improvement, and
management of human settlements and the environment in areas under the districts. The
Town and Country Planning Ordinance (Cap 84) of 1945 also requires that all urban areas be
covered by a Town Planning Scheme. Again, the National Development Systems Act, 1994
(Act 480) ensures that guidelines are issued to guide district assemblies, sector ministries,
departments and agencies on the preparation of development plans on a five-year basis.
With the adoption of decentralisation with its legislative, administrative and planning systems
in the late 1980s through the 1990s, a number of key urban development projects co-financed
by the International Development Agency (IDA) of the World Bank and Agence Française de
Dévelopement (AFD) were implemented. These projects included a number of urban-focused
projects (Urban I through V and subsequently the Urban Environmental Sanitation Project
(UESP) 1 and 2) and were directed at upgrading essential urban infrastructure and service
delivery and improving technical, financial and managerial capacity of local government,
starting in Accra, and spreading to other metropolitan areas, medium-sized towns and smaller
towns, including regional and district capitals. However, these projects were not implemented
within the context of a comprehensive urban development framework and hence their effects
on other equally pressing urban development issues were very marginal, if any at all.
The Government of Ghana’s Vision 2020 (1995-2020) represented an initiative to formulate
and implement a long-term development plan in Ghana, and had by far the longest plan
period for the past 25 years. The long-term goal of Vision 2020 was to improve the social and
economic quality of life of Ghanaians and to eliminate extreme deprivation by encouraging
the creativity, enterprise and productivity of all citizens. It also had an urban development
component which emphasized on the development of medium-sized towns, as alternative
centres to the large towns and cities. Overall, Vision 2020 was implemented for five years out
of the Plan duration of 25 years and could not achieve its vision to improve the face of urban
development in the country.

14
The next development policy frameworks after Vision 2020 were Ghana Poverty Reduction
Strategy (GPRS I) and the Growth and Poverty Reduction Strategy (GPRS II). In the view of
government, GPRS I & II represented attempts to address the challenges of previous
development plans by instituting broad-based consensus-building among government, civil
society, private sector and development partners on key issues and programmes for
accelerated and sustained poverty reduction. The GPRS I like its predecessor development
plans such as the Medium-Term Development Plan (MTDP) of Vision 2020 failed to provide
any specific comprehensive strategy on the subject of urban and regional development in
Ghana. There was very little or limited urban development strategies in the GPRS I
development framework to address the challenges of rapid pace of urbanization and to exploit
the potential benefits offered by the process in the country. Again, GPRS II which is the
successor to GPRS I, had very little on urban development. In both policy documents
emphasis was placed on urban housing and slum upgrading.
In the absence of clearly defined policy direction on urban development, past government
interventions in the urban sector have largely been project-based and not comprehensive
enough, with extensive donor support component. The response has been limited, resulting in
increasing challenges that today confront the Ghanaian urban sector. Indeed, the numerous
statutes and legal frameworks have only weakened urban governance in the country. This has
been worsened by poor institutional coordination by key government ministries and
metropolitan, municipal and district assemblies (MMDAs) charged with urban management.
The role of the MMDAs has further been undermined by the lack of enforcement of laws and
regulations on urban planning and development, leading to the haphazard and often
unplanned development experienced across the country. As a result of this, planning in
towns and cities is fragmented and there is constant shifting of blame when there are lapses in
the planning process and implementation of plans. In addition, unavailability of accurate and
timely socio-economic data often constrains the full assessment of programmes with
ineffective measurement outcomes.
In response to this, government in 2012 promulgated a National Urban Policy. The Policy
seeks to address the fundamental challenges associated with urban development and
management in the country. The policy is supported by the Ghana National Urban Policy
Action Plan which identifies key activities that need to be pursued in order to achieve the
twelve policy objectives and related initiatives of the National Urban Policy.
2.5 Conclusion
In Europe and most parts of Asia, urbanisation has been as a consequence of economic
development and the movement of people from an agricultural-based economy to
manufacturing and service-led economy. In most African countries, however, urban growth
was achieved without much industrialisation and only modest economic growth. In a paper to
analyse the contribution of cash crops to urbanisation, Jedwab (nd) argues that sub-Saharan
Africa has followed a different pattern of urbanisation from elsewhere. According to him, in
contrast to standard theories of structural transformation, Africa did not urbanise following a
green revolution or an industrial revolution, but as a result of natural resource exports. He
concludes in his paper that, economic growth in the rural sector can lead to urbanisation but
whether this urbanisation in turn promotes growth might depend on the type of cities created.
He further argues that resource exports create consumption cities with small manufacturing
and tradable service sectors and these consumption cities have relatively small impact on
growth although they may be likely to exhibit agglomeration effects. These resource exports
have positive economic effects in the short-term, as producing regions accumulate cities.

15
However, this may not have been enough to increase per capita income in the long-term
probably due to limited production linkages and weak state institutions as in the case of
Africa and this may in part explain the apparent paradox that sub-Saharan Africa is urbanised
but poor. From available data, it is apparent that Jedwab’s conclusion may indeed be
applicable to Ghana which is experiencing rapid urbanisation in the face of slow growth in
the manufacturing sector.

16
CHAPTER THREE
URBANISATION IN GHANA
3.1 Introduction
This chapter examines the population distribution in Ghana relative to the urban and rural
localities of residence. It compares the proportion of the urban and rural population
distribution by age and sex and region of residence. We also analyse the size of urban
localities by region and compare them by generating the Gini Ratio for distribution of the
urban population by size of locality in each region for the purpose of ascertaining the
skewness or otherwise of the distribution of the urban population in each region in 2010.
In addition, the chapter discusses the levels and trends in urbanisation and differentials in
Ghana by sex and region of residence with a comparison of sex ratios also by region. We
further discuss the key drivers of migration in Ghana where we compare the regions on the
basis of the volume of net migration during the period 2000-2010. In addition, the relative
contribution of migration and natural increase for the urban population growth for the 10
regions in Ghana is examined with a comparison between the 1984-2000 and 2000-2010
periods to understand the regional variations.
3.2 Urban and rural population distribution of Ghana, population of
large towns and cities
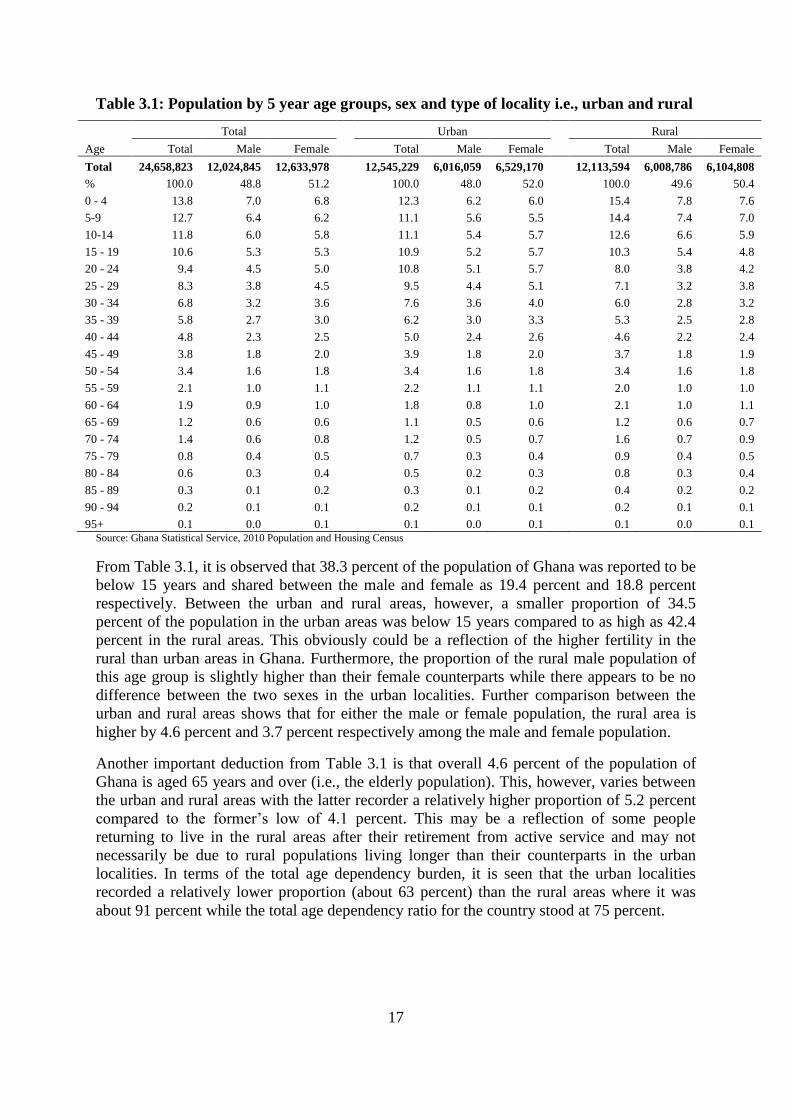
Table 3.1 presents information on the five year age-sex distribution of Ghana’s population by
urban and rural localities. The table suggests that about 51% of the population is made up of
females while males make up the remaining 49 percent. The comparison by type of locality
indicates a slightly higher proportion of the population to be female in the urban than the
rural localities. This may be due to the recent phenomenon of relatively more female than
male children who migrate from rural communities into urban areas (See Anarfi and
Kwankye, 2009). Thus, as seen in Table 3.1, the variation in the male-female proportions of
the population in the urban localities in the country is larger (4%) compared to that in the
rural areas (0.8%).
17
Table 3.1: Population by 5 year age groups, sex and type of locality i.e., urban and rural
Age
Total Urban Rural
Total Male Female Total Male Female Total Male Female
Total 24,658,823 12,024,845 12,633,978
12,545,229 6,016,059 6,529,170
12,113,594 6,008,786 6,104,808
% 100.0 48.8 51.2 100.0 48.0 52.0 100.0 49.6 50.4
0 - 4 13.8 7.0 6.8
12.3 6.2 6.0
15.4 7.8 7.6
5-9 12.7 6.4 6.2
11.1 5.6 5.5
14.4 7.4 7.0
10-14 11.8 6.0 5.8
11.1 5.4 5.7
12.6 6.6 5.9
15 - 19 10.6 5.3 5.3
10.9 5.2 5.7
10.3 5.4 4.8
20 - 24 9.4 4.5 5.0
10.8 5.1 5.7
8.0 3.8 4.2
25 - 29 8.3 3.8 4.5
9.5 4.4 5.1
7.1 3.2 3.8
30 - 34 6.8 3.2 3.6
7.6 3.6 4.0
6.0 2.8 3.2
35 - 39 5.8 2.7 3.0
6.2 3.0 3.3
5.3 2.5 2.8
40 - 44 4.8 2.3 2.5
5.0 2.4 2.6
4.6 2.2 2.4
45 - 49 3.8 1.8 2.0
3.9 1.8 2.0
3.7 1.8 1.9
50 - 54 3.4 1.6 1.8
3.4 1.6 1.8
3.4 1.6 1.8
55 - 59 2.1 1.0 1.1
2.2 1.1 1.1
2.0 1.0 1.0
60 - 64 1.9 0.9 1.0
1.8 0.8 1.0
2.1 1.0 1.1
65 - 69 1.2 0.6 0.6
1.1 0.5 0.6
1.2 0.6 0.7
70 - 74 1.4 0.6 0.8
1.2 0.5 0.7
1.6 0.7 0.9
75 - 79 0.8 0.4 0.5
0.7 0.3 0.4
0.9 0.4 0.5
80 - 84 0.6 0.3 0.4
0.5 0.2 0.3
0.8 0.3 0.4
85 - 89 0.3 0.1 0.2
0.3 0.1 0.2
0.4 0.2 0.2
90 - 94 0.2 0.1 0.1
0.2 0.1 0.1
0.2 0.1 0.1
95+ 0.1 0.0 0.1
0.1 0.0 0.1
0.1 0.0 0.1 Source: Ghana Statistical Service, 2010 Population and Housing Census
From Table 3.1, it is observed that 38.3 percent of the population of Ghana was reported to be
below 15 years and shared between the male and female as 19.4 percent and 18.8 percent
respectively. Between the urban and rural areas, however, a smaller proportion of 34.5
percent of the population in the urban areas was below 15 years compared to as high as 42.4
percent in the rural areas. This obviously could be a reflection of the higher fertility in the
rural than urban areas in Ghana. Furthermore, the proportion of the rural male population of
this age group is slightly higher than their female counterparts while there appears to be no
difference between the two sexes in the urban localities. Further comparison between the
urban and rural areas shows that for either the male or female population, the rural area is
higher by 4.6 percent and 3.7 percent respectively among the male and female population.
Another important deduction from Table 3.1 is that overall 4.6 percent of the population of
Ghana is aged 65 years and over (i.e., the elderly population). This, however, varies between
the urban and rural areas with the latter recorder a relatively higher proportion of 5.2 percent
compared to the former’s low of 4.1 percent. This may be a reflection of some people
returning to live in the rural areas after their retirement from active service and may not
necessarily be due to rural populations living longer than their counterparts in the urban
localities. In terms of the total age dependency burden, it is seen that the urban localities
recorded a relatively lower proportion (about 63 percent) than the rural areas where it was
about 91 percent while the total age dependency ratio for the country stood at 75 percent.
18
3.3 Levels and trends in urbanisation and differentials in Ghana
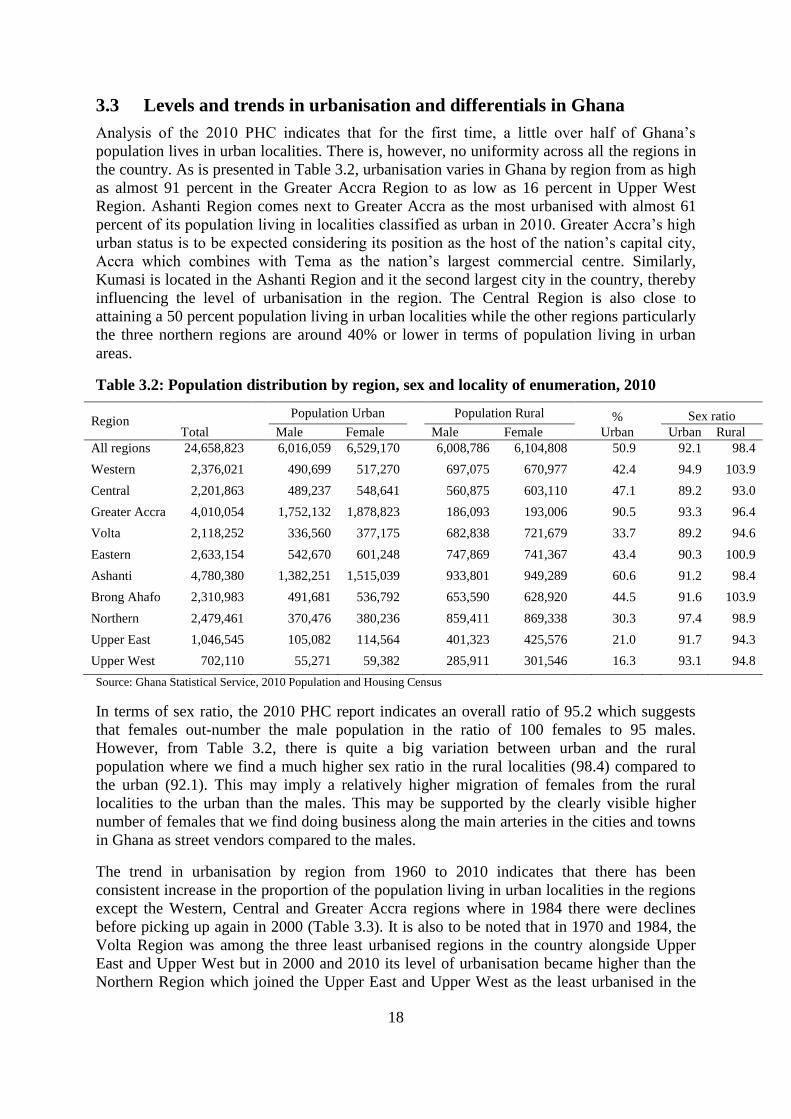
Analysis of the 2010 PHC indicates that for the first time, a little over half of Ghana’s
population lives in urban localities. There is, however, no uniformity across all the regions in
the country. As is presented in Table 3.2, urbanisation varies in Ghana by region from as high
as almost 91 percent in the Greater Accra Region to as low as 16 percent in Upper West
Region. Ashanti Region comes next to Greater Accra as the most urbanised with almost 61
percent of its population living in localities classified as urban in 2010. Greater Accra’s high
urban status is to be expected considering its position as the host of the nation’s capital city,
Accra which combines with Tema as the nation’s largest commercial centre. Similarly,
Kumasi is located in the Ashanti Region and it the second largest city in the country, thereby
influencing the level of urbanisation in the region. The Central Region is also close to
attaining a 50 percent population living in urban localities while the other regions particularly
the three northern regions are around 40% or lower in terms of population living in urban
areas.
Table 3.2: Population distribution by region, sex and locality of enumeration, 2010
Region Total
Population Urban
Population Rural %
Urban
Sex ratio
Male Female Male Female Urban Rural
All regions 24,658,823 6,016,059 6,529,170 6,008,786 6,104,808 50.9 92.1 98.4
Western 2,376,021 490,699 517,270 697,075 670,977 42.4 94.9 103.9
Central 2,201,863 489,237 548,641 560,875 603,110 47.1 89.2 93.0
Greater Accra 4,010,054 1,752,132 1,878,823 186,093 193,006 90.5 93.3 96.4
Volta 2,118,252 336,560 377,175 682,838 721,679 33.7 89.2 94.6
Eastern 2,633,154 542,670 601,248 747,869 741,367 43.4 90.3 100.9
Ashanti 4,780,380 1,382,251 1,515,039 933,801 949,289 60.6 91.2 98.4
Brong Ahafo 2,310,983 491,681 536,792 653,590 628,920 44.5 91.6 103.9
Northern 2,479,461 370,476 380,236 859,411 869,338 30.3 97.4 98.9
Upper East 1,046,545 105,082 114,564 401,323 425,576 21.0 91.7 94.3
Upper West 702,110 55,271 59,382 285,911 301,546 16.3 93.1 94.8
Source: Ghana Statistical Service, 2010 Population and Housing Census
In terms of sex ratio, the 2010 PHC report indicates an overall ratio of 95.2 which suggests
that females out-number the male population in the ratio of 100 females to 95 males.
However, from Table 3.2, there is quite a big variation between urban and the rural
population where we find a much higher sex ratio in the rural localities (98.4) compared to
the urban (92.1). This may imply a relatively higher migration of females from the rural
localities to the urban than the males. This may be supported by the clearly visible higher
number of females that we find doing business along the main arteries in the cities and towns
in Ghana as street vendors compared to the males.
The trend in urbanisation by region from 1960 to 2010 indicates that there has been
consistent increase in the proportion of the population living in urban localities in the regions
except the Western, Central and Greater Accra regions where in 1984 there were declines
before picking up again in 2000 (Table 3.3). It is also to be noted that in 1970 and 1984, the
Volta Region was among the three least urbanised regions in the country alongside Upper
East and Upper West but in 2000 and 2010 its level of urbanisation became higher than the
Northern Region which joined the Upper East and Upper West as the least urbanised in the

19
country. The trend in urbanisation in Ghana shows that the regions with the least proportion
of population living in urban localities are also the regions that have been noted for recording
high volumes of out-migration. This suggests that migration has an ultimate role to play in
the rate of urbanisation in any geographical region.
Table 3.3: Trends in urbanisation, 1960 - 2010
Urban Population
Region 1960 1970 1984 2000 2010
All Regions 23.1 28.9 32.1 43.8 50.9
Western 24.7 26.9 22.6 36.3 42.4
Central 28.0 29.1 28.8 37.5 47.1
Greater Accra 72.6 85.3 83.0 87.7 90.5
Volta 13.1 16.0 20.8 27.0 33.7
Eastern 21.1 24.6 27.7 34.6 43.4
Ashanti 25.0 29.7 32.5 51.3 60.6
Brong Ahafo 15.6 22.1 26.6 37.4 44.5
Northern 13.0 20.4 25.2 26.6 30.3
Upper East 3.9 7.3 12.9 15.7 21.0
Upper West 5.0 6.7 10.9 17.5 16.3
Source: Ghana Statistical Service, 2010 Population and Housing Census
3.4 Drivers of urbanisation in Ghana
The drivers of urbanisation can be conceived in three main contexts. These are differences in
natural increase between geographical areas, the extent of migration and government policies
which directly or indirectly may affect the pace and dynamics of urbanisation, including the
re-classification of districts as part of the decentralisation processes in Ghana especially since
the beginning of the Fourth Republic in 1993. In this section, therefore, the main factors that
have affected urbanisation in Ghana have been discussed while examining the relative
importance of natural increase and internal migration as they affect urbanisation in the
country with a comparison by region.
3.4.1 Natural increase
The interplay between births and deaths determines the rate at which the population of any
geographical area grows naturally such that where births far exceed deaths, the population
grows rapidly and in no time may exceed the threshold population for an urban area. In
Ghana, there are spatial differences in both fertility and mortality and depending on the
variation between these two demographic phenomena, one locality could be more rapidly
growing and attaining an urban status earlier or much later than another. Consequently,
regions with large numbers of people added to the population annually are likely to move
from rural to urban status. This is the effect of natural increase in the population i.e., the
difference between births and deaths even in the absence of migration.
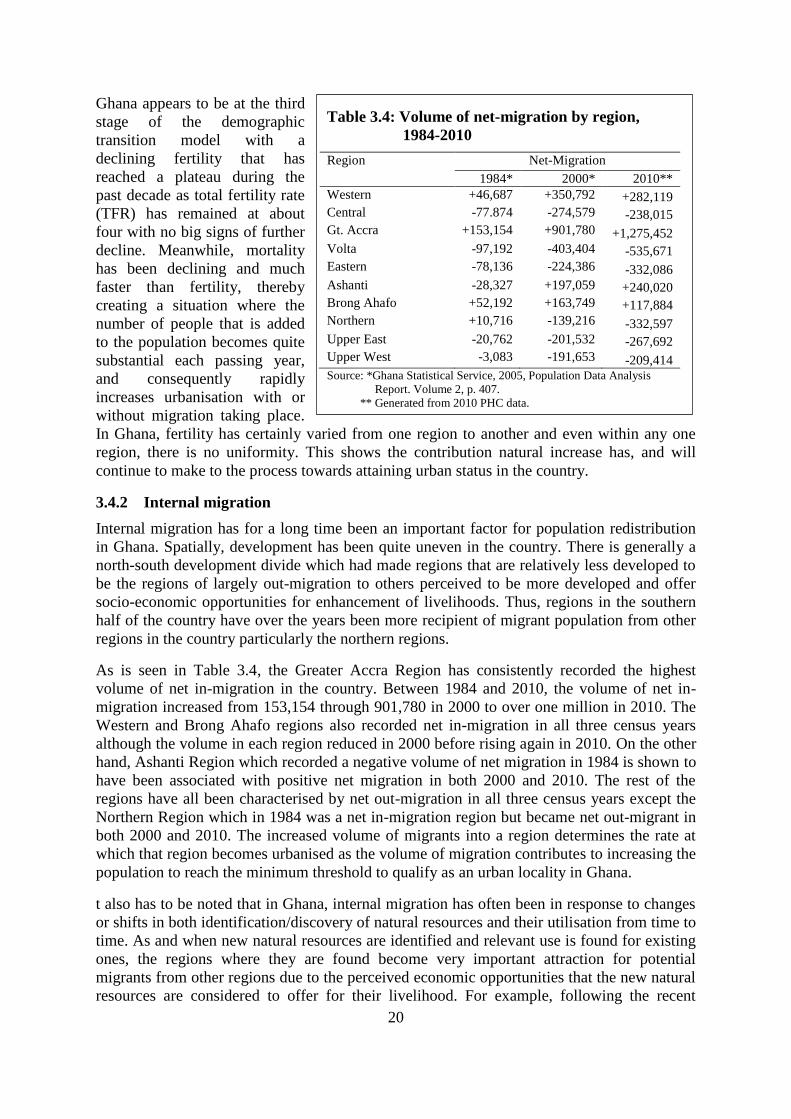
20
Ghana appears to be at the third
stage of the demographic
transition model with a
declining fertility that has
reached a plateau during the
past decade as total fertility rate
(TFR) has remained at about
four with no big signs of further
decline. Meanwhile, mortality
has been declining and much
faster than fertility, thereby
creating a situation where the
number of people that is added
to the population becomes quite
substantial each passing year,
and consequently rapidly
increases urbanisation with or
without migration taking place.
In Ghana, fertility has certainly varied from one region to another and even within any one
region, there is no uniformity. This shows the contribution natural increase has, and will
continue to make to the process towards attaining urban status in the country.
3.4.2 Internal migration
Internal migration has for a long time been an important factor for population redistribution
in Ghana. Spatially, development has been quite uneven in the country. There is generally a
north-south development divide which had made regions that are relatively less developed to
be the regions of largely out-migration to others perceived to be more developed and offer
socio-economic opportunities for enhancement of livelihoods. Thus, regions in the southern
half of the country have over the years been more recipient of migrant population from other
regions in the country particularly the northern regions.
As is seen in Table 3.4, the Greater Accra Region has consistently recorded the highest
volume of net in-migration in the country. Between 1984 and 2010, the volume of net in-
migration increased from 153,154 through 901,780 in 2000 to over one million in 2010. The
Western and Brong Ahafo regions also recorded net in-migration in all three census years
although the volume in each region reduced in 2000 before rising again in 2010. On the other
hand, Ashanti Region which recorded a negative volume of net migration in 1984 is shown to
have been associated with positive net migration in both 2000 and 2010. The rest of the
regions have all been characterised by net out-migration in all three census years except the
Northern Region which in 1984 was a net in-migration region but became net out-migrant in
both 2000 and 2010. The increased volume of migrants into a region determines the rate at
which that region becomes urbanised as the volume of migration contributes to increasing the
population to reach the minimum threshold to qualify as an urban locality in Ghana.
t also has to be noted that in Ghana, internal migration has often been in response to changes
or shifts in both identification/discovery of natural resources and their utilisation from time to
time. As and when new natural resources are identified and relevant use is found for existing
ones, the regions where they are found become very important attraction for potential
migrants from other regions due to the perceived economic opportunities that the new natural
resources are considered to offer for their livelihood. For example, following the recent
Table 3.4: Volume of net-migration by region,
1984-2010
Region Net-Migration
1984* 2000* 2010**
Western +46,687 +350,792 +282,119
Central -77.874 -274,579 -238,015
Gt. Accra +153,154 +901,780 +1,275,452
Volta -97,192 -403,404 -535,671
Eastern -78,136 -224,386 -332,086
Ashanti -28,327 +197,059 +240,020
Brong Ahafo +52,192 +163,749 +117,884
Northern +10,716 -139,216 -332,597
Upper East -20,762 -201,532 -267,692
Upper West -3,083 -191,653 -209,414 Source: *Ghana Statistical Service, 2005, Population Data Analysis
Report. Volume 2, p. 407.
** Generated from 2010 PHC data.

21
discovery of oil in commercial quantities off the coast of Western Region, the region is seen
as fast becoming more attractive of many a migrant. It is, therefore, not surprising that in
2010, it was one of the four regions that recorded a net positive migration in the country.
At this stage, it is important to examine the relative contributions made to urbanisation in
Ghana using the United Nations Decomposition Formula (see Appendix A for computational
formula). This method indirectly determines what proportion of the growth in the urban
population in each region could be attributed to either migration or natural increase during the
intercensal period. The method has limitations due to its inherent assumptions which may not
be fully applicable to the Ghanaian situation. For example, it assumes the following:
(i) The annual growth of the population of the country remains constant and
applicable to all the geographical sub-units of the country;
(ii) There are no territorial boundary changes of the urban centres during the period
under study;
(iii) The effect of the reclassification has been taken care of by migration and;
(iv) International migration is negligible.
Subjecting these assumptions that underlie the United Nations Decomposition Formula
suggests that while there has not been a dramatic change in the annual growth rate of Ghana’s
population in the recent past, the rates certainly have not remained constant. However, the
regular changes in the boundaries of districts due to the creation of new ones during the last
two decades have not affected the boundaries of most urban centres since most often a
number of communities is pulled from one district or another to form a new or an existing
district. This approach of creating new districts may not, therefore, affect the boundaries of
the urban centres but rather the geographical entity called district. Yet, it is not known to
what extent the effect of reclassification has been taken care of by migration and finally since
data on international migration (emigration and immigration) are not readily available in
Ghana by region, one is not in a position to make conclusions regarding how negligible
international migration has been in the country. By far, however, the method’s assumption
that the growth of the urban population is confined within regions (i.e., by intra-regional
migration and natural population increase) is unsustainable since in Ghana, migration is not
confined within regions but there is evidence of much inter-regional migration.
In spite of these limitations, the United Nations Decomposition Formula is regarded as the
most effective method for determining the rate of urban growth that can fairly be attributed to
migration compared to natural increase in a country. The results of the analysis regarding the
contribution of migration and natural increase by region in Ghana are shown in Table 3.5.

22
Table 3.5: Contribution of migration and rate of natural increase to urban
population growth by region
Region
Urban Population Growth due to migration Growth due to natural
increase
2000 2010 1984-2000* 2000-2010** 1984-2000* 2000-2010**
All regions 8,274,270 12,545,229 37.4 40.7 62.6 59.3
Western 698,418 1,007,969 59.2 31.0 40.8 69.0
Central 598,405 1,037,878 51.1 58.3 48.9 41.7
Gt. Accra 2,547,684 3,630,955 4.1 28.1 95.9 71.9
Volta 441,084 713,735 54.8 50.5 45.2 49.5
Eastern 727,914 1,143,918 54.6 46.5 45.4 53.5
Ashanti 1,853,065 2,897,290 56.3 45.7 43.7 54.3
Brong Ahafo 678,780 1,028,473 53.9 40.6 46.1 59.4
Northern 483,790 750,712 11.3 44.6 88.7 55.4
Upper East 144,282 219,646 57.5 41.4 42.5 58.6
Upper West 100,848 114,653 71.6 -123.5 28.4 223.5
Source: *Ghana Statistical Service, 2005, Population Data Analysis Report. Volume 2, p. 404.
**Generated from 2010 PHC data
The results in Table 3.5 indicate that overall, almost 60 percent of the growth in urban
population in Ghana could be attributed to natural increase with migration contributing to
about 40 percent of the growth during 2000-2010. Compared to 1984-2000, there is a slight
increase of migration’s contribution to urban population growth by some four percentage
points. A similar higher proportion of contribution to urban growth by natural increase in
almost all the regions is recorded except in Central and Volta regions where the contribution
of migration to urban population growth in 2000-2010 was higher than that by natural
increase. This is quite the contrary observation in 1984-2000 during which the contribution to
urban growth was much higher in eight of the 10 regions with the exception of Greater Accra
and Northern regions. It is also to be noted that migration’s contribution to urban growth
increased in only three regions: Greater Accra, Central and Northern between 1984-2000 and
2000-2010 while in the remaining seven regions, migration’s role saw a decrease during the
period under review.
3.4.3 Decentralisation and area re-classification
Ghana has practised a decentralised system of local governance and administration for a long
time particularly during the onset of the Forth Republic in 1993. In the course of the
implementation of the decentralisation system of administration, many more districts have
been created. For example, in 1988, 45 new districts were created to add to the 65 existing
ones, thereby increasing the total number of districts to 110. Since then, many more districts
have been created as a way of bringing governance closer to the people for effective planning
and development. Currently, there are 216 districts in Ghana, implying that many otherwise
rural settlements have been elevated to district capitals and as a result, attracted high rates of
growth to become urban localities. This has come about largely due to the provision of some
minimum infrastructure that often accompany the elevation of localities to the status of
district capital.
It has to be noted, however, that although the elevation of certain localities to district capitals
has generally led to huge increases in their populations that have made them become urban
by classification, this is not applicable to all such localities (GSS, 2005). This, therefore,
means that although the creation of new districts as a major government development policy

23
under the decentralisation system of administration has not always led to urban growth, it
nonetheless has played quite a significant role in changing the growth fortunes of many such
localities that suddenly become district capitals of newly created districts in Ghana (see GSS,
2005, Table 7.19).
3.5 Conclusion
The analysis in this chapter has brought out a number of interesting results. There are
variations between the sex ratios between the urban and rural localities in Ghana. A much
higher proportion of the urban population was made up of females compared to the rural
communities. This suggests a higher migration of more females into the urban areas than
males. Furthermore, the age structure of the population shows a higher proportion of the rural
than urban population below age 15 years due to fertility differences which show a higher
figure in the rural areas than the urban. At the same time, a smaller proportion of the urban
population was found to be classified as elderly persons than in the rural localities.
The trend in urbanisation at the regional level also indicates that all the regions with the
exception of Western, Central and Greater Accra have recorded consistent increases in the
proportion of their population living in urban localities since 1960. Overall, however, Greater
Accra, followed by Ashanti happened to be the most urbanised while Upper West recorded
the least proportion in urban localities in 2010. The drivers of urbanisation are several,
including deliberate government policies such as decentralisation and area reclassification,
variation in spatial development in response to natural resource identification and utilisation
as well as natural increase and migration.
An analysis of the contribution of natural increase and migration to urbanisation at the
regional level, however, showed natural increase as the major contributor in all the regions
with the exception of Central and Volta which the reverse was the case. Furthermore, four
regions: Western, Greater Accra, Ashanti and Brong Ahafo; were found to be net in-
migration regions while the remaining six were net out-migration regions in either 2000 or
2010. Thus, so long as there are variations in the rates of fertility and migration across the
regions, urbanisation will continue to vary. What is important, however, is that the pace of
urbanisation should contribute positively in enhancing the quality of lives of the people in
totality since the urban economy is inextricably linked to the rural.
24
CHAPTER FOUR
ANALYSIS OF LIVING CONDITIONS IN URBAN AREAS
4.1 Introduction
In this chapter, we present results of analysis of living conditions of people enumerated in
urban localities in 2010 in Ghana. This is done by first presenting the socio-economic
characteristics of urban dwellers with reference to their literacy and education, marital status
and religious affiliation. Housing facilities and conditions are also examined relative to the
type of dwelling, materials used for the floor and roof of household dwelling units as well as
the number of rooms occupied for sleeping. Furthermore, analysis is done on water and
sanitation at the household level in terms of main source of drinking water and for other
domestic use, the type of bathing and toilet facility and methods of waste disposal. In
addition, there is a focus on energy use at the household level and finally, analysis is done on
the employment and occupational status of the urban dwellers as well as the employment
sector they were engaged in for a livelihood.
In sum, it provides an exhaustive overview of both the characteristics of the population
recorded in all urban areas in Ghana in addition to the socio-economic conditions they found
themselves in as at 2010. Throughout, attempts are made to compare the results of the
analysis by sex and region of residence to understand the variations among the urban
population in the country.
4.2 Socio-economic characteristics of urban dwellers
4.2.1 Literacy and education
The 2010 PHC collected information on the literacy status of all persons 11 years and older in
the country in addition to the level of education attained as at the time of the census.
Information was further sought regarding the language the respondents were literate in. The
information on literacy has been analysed and the results presented in Table 4.1. It should be
understood that in the table, the proportion that was recorded to be literate and that for those
who were non-literate add up to 100 percent. Further analysis is also done on those who were
literate regarding the specific language(s) they were literate in which also add up to 100
percent in the table. The interpretation of the table should, therefore, be done bearing this in
mind.
From Table 4.1, it is observed that 84 percent of all persons 11 years and older were literate
in Ghana and 16 percent had no literacy in any language. As usual, literacy level is higher
among the males than females by some 10 percentage points. While almost 90 percent of the
male population in the urban localities were literate, about 80 percent of their female
counterparts were recorded to be literate in the country. In terms of language in which they
were literate, a majority of either the male or female population was literate in both English
and Ghanaian Language. It is, however, noteworthy to state that a relatively higher proportion
(about 30%) of the female urban dwellers in Ghana was literate in English Language only
compared to their male counterparts (about 28%). It is difficult to explain the reasons behind
this variation between the males and females relative to literacy in English Language only in
urban areas in Ghana and may require further investigation. On the other hand, literacy in

26
Table 4.1: Urban population 11 years and older by sex, literacy status, language in which literate by region
Literacy status/Language literate
All
Regions Western Central
Greater
Accra Volta Eastern Ashanti
Brong
Ahafo Northern
Upper
East
Upper
West
Both sexes 9,286,733 742,255 746,276 2,784,084 521,573 844,805 2,144,732 743,403 516,947 157,402 85,256
Percent 100.0 100.0 100.0 100.0 100.0 100.0 100.0 100.0 100.0 100.0 100.0
None (Not literate) 15.9 15.0 18.0 9.8 18.7 12.9 13.0 21.6 44.5 38.1 31.1
Literate 84.1 85.0 82.0 90.2 81.3 87.1 87.0 78.4 55.5 61.9 68.9
English only 28.7 33.5 30.7 39.0 16.0 18.9 17.2 20.6 42.5 71.6 36.8
Ghanaian language only 7.1 5.1 5.7 4.9 11.0 10.0 10.2 7.4 2.3 1.2 2.2
English and Ghanaian language 62.2 59.7 61.6 53.1 70.9 69.8 70.9 71.0 54.6 26.3 59.1
English and French 0.5 0.5 0.4 1.0 0.6 0.3 0.3 0.3 0.2 0.4 0.3
English French and Ghanaian Language 1.5 1.2 1.5 2.0 1.5 1.0 1.4 0.8 0.3 0.4 1.7
Other 0.0 0.0 0.0 0.0 0.0 0.0 0.0 0.0 0.0 0.0 0.0
Male 4,374,237.0 356,240.0 342,078.0 1,327,590.0 240,515.0 391,741.0 1,002,227.0 347,543.0 252,050.0 73,543.0 40,710.0
Percent 100.0 100.0 100.0 100.0 100.0 100.0 100.0 100.0 100.0 100.0 100.0
None (Not literate) 10.5 9.3 11.3 5.7 11.7 7.5 8.0 15.5 34.7 29.7 22.5
Literate 89.5 90.7 88.7 94.3 88.3 92.5 92.0 84.5 65.3 70.3 77.5
English only 27.9 32.3 29.1 38.2 15.7 18.2 16.9 19.4 39.6 68.9 33.6
Ghanaian language only 5.1 4.0 4.5 3.3 8.1 7.2 7.3 5.3 2.3 1.2 1.9
English and Ghanaian language 64.8 61.8 64.4 55.3 73.6 73.1 73.9 74.1 57.5 28.9 62.0
English and French 0.6 0.6 0.5 1.1 0.7 0.3 0.3 0.3 0.2 0.4 0.3
English French and Ghanaian Language 1.6 1.3 1.4 2.1 1.9 1.1 1.5 0.9 0.4 0.6 2.2
Other 0.0 0.0 0.0 0.0 0.0 0.0 0.0 0.0 0.0 0.0 0.0
Female 4,912,496.0 386,015.0 404,198.0 1,456,494.0 281,058.0 453,064.0 1,142,505.0 395,860.0 264,897.0 83,859.0 44,546.0
Percent 100.0 100.0 100.0 100.0 100.0 100.0 100.0 100.0 100.0 100.0 100.0
None (Not literate) 20.8 20.3 23.6 13.5 24.7 17.5 17.4 27.0 53.7 45.5 39.0
Literate 79.2 79.7 76.4 86.5 75.3 82.5 82.6 73.0 46.3 54.5 61.0
English only 29.5 34.7 32.3 39.9 16.3 19.5 17.6 21.8 46.3 74.7 40.4
Ghanaian language only 9.1 6.2 6.8 6.4 13.9 12.7 13.0 9.5 2.4 1.3 2.5
English and Ghanaian language 59.6 57.6 58.8 51.0 68.1 66.6 67.9 67.8 50.9 23.4 55.7
English and French 0.5 0.4 0.4 0.8 0.5 0.2 0.2 0.2 0.2 0.4 0.3
English French and Ghanaian Language 1.4 1.1 1.6 2.0 1.1 1.0 1.2 0.6 0.3 0.2 1.2
Other 0.0 0.0 0.0 0.0 0.0 0.0 0.0 0.0 0.0 0.0 0.0 Source: Ghana Statistical Service, 2010 Population and Housing Census
27
French is very low in the country in spite of the fact that Ghana’s neighbours are all French-
speaking.
The results by region indicate that the Northern Region has the lowest literacy rate in the
country with about 56 percent of its urban population being non-literate in 2010. In contrast,
Greater Accra recorded the highest literacy rate in the country. This is to be expected
considering the region’s status as hosting the capital city of the country where level of
education has consistently been found to be the highest. The results of the regional analysis
by sex are consistent with the national average where males were found to be more literate
than the females. It is, however, important to note that the variation between males and
females by literacy is highest in the Northern Region where the proportion of the males that
was literate is found to be as high as 16 percent while in the other regions it is not higher than
eight percent.
Furthermore, it is to be noted that literacy in English only is generally higher in all the three
northern regions than the other regions to the south. Again, the Upper East Region stands out
quite uniquely as having a much higher proportion of its urban population with the highest
level of literacy in English Language only. Among the urban population in Upper East
Region, the results show that as high as 69 percent of the male population and 75 percent of
the females were literate in English Language only compared to around 40 percent or less in
the other regions particularly those to the south. The situation in the Upper East in particular
and the other two northern regions could be attributed to the multiplicity of languages spoken
there where there does not appear to be one dominant local language unlike the southern
regions where in most cases one main local language may be dominant like the Akan which
is widely spoken in almost all the regions in the country particularly in the south. Table 4.2
presents information on the level of education among all persons three years and older in
urban localities by sex and region of residence at the time of the 2010 PHC. The information
in the table indicates that one in seven urban dwellers three years and older had never
attended any formal education in the country. Again, it is shown that a majority (about 565)
of the urban population three years and above had attained primary to secondary level of
education. There is also a variation between the males and females where a higher proportion
of the females (18%) than the males (10%) had never attended any form of schooling in
Ghana.
Comparing the results by region and sex indicates some consistency with the national average
where in each region the male population happens to be relatively more educated than the
females. It has to be noted, however, that the lowest proportion of persons with no education
is recorded in the Greater Accra Region among either males or females. At the same time, the
three northern regions are the most disadvantaged with regard to level of education with the
Northern Region recording as high as 38 percent of its urban population with no level of
education compared to Greater Accra’s low of nine percent. This is the case for either the
male or female population.
It is also important to observe that more than half of the population in urban areas in each
region with the exception of Northern Region reported level of education to range from the
primary to secondary level, the highest of 71 percent being recorded in both the Eastern and
Ashanti regions with the lowest of 47 percent standing in the name of Northern Region.
Beyond secondary level of education, it is interesting to underline the fact that Upper West
Region (14.9%) is second to the Greater Accra Region (15.3%) with the highest proportion of
urban dwellers with post-secondary level of education. While this is difficult to explain, it
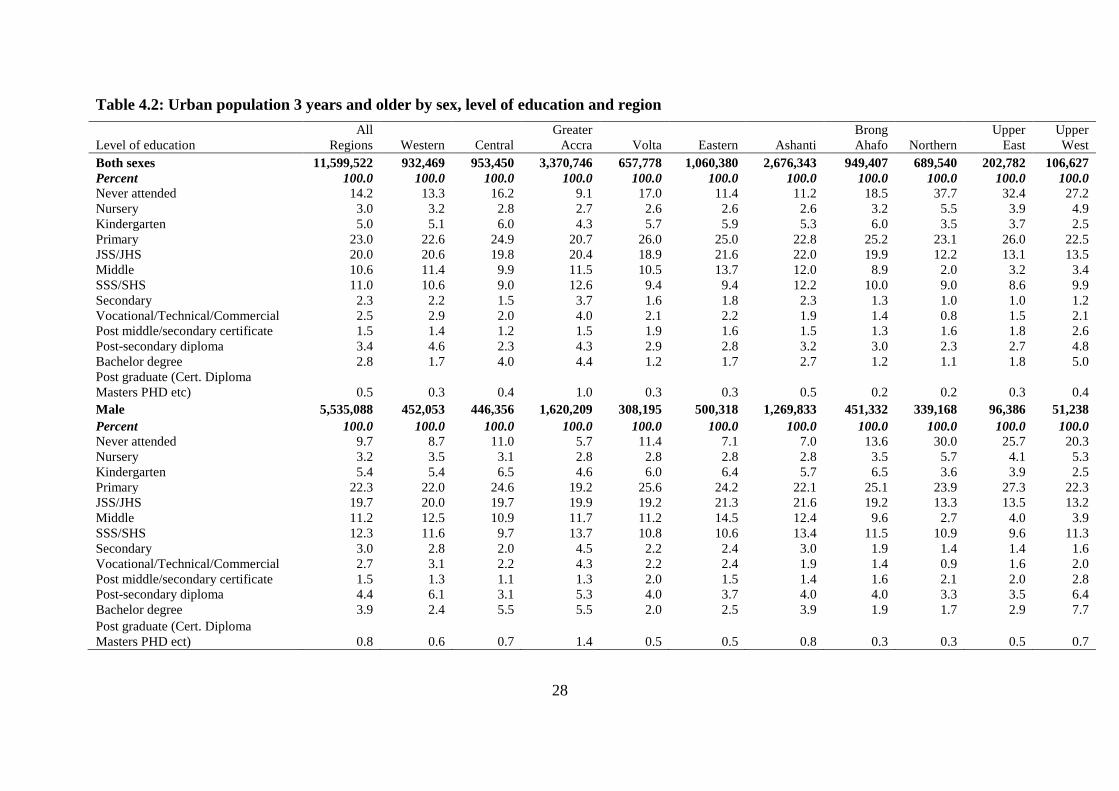
28
Table 4.2: Urban population 3 years and older by sex, level of education and region
Level of education
All
Regions Western Central
Greater
Accra Volta Eastern Ashanti
Brong
Ahafo Northern
Upper
East
Upper
West
Both sexes 11,599,522 932,469 953,450 3,370,746 657,778 1,060,380 2,676,343 949,407 689,540 202,782 106,627
Percent 100.0 100.0 100.0 100.0 100.0 100.0 100.0 100.0 100.0 100.0 100.0
Never attended 14.2 13.3 16.2 9.1 17.0 11.4 11.2 18.5 37.7 32.4 27.2
Nursery 3.0 3.2 2.8 2.7 2.6 2.6 2.6 3.2 5.5 3.9 4.9
Kindergarten 5.0 5.1 6.0 4.3 5.7 5.9 5.3 6.0 3.5 3.7 2.5
Primary 23.0 22.6 24.9 20.7 26.0 25.0 22.8 25.2 23.1 26.0 22.5
JSS/JHS 20.0 20.6 19.8 20.4 18.9 21.6 22.0 19.9 12.2 13.1 13.5
Middle 10.6 11.4 9.9 11.5 10.5 13.7 12.0 8.9 2.0 3.2 3.4
SSS/SHS 11.0 10.6 9.0 12.6 9.4 9.4 12.2 10.0 9.0 8.6 9.9
Secondary 2.3 2.2 1.5 3.7 1.6 1.8 2.3 1.3 1.0 1.0 1.2
Vocational/Technical/Commercial 2.5 2.9 2.0 4.0 2.1 2.2 1.9 1.4 0.8 1.5 2.1
Post middle/secondary certificate 1.5 1.4 1.2 1.5 1.9 1.6 1.5 1.3 1.6 1.8 2.6
Post-secondary diploma 3.4 4.6 2.3 4.3 2.9 2.8 3.2 3.0 2.3 2.7 4.8
Bachelor degree 2.8 1.7 4.0 4.4 1.2 1.7 2.7 1.2 1.1 1.8 5.0
Post graduate (Cert. Diploma
Masters PHD etc) 0.5 0.3 0.4 1.0 0.3 0.3 0.5 0.2 0.2 0.3 0.4
Male 5,535,088 452,053 446,356 1,620,209 308,195 500,318 1,269,833 451,332 339,168 96,386 51,238
Percent 100.0 100.0 100.0 100.0 100.0 100.0 100.0 100.0 100.0 100.0 100.0
Never attended 9.7 8.7 11.0 5.7 11.4 7.1 7.0 13.6 30.0 25.7 20.3
Nursery 3.2 3.5 3.1 2.8 2.8 2.8 2.8 3.5 5.7 4.1 5.3
Kindergarten 5.4 5.4 6.5 4.6 6.0 6.4 5.7 6.5 3.6 3.9 2.5
Primary 22.3 22.0 24.6 19.2 25.6 24.2 22.1 25.1 23.9 27.3 22.3
JSS/JHS 19.7 20.0 19.7 19.9 19.2 21.3 21.6 19.2 13.3 13.5 13.2
Middle 11.2 12.5 10.9 11.7 11.2 14.5 12.4 9.6 2.7 4.0 3.9
SSS/SHS 12.3 11.6 9.7 13.7 10.8 10.6 13.4 11.5 10.9 9.6 11.3
Secondary 3.0 2.8 2.0 4.5 2.2 2.4 3.0 1.9 1.4 1.4 1.6
Vocational/Technical/Commercial 2.7 3.1 2.2 4.3 2.2 2.4 1.9 1.4 0.9 1.6 2.0
Post middle/secondary certificate 1.5 1.3 1.1 1.3 2.0 1.5 1.4 1.6 2.1 2.0 2.8
Post-secondary diploma 4.4 6.1 3.1 5.3 4.0 3.7 4.0 4.0 3.3 3.5 6.4
Bachelor degree 3.9 2.4 5.5 5.5 2.0 2.5 3.9 1.9 1.7 2.9 7.7
Post graduate (Cert. Diploma
Masters PHD ect) 0.8 0.6 0.7 1.4 0.5 0.5 0.8 0.3 0.3 0.5 0.7

29
Table 4.2: Urban population 3 years and older by sex, level of education and region (Cont’d)
Level of education
All
Regions Western Central
Greater
Accra Volta Eastern Ashanti
Brong
Ahafo Northern
Upper
East
Upper
West
Female
6,064,434
480,416
507,094
1,750,537
349,583
560,062
1,406,510
498,075
350,372
106,396
55,389
Percent 100.0 100.0 100.0 100.0 100.0 100.0 100.0 100.0 100.0 100.0 100.0
Never attended 18.3 17.6 20.7 12.2 21.9 15.2 14.9 23.0 45.1 38.5 33.7
Nursery 2.8 3.0 2.6 2.5 2.4 2.4 2.4 3.0 5.3 3.6 4.5
Kindergarten 4.7 4.8 5.5 4.0 5.3 5.5 4.9 5.5 3.4 3.6 2.4
Primary 23.6 23.1 25.1 22.0 26.4 25.8 23.5 25.3 22.3 24.7 22.7
JSS/JHS 20.3 21.2 20.0 20.8 18.6 21.8 22.3 20.5 11.1 12.7 13.8
Middle 10.1 10.3 9.0 11.3 9.9 13.1 11.6 8.2 1.4 2.4 2.9
SSS/SHS 9.9 9.7 8.4 11.5 8.1 8.4 11.0 8.6 7.1 7.7 8.6
Secondary 1.7 1.6 1.1 3.0 1.0 1.2 1.6 0.7 0.5 0.6 0.8
Vocational/Technical/Commercial 2.4 2.6 1.9 3.8 1.9 2.1 1.9 1.3 0.8 1.5 2.2
Post middle/secondary certificate 1.5 1.5 1.2 1.6 1.8 1.6 1.6 1.1 1.2 1.7 2.4
Post-secondary diploma 2.5 3.2 1.7 3.3 2.0 2.0 2.5 2.0 1.4 2.0 3.3
Bachelor degree 1.9 1.0 2.7 3.4 0.6 0.9 1.6 0.6 0.4 0.8 2.5
Post graduate (Cert. Diploma
Masters PHD ect) 0.2 0.1 0.2 0.5 0.1 0.1 0.2 0.0 0.0 0.1 0.1 Source: Ghana Statistical Service, 2010 Population and Housing Census
30
could be traced to the establishment of the University for Development Studies (UDS) which
has one of its campuses in Wa, the capital of the Upper West Region, which the population
has taken advantage of to educate themselves to the University level. For example, the Upper
West Region recorded five percent of its urban population to have a bachelor degree which is
even higher than Greater Accra Region’s 4.4 percent. The Western Region is third, recording
almost 11 percent of its population in urban localities to have education beyond secondary
level, the remaining regions having less than one in ten of their urban population with
educational level beyond secondary school level.
The pattern by sex does not deviate from the general one observed among both sexes except
that in each region, the males are more likely to have a higher level of education compared to
the females. It is further deduced from Table 4.2 that the variation in educational level in
terms of persons who have never attended schooling before is much higher in the Northern
Region with a parity gap of 15 percent between males and females with no education. The
region with the least gender parity gap between the males and females happens to be the
Eastern Region with just about four percent gap between the males and females. The gap
between males and females with respect to education has long been found to be a challenge
that successive governments have tried to bridge.
4.2.2 Marital status
Information collected on marital status was among persons 12 years and older in the 2010
PHC. This was a slight deviation from previous censuses and national surveys which asked of
marital status of persons 15 years and older. Putting the minimum age of eligibility for
marital status question to be posed at 12 years has the advantage of capturing marriages that
take place earlier than 15 years to be able to have a better appreciation of the likely effect of
early marriage and infant and maternal health outcomes.
Table 4.3 shows the results of the analysis of marital status by sex and region of residence
among all urban dwellers 12 years and above in Ghana. From the results, more than half of
the population surveyed had ever been married and less than half were never married in the
country. About 40 percent of the urban population was married at the time of the census and
close to 10 percent were altogether recorded to be separated, divorced or widowed among
both sexes. It is also important to underscore the observation that close to five percent of the
Ghanaian urban population was in informal or consensual unions or relationships.
Table 4.3 further depicts quite a significant variation between the males and females. For
example, among the male population, a little more than half were never married compared to
a lower proportion of 40 percent among the females. This suggests that women are more
likely to marry earlier than their male counterparts. In fact, at the time of marriage, males are
more likely to be relatively older than their female spouses. It is, however, quite interesting to
observe that the proportion that was recorded to be married at the time of the census was
about the same for males and females although the proportion among the latter is slightly
higher. The small difference between the married males and females could be due to the
impact of polygynous marriages in the country.
By region, the results indicate some variation where for example, Volta Region recorded the
lowest proportion of persons never married in contrast to the highest recorded in the Ashanti
Region. In terms of the married persons, however, the three northern regions recorded the
highest proportions of more than 40 percent with almost half the population in Northern
Region being married at the time of the census. Furthermore, in all the regions with the

31
exception of the Volta Region, a little more than half of the population 12 years and over in
the urban localities were never married, the highest being recorded in Upper West Region.
Again, the three northern regions report relatively higher proportions married compared with
all other regions in the country but record the lowest proportions in consensual unions. In
fact, in each of the three regions, the proportion in consensual unions is one percent or less
compared to almost four percent or higher in the other regions to the south with Brong Ahafo
recording about six percent.
Similarly, the proportion ever married (made up of the separated, divorced or widowed) also
varies from the highest of almost 13 percent in Eastern Region to the lowest in Upper West
(about 7 %) with the national average standing at about 10 percent. It does may appear that
marriages are relatively more stable in the northern regions compared to those in the south. It
is further seen that marital status varies between the males and females in all the regions of
Ghana particularly in the three northern regions where the proportion married is visibly
higher among the females than the males while in the other regions not much difference is
shown between the males and females. Quite clearly, the picture depicted in the northern
regions is the result of polygyny where one man could be married to more than one woman at
the same time, a practice which is largely supported by the Islamic Religion commonly
practiced in northern Ghana.
Finally, the results depict the Eastern Region to have the highest proportion altogether that is
separated, divorced or widowed either among males or females. It is followed by Volta and
Central regions. It also has to be underscored that comparatively the proportion that was
recorded to be separated, divorced or widowed was higher in all regions among the females
than the males. The reason is likely to be found in the practice where males are more likely
than females to re-marry upon divorce or being widowed in Ghana.

32
Table 4.3: Population 12 years and older in urban localities by sex, marital status and region
Marital status/Sex Total Western Central
Greater
Accra Volta Eastern Ashanti
Brong
Ahafo Northern
Upper
East
Upper
West
Both sexes 9,037,989 721,714 724,503 2,720,199 507,111 820,517 2,083,350 720,497 504,047 152,928 83,123
Percent 100.0 100.0 100.0 100.0 100.0 100.0 100.0 100.0 100.0 100.0 100.0
Never married 45.9 45.8 43.9 46.8 41.7 43.7 48.0 46.2 43.4 43.3 47.7
Informal/Consensual
union/ Living together 5.0 3.5 5.8 5.6 4.1 6.2 5.3 6.2 0.8 0.7 1.1
Married 39.4 40.6 38.7 38.7 42.3 37.4 37.5 37.9 48.9 46.6 44.4
Separated 1.9 1.8 1.9 2.3 2.6 2.3 1.6 1.4 1.1 1.2 0.8
Divorced 3.4 4.0 4.6 2.9 3.3 4.7 3.4 3.9 1.4 1.3 1.2
Widowed 4.4 4.3 5.2 3.7 5.9 5.7 4.2 4.4 4.4 6.9 4.8
Male 4,252,234.0 346,095.0 331,374.0 1,296,969.0 233,348.0 379,825.0 972,017.0 336,108.0 245,512.0 71,235.0 39,751.0
Percent 100.0 100.0 100.0 100.0 100.0 100.0 100.0 100.0 100.0 100.0 100.0
Never married 52.1 51.2 50.6 51.2 49.4 50.5 54.6 54.0 51.8 51.3 54.8
Informal/
Consensual union/
Living together 4.7 3.2 5.4 5.5 3.7 5.7 5.0 5.4 0.7 0.7 0.9
Married 38.9 40.6 38.7 39.0 41.1 37.8 36.7 36.7 44.9 44.9 42.0
Separated 1.3 1.2 1.3 1.5 1.9 1.5 1.0 0.9 0.8 0.9 0.6
Divorced 2.0 2.4 2.6 1.8 2.3 2.9 1.7 2.1 1.0 1.0 0.8
Widowed 1.2 1.3 1.4 1.1 1.7 1.6 1.0 0.9 0.8 1.2 0.9
Female 4,785,755.0 375,619.0 393,129.0 1,423,230.0 273,763.0 440,692.0 1,111,333.0 384,389.0 258,535.0 81,693.0 43,372.0
Percent 100.0 100.0 100.0 100.0 100.0 100.0 100.0 100.0 100.0 100.0 100.0
Never married 40.4 40.7 38.2 42.8 35.1 37.9 42.2 39.4 35.4 36.3 41.1
Informal/Consensual
union/Living together 5.3 3.7 6.2 5.6 4.4 6.6 5.7 6.9 0.9 0.8 1.2
Married 39.8 40.7 38.6 38.5 43.3 37.0 38.2 38.9 52.7 48.2 46.6
Separated 2.5 2.3 2.5 3.1 3.3 2.9 2.1 1.9 1.3 1.5 1.1
Divorced 4.7 5.6 6.2 4.0 4.2 6.4 4.9 5.6 1.8 1.6 1.5
Widowed 7.3 7.0 8.4 6.0 9.6 9.3 6.9 7.4 7.9 11.8 8.5 Source: Ghana Statistical Service, 2010 Population and Housing Census
33
4.2.3 Religious affiliation
Ghana is by constitution a secular state. However, religious activities are visible everywhere
in the country. The 2010 PHC collected information on the religious affiliation of individuals
enumerated. The results of the analysis are shown in Table 4.4. It shows the urban population
12 years and older by sex, religious affiliation and region of residence. The results indicate
the dominance of the Christian Religion in the urban localities in the country with almost
three in every four persons professing to be affiliated to the Christian Religion. On the other
hand, about 18 percent of the urban population reported their affiliation to Islam while just
about one percent said they were Traditionalist by religion. It is also seen that among the
Christians, the Pentecostal/Charismatic group is the largest, enlisting close to a third of the
population resident in urban localities in the country.
Comparing the results by sex, interesting observations are presented in Table 4.4. While
Christianity is still the dominant religion irrespective of differences in sex, we find that a
relatively higher proportion of females (79%) profess to be Christians compared to their male
counterparts (about 74%). The contrast, however, is the case for Islam where we have a
higher proportion of males (about 19%) to belong to the Islamic Religion compared to their
female counterparts (about 17%). There is no significant variation between the sexes
regarding their affiliation to the Traditional Religion. On the other hand, males are more
likely than their female counterparts to indicate that they are affiliated to no religion in
Ghana: about six percent among the males and three percent among the females said they do
not belong to any religion.
The pattern of religious affiliation at the national level is not too different at the regional
level. What is quite clear is that the three northern regions are more likely to profess the
Islamic Religion compared to the others in the south. For example, about 82 percent of the
urban population 12 years and older in the Northern Region were affiliated to Islam with no
variation between males and females. The proportion that reported affiliation to Islam as a
religion in the Upper East and Upper West regions was, however, lower (47%t and 54%
respectively) although they were far higher than that reported in the remaining seven regions
in the country.
As was observed at the national level, the proportion that said they were affiliated to the
Christian Religion was higher among the females than the males in all the ten regions in the
country with the exception of the Upper West Region where the reverse is the case. With
reference to Islam, however, the results indicate that in every region, a higher proportion of
males than females were affiliated to Islam. Again, although in all the regions Traditional
Religion is patronised by a small proportion of the population whether male or female, Volta
and Upper East regions stand out quite clearly as the regions with proportion of Traditional
religious worship to be around eight percent.
From the analysis, we find that only a small fraction of the urban population professes no
religion in Ghana. Thus, in spite of the secular nature of the country, individuals are seriously
attached to their religious beliefs that are not offensive to the law. From the analysis so far, it
appears that Ghana will for a very long time to come continue to be largely Christian and
Islamic in religious outlook with Christianity being the dominant religion.

34
Table 4.4: Population 12 years and older in urban localities by sex, religious affiliation and region
Religion/Sex
All
Regions Western Central
Greater
Accra Volta Eastern Ashanti
Brong
Ahafo Northern
Upper
East
Upper
West
Both Sexes 9,037,989 721,714 724,503 2,720,199 507,111 820,517 2,083,350 720,497 504,047 152,928 83,123
Percent 100.0 100.0 100.0 100.0 100.0 100.0 100.0 100.0 100.0 100.0 100.0
No religion 4.2 5.2 6.7 3.5 5.3 5.5 4.0 4.9 0.8 1.6 0.9
Catholic 11.6 15.8 10.8 8.1 19.2 8.1 12.5 17.0 6.0 23.9 30.5
Protestants 21.0 24.1 21.4 23.3 22.7 27.6 20.1 19.7 3.2 4.9 3.8
Pentecostal/Charismatic 32.4 30.3 30.6 42.8 29.4 33.9 31.6 27.0 4.4 9.7 5.2
Other Christian 11.4 14.3 19.7 8.7 7.4 15.0 14.2 11.3 1.4 2.0 1.8
Islam 17.5 9.2 9.2 12.3 7.9 8.4 16.5 18.4 81.6 47.4 53.6
Traditionalist 1.2 0.4 0.6 0.4 7.4 0.6 0.3 1.1 2.5 10.1 3.8
Other 0.8 0.8 0.9 1.0 0.7 0.9 0.8 0.6 0.3 0.3 0.4
Male 4,252,234 346,095 331,374 1,296,969 233,348 379,825 972,017 336,108 245,512 71,235 39,751
Percent 100.0 100.0 100.0 100.0 100.0 100.0 100.0 100.0 100.0 100.0 100.0
No religion 5.9 7.4 9.3 5.0 6.4 8.1 5.9 7.2 0.9 1.9 1.0
Catholic 11.9 15.8 11.0 8.7 19.8 8.7 12.6 16.9 5.8 22.1 29.0
Protestants 20.2 23.3 20.7 22.7 22.4 26.4 19.3 18.4 3.1 4.7 4.3
Pentecostal/Charismatic 30.3 28.4 28.7 40.3 27.5 31.0 29.6 24.6 4.2 8.6 5.4
Other christian 11.1 13.8 18.4 8.7 7.3 14.5 13.9 10.8 1.4 1.9 2.0
Islam 18.6 10.1 10.3 13.1 8.8 9.6 17.5 20.1 81.6 48.4 53.8
Traditionalist 1.3 0.4 0.7 0.4 7.1 0.7 0.4 1.4 2.7 12.0 4.0
Other 0.8 0.8 0.9 1.1 0.7 1.0 0.8 0.6 0.3 0.3 0.5
Female 4,785,755 375,619 393,129 1,423,230 273,763 440,692 1,111,333 384,389 258,535 81,693 43,372
Percent 100.0 100.0 100.0 100.0 100.0 100.0 100.0 100.0 100.0 100.0 100.0
No religion 2.6 3.1 4.5 2.1 4.3 3.2 2.3 2.9 0.7 1.4 0.9
Catholic 11.5 15.7 10.6 7.6 18.8 7.7 12.4 17.1 6.1 25.4 31.9
Protestants 21.6 24.9 22.1 23.9 23.0 28.6 20.9 20.9 3.2 5.1 3.3
Pentecostal/Charismatic 34.2 32.1 32.3 45.0 31.0 36.5 33.2 29.1 4.6 10.6 4.9
Other christian 11.7 14.7 20.7 8.6 7.5 15.3 14.4 11.7 1.4 2.2 1.7
Islam 16.5 8.3 8.3 11.5 7.1 7.4 15.7 16.9 81.5 46.4 53.5
Traditionalist 1.1 0.4 0.6 0.3 7.7 0.4 0.3 0.8 2.2 8.5 3.5
Other 0.8 0.7 0.9 0.9 0.7 0.9 0.7 0.6 0.3 0.3 0.4
Source: Ghana Statistical Service, 2010 Population and Housing Census
35
4.3 Housing
4.3.1 Type of dwelling
Data on type of dwelling of households in urban localities were collected during the 2010
PHC to facilitate an analysis of housing conditions in the country. The data pertaining to
urban localities in Ghana by region have been analysed and presented in Table 4.5. From the
table, three out of every five households in Ghana was in a compound house while almost
one in five were in a separate house. It is also noted that close to three percent of the
households in the country were in housing facilities classified as improvised home (i.e.,
kiosks and containers) and about two percent were living in uncompleted buildings.
The table does not show serious variations by region. This is reflected in the observation that
in all the regions the majority of the households were in compound houses, the highest
proportion being recorded in the Northern Region where as high 76 percent of the households
were in such compound housing facilities. So far, the proportion resident in compound
houses was below the national average in four regions namely; Western, Greater Accra, Volta
and Ashanti regions while in the other six regions, the proportion was higher.
The use of separate housing dwelling facility appears to be relatively more common in the
Volta (28%) and Brong Ahafo (24%) regions compared to the other regions in Ghana. On the
other hand, flat/apartment type of housing facility is highest in Ashanti and Western regions
(each recording at least 10%) while in the other regions, it is less than 10 percent particularly
in the three northern regions where it stood at less than three percent.
Again, it is seen that poor housing with regard to the use of containers/kiosks and
uncompleted buildings happens to be generally uncommon except in the Greater Accra and
Ashanti regions. In the Greater Accra Region for example, up to a little more than eight
percent of the households were in such dwellings. This is likely to be due to the high rental
accommodation that residents in the city of Accra-Tema and Kumasi are often confronted
with. Those who are not able to afford the high rents that the more descent dwelling places
attract may have no choice than to find accommodation in kiosks, containers and
uncompleted buildings which have no housing facilities including toilet facilities, potable
water, electricity and waste disposal facilities. In fact, it is not uncommon to walk in the night
at certain locations in the cities to find several people sleeping in front of some shops in the
open, a spectacle which may not be found in most rural communities in Ghana. It is also
important to observe that the use of huts is most visible in Upper East Region where more
than 10 percent of the households were enumerated in huts (in the same or different
compound).
These variations notwithstanding, the type of dwelling alone is not enough to inform us about
the quality or size of the dwelling since the material used in its construction is not provided
together with this information on the type of dwelling facility. This calls for the need to
examine into more detail the quality of the material used in constructing the dwelling facility.
This is examined in the subsequent sections.
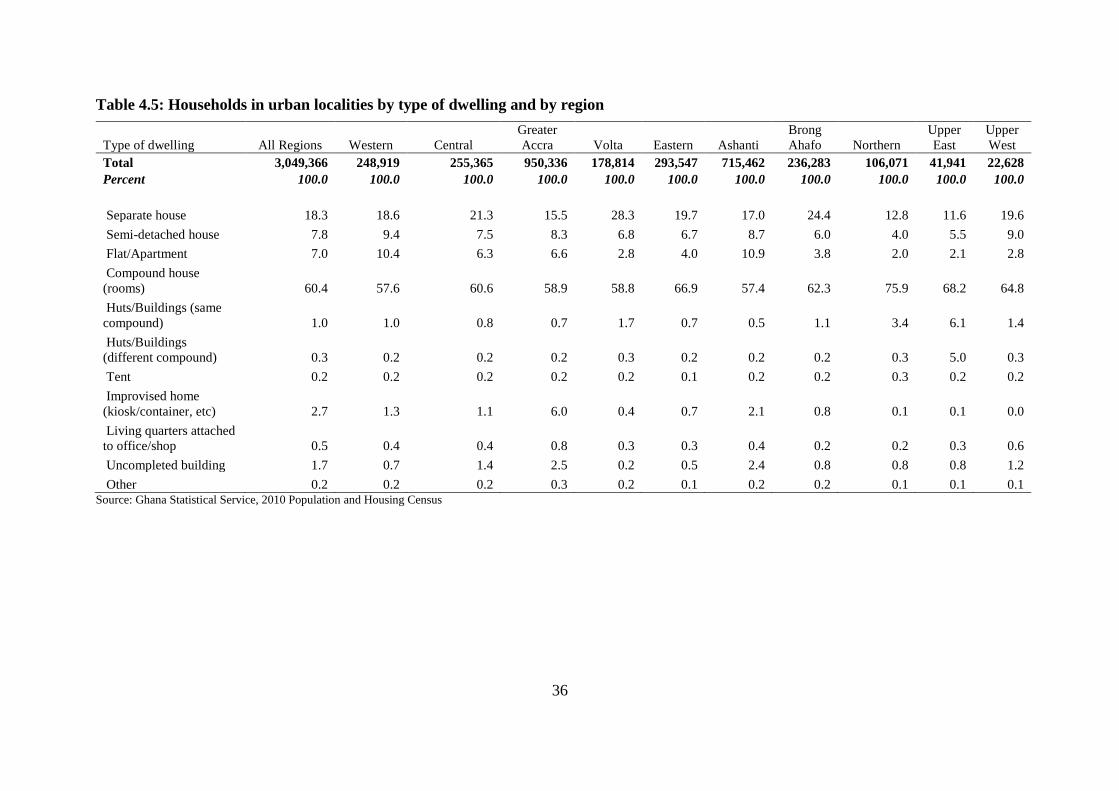
36
Table 4.5: Households in urban localities by type of dwelling and by region
Type of dwelling All Regions Western Central
Greater
Accra Volta Eastern Ashanti
Brong
Ahafo Northern
Upper
East
Upper
West
Total 3,049,366 248,919 255,365 950,336 178,814 293,547 715,462 236,283 106,071 41,941 22,628
Percent 100.0 100.0 100.0 100.0 100.0 100.0 100.0 100.0 100.0 100.0 100.0
Separate house 18.3 18.6 21.3 15.5 28.3 19.7 17.0 24.4 12.8 11.6 19.6
Semi-detached house 7.8 9.4 7.5 8.3 6.8 6.7 8.7 6.0 4.0 5.5 9.0
Flat/Apartment 7.0 10.4 6.3 6.6 2.8 4.0 10.9 3.8 2.0 2.1 2.8
Compound house
(rooms) 60.4 57.6 60.6 58.9 58.8 66.9 57.4 62.3 75.9 68.2 64.8
Huts/Buildings (same
compound) 1.0 1.0 0.8 0.7 1.7 0.7 0.5 1.1 3.4 6.1 1.4
Huts/Buildings
(different compound) 0.3 0.2 0.2 0.2 0.3 0.2 0.2 0.2 0.3 5.0 0.3
Tent 0.2 0.2 0.2 0.2 0.2 0.1 0.2 0.2 0.3 0.2 0.2
Improvised home
(kiosk/container, etc) 2.7 1.3 1.1 6.0 0.4 0.7 2.1 0.8 0.1 0.1 0.0
Living quarters attached
to office/shop 0.5 0.4 0.4 0.8 0.3 0.3 0.4 0.2 0.2 0.3 0.6
Uncompleted building 1.7 0.7 1.4 2.5 0.2 0.5 2.4 0.8 0.8 0.8 1.2
Other 0.2 0.2 0.2 0.3 0.2 0.1 0.2 0.2 0.1 0.1 0.1 Source: Ghana Statistical Service, 2010 Population and Housing Census

37
4.3.2 Material for dwelling
As was noted in Section 4.3.1, the quality of the material used in the construction of the
dwelling facility is more important in examining the living conditions of urban dwellers in
the country. The analysis, therefore, looks at the type of material used to construct the outer
wall, floor and roof of the housing unit accommodating the household members. Table 4.6
contains information on this analysis by region of residence. From the results presented in the
table, it is quite clear that more than three of four households reported that the outer wall of
their housing facility was constructed with cement blocks or concrete and a little more than
one in ten of them were built with mud brick or earth.
The regional comparison reveals some variations although in most of the regions the use of
cement blocks or concrete in the construction of the outer wall of their dwelling facilities is
still dominant with the exception of Northern and Upper East regions where such houses
constitute less than 50 percent of the dwellings. In the Northern and Upper East regions, the
use of mud brick or earth is common with a little more than half of the dwelling facilities in
the urban localities constructed with this cheap or poor material. Notice is also taken of the
result that at least one in ten of the dwellings in the Greater Accra Region have their outer
walls constructed with wood compared to the other regions where three percent or less of the
dwelling units used wood in their construction. The situation in the Greater Accra Region
could be the result of the expansion of the slums where wood is largely used in constructing
the dwelling units. For example, at Old Fadama (popularly called Sodom and Gomorra) in
Accra, most housing units are built with wood.
There is quite uniformity in the regions regarding the type of material used for the
construction of the floor of dwelling units in urban localities in Ghana as shown in Table 4.6.
From the results presented in the table, cement and concrete floors are the most common in
all the regions. We have more than 80 percent of the dwelling units having cement or
concrete floors. The other material that also appears relatively common after cement or
concrete is earth or mud and this is highest in Northern Region (16%) and Upper East and
Upper West (with 12% and 10% respectively). The other materials such as tiles and terrazzo
do not appear to be commonly used perhaps due to the high cost they attract which may be
beyond the financial capacity of many landlords and ladies.
Furthermore, the results of the analysis on the material used for the roof of dwelling units in
urban localities in Ghana suggest the importance of either slate/asbestos or cement/concrete.
For example, Eastern, Ashanti, Brong Ahafo and the three northern regions appear to use
slate/asbestos mostly in roofing their dwelling units in the urban localities but in the other
four regions, there appears to be some split between the two materials used for the roof of the
dwelling units of the households. Interestingly, the regions that showed some balance
between slate/asbestos and cement/concrete are the three most southern regions of Western,
Central and Greater Accra although in each case, there is relatively higher use for
slate/asbestos than cement/concrete. It has to be underscored also that the use of thatch
roofing material is relatively more common in the Northern Region where 11 percent of the
households lived in dwelling units roofed with thatch or palm leaf or raffia. This is followed
by Volta Region with about six percent thatch roofs while in the other regions it is three
percent or less.

38
Table 4.6: Households in urban localities by main construction material for outer wall, floor and roof by region
Main construction material for outer
wall/floor/roof All Regions Western Central
Greater
Accra Volta Eastern Ashanti
Brong
Ahafo Northern
Upper
East
Upper
West
Main construction material for outer wall 100 100 100 100 100 100 100 100 100 100 100
Total 3,049,366 248,919 255,365 950,336 178,814 293,547 715,462 236,283 106,071 41,941 22,628
Percent 100.0 100.0 100.0 100.0 100.0 100.0 100.0 100.0 100.0 100.0 100.0
Mud brick/Earth 12.4 16.7 17.8 1.9 26.5 16.6 5.5 22.3 50.4 55.7 37.3
Wood 4.7 3.1 2.2 10.5 0.8 1.4 2.7 1.4 0.8 0.4 0.4
Metal sheet/Slate/Asbestos 0.9 0.6 0.5 1.2 0.8 0.7 1.0 0.6 0.7 0.6 0.8
Stone 0.2 0.2 0.2 0.3 0.3 0.2 0.2 0.2 0.5 0.2 0.2
Burnt bricks 0.6 0.8 0.8 0.4 0.6 0.9 0.5 1.3 0.3 0.1 0.4
Cement blocks/Concrete 78.6 75.7 76.5 83.6 66.8 77.1 88.3 70.9 41.8 41.5 58.8
Landcrete 1.2 1.0 1.3 0.3 1.0 2.5 0.8 2.9 4.8 1.1 1.8
Bamboo 0.1 0.3 0.1 0.1 0.1 0.1 0.1 0.1 0.1 0.0 0.1
Palm leaf/Thatch (grass)/Raffia 0.3 1.1 0.1 0.1 2.6 0.1 0.1 0.1 0.3 0.0 0.1
Other 0.9 0.6 0.4 1.5 0.5 0.4 0.8 0.2 0.3 0.2 0.2
Main construction material for floor
Total 3,049,366 248,919 255,365 950,336 178,814 293,547 715,462 236,283 106,071 41,941 22,628
Percent 100.0 100.0 100.0 100.0 100.0 100.0 100.0 100.0 100.0 100.0 100.0
Earth/Mud 6.9 3.7 5.9 4.8 8.6 8.4 7.4 10.3 16.0 12.2 7.6
Cement/Concrete 84.0 88.9 89.0 80.3 88.4 87.1 82.4 86.0 81.5 85.5 89.2
Stone 0.6 0.5 0.4 0.5 0.5 1.0 0.6 0.7 0.6 0.4 0.4
Burnt brick 0.1 0.1 0.1 0.2 0.1 0.1 0.1 0.1 0.1 0.1 0.1
Wood 1.6 0.8 0.6 3.9 0.2 0.3 0.8 0.3 0.0 0.0 0.0
Vinyl tiles 1.6 1.3 1.0 2.7 0.5 0.8 1.9 0.6 0.3 0.3 0.6
Ceramic/Porcelain/Granite/Marble tiles 2.3 1.9 1.5 3.9 1.0 1.1 2.3 1.1 0.9 0.7 1.3
Terrazzo/Terrazzo tiles 2.6 2.6 1.2 3.5 0.5 1.0 4.2 0.7 0.2 0.7 0.7
Other 0.3 0.3 0.2 0.4 0.3 0.2 0.3 0.2 0.4 0.2 0.2
Main construction material for roof
Total 3,049,366 248,919 255,365 950,336 178,814 293,547 715,462 236,283 106,071 41,941 22,628
Percent 100.0 100.0 100.0 100.0 100.0 100.0 100.0 100.0 100.0 100.0 100.0
Mud/Mud bricks/Earth 0.3 0.2 0.2 0.3 0.3 0.2 0.2 0.3 2.0 2.7 1.2
Wood 0.8 0.6 0.5 0.9 0.5 0.6 1.1 0.7 0.8 0.8 0.5
Metal sheet 71.7 56.9 55.9 48.6 79.3 94.3 91.1 93.7 82.9 89.6 93.5
Slate/Asbestos 20.1 25.0 38.2 43.5 11.9 1.9 1.6 0.5 1.0 0.4 0.5
Cement/Concrete 3.8 12.3 3.1 3.9 1.2 1.1 4.5 0.9 0.7 0.9 1.3
Roofing tile 0.7 0.6 0.4 1.5 0.4 0.2 0.5 0.1 0.2 0.1 0.8
Bamboo 0.3 1.5 0.4 0.2 0.1 0.2 0.1 0.2 0.3 0.1 0.2
Thatch/Palm leaf or Raffia 1.7 2.2 0.9 0.4 5.6 1.3 0.4 3.2 11.3 4.9 1.5
Other 0.6 0.6 0.4 0.7 0.7 0.4 0.4 0.5 1.0 0.4 0.5 Source: Ghana Statistical Service, 2010 Population and Housing Census

39
4.3.3 Tenure/holding arrangement and ownership type
The analysis further pays attention to the type of ownership or tenure/holding arrangement
that were enjoyed by households in urban localities in Ghana. From the analysis shown in
Table 4.7, three main types of ownership stand out quite prominently, namely; ownership by
household member, other private individual and a relative who is not a member of the
household. About 40 percent of all urban households in the country said their dwelling unit
was owned by a member of the household; a relatively smaller proportion (37%) indicated
ownership by other private individuals while 16 percent was owned by a relative who was not
a member of that household. Earlier in Table 4.5, it was shown that 60 percent of the
households were in compound houses, implying that dwelling units that were said to be
owned by other private individuals or a relative not a member of the household could mostly
be compound houses. This is fairly consistent with the analysis on the type of dwelling for
urban households in the country.
Comparing ownership of dwelling unit by region suggests some consistency across almost all
regions with some slight variations. This is particularly the case with respect to dwelling units
owned by household member in the three northern regions. In these three regions to the north,
more than half of the households indicated ownership of dwelling unit by a household
member. In fact, in Northern and Upper East regions, it was around two-thirds with lesser
proportions answering ownership of dwelling unit by a relative not a member of the
household. Once again, this is a reflection of the compound housing arrangement that is
commonly practised in the northern parts of Ghana.
It is also to be noted from Table 4.7 that the type of tenure arrangement is consistent with
ownership. For example, at the national level, owner occupied, renting and rent-free are the
most prominent types of tenure arrangement that were reported in most of the urban localities
in the country. Close to half of the dwelling units had renting arrangement, a third was by
owner occupied and one in five was by rent-free. The three tenure arrangements are still
visible in all the regions but owner occupied tenure is seen to be quite dominant in the
Northern, Upper East and Upper West regions which is an indication that in those regions
there is a tendency for most household members to live in dwelling units that are owned by a
member of the household for which no rent is paid. Rental dwellings can also be seen to be
more prominent in three regions in the country, namely; Greater Accra, Western and Ashanti
regions. This is consistent with the fact that the three regions are home to the three cities in
the country, namely; Accra, Takoradi and Kumasi respectively. In these cities, it is quite
obvious that many people especially public and private sector employees have no other
alternative than to resort to rental accommodation until they are in a position to acquire their
own.
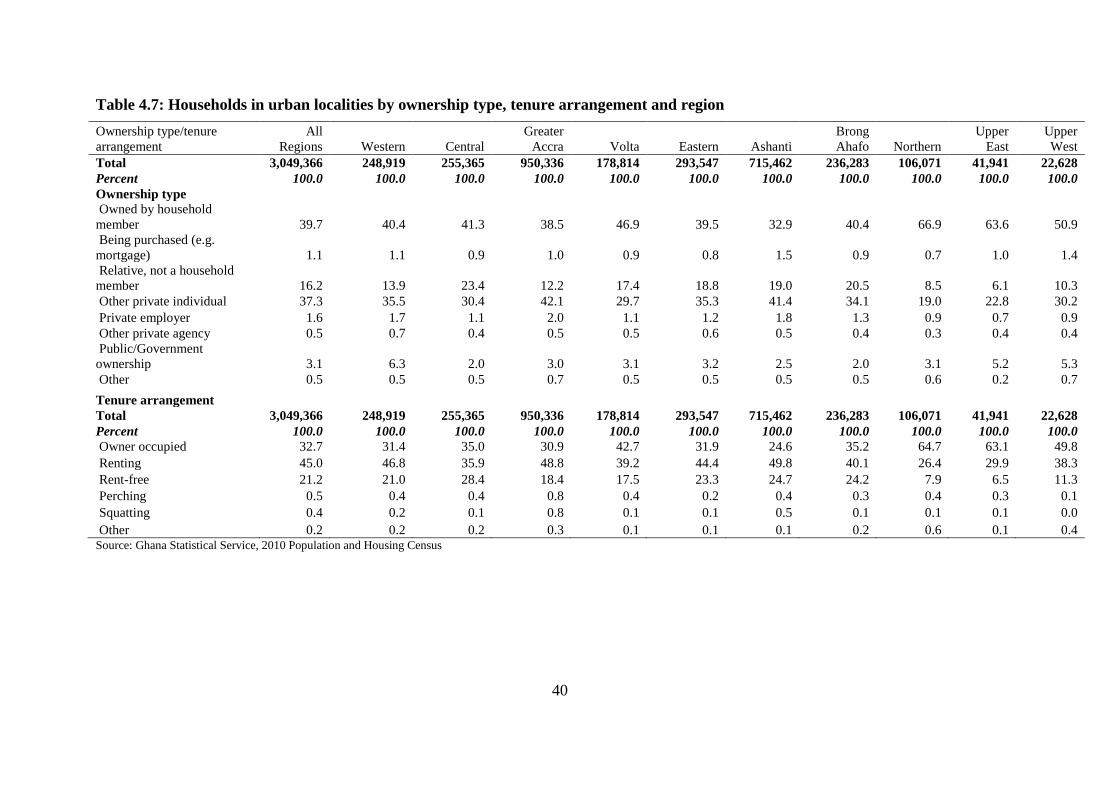
40
Table 4.7: Households in urban localities by ownership type, tenure arrangement and region
Ownership type/tenure
arrangement
All
Regions Western Central
Greater
Accra Volta Eastern Ashanti
Brong
Ahafo Northern
Upper
East
Upper
West
Total 3,049,366 248,919 255,365 950,336 178,814 293,547 715,462 236,283 106,071 41,941 22,628
Percent 100.0 100.0 100.0 100.0 100.0 100.0 100.0 100.0 100.0 100.0 100.0
Ownership type
Owned by household
member 39.7 40.4 41.3 38.5 46.9 39.5 32.9 40.4 66.9 63.6 50.9
Being purchased (e.g.
mortgage) 1.1 1.1 0.9 1.0 0.9 0.8 1.5 0.9 0.7 1.0 1.4
Relative, not a household
member 16.2 13.9 23.4 12.2 17.4 18.8 19.0 20.5 8.5 6.1 10.3
Other private individual 37.3 35.5 30.4 42.1 29.7 35.3 41.4 34.1 19.0 22.8 30.2
Private employer 1.6 1.7 1.1 2.0 1.1 1.2 1.8 1.3 0.9 0.7 0.9
Other private agency 0.5 0.7 0.4 0.5 0.5 0.6 0.5 0.4 0.3 0.4 0.4
Public/Government
ownership 3.1 6.3 2.0 3.0 3.1 3.2 2.5 2.0 3.1 5.2 5.3
Other 0.5 0.5 0.5 0.7 0.5 0.5 0.5 0.5 0.6 0.2 0.7
Tenure arrangement
Total 3,049,366 248,919 255,365 950,336 178,814 293,547 715,462 236,283 106,071 41,941 22,628
Percent 100.0 100.0 100.0 100.0 100.0 100.0 100.0 100.0 100.0 100.0 100.0
Owner occupied 32.7 31.4 35.0 30.9 42.7 31.9 24.6 35.2 64.7 63.1 49.8
Renting 45.0 46.8 35.9 48.8 39.2 44.4 49.8 40.1 26.4 29.9 38.3
Rent-free 21.2 21.0 28.4 18.4 17.5 23.3 24.7 24.2 7.9 6.5 11.3
Perching 0.5 0.4 0.4 0.8 0.4 0.2 0.4 0.3 0.4 0.3 0.1
Squatting 0.4 0.2 0.1 0.8 0.1 0.1 0.5 0.1 0.1 0.1 0.0
Other 0.2 0.2 0.2 0.3 0.1 0.1 0.1 0.2 0.6 0.1 0.4 Source: Ghana Statistical Service, 2010 Population and Housing Census

41
4.3.4 Number of rooms occupied and used for sleeping
An examination of the number of rooms available for use as sleeping places per household is
important in understanding the extent of overcrowding at the household level which also has
implications for the health of household members. Against this background, information was
collected on the number of rooms occupied and used by households in Ghana for sleeping
purposes. In this analysis, however, the focus is on urban localities in the country.
Table 4.8 shows the proportion distribution of number of rooms occupied and used for
sleeping by household and region of residence. The data indicate that at the national level, a
chunk of the households had access to one room or two rooms which put together amount to
76 percent. This means that households that occupy three or more rooms constitute only 24
percent which could have negative implications for overcrowding and health of household
members. This is more serious when we find in the same table that a much higher proportion
(about 84%) of households in urban localities in Ghana use one or two rooms as their
sleeping rooms with just 16 percent having access to three rooms or more.
The analysis by region is also quite consistent with the national averages except in the three
northern regions particularly the Northern Region where just about 40 percent of the
households occupied one or two rooms. A similar picture is shown with respect to rooms for
sleeping except that the proportion of households having one or two rooms is higher in every
region. This shows that households may have slightly higher number of rooms available but
those meant for sleeping are fewer since the concentration is on one or two rooms.
The results of the analysis in Table 4.8 are consistent with what is to be expected in most
urban localities especially the large towns and cities where rent is quite high and often
beyond the average incomes of ordinary residents. Consequently, many urban dwellers are
unable to rent big apartments with many rooms and are forced to make do with rental
accommodations with fewer rooms for sleeping. Again, it has earlier in this monograph been
found that a huge proportion of the urban dwelling households are in compound houses
where they may have one or two rooms to share among their members. This suggests that
overcrowding in households could be common features of many households in urban
localities in Ghana with obvious negative health implications.

42
Table 4.8: Households in urban localities by number of rooms, sleeping rooms occupied and region
Number of rooms
All
Regions Western Central
Greater
Accra Volta Eastern Ashanti
Brong
Ahafo Northern
Upper
East
Upper
West
Number of rooms/Sleeping rooms occupied
Total 3,049,366 248,919 255,365 950,336 178,814 293,547 715,462 236,283 106,071 41,941 22,628
Percent 100.0 100.0 100.0 100.0 100.0 100.0 100.0 100.0 100.0 100.0 100.0
Rooms Occupied
One room 51.4 53.2 56.6 48.2 34.9 47.1 63.0 57.8 22.1 28.2 38.7
Two rooms 24.6 24.3 24.0 30.2 33.9 28.6 16.7 19.6 17.2 21.0 22.3
Three rooms 9.1 9.9 8.5 7.9 13.2 10.3 7.6 9.6 14.0 16.4 14.5
Four rooms 5.6 5.7 4.8 5.3 7.6 6.1 4.6 5.3 10.6 11.6 9.0
Five rooms 3.3 2.9 2.4 3.4 3.8 3.1 2.8 3.0 8.6 6.9 5.0
Six rooms 2.2 1.6 1.5 2.1 2.6 2.0 2.1 1.9 6.5 5.1 3.6
Seven rooms 1.4 1.0 0.9 1.3 1.6 1.2 1.4 1.2 5.2 3.2 2.2
Eight rooms 0.8 0.5 0.5 0.7 1.0 0.7 0.8 0.7 4.0 2.3 1.6
Nine rooms or more 1.4 0.7 0.7 0.9 1.5 1.0 1.1 1.0 11.8 5.3 3.2
Sleeping rooms
Total 3,049,366 248,919 255,365 950,336 178,814 293,547 715,462 236,283 106,071 41,941 22,628
Percent 100.0 100.0 100.0 100.0 100.0 100.0 100.0 100.0 100.0 100.0 100.0
One room 61.4 63.9 65.7 61.9 52.9 57.6 69.0 62.4 27.0 35.0 46.0
Two rooms 22.2 21.7 21.8 24.6 27.8 25.9 16.7 19.6 21.5 27.9 25.8
Three rooms 7.8 7.7 6.7 6.7 9.8 8.5 6.7 8.8 16.1 15.6 12.3
Four rooms 4.2 3.7 3.2 3.8 4.9 4.1 3.5 4.5 11.0 9.5 6.9
Five rooms 2.0 1.5 1.3 1.6 2.1 1.8 2.0 2.1 7.3 4.7 3.4
Six rooms 1.1 0.7 0.7 0.7 1.2 0.9 1.1 1.2 4.8 2.8 2.2
Seven rooms 0.5 0.3 0.3 0.3 0.5 0.4 0.5 0.5 3.3 1.4 1.0
Eight rooms 0.3 0.2 0.2 0.2 0.4 0.3 0.3 0.4 2.4 0.9 0.8
Nine rooms or more 0.6 0.3 0.2 0.2 0.5 0.3 0.4 0.5 6.6 2.1 1.5 Source: Ghana Statistical Service, 2010 Population and Housing Census
43
4.4 Water and Sanitation
Water and sanitation are basic needs for every household in Ghana. Access to potable water
for drinking and for domestic use is, therefore, critical in assessing the quality of life of
people. For urban areas where there may not be streams that may provide water for domestic
use, the residents’ access to a regular source of water is very important. The 2010 PHC,
therefore, collected valuable information on the main source of water for drinking and for
domestic use in all households in the country. These data are analysed in this section of the
Monograph to assess the variations in the main source of water available for drinking and for
other domestic use.
4.4.1 Source of water supply
Table 4.9 presents the results of the analysis on source of water for drinking and domestic use
among all urban localities by region in Ghana. According to the results, the proportion of
urban population with access to pipe-borne water facility is a little less than two-thirds in the
country. This is split among those who have pipe-borne water inside dwelling (24%), pipe-
borne outside dwelling (26%) and public tap (15%). Apart from these three sources, sachet
water popularly called “pure” water is quite commonly used in the country with about 14
percent of urban inhabitants patronising it as the main source of drinking water. It is also
observed that the bore-hole and protected well are also used by quite a high proportion of
urban dwellers: nine percent and six percent respectively. This is obviously due to the non-
reliability of piped water supply from the public agency that is responsible for producing
treated water for the public consumption in many urban localities in the country. Again, it
could be due to the rapid rate of urban agglomeration which runs ahead of the capacity of the
Ghana Water Company to meet demand as the urban localities spatially spread with increased
population.
At the regional level, similar results are shown with some significant variations. It is to be
noted that the three northern regions which usually lag behind the other regions in the country
with regard to social services or facilities appear to be relatively more advantaged in terms of
the use of piped water within or outside dwelling compared to many of southern regions
particularly Brong Ahafo, Volta, Eastern and Central regions. Besides, the use of water from
bore-hole and protected wells is also more common in the three northern regions compared to
their counterparts in the south. This may be due to the concentration of organisations that
support the production of water by bore-hole to communities in these three regions. The use
of the so-called “pure water” for drinking in the northern regions is, therefore, quite low
relative to the other regions.
From Table 4.9 again, we find at the national level that the proportion that uses pipe-borne
water for domestic purposes is relatively higher compared to their use for drinking. Similarly,
the use of the bore-hole and protected well is much higher for domestic use than for drinking.
Again, sachet water is completely missing from the source of domestic water for domestic
use perhaps due to the fact that it could be very expensive when used for domestic use other
than for drinking. The pattern shown in the regions is not very different from that seen at the
national level. The use of unprotected well, however, appears to be higher in the Volta
Region (about 11%) than all the other regions where it is generally below five percent.
Furthermore, the use of the stream or river is equally higher in the Volta and Eastern regions
where respectively about eight and seven percent respectively were using river/stream as a
major source of domestic water use.
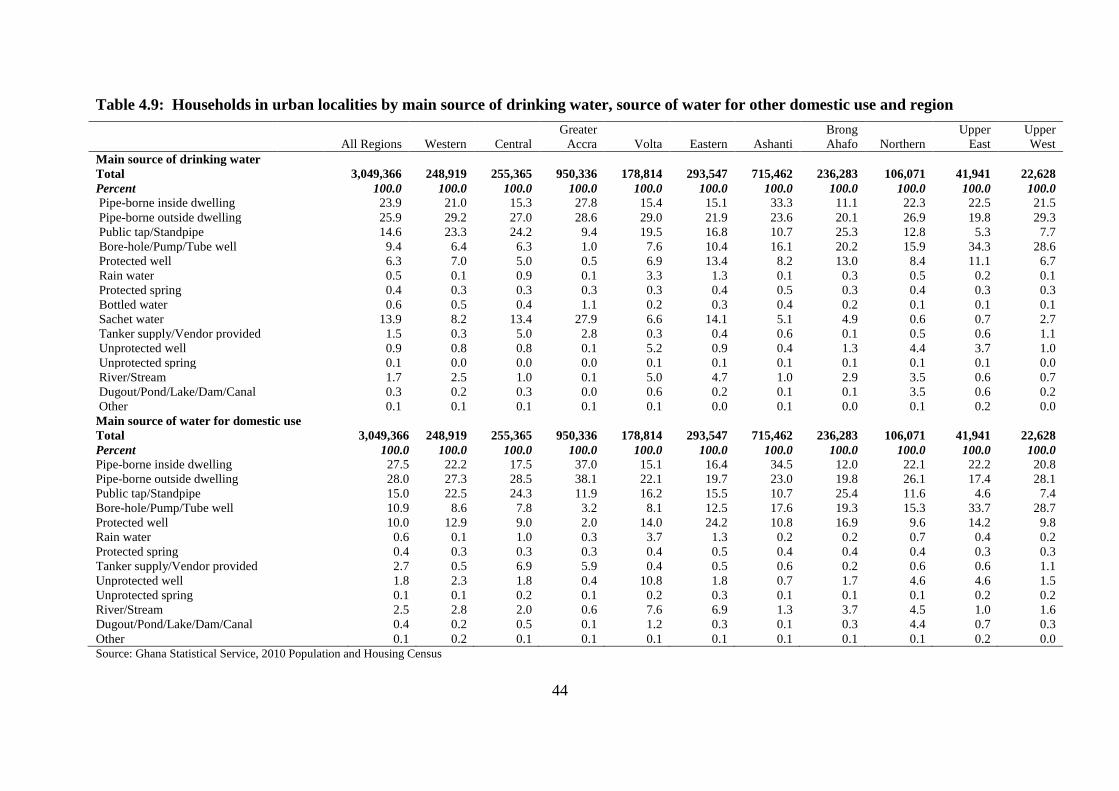
44
Table 4.9: Households in urban localities by main source of drinking water, source of water for other domestic use and region
All Regions Western Central
Greater
Accra Volta Eastern Ashanti
Brong
Ahafo Northern
Upper
East
Upper
West
Main source of drinking water
Total 3,049,366 248,919 255,365 950,336 178,814 293,547 715,462 236,283 106,071 41,941 22,628
Percent 100.0 100.0 100.0 100.0 100.0 100.0 100.0 100.0 100.0 100.0 100.0
Pipe-borne inside dwelling 23.9 21.0 15.3 27.8 15.4 15.1 33.3 11.1 22.3 22.5 21.5
Pipe-borne outside dwelling 25.9 29.2 27.0 28.6 29.0 21.9 23.6 20.1 26.9 19.8 29.3
Public tap/Standpipe 14.6 23.3 24.2 9.4 19.5 16.8 10.7 25.3 12.8 5.3 7.7
Bore-hole/Pump/Tube well 9.4 6.4 6.3 1.0 7.6 10.4 16.1 20.2 15.9 34.3 28.6
Protected well 6.3 7.0 5.0 0.5 6.9 13.4 8.2 13.0 8.4 11.1 6.7
Rain water 0.5 0.1 0.9 0.1 3.3 1.3 0.1 0.3 0.5 0.2 0.1
Protected spring 0.4 0.3 0.3 0.3 0.3 0.4 0.5 0.3 0.4 0.3 0.3
Bottled water 0.6 0.5 0.4 1.1 0.2 0.3 0.4 0.2 0.1 0.1 0.1
Sachet water 13.9 8.2 13.4 27.9 6.6 14.1 5.1 4.9 0.6 0.7 2.7
Tanker supply/Vendor provided 1.5 0.3 5.0 2.8 0.3 0.4 0.6 0.1 0.5 0.6 1.1
Unprotected well 0.9 0.8 0.8 0.1 5.2 0.9 0.4 1.3 4.4 3.7 1.0
Unprotected spring 0.1 0.0 0.0 0.0 0.1 0.1 0.1 0.1 0.1 0.1 0.0
River/Stream 1.7 2.5 1.0 0.1 5.0 4.7 1.0 2.9 3.5 0.6 0.7
Dugout/Pond/Lake/Dam/Canal 0.3 0.2 0.3 0.0 0.6 0.2 0.1 0.1 3.5 0.6 0.2
Other 0.1 0.1 0.1 0.1 0.1 0.0 0.1 0.0 0.1 0.2 0.0
Main source of water for domestic use
Total 3,049,366 248,919 255,365 950,336 178,814 293,547 715,462 236,283 106,071 41,941 22,628
Percent 100.0 100.0 100.0 100.0 100.0 100.0 100.0 100.0 100.0 100.0 100.0
Pipe-borne inside dwelling 27.5 22.2 17.5 37.0 15.1 16.4 34.5 12.0 22.1 22.2 20.8
Pipe-borne outside dwelling 28.0 27.3 28.5 38.1 22.1 19.7 23.0 19.8 26.1 17.4 28.1
Public tap/Standpipe 15.0 22.5 24.3 11.9 16.2 15.5 10.7 25.4 11.6 4.6 7.4
Bore-hole/Pump/Tube well 10.9 8.6 7.8 3.2 8.1 12.5 17.6 19.3 15.3 33.7 28.7
Protected well 10.0 12.9 9.0 2.0 14.0 24.2 10.8 16.9 9.6 14.2 9.8
Rain water 0.6 0.1 1.0 0.3 3.7 1.3 0.2 0.2 0.7 0.4 0.2
Protected spring 0.4 0.3 0.3 0.3 0.4 0.5 0.4 0.4 0.4 0.3 0.3
Tanker supply/Vendor provided 2.7 0.5 6.9 5.9 0.4 0.5 0.6 0.2 0.6 0.6 1.1
Unprotected well 1.8 2.3 1.8 0.4 10.8 1.8 0.7 1.7 4.6 4.6 1.5
Unprotected spring 0.1 0.1 0.2 0.1 0.2 0.3 0.1 0.1 0.1 0.2 0.2
River/Stream 2.5 2.8 2.0 0.6 7.6 6.9 1.3 3.7 4.5 1.0 1.6
Dugout/Pond/Lake/Dam/Canal 0.4 0.2 0.5 0.1 1.2 0.3 0.1 0.3 4.4 0.7 0.3
Other 0.1 0.2 0.1 0.1 0.1 0.1 0.1 0.1 0.1 0.2 0.0
Source: Ghana Statistical Service, 2010 Population and Housing Census

45
4.4.2 Type of bathing facility
Table 4.10 has information on both bathing and toilet facility for all urban localities in the
country. The information on bathing facilities shows that at the national level, one in four
households used their own bathroom for their exclusive use; two in five share separate
bathroom in the same house while one in five shares open cubicle. Those who use public bath
house constitute quite a small proportion (about 4%). It is also interesting to note that some of
the urban households do not have facilities for bathing and resort to using bath rooms from
other houses. Although these constitute a small proportion (2%), it is interesting when
considered against the background that urban localities are more anonymous and
individualistic in outlook. Again, it is noteworthy to underline the result that four percent of
the households in urban localities in Ghana use open space around the house as their
bathrooms or spaces for bathing.
The regional comparison indicates that ownership of bathrooms for the exclusive use of the
household is highest in the Northern Region where almost 30 percent of the urban households
have such a facility. This is followed by Upper East and Volta regions (about 29% each)
while Brong Ahafo ranks the lowest with 20 percent. On the other hand, regarding the use of
shared separate bathrooms in the same house, Ashanti Region ranks on top with a little more
than half of urban households in that region using this type of bathing facility. Here also, it is
observed that Eastern, Brong Ahafo, Western and Upper West regions are next to Ashanti
Region with their proportion using shared separate bathroom facilities above the national
average of 40 percent.
Furthermore, shared open cubicle is quite common in each of the regions particularly in Volta
Region where the analysis shows one in five urban households making use of shared open
cubicle as bathroom. Ashanti Region recorded the lowest proportion of urban households
using shared open cubicle as bathroom. It is also to be observed that four regions, namely;
Central, Brong Ahafo, Upper East and Volta recorded at least five percent of their urban
households using open space around the house as their bathing facility. All the other facilities
recorded very insignificant proportions in each of the regions in the country.
4.4.2 Type of toilet facility
Availability of toilet facility by type at the household level is important for assessing the
quality of life of household members. From Table 4.10, one in four urban households in
Ghana has access to water closet toilet facility at the household level and a little more than
one in 10 urban households use either pit latrine or KVIP toilet facility. Public toilet facility
(made up of water closets, KVIP, pit or pan latrine) is also used by close to two of five urban
households in the country. What is important, however, is not the mere use of public toilet
but the standard of hygiene that is maintained at these public toilets particularly in localities
where there is no access to regular flow of water from the pipes.
It has to be noted also that almost one in 10 of urban households in the country have no toilet
facility and, therefore, make use of the bush, beach or any available field. This constitutes a
major challenge that requires some policy intervention. This is because of the health
implications this practice could have on not only households that use these areas as places of
convenience but all urban dwellers since the impact of these practices could be distributed
air-borne across the urban population and even beyond.
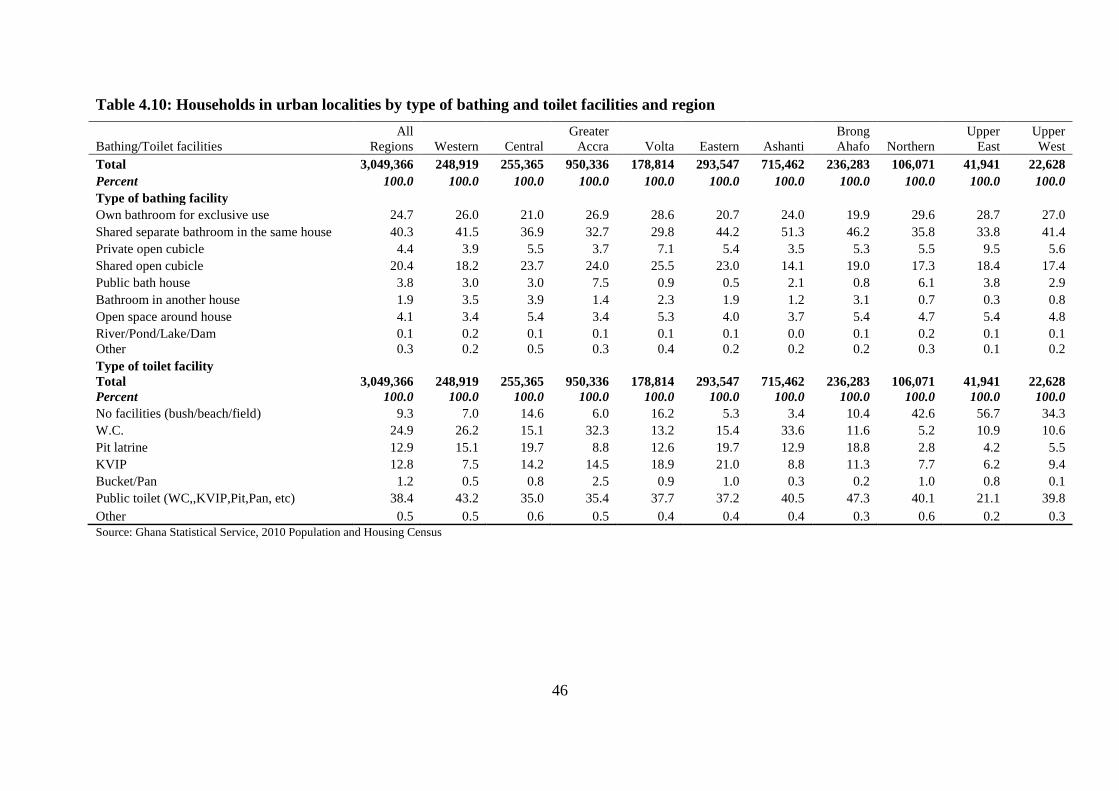
46
Table 4.10: Households in urban localities by type of bathing and toilet facilities and region
Bathing/Toilet facilities
All
Regions Western Central
Greater
Accra Volta Eastern Ashanti
Brong
Ahafo Northern
Upper
East
Upper
West
Total 3,049,366 248,919 255,365 950,336 178,814 293,547 715,462 236,283 106,071 41,941 22,628
Percent 100.0 100.0 100.0 100.0 100.0 100.0 100.0 100.0 100.0 100.0 100.0
Type of bathing facility
Own bathroom for exclusive use 24.7 26.0 21.0 26.9 28.6 20.7 24.0 19.9 29.6 28.7 27.0
Shared separate bathroom in the same house 40.3 41.5 36.9 32.7 29.8 44.2 51.3 46.2 35.8 33.8 41.4
Private open cubicle 4.4 3.9 5.5 3.7 7.1 5.4 3.5 5.3 5.5 9.5 5.6
Shared open cubicle 20.4 18.2 23.7 24.0 25.5 23.0 14.1 19.0 17.3 18.4 17.4
Public bath house 3.8 3.0 3.0 7.5 0.9 0.5 2.1 0.8 6.1 3.8 2.9
Bathroom in another house 1.9 3.5 3.9 1.4 2.3 1.9 1.2 3.1 0.7 0.3 0.8
Open space around house 4.1 3.4 5.4 3.4 5.3 4.0 3.7 5.4 4.7 5.4 4.8
River/Pond/Lake/Dam 0.1 0.2 0.1 0.1 0.1 0.1 0.0 0.1 0.2 0.1 0.1
Other 0.3 0.2 0.5 0.3 0.4 0.2 0.2 0.2 0.3 0.1 0.2
Type of toilet facility
Total 3,049,366 248,919 255,365 950,336 178,814 293,547 715,462 236,283 106,071 41,941 22,628
Percent 100.0 100.0 100.0 100.0 100.0 100.0 100.0 100.0 100.0 100.0 100.0
No facilities (bush/beach/field) 9.3 7.0 14.6 6.0 16.2 5.3 3.4 10.4 42.6 56.7 34.3
W.C. 24.9 26.2 15.1 32.3 13.2 15.4 33.6 11.6 5.2 10.9 10.6
Pit latrine 12.9 15.1 19.7 8.8 12.6 19.7 12.9 18.8 2.8 4.2 5.5
KVIP 12.8 7.5 14.2 14.5 18.9 21.0 8.8 11.3 7.7 6.2 9.4
Bucket/Pan 1.2 0.5 0.8 2.5 0.9 1.0 0.3 0.2 1.0 0.8 0.1
Public toilet (WC,,KVIP,Pit,Pan, etc) 38.4 43.2 35.0 35.4 37.7 37.2 40.5 47.3 40.1 21.1 39.8
Other 0.5 0.5 0.6 0.5 0.4 0.4 0.4 0.3 0.6 0.2 0.3
Source: Ghana Statistical Service, 2010 Population and Housing Census

47
The regional comparison has interesting results. Apart from Greater Accra and Ashanti
regions where about a third of urban households were using water closet toilet facilities,
smaller proportions in the other regions reported access to water closets at the household
level. The region that reported the lowest use of water closet within the household is Northern
Region which recorded just five percent of water closet use. The use of public toilet facility is
also quite high in almost all the regions, the highest being in Brong Ahafo (43%) and the least
in Upper East Region (21%). The important question about public toilet facility usage is
whether or not it could be kept clean and hygienic to avoid the spread of infections. Again,
the capacity of the public toilets often is below the size of the population that is expected to
use such a facility. This could push people who are unable to wait and queue during rush
hours to use available open spaces like the bush.
Absence of toilet facilities is very visible in the northern regions especially Upper East
Region where more than half of the urban households report to have no toilet facilities for
their use. This is followed by Northern Region (43%) and Upper West (34%). With such a
situation, there is a high tendency for urban household members to use the bush and any
available space to attend to nature’s call, which could have long-term negative health and
environmental implications. Comparatively, the regions in the south appear to be more
advantaged since apart from Volta and Brong Ahafo regions where respectively 16 percent
and 14 percent of the urban households had no toilet facility, less than 10 percent of urban
households in the other regions recorded the absence of any toilet facility.
4.4.3 Means of solid waste disposal
Analysis of information collected from urban households on method of solid and liquid waste
disposal is presented in Table 4.11. It is seen that one in five urban households reported that
their solid waste is collected. A similar proportion also reported to be disposing off their
solid waste by public dump at any open space. This compares with almost two in five urban
households that disposed their solid waste at a public dump in a container. At the same time,
one in ten urban households burned their solid waste. About five percent of the households
either dumped their solid waste indiscriminately or buried it.
There are variations at the regional level with Greater Accra Region conspicuously standing
out with half of the region’s urban households reporting the collection of their solid waste
compared to 14 percent and 13 percent of their counterparts in Western and Ashanti regions
respectively as the closest in the collection of their solid waste. Apart from these regions, less
than 10 percent of the urban households in the remaining regions reported the collection of
their solid waste. This shows that solid waste that is collected at the household level in the
country is common only in the Greater Accra Region.
The means of solid waste disposal that is the most dominantly used is by public dump using
the container. The use of this facility for solid waste disposal is highest in Ashanti Region
where 53 percent of the region’s households resort to public dumping of solid waste into
containers. So far, Upper East and Greater Accra regions recorded the lowest use of public
dump into containers for solid waste disposal. Interestingly, in many urban areas, cities and
towns, the containers into which the solid waste is dumped could best be described as
dumping waste at open spaces because in most cases, we observe the containers to overflow
and spill over as if the containers do not exist for the solid waste. Furthermore, public dump
into open spaces in the country is also quite common in Brong Ahafo, Central and Western
regions where a third or higher of the urban households were dumping their solid waste at
public open spaces. This could have serious implications for the public health of the nation.

48
4.4.4 Means of liquid waste disposal
From Table 4.11, throwing into gutter appears to be the commonest means used by
households in urban Ghana to dispose of liquid waste. This formed almost 30 percent of
urban households in the country. This is followed by one in four of the households that
responded to throwing their liquid waste onto the compound while one in five threw it onto
the street/outside the house. The use of the drainage system into the gutter and through the
sewerage system was reported by 18 percent and five percent respectively of the urban
households in the country. This is an indication of the limited development of the sewerage
system in urban Ghana.
The regional analysis shows some significant variations in the means of liquid waste disposal
in urban localities in the country. For example, for the most improved method of liquid waste
disposal, i.e., through the sewerage system, the highest use was in the Greater Accra Region
and that amounted to about 10 percent. Interestingly, Greater Accra was the only region
whose use of the sewerage system for liquid waste disposal was higher than the national
average of five percent. It was followed by four percent in Ashanti and Upper East regions.
All the other regions recorded lower use of the sewerage system.
On the other hand, Ashanti (29%), Western (20%) and Greater Accra (20%) stand out among
the other regions as the highest users of liquid disposal through the drainage system into a
gutter compared to the other regions where use of this method of liquid waste disposal was 10
percent or lower. Throwing liquid waste into gutter or onto the compound also appears to be
well patronised in most of the regions with the exception of the three northern regions
particularly for liquid waste thrown into gutter where in the three regions, use was much
lower. For these three northern regions, the results indicate quite clearly that liquid waste is
disposed mainly by throwing it onto the street/outside. As high as 50 percent or higher
proportion of households in urban localities reported to depend on this practice of liquid
waste disposal. The region that comes close to the three northern regions is Brong Ahafo with
44 percent of its urban households using this mode of liquid waste disposal.
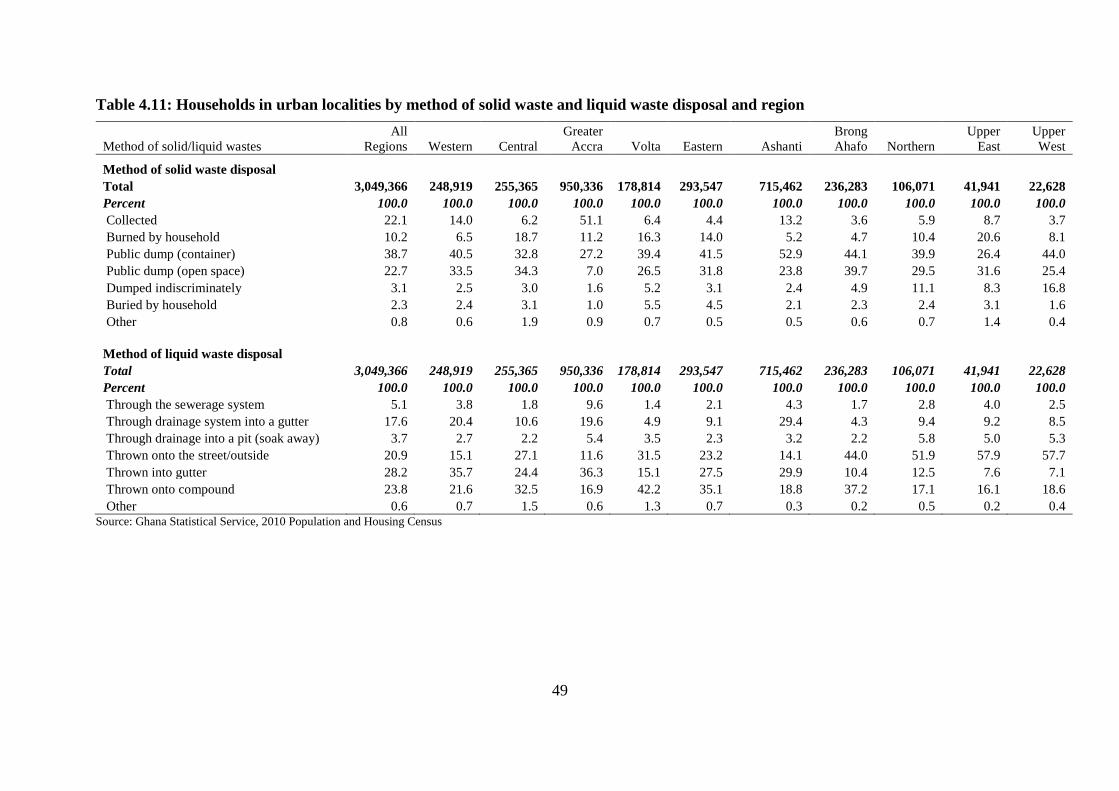
49
Table 4.11: Households in urban localities by method of solid waste and liquid waste disposal and region
Method of solid/liquid wastes
All
Regions Western Central
Greater
Accra Volta Eastern Ashanti
Brong
Ahafo Northern
Upper
East
Upper
West
Method of solid waste disposal
Total 3,049,366 248,919 255,365 950,336 178,814 293,547 715,462 236,283 106,071 41,941 22,628
Percent 100.0 100.0 100.0 100.0 100.0 100.0 100.0 100.0 100.0 100.0 100.0
Collected 22.1 14.0 6.2 51.1 6.4 4.4 13.2 3.6 5.9 8.7 3.7
Burned by household 10.2 6.5 18.7 11.2 16.3 14.0 5.2 4.7 10.4 20.6 8.1
Public dump (container) 38.7 40.5 32.8 27.2 39.4 41.5 52.9 44.1 39.9 26.4 44.0
Public dump (open space) 22.7 33.5 34.3 7.0 26.5 31.8 23.8 39.7 29.5 31.6 25.4
Dumped indiscriminately 3.1 2.5 3.0 1.6 5.2 3.1 2.4 4.9 11.1 8.3 16.8
Buried by household 2.3 2.4 3.1 1.0 5.5 4.5 2.1 2.3 2.4 3.1 1.6
Other 0.8 0.6 1.9 0.9 0.7 0.5 0.5 0.6 0.7 1.4 0.4
Method of liquid waste disposal
Total 3,049,366 248,919 255,365 950,336 178,814 293,547 715,462 236,283 106,071 41,941 22,628
Percent 100.0 100.0 100.0 100.0 100.0 100.0 100.0 100.0 100.0 100.0 100.0
Through the sewerage system 5.1 3.8 1.8 9.6 1.4 2.1 4.3 1.7 2.8 4.0 2.5
Through drainage system into a gutter 17.6 20.4 10.6 19.6 4.9 9.1 29.4 4.3 9.4 9.2 8.5
Through drainage into a pit (soak away) 3.7 2.7 2.2 5.4 3.5 2.3 3.2 2.2 5.8 5.0 5.3
Thrown onto the street/outside 20.9 15.1 27.1 11.6 31.5 23.2 14.1 44.0 51.9 57.9 57.7
Thrown into gutter 28.2 35.7 24.4 36.3 15.1 27.5 29.9 10.4 12.5 7.6 7.1
Thrown onto compound 23.8 21.6 32.5 16.9 42.2 35.1 18.8 37.2 17.1 16.1 18.6
Other 0.6 0.7 1.5 0.6 1.3 0.7 0.3 0.2 0.5 0.2 0.4 Source: Ghana Statistical Service, 2010 Population and Housing Census
50
4.5 Energy
Household energy usage is an important indicator of the wellbeing or standard of living of
members of the household. For example, depending on the source of energy for household
use i.e., whether improved or traditional could constitute a good indication of the quality of
life of the members. Against this backdrop, this section presents an analysis of the main
source of lighting for urban households in Ghana with a comparison among the ten regions.
In addition, the main source of cooking fuel and cooking space at the household are analysed,
again bringing out the regional variations.
4.5.1 Main source of lighting
The results of the analysis presented in Table 4.12 show quite clearly that in Ghana a little
more than four in five urban households use electricity as the main source of lighting. While
this is to be expected, it is also true that some urban households have no access to electricity
for lighting. For those households that do not access electricity for their lighting, the kerosene
lamp and flashlight/touch are the two mainly used sources of lighting which respectively are
patronised by eight percent and about six percent respectively.
A similar pattern is shown at the regional level where the major source of lighting in all the
regions happens to be electricity although there are some variations. For example, the regions
with the highest proportion of nearly 90 percent access to electricity for household lighting
are Greater Accra, Western and Ashanti regions. In contrast, the other regions each reported
less than 80 percent use of electricity for household lighting, the lowest use being recorded in
the Upper East (about 65%) and Volta regions (almost 70%). In these two regions where
access to electricity is lowest, the other major alternative source of lighting at the household
level is kerosene lamp. In the Volta Region, one in four urban households reported to depend
on kerosene lamp. A similar proportion of urban households in Upper East Region also
named kerosene lamp as the second major source of lighting. It is also important to note that
the use of flashlight/torch was highest in Brong Ahafo Region where as high as 15 percent of
the urban households were using this facility, followed by Upper East and Upper West where
about 10 percent of their urban households were using flashlight/torch. In the remaining eight
regions, however, less than 10 percent reported to use the flashlight or torch as the major
source of lighting at the household level.
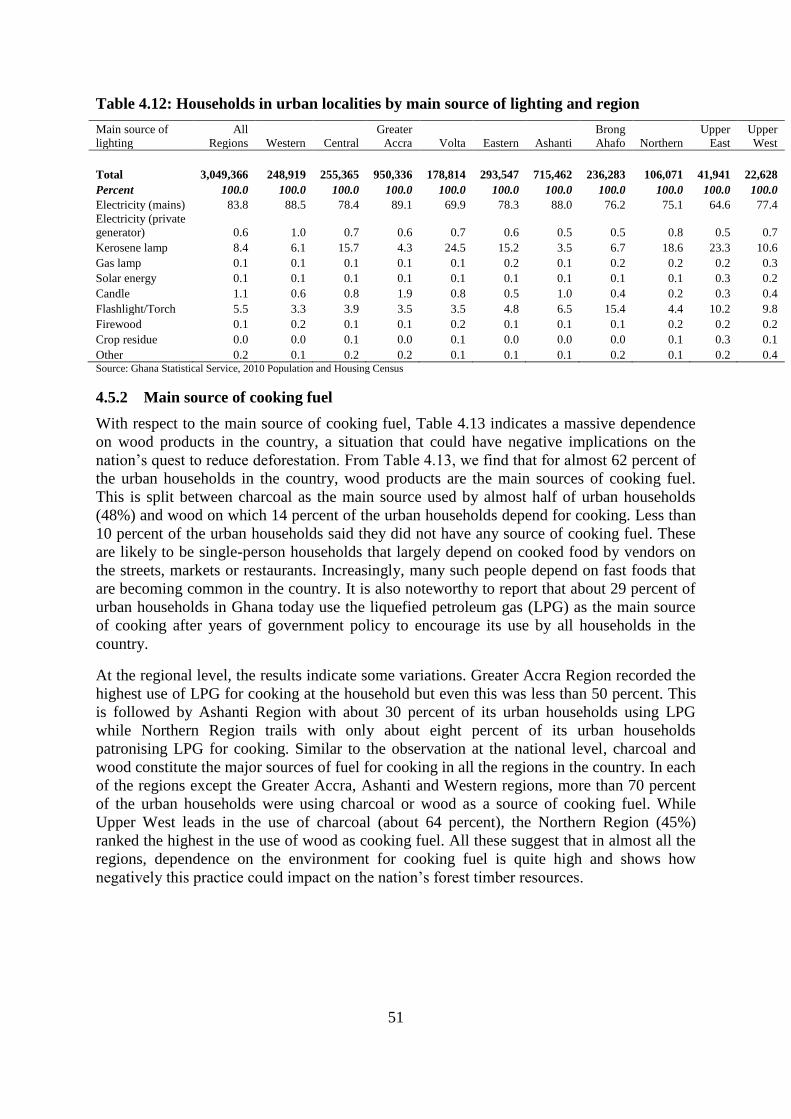
51
Table 4.12: Households in urban localities by main source of lighting and region
Main source of
lighting
All
Regions Western Central
Greater
Accra Volta Eastern Ashanti
Brong
Ahafo Northern
Upper
East
Upper
West
Total 3,049,366 248,919 255,365 950,336 178,814 293,547 715,462 236,283 106,071 41,941 22,628
Percent 100.0 100.0 100.0 100.0 100.0 100.0 100.0 100.0 100.0 100.0 100.0
Electricity (mains) 83.8 88.5 78.4 89.1 69.9 78.3 88.0 76.2 75.1 64.6 77.4
Electricity (private
generator) 0.6 1.0 0.7 0.6 0.7 0.6 0.5 0.5 0.8 0.5 0.7
Kerosene lamp 8.4 6.1 15.7 4.3 24.5 15.2 3.5 6.7 18.6 23.3 10.6
Gas lamp 0.1 0.1 0.1 0.1 0.1 0.2 0.1 0.2 0.2 0.2 0.3
Solar energy 0.1 0.1 0.1 0.1 0.1 0.1 0.1 0.1 0.1 0.3 0.2
Candle 1.1 0.6 0.8 1.9 0.8 0.5 1.0 0.4 0.2 0.3 0.4
Flashlight/Torch 5.5 3.3 3.9 3.5 3.5 4.8 6.5 15.4 4.4 10.2 9.8
Firewood 0.1 0.2 0.1 0.1 0.2 0.1 0.1 0.1 0.2 0.2 0.2
Crop residue 0.0 0.0 0.1 0.0 0.1 0.0 0.0 0.0 0.1 0.3 0.1
Other 0.2 0.1 0.2 0.2 0.1 0.1 0.1 0.2 0.1 0.2 0.4 Source: Ghana Statistical Service, 2010 Population and Housing Census
4.5.2 Main source of cooking fuel
With respect to the main source of cooking fuel, Table 4.13 indicates a massive dependence
on wood products in the country, a situation that could have negative implications on the
nation’s quest to reduce deforestation. From Table 4.13, we find that for almost 62 percent of
the urban households in the country, wood products are the main sources of cooking fuel.
This is split between charcoal as the main source used by almost half of urban households
(48%) and wood on which 14 percent of the urban households depend for cooking. Less than
10 percent of the urban households said they did not have any source of cooking fuel. These
are likely to be single-person households that largely depend on cooked food by vendors on
the streets, markets or restaurants. Increasingly, many such people depend on fast foods that
are becoming common in the country. It is also noteworthy to report that about 29 percent of
urban households in Ghana today use the liquefied petroleum gas (LPG) as the main source
of cooking after years of government policy to encourage its use by all households in the
country.
At the regional level, the results indicate some variations. Greater Accra Region recorded the
highest use of LPG for cooking at the household but even this was less than 50 percent. This
is followed by Ashanti Region with about 30 percent of its urban households using LPG
while Northern Region trails with only about eight percent of its urban households
patronising LPG for cooking. Similar to the observation at the national level, charcoal and
wood constitute the major sources of fuel for cooking in all the regions in the country. In each
of the regions except the Greater Accra, Ashanti and Western regions, more than 70 percent
of the urban households were using charcoal or wood as a source of cooking fuel. While
Upper West leads in the use of charcoal (about 64 percent), the Northern Region (45%)
ranked the highest in the use of wood as cooking fuel. All these suggest that in almost all the
regions, dependence on the environment for cooking fuel is quite high and shows how
negatively this practice could impact on the nation’s forest timber resources.

52
4.5.3 Type of cooking space
Table 4.13 further shows the type of cooking space used by urban households in the country.
From the results, it is observed that less than a third of all urban households in Ghana have
separate room for exclusive use as cooking space. Aside this, two other spaces that are quite
common are the veranda and open space in compound used by 30 percent and 20 percent
respectively in the country. It should also be noted that eight percent of all urban households
said they did not have any cooping space. These could be the households that do not cook in
the house but instead purchase already cooked food from outside the home.
Similar results are shown at the regional level but some variations exist between the regions.
The Western Region recorded the highest proportion (35%) of urban households with
separate room for exclusive use. This was followed by Volta, Eastern, Greater Accra and
Upper East where the proportion with such a facility was higher than the national average
while that in the remaining regions were below. Once again, the proportion of urban
households in each region using the veranda or open space in compound was quite
significant. For example, the use of the veranda for cooking ranged from a low of about 16
percent in the Volta Region to a high of 46 percent in the Upper West Region. In contrast, the
Northern Region recorded the highest proportion (44%) use of open space in compound as
cooking space compared to the lowest in Ashanti Region (about 13%). Furthermore, although
the proportion of households with no cooking space was generally low, the results indicate
that three regions, namely; Ashanti, Brong Ahafo and Eastern recorded 10 percent or higher
of their urban households to have no cooking space. This compares with proportions of less
than 10 percent in the other regions with the Volta Region recording the lowest percentage of
four. As was explained earlier, these are likely to be households that depend on cooked food
from outside.
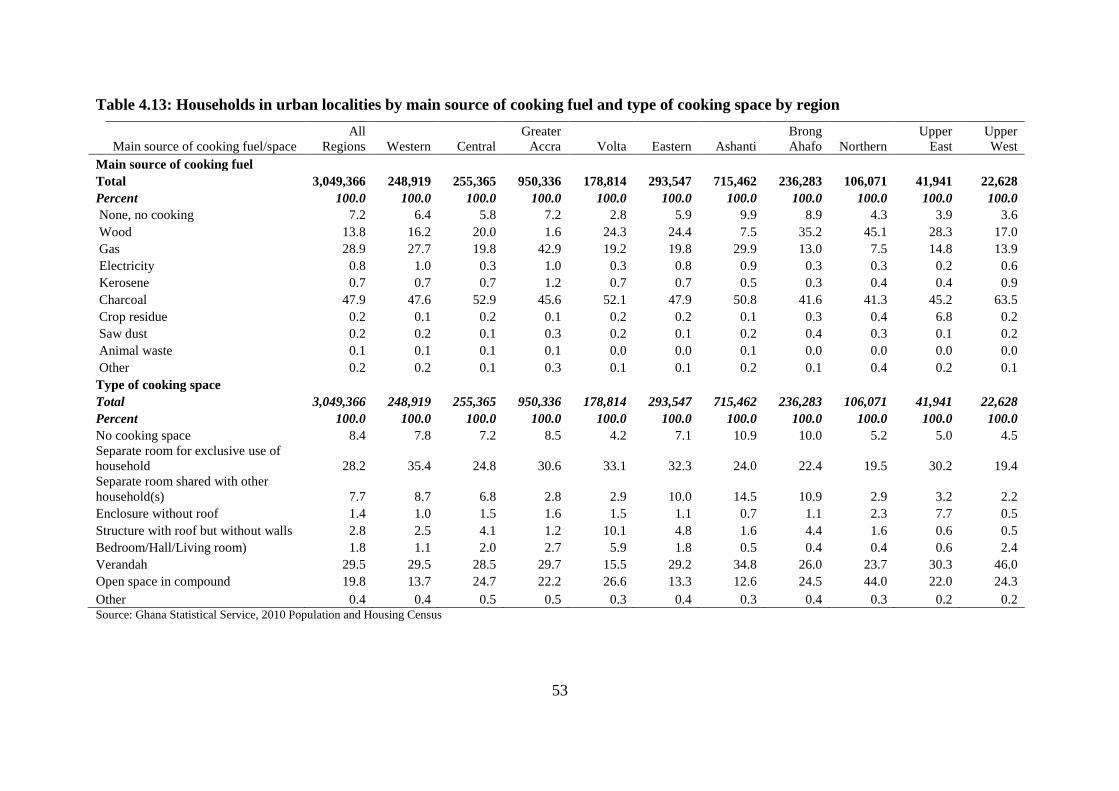
53
Table 4.13: Households in urban localities by main source of cooking fuel and type of cooking space by region
Main source of cooking fuel/space
All
Regions Western Central
Greater
Accra Volta Eastern Ashanti
Brong
Ahafo Northern
Upper
East
Upper
West
Main source of cooking fuel
Total 3,049,366 248,919 255,365 950,336 178,814 293,547 715,462 236,283 106,071 41,941 22,628
Percent 100.0 100.0 100.0 100.0 100.0 100.0 100.0 100.0 100.0 100.0 100.0
None, no cooking 7.2 6.4 5.8 7.2 2.8 5.9 9.9 8.9 4.3 3.9 3.6
Wood 13.8 16.2 20.0 1.6 24.3 24.4 7.5 35.2 45.1 28.3 17.0
Gas 28.9 27.7 19.8 42.9 19.2 19.8 29.9 13.0 7.5 14.8 13.9
Electricity 0.8 1.0 0.3 1.0 0.3 0.8 0.9 0.3 0.3 0.2 0.6
Kerosene 0.7 0.7 0.7 1.2 0.7 0.7 0.5 0.3 0.4 0.4 0.9
Charcoal 47.9 47.6 52.9 45.6 52.1 47.9 50.8 41.6 41.3 45.2 63.5
Crop residue 0.2 0.1 0.2 0.1 0.2 0.2 0.1 0.3 0.4 6.8 0.2
Saw dust 0.2 0.2 0.1 0.3 0.2 0.1 0.2 0.4 0.3 0.1 0.2
Animal waste 0.1 0.1 0.1 0.1 0.0 0.0 0.1 0.0 0.0 0.0 0.0
Other 0.2 0.2 0.1 0.3 0.1 0.1 0.2 0.1 0.4 0.2 0.1
Type of cooking space
Total 3,049,366 248,919 255,365 950,336 178,814 293,547 715,462 236,283 106,071 41,941 22,628
Percent 100.0 100.0 100.0 100.0 100.0 100.0 100.0 100.0 100.0 100.0 100.0
No cooking space 8.4 7.8 7.2 8.5 4.2 7.1 10.9 10.0 5.2 5.0 4.5
Separate room for exclusive use of
household 28.2 35.4 24.8 30.6 33.1 32.3 24.0 22.4 19.5 30.2 19.4
Separate room shared with other
household(s) 7.7 8.7 6.8 2.8 2.9 10.0 14.5 10.9 2.9 3.2 2.2
Enclosure without roof 1.4 1.0 1.5 1.6 1.5 1.1 0.7 1.1 2.3 7.7 0.5
Structure with roof but without walls 2.8 2.5 4.1 1.2 10.1 4.8 1.6 4.4 1.6 0.6 0.5
Bedroom/Hall/Living room) 1.8 1.1 2.0 2.7 5.9 1.8 0.5 0.4 0.4 0.6 2.4
Verandah 29.5 29.5 28.5 29.7 15.5 29.2 34.8 26.0 23.7 30.3 46.0
Open space in compound 19.8 13.7 24.7 22.2 26.6 13.3 12.6 24.5 44.0 22.0 24.3
Other 0.4 0.4 0.5 0.5 0.3 0.4 0.3 0.4 0.3 0.2 0.2 Source: Ghana Statistical Service, 2010 Population and Housing Census
54
4.6 Employment and economic status
The 2010 PHC collected information on all employed persons 15 years and older about their
employment. These were classified into employment status, type of occupation engaged in,
the employment sector of engagement and the type of industry each person was working in.
To a large extent, a person’s employment status and the type of occupation he/she is engaged
in could have not only implications on the person’s income and general wellbeing but most
critically would inform relevant policy interventions. The analysis in this section, therefore,
looks at these four areas in presenting information that relate to the economic status of
persons who reported to be employed at the time of the 2010 PHC. Throughout the analysis,
the regions are compared to bring out relevant variations and similarities across the ten
regions in Ghana.
4.6.1 Employment status
Table 4.14 presents information on employment status of all urban residents by region and
sex. The results have interesting variations by sex and region of residence. The general
observation, however, is the dominance of employee and self-employed without employees
across all the regions in the country. At the national level, we find as high as 82 percent of the
urban dwellers reporting to be either employees or self-employed without employees. The
breakdown of this, however, is 28 percent and 54 percent respectively for the employees and
the self-employed without employees. Just a small proportion of about seven percent said
they were self-employed with employees. This means that in Ghana, even in the urban
localities, more of the employed persons do their own business as an individual without
engaging other employees.
Between the two sexes, there is apparently no variation except that among the males, the
difference between the proportion engaged as employees and others who were self-employed
without employees is quite low compared to that among the females. Thus, we find that
almost two-thirds of the females reported to be self-employed without employees compared
to 43 percent among the males. In contrast, almost 40 percent of the males compared to less
than 20 percent of the females were classified as employees. This means that while a higher
proportion of the males are likely to be employees, more of the females are employed as self-
employed without employees. Again, while males are more likely to be employed in the
formal sector, the informal sector appears to be the preserve for females in particular.
The regional comparisons do not deviate dramatically from that which is observed at the
national level. The proportion of males that were reported to be employees in each region is
far higher than that recorded among the females. In contrast, the proportion that reported to
be self-employed without employees in each region was higher among the females compared
to the males. It has to be noted that with respect to employees, Greater Accra reported the
highest proportion of its employed male urban population to be classified as such (48%) with
the least recorded in the Northern Region (23%). The same result is shown among the
females with Greater Accra still recording the highest proportion (24%) of employed persons
as employees and the Northern Region reporting the lowest (about 10%). Again, among the
male population, Volta Region recorded the highest proportion (56%) to be self-employed
without employees with the lowest in Greater Accra (35 percent). Similarly, among the
females, the highest proportion of self-employed without employees was recorded from the
Volta Region (about 73%) with Greater Accra still recording the lowest (60%), the other
regions falling between the two regions.

55
Table 4.14: Employed population 15 years and older in urban localities by sex, employment status and region
Employment status Total Western Central
Greater
Accra Volta Eastern Ashanti
Brong
Ahafo Northern
Upper
East
Upper
West
Both sexes 5,125,635 387,005 397,974 1,643,860 279,734 460,595 1,152,344 416,653 264,572 84,905 37,993
Percent 100.0 100.0 100.0 100.0 100.0 100.0 100.0 100.0 100.0 100.0 100.0
Employee 27.9 30.3 23.8 35.8 20.6 24.2 26.3 19.8 16.6 20.1 28.1
Self-employed without employee(s) 54.1 52.9 60.0 47.5 64.8 61.1 52.8 60.4 59.6 58.3 51.4
Self-employed with employee(s) 6.8 5.9 5.4 7.5 4.2 5.2 9.0 5.2 5.3 4.6 5.5
Casual worker 2.1 2.4 1.9 2.2 1.9 1.9 2.4 1.7 1.5 1.5 1.9
Contributing family worker 4.3 4.2 4.7 2.3 5.2 3.5 3.0 7.9 13.1 12.2 8.2
Apprentice 4.0 3.6 3.5 3.6 2.7 3.6 5.8 4.3 2.9 2.6 4.3
Domestic employee (Househelp) 0.6 0.5 0.5 0.9 0.5 0.4 0.5 0.5 0.7 0.6 0.5
Other 0.2 0.2 0.1 0.2 0.2 0.2 0.1 0.1 0.3 0.1 0.2
Male 2,477,284 188,089 181,438 812,902 129,874 213,923 560,631 197,327 134,109 40,588 18,403.0
Percent 100.0 100.0 100.0 100.0 100.0 100.0 100.0 100.0 100.0 100.0 100.0
Employee 38.6 44.3 36.0 48.2 29.2 34.6 35.7 27.8 23.4 27.1 37.5
Self-employed without employee(s) 42.9 39.0 46.8 34.6 55.9 50.3 41.6 53.7 54.9 52.6 44.2
Self-employed with employee(s) 7.9 6.6 6.8 8.4 5.0 6.0 10.7 5.9 5.9 5.1 6.2
Casual worker 2.9 3.6 2.9 3.1 2.7 2.7 3.1 2.4 1.4 1.9 2.5
Contributing family worker 3.1 2.7 3.5 1.4 4.4 2.6 2.0 6.2 10.6 10.2 5.9
Apprentice 3.9 3.1 3.4 3.4 2.3 3.3 6.3 3.3 3.0 2.4 3.0
Domestic employee (Househelp) 0.5 0.5 0.5 0.7 0.4 0.4 0.5 0.5 0.7 0.5 0.6
Other 0.2 0.2 0.2 0.2 0.2 0.2 0.2 0.2 0.3 0.2 0.2
Female 2,648,351 198,916 216,536 830,958 149,860 246,672 591,713 219,326 130,463 44,317 19,590
Percent 100.0 100.0 100.0 100.0 100.0 100.0 100.0 100.0 100.0 100.0 100.0
Employee 17.8 17.2 13.6 23.7 13.2 15.2 17.5 12.6 9.5 13.7 19.2
Self-employed without employee(s) 64.6 66.0 71.1 60.1 72.5 70.4 63.3 66.4 64.5 63.5 58.1
Self-employed with employee(s) 5.8 5.2 4.3 6.6 3.5 4.5 7.4 4.6 4.7 4.2 4.8
Casual worker 1.4 1.3 1.1 1.4 1.3 1.2 1.7 1.0 1.6 1.0 1.3
Contributing family worker 5.4 5.7 5.7 3.2 5.9 4.3 3.9 9.5 15.7 14.1 10.4
Apprentice 4.2 4.0 3.6 3.7 3.0 3.8 5.5 5.2 2.8 2.7 5.6
Domestic employee (Househelp) 0.7 0.6 0.5 1.1 0.5 0.5 0.6 0.6 0.8 0.6 0.4
Other 0.1 0.1 0.1 0.1 0.1 0.1 0.1 0.1 0.3 0.1 0.1 Source: Ghana Statistical Service, 2010 Population and Housing Census

56
4.6.2 Occupational status
Table 4.15 presents the results of the analysis by sex, occupation and region of residence
among all urban employed population 15 years and older. From the results, three
occupational groups stand out. These are service and sales workers (32%); craft and related
trades workers (20%) and skilled agricultural forestry and fishery workers (14%). These three
form two-thirds of all occupational groups in the country. Interestingly, these are occupations
that require little or no education. This pattern is quite to be expected because in the urban
areas, agriculture for example, is not a dominant economic activity as one would see in the
rural areas in the country. The other occupations that require high level of education and
training including managerial and professional ones recorded smaller proportions below 10
percent.
There is not much difference between males and females. However, the composition of each
of the three major occupational groups changes between males and females. From the table,
the highest proportion of the male population recorded to be in craft and related trades is
much higher compared to that for the females (25% versus 16%). A similar result is seen with
respect to skilled agricultural forestry and fishery which recorded a relatively higher
proportion of the male population compared to their female counterparts. In contrast,
however, we find as high as 47 percent of the female population indicating to be engaged in
service and sales occupation relative to as low as 17 percent of their male counterparts.
It is also important to underscore the point that among the males in particular, the proportion
that said they worked as plant and machine operators and assemblers was quite appreciable
and stood at 18 percent in the Western Region as the highest, followed by the Greater Accra
and Ashanti regions each of which had 14 percent. On the other hand, the three northern
regions reported the lowest proportions of plant and machine operators and assemblers (less
than 10% in each of the three regions) compared to the other regions where more than 10
percent of their male employed population were in this occupation. This is a reflection of the
spatial differences in development between the south and the north.
The results for the regions are consistent with the national pattern with some variations
regarding the proportions in each of the three dominant occupations between the males and
females. What is quite clear, however, is that the two most urbanised regions, i.e., Greater
Accra and Ashanti recorded the highest proportion of their employed persons to be engaged
in the service and sales occupation among either males or females in comparison with the
other regions. At the same time, both regions recorded the lowest proportion of skilled
agricultural forestry and fishery workers compared to their counterparts in the other eight
regions in the country.

57
Table 4.15: Employed population 15 years and older in urban localities by sex, occupation and region
Occupation Total Western Central
Greater
Accra Volta Eastern Ashanti
Brong
Ahafo Northern
Upper
East
Upper
West
Both sexes 5,125,635 387,005 397,974 1,643,860 279,734 460,595 1,152,344 416,653 264,572 84,905 37,993
Percent 100 100 100 100 100 100 100 100 100 100 100
Managers 4 3 3 5 3 3 4 2 2 2 3
Professionals 8 7 8 8 8 9 8 7 7 8 11
Technicians and associate
professionals 3 3 2 4 2 3 2 2 2 2 3
Clerical support workers 2 3 2 3 2 2 2 2 1 2 3
Service and sales workers 32 29 29 37 29 29 36 24 25 25 27
Skilled agricultural forestry and
fishery workers 14 16 19 2 22 20 8 37 37 32 20
Craft and related trades workers 20 20 24 21 22 20 22 15 17 17 21
Plant and machine operators and
assemblers 7 10 5 7 5 7 7 6 3 4 4
Elementary occupations 9 9 7 11 6 8 10 5 6 7 7
Other occupations 0 1 0 1 0 0 0 0 0 0 0
Male 2,477,284 188,089 181,438 812,902 129,874 213,923 560,631 197,327 134,109 40,588 18,403
Percent 100 100 100 100 100 100 100 100 100 100 100
Managers 4 4 3 6 3 3 4 3 2 3 4
Professionals 10 9 10 10 11 11 10 9 10 10 14
Technicians and associate
professionals 5 5 4 6 4 4 4 3 3 4 5
Clerical support workers 3 3 2 3 3 2 3 2 1 3 3
Service and sales workers 17 14 14 21 12 13 19 11 12 15 16
Skilled agricultural forestry and
fishery workers 16 18 26 4 28 25 9 39 44 35 23
Craft and related trades workers 25 22 24 27 24 22 31 17 17 17 20
Plant and machine operators and
assemblers 13 18 11 14 11 15 14 11 6 7 8
Elementary occupations 6 6 5 8 5 6 6 5 5 7 8
Other occupations 1 1 0 1 0 0 0 0 0 0 0
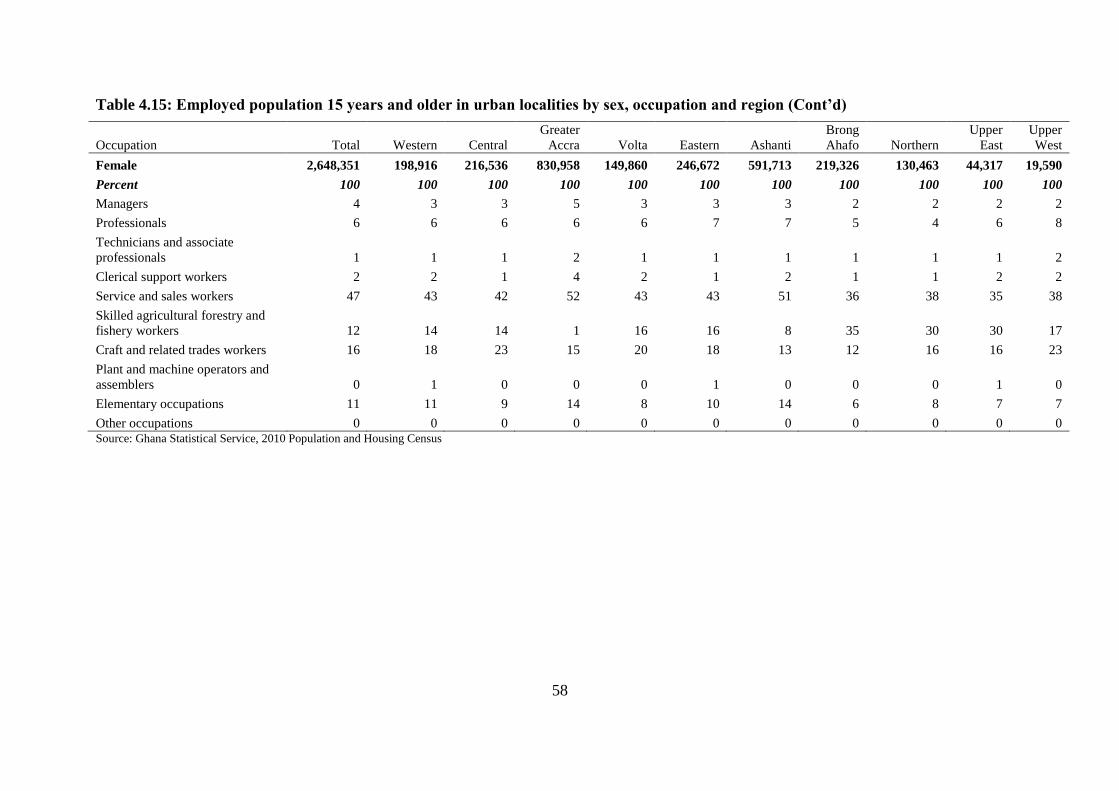
58
Table 4.15: Employed population 15 years and older in urban localities by sex, occupation and region (Cont’d)
Occupation Total Western Central
Greater
Accra Volta Eastern Ashanti
Brong
Ahafo Northern
Upper
East
Upper
West
Female 2,648,351 198,916 216,536 830,958 149,860 246,672 591,713 219,326 130,463 44,317 19,590
Percent 100 100 100 100 100 100 100 100 100 100 100
Managers 4 3 3 5 3 3 3 2 2 2 2
Professionals 6 6 6 6 6 7 7 5 4 6 8
Technicians and associate
professionals 1 1 1 2 1 1 1 1 1 1 2
Clerical support workers 2 2 1 4 2 1 2 1 1 2 2
Service and sales workers 47 43 42 52 43 43 51 36 38 35 38
Skilled agricultural forestry and
fishery workers 12 14 14 1 16 16 8 35 30 30 17
Craft and related trades workers 16 18 23 15 20 18 13 12 16 16 23
Plant and machine operators and
assemblers 0 1 0 0 0 1 0 0 0 1 0
Elementary occupations 11 11 9 14 8 10 14 6 8 7 7
Other occupations 0 0 0 0 0 0 0 0 0 0 0 Source: Ghana Statistical Service, 2010 Population and Housing Census
59
4.6.3 Employment sector
The sector of employment urban dwellers were engaged in during the 2010 PHC is presented
in Table 4.16. According to the results shown in the table, the informal private sector is the
major employer of urban dwellers in Ghana. This is evidenced by the huge proportion of
almost 80 percent that were recorded to be working within this sector in 2010. Eleven
percent of people 15 years and older were engaged in the private formal sector while a little
less than one in 10 was in the public or government sector of employment. Quite clearly,
therefore, government is the least employer of the population in the urban areas in Ghana.
This could be much less in the rural areas considering that public sector workers are more
likely to be in the urban areas which house most of government ministries, departments and
agencies.
A similar pattern is shown among males and females but with different proportions. For
example, a much higher proportion of the female employees were recorded to work within
the private informal sector compared with the males (86% versus 71%). In contrast, higher
proportions of the males than females were reported for both public and private informal
sectors of employment in the urban areas. In either of the public or private formal sector,
more than 10 percent of the males compared to just about seven percent of the females were
enrolled. The variation no doubt could be related to differences in education between the
males and females in Ghana. This is because, both the public and private formal sectors of
employment depend largely on educational qualification but unfortunately many females than
males have lower levels of education. Consequently, these two sectors are more likely to be
dominated by males relative to females. Again, in the urban localities in Ghana, a lot of
private informal activities go on including buying and selling which require little or no
education and are dominated by women.
According to the results by region, private informal sector employment dominates in all the
10 regions and varies from a high of about 86 percent and 84 percent respectively in Northern
and Brong Ahafo regions to a low of 72 percent and 74 percent in Greater Accra and Upper
West regions. On the other hand, the proportion of the population employed in the private
formal sector was highest in Greater Accra (18%) and lowest in Northern Region. It is also
noted that the remaining regions recorded less than 10 percent of their urban population to be
employed in the private formal sector with the exception of Western and Ashanti regions
which recorded about 13 percent and 10 percent respectively. In contrast, Upper West
reported the highest proportion of their urban population to be employed in the public sector.
Almost one in five of persons 15 years and older in the Upper West Region was a public
sector worker. The region that was closest to Upper West in this regard was Upper East with
13 percent of its urban population as public sector employees while Greater Accra recorded
the least proportion of eight percent.
Once again, the comparison by sex at the regional level does not reveal too dramatically
varied results except in few instances. Generally, the proportion of males in the public and
private formal sector employment is relatively higher for males in all regions compared to
females. With respect to public sector employment, Upper West recorded the highest
proportion (25.4%) of its urban population to be employed within the sector either among the
males or females (14.1%). However, the lowest proportion recorded in this sector was in
Ashanti Region among the males (10.1%) and in both Greater Accra and Northern regions
among the females (6.1%).

60
Table 4.16: Employed 15 years and older in urban localities by sex, employment sector and region
Employment sector
All
Regions Western Central
Greater
Accra Volta Eastern Ashanti
Brong
Ahafo Northern
Upper
East
Upper
West
Both sexes 5,125,635 387,005 397,974 1,643,860 279,734 460,595 1,152,344 416,653 264,572 84,905 37,993
Percent 100.0 100.0 100.0 100.0 100.0 100.0 100.0 100.0 100.0 100.0 100.0
Public (Government) 9.4 11.0 9.1 8.3 11.6 11.5 8.4 9.2 10.5 13.2 19.6
Private Formal 11.2 12.6 7.2 17.8 5.2 7.3 10.0 6.1 3.3 3.6 5.2
Private Informal 78.5 75.3 83.2 72.5 82.4 80.6 80.7 84.1 85.5 82.4 74.1
Semi-Public/Parastatal 0.2 0.3 0.1 0.2 0.2 0.4 0.2 0.2 0.1 0.2 0.3
NGOs (Local and International) 0.7 0.8 0.4 1.0 0.5 0.2 0.7 0.3 0.6 0.7 0.7
Other International Organisations 0.1 0.0 0.0 0.2 0.0 0.0 0.0 0.0 0.1 0.0 0.1
Male 2,477,284.0 188,089.0 181,438.0 812,902.0 129,874.0 213,923.0 560,631.0 197,327.0 134,109.0 40,588.0 18,403.0
Percent 100.0 100.0 100.0 100.0 100.0 100.0 100.0 100.0 100.0 100.0 100.0
Public (Government) 12.1 14.7 12.4 10.4 15.5 15.2 10.1 12.0 14.7 17.4 25.4
Private Formal 16.0 19.4 10.7 24.7 7.6 10.7 14.1 9.0 4.6 4.9 6.8
Private Informal 70.5 64.2 76.2 62.9 75.9 73.1 74.4 78.3 79.7 76.7 66.3
Semi-Public/Parastatal 0.3 0.5 0.2 0.2 0.3 0.7 0.3 0.3 0.2 0.2 0.4
NGOs (Local and International) 1.0 1.2 0.5 1.5 0.8 0.3 1.1 0.4 0.7 0.8 0.9
Other International Organisations 0.1 0.1 0.1 0.2 0.0 0.1 0.0 0.0 0.1 0.0 0.1
Female 2,648,351.0 198,916.0 216,536.0 830,958.0 149,860.0 246,672.0 591,713.0 219,326.0 130,463.0 44,317.0 19,590.0
Percent 100.0 100.0 100.0 100.0 100.0 100.0 100.0 100.0 100.0 100.0 100.0
Public (Government) 6.9 7.5 6.4 6.1 8.3 8.2 6.9 6.7 6.1 9.3 14.1
Private Formal 6.7 6.2 4.3 11.1 3.2 4.3 6.0 3.4 2.0 2.4 3.7
Private Informal 85.9 85.8 89.0 82.0 88.1 87.1 86.7 89.4 91.4 87.6 81.4
Semi-Public/Parastatal 0.1 0.1 0.1 0.1 0.1 0.2 0.1 0.2 0.1 0.1 0.2
NGOs (Local and International) 0.4 0.4 0.3 0.6 0.3 0.2 0.3 0.3 0.4 0.6 0.5
Other International Organisations 0.0 0.0 0.0 0.1 0.0 0.0 0.0 0.0 0.0 0.0 0.1 Source: Ghana Statistical Service, 2010 Population and Housing Census

61
Furthermore, Greater Accra recorded the highest proportion of private formal sector workers
among males (24.7%) and among the females (11.1%) with Northern Region recording the
lowest proportion among males (4.6%) and females (2.0%). In the case of the private
informal sector, the results indicate that Northern Region ranked first as the region with
highest proportion of employees among the males (79.7%) and females (91.4%). In contrast,
Greater Accra had the lowest proportion of its urban population working within the private
informal sector either as males (62.9%) or females (82.0%).
4.6.4 Type of economic activity
In the census, information on the type of economic activity engaged in by people is collected
on the type of industry of employment among persons of age 15 years and older. This is
presented in tables 4.17a, b and c respectively for both sexes put together, and males and
females separately each of which is by region of residence during the 2010 PHC. These three
tables are used for the analysis of type of economic activity among the population 15 years
and older in all urban localities in Ghana by region and sex.
The results for both sexes as presented in Table 4.17a indicate the importance of wholesale
and retail/repair of motor vehicle and motorcycles as an economic activity in urban Ghana.
This is evidenced by the fact that it engaged 29 percent of the urban population 15 years and
older in Ghana and ranked the highest in proportion relative to all other economic activities in
the urban areas in the country. This was followed by agriculture forestry and fishing with
about 15 percent of the employed urban population in Ghana while manufacturing recorded
about 14 percent. Other popular economic activities but which recorded much smaller
proportions of the urban employed persons included accommodation and food service
(7.9%); other service activities (6.9%); education (5.6%) and construction (4.5%). These are
to be expected on account of the largely commercial and service economy the urban
environment presents in Ghana. It is, however, noteworthy to observe that for 14 percent of
employed persons in urban localities to be engaged in manufacturing appears to be on the low
side for a middle income economy like Ghana.
The regional distributions appear to follow a similar pattern where the economic activities
that offer higher employment to the urban dwellers are the same in almost all the regions with
variations relative to the size of each activity in the regions. For example, wholesale and
retail/repair of motor vehicles and motorcycles attracted the highest proportions of employees
in urban localities in Ashanti (34.8%) and Greater Accra (32.6%) regions while the lowest
was recorded in Brong Ahafo Region (19.8%). On the other hand, the proportion of
employed persons in manufacturing ranged from a high of 16 percent in Volta Region to a
low of almost 10 percent in Brong Ahafo Region. We also find that Brong Ahafo and
Northern regions ranked topmost in terms of the proportion of employed persons in
agriculture forestry and fishing each with almost 38 percent compared to Greater Accra’s
three percent. This is quite to be expected since Greater Accra is the most urbanised in the
country in addition to hosting the nation’s capital city, a situation that is likely to limit these
primary economic activities in the region. For the other economic activities, there are no
remarkable variations between the regions except in a few instances as shown in Table 4.17a.
A comparison between the males (Table 4.17b) and females (Table 4.17c) reveals interesting
variations that appear to be dictated by economic activities considered to be masculine or
feminine. At the national level, for example, the proportion of females in Table 4.17b
working in manufacturing; wholesale and retail and repair of motor vehicles and motorcycles;
other service activities as well as accommodation and food service is relatively higher
62
compared to the males in Table 4.17c. This is the case in all the regions for these major
economic activities when the males are compared with the females. The only exception is
recorded in the Ashanti Region for manufacturing where contrary to the situation in all the
other regions, a relatively lower proportion of the females than the males in that region were
recorded (13.9% versus 12.5%). Again, with respect to other service activities, the Northern
and Upper East regions appear to deviate from what pertains in the other regions. While the
males and females in the Northern Region recorded the same proportion of 3.2 percent in
other service activities, in the Upper East, females recorded a relatively lower proportion
(4.8%) compared to their male counterparts (5.1%).
In contrast, agriculture forestry and fishing; construction; and transport and storage are three
economic activities that appear to attract relatively higher proportions of the male population
compared to the females. This observation is consistent in all the ten regions in the country.
For example, among the male population, the proportion working in construction varies from
a low of 4.4 percent in Northern Region to a high of 10.9 percent in Greater Accra. This
compares with less than one percent each of the regions among the females. A similar
observation can be made with regard to the proportion of the population working in
transportation and storage economic activity which ranges once again from a high of 12.1
percent in Greater Accra Region to a low of 5.1 percent in Northern Region among the males
(Table 4.17b) compared to less than one percent in each of the other regions among the
females (Table 4.17c). This is to be expected because these are activities which traditionally
in Ghana are dominated by males. Finally, not much significant variation is seen between the
two sexes regarding education as economic activity although in almost all the regions with
the exception of Western and Greater Accra, a relatively higher proportion of males than
females are found to be engaged in this area of economic activity in urban Ghana.

63
Table 4.17a: Employed population 15 years and older in urban localities by industry and region
Industry Total Western Central
Greater
Accra Volta Eastern Ashanti
Brong
Ahafo Northern
Upper
East
Upper
West
Number 5,125,635 387,005 397,974 1,643,860 279,734 460,595 1,152,344 416,653 264,572 84,905 37,993
Percent 100.0 100.0 100.0 100.0 100.0 100.0 100.0 100.0 100.0 100.0 100.0
Agriculture forestry and fishing 14.7 16.6 20.0 3.2 22.2 21.0 9.0 37.9 37.6 32.5 20.7
Mining and quarrying 0.9 3.8 0.7 0.4 0.2 1.4 1.0 1.0 0.1 0.6 0.2
Manufacturing 13.7 15.4 15.8 14.9 16.1 12.3 13.2 9.6 10.9 11.4 15.1
Electricity gas stream and air conditioning
supply 0.3 0.4 0.2 0.3 0.2 0.5 0.2 0.1 0.1 0.2 0.3
Water supply; sewerage waste management and
remediation activities 0.4 0.5 0.3 0.4 0.5 0.3 0.3 0.3 0.2 0.4 0.5
Construction 4.5 3.9 4.7 5.6 3.8 3.9 4.6 3.0 2.3 2.8 4.2
Wholesale and retail; repair of motor vehicles
and motorcycles 29.0 24.8 25.2 32.6 24.2 25.3 34.8 19.8 23.1 22.0 21.4
Transportation and storage 5.3 5.9 4.4 6.4 4.5 4.9 5.7 3.7 2.7 2.9 3.6
Accommodation and food service activities 7.9 8.1 8.4 9.2 6.7 7.5 7.7 5.4 6.1 6.1 5.6
Information and communication 0.7 0.5 0.4 1.3 0.3 0.4 0.5 0.3 0.2 0.3 0.5
Financial and insurance activities 1.2 1.1 0.8 1.9 0.8 0.8 1.2 0.8 0.4 0.7 0.8
Real estate activities 0.1 0.0 0.0 0.2 0.0 0.0 0.0 0.0 0.0 0.0 0.0
Professional scientific and technical activities 1.5 0.9 1.4 2.0 0.9 2.3 1.2 0.8 1.3 0.9 1.3
Administrative and support service activities 1.0 1.0 0.8 1.6 0.6 0.9 0.8 0.6 0.8 0.6 0.9
Public administration and defence; compulsory
social security 2.5 3.2 1.8 3.2 2.8 2.0 1.8 2.1 1.8 3.4 4.9
Education 5.6 5.3 6.4 4.3 6.4 6.7 6.2 5.6 6.2 6.3 9.4
Human health and social work activities 1.9 1.6 1.6 1.9 2.3 2.2 1.9 1.7 1.6 2.8 3.5
Arts entertainment and recreation 0.9 0.7 0.7 1.3 0.8 0.7 0.9 0.5 0.4 0.4 0.6
Other service activities 6.9 5.6 5.7 7.9 6.0 6.0 8.3 5.9 3.2 4.9 5.3
Activities of households as employers;
undifferentiated goods - and services - producing
activities of households for own use 0.9 0.5 0.8 1.3 0.6 0.9 0.7 0.8 0.9 0.7 1.1
Activities of extraterritorial organizations and
bodies 0.1 0.0 0.0 0.1 0.0 0.0 0.0 0.0 0.0 0.0 0.0 Source: Ghana Statistical Service, 2010 Population and Housing Census

64
Table 4.17b: Employed male population 15 years and older in urban localities by sex, industry and region
Industry Total Western Central
Greater
Accra Volta Eastern Ashanti
Brong
Ahafo Northern
Upper
East
Upper
West
Number 2,477,284 188,089 181,438 812,902 129,874 213,923 560,631 197,327 134,109 40,588 18,403
Percent 100.0 100.0 100.0 100.0 100.0 100.0 100.0 100.0 100.0 100.0 100.0
Agriculture forestry and fishing 17.4 19.6 27.1 4.5 29.0 26.3 9.9 41.0 44.4 35.1 23.5
Mining and quarrying 1.6 6.6 1.3 0.5 0.2 2.7 2.0 1.9 0.1 1.0 0.3
Manufacturing 12.6 13.0 11.1 14.4 13.0 10.7 13.9 8.2 8.8 8.0 9.4
Electricity gas stream and air conditioning supply 0.4 0.6 0.3 0.5 0.4 0.9 0.3 0.3 0.2 0.3 0.6
Water supply; sewerage waste management and
remediation activities 0.4 0.6 0.4 0.5 0.6 0.5 0.3 0.3 0.3 0.5 0.6
Construction 9.0 7.9 10.0 10.9 8.0 8.3 9.2 6.2 4.4 5.7 8.2
Wholesale and retail; repair of motor vehicles and
motorcycles 20.1 15.3 14.6 24.1 12.6 13.5 26.5 12.4 14.4 16.2 16.2
Transportation and storage 10.4 11.4 9.3 12.1 9.3 10.2 11.2 7.5 5.1 5.7 7.1
Accommodation and food service activities 2.0 2.1 2.0 2.8 1.4 1.6 1.9 1.3 1.0 1.3 1.2
Information and communication 1.1 0.8 0.8 2.0 0.6 0.6 0.8 0.5 0.4 0.5 0.8
Financial and insurance activities 1.5 1.4 1.1 2.3 1.3 1.1 1.3 1.0 0.6 1.0 1.2
Real estate activities 0.1 0.0 0.1 0.3 0.0 0.0 0.1 0.0 0.0 0.0 0.0
Professional scientific and technical activities 2.0 1.4 1.6 2.8 1.1 2.4 1.7 0.9 1.3 1.2 1.4
Administrative and support service activities 1.7 1.7 1.3 2.6 0.9 1.5 1.3 0.9 1.2 1.0 1.2
Public administration and defence; compulsory social
security 3.7 5.0 2.9 4.5 4.4 3.2 2.6 3.1 2.8 5.2 7.5
Education 6.2 5.2 7.9 4.0 8.0 7.8 6.8 7.0 8.7 7.9 11.5
Human health and social work activities 1.7 1.3 1.5 1.6 2.2 2.1 1.5 1.7 1.8 2.8 3.1
Arts entertainment and recreation 1.7 1.3 1.5 2.3 1.5 1.3 1.7 1.0 0.6 0.8 1.0
Other service activities 5.4 4.2 4.7 6.1 4.9 4.6 6.5 4.0 3.2 5.1 4.2
Activities of households as employers;
undifferentiated goods - and services - producing
activities of households for own use 0.8 0.5 0.6 1.1 0.6 0.8 0.7 0.7 0.7 0.7 1.0
Activities of extraterritorial organizations and bodies 0.1 0.0 0.0 0.2 0.0 0.0 0.0 0.0 0.0 0.0 0.1 Source: Ghana Statistical Service, 2010 Population and Housing Census

65
Table 4.17c: Employed female population 15 years and older in urban localities by sex, industry and region
Industry Total Western Central
Greater
Accra Volta Eastern Ashanti
Brong
Ahafo Northern
Upper
East
Upper
West
Number 2,648,351 198,916 216,536 830,958 149,860 246,672 591,713 219,326 130,463 44,317 19,590
Percent 100.0 100.0 100.0 100.0 100.0 100.0 100.0 100.0 100.0 100.0 100.0
Agriculture forestry and fishing 12.1 13.8 14.0 1.9 16.4 16.4 8.2 35.1 30.7 30.2 18.2
Mining and quarrying 0.3 1.1 0.2 0.2 0.1 0.3 0.1 0.2 0.0 0.3 0.0
Manufacturing 14.8 17.7 19.7 15.4 18.9 13.6 12.5 10.8 13.1 14.6 20.4
Electricity gas stream and air conditioning
supply 0.1 0.1 0.1 0.1 0.1 0.1 0.1 0.0 0.0 0.0 0.0
Water supply; sewerage waste management and
remediation activities 0.3 0.5 0.3 0.3 0.4 0.2 0.3 0.2 0.2 0.2 0.4
Construction 0.2 0.2 0.2 0.3 0.2 0.2 0.3 0.1 0.2 0.2 0.4
Wholesale and retail; repair of motor vehicles
and motorcycles 37.3 33.8 34.0 40.9 34.2 35.4 42.7 26.4 32.1 27.2 26.2
Transportation and storage 0.6 0.7 0.3 0.9 0.3 0.4 0.4 0.3 0.3 0.3 0.4
Accommodation and food service activities 13.3 13.9 13.7 15.4 11.3 12.6 13.2 9.2 11.3 10.5 9.8
Information and communication 0.4 0.2 0.2 0.7 0.2 0.2 0.2 0.2 0.1 0.1 0.2
Financial and insurance activities 0.9 0.9 0.5 1.5 0.4 0.5 1.0 0.6 0.2 0.4 0.5
Real estate activities 0.0 0.0 0.0 0.1 0.0 0.0 0.0 0.0 0.0 0.0 0.0
Professional scientific and technical activities 1.1 0.5 1.2 1.2 0.6 2.2 0.7 0.7 1.3 0.6 1.2
Administrative and support service activities 0.4 0.3 0.4 0.6 0.3 0.4 0.3 0.4 0.4 0.2 0.7
Public administration and defence; compulsory
social security 1.4 1.5 0.9 1.9 1.4 1.0 1.0 1.2 0.8 1.8 2.5
Education 5.0 5.3 5.2 4.6 5.1 5.8 5.6 4.4 3.7 4.9 7.4
Human health and social work activities 2.1 1.8 1.8 2.1 2.4 2.2 2.2 1.7 1.5 2.8 4.0
Arts entertainment and recreation 0.2 0.2 0.1 0.4 0.2 0.2 0.2 0.1 0.1 0.1 0.2
Other service activities 8.3 6.9 6.5 9.7 7.0 7.3 10.1 7.5 3.2 4.8 6.4
Activities of households as employers;
undifferentiated goods - and services - producing
activities of households for own use 1.0 0.5 0.9 1.5 0.6 0.9 0.7 0.9 1.1 0.7 1.3
Activities of extraterritorial organizations and
bodies 0.0 0.0 0.0 0.1 0.0 0.0 0.0 0.0 0.0 0.0 0.0 Source: Ghana Statistical Service, 2010 Population and Housing Census

66
4.7 Conclusion
This chapter sought among other things, to examine the household conditions and
characteristics of the urban population in Ghana, with a comparison among the sexes as well
as the regions. The analysis cut across issues of literacy and education, marital status,
religion, housing conditions and facilities in addition to household energy usage and
employment status and sectors of employment among the urban population.
It has been found that males in urban Ghana were more literate than females and this is
consistent with the general observation of a higher education among males than females in
Ghana. Literacy in English only was, however, found to be higher among females than males
and also higher in the three northern regions compared to those in the south. It was clear from
the analysis presented that literacy was highest in Greater Accra and lowest in Northern
Region. Unfortunately, in spite of Ghana’s border with three French-speaking countries,
literacy in French was found to be very low, indicating the inadequate investment we make as
a country in French as an important language in Ghana.
Linked to literacy, it has been observed that in all regions in the country, males were found to
have relatively higher education than females with the three northern regions being the most
disadvantaged. It was also found that most people do not go beyond the secondary school
level of education in the country. However, beyond secondary level of education, Upper West
was found to be second to Greater Accra to have the highest proportion of its urban dwelling
population with post-secondary level education. On the other hand, the gap between males
and females in terms of education was much wider in the Northern Region especially with
respect to persons with no education. This shows that although some remarkable
achievements in education have been made in the country over the years, much remains to be
done in bridging the gap between males and females.
We have found that half of the population 12 years and older in urban localities in Ghana
were ever married with almost five percent of them in informal or consensual unions. There
were less than 40 percent of the female population that reported to be never married
compared to more than the same proportion of their male counterparts. The variations
between the sexes where a higher proportion of the female population was married relative to
males is the result of the impact of polygyny which allows one man to be married to more
than one woman at the same time, a practice which was found to be more prevalent in the
three northern regions in the country. Again, the finding that the proportion of the population
that was separated, divorced or widowed was higher in all regions among the females than
males point to a higher re-marriage rate for males than females in Ghana.
The dominance of the Christian Religion was found in all Ghana’s urban localities with three
in every four persons professing to be Christian. The Pentecostal/Charismatic Religion was
the largest Christian Religion in Ghana’s urban localities. The Islamic Religion is more
dominant in the three northern regions. In all the regions with the exception of Upper West, a
higher proportion of the females were found to be Christians compared to males. In contrast,
a higher proportion of the male population than females was reported to profess the Islamic
Religion.
With respect to housing, there is dominance of compound houses where three of four
households were reported to be in compound houses in all urban localities in Ghana. Three
percent of households in urban Ghana were also housed in kiosks and containers with two
percent in uncompleted buildings. There were no serious variations by region but Greater
67
Accra and Ashanti regions were leading in the proportion of households housed in kiosks and
containers, obviously the result of slum growth and the high cost of accommodation that are
the hull-marks of the two regions as the most urbanised in the country.
An examination of the material used in the construction of the outer wall of dwelling units in
urban localities in Ghana showed a dominance of concrete and cement blocks. However, less
than half of the dwelling units in Northern and Upper East regions used cement blocks and
concrete. Instead, the use of mud brick or earth for the outer wall or floor was more common
in the three northern regions. This suggests that materials used in the construction of dwelling
units in the north are of lower quality than others in the other regions, either due to
differences in poverty or traditional building practices that have been adopted over the years.
There also appears to be some overcrowding at the household level considering that as high
as 76 percent of the urban households had one or two rooms for sleeping, a situation which is
indicative of the inability of many urban dwelling households to rent or acquire bigger
apartments for use as their dwelling units perhaps on account of the high cost of rental
accommodation in the urban localities in the country.
There is no universal access to pipe-borne water facility for drinking in all urban localities in
Ghana. The analysis suggests two-thirds accessibility to piped water facility either within or
outside the household dwelling unit in urban localities in the country. The three northern
regions are still lagging behind the other regions in the country. The common use of sachet
water as source of drinking water by some 14 percent of urban households is an indication of
the challenges many urban households face in accessing treated piped water for drinking
purposes.
It has also been seen that only a quarter of urban households in the country used their own
separate bathrooms, the remaining three-quarters sharing bathroom with other households,
patronising public bathrooms or using open spaces outside the house with negative sanitation
implications for the urban environment. Similarly, just one in four of the urban households
reported access to water closet (WC) toilet facilities at the household level with one in ten
households not having any kind of toilet facility and, therefore, made use of the bush or
beaches. This practice has obvious negative health implications for the urban population
especially children.
Furthermore, solid waste collection is not universal in urban Ghana for only one-fifth of the
urban households reported the collection of their solid waste with the rest dumping them at
designated public dumps/containers to be collected while others use open spaces for their
solid waste disposal. Besides, liquid waste disposal into gutters is quite common in the
country while there is limited use of the sewerage system (less than 5%), an indication of the
undeveloped sewerage system in most urban localities in the country. Consequently, the
practice of throwing liquid waste unto the street or outside the house is quite common
particularly in the three northern regions where more than half of the households were
involved in this practice.
Urban household energy use showed that although access to electricity for lighting was on
average 80 percent, it varied across the regions with some of the households using flashlights
and torches. The use of LPG for household cooking is also limited with less than a third of
urban households making use of this source of fuel. The consequence of this finding was that
dependence on charcoal and wood as household cooking fuel was very high and has long-
term implications for the country’s forest resources which in turn could also have effects on
the ecosystem in general in the country. Again, not all the urban households reported to have

68
separate spaces for cooking and thereby used the veranda or open spaces in the house for this
purpose. Depending on the control measures put in place, cooking anywhere in the house
could have serious implications for fire out-breaks with a consequence for lives and property.
Finally, it has been noted in the analysis that the private informal sector is the highest
employer of the active labour force in Ghana in all the regions in the country. The public
sector does not engage more than 10 percent of the urban employed population and also
employs a higher proportion of males relative to females on account of educational
differences between males and females, the latter being more disadvantaged. This means that
the private sector should be supported to expand to be able to employ more persons eligible
for employment as a way of limiting or reducing unemployment. Added to this is the finding
that limited proportions of the employed persons in urban localities were engaged in
manufacturing with high proportions going into the wholesale and retail trading activities
with regional variations. Policy actions should, therefore, take into consideration the regional
and sex differentials in urban household socio-economic conditions and facilities that have
been revealed in this analysis.
69
CHAPTER FIVE
ANALYSIS OF INFORMATION COMMUNICATION
FACILITIES IN URBAN AREAS AND URBAN PLANNING
5.1 Introduction
There is no doubt that Information and Communication Technologies (ICT) are a catalyst for
sustainable development in the 21st century. According to a World Bank/African
Development Bank/African Union report, ICTs, especially mobile phones have
revolutionised communications in Africa. The report points out that in 2012, there were more
than 650 million mobile subscriptions in Africa, more than in the US or in the Europe Union,
making Africa the fastest growing region in the world.
In Ghana, the ICT industry has made and continues to make significant impacts impact on the
Ghanaian society. Investments have been made by both the public and private sectors in the
ICT industry. Recognising the crucial role of ICT in facilitating and accelerating socio-
economic development, government has put in place relevant policies, strategies and
institutional frameworks to enable the economy to be transformed into information and
knowledge-based economy. This emerging economy is expected to create opportunities and
expand access to ICT across all sectors and serve as a means of rapid economic growth, job
creation and wealth generation, good governance among others.
Some of the legislations and policies which the Government of Ghana has put in place
include the National Communications Act (Act 769, 2008) which established the National
Communications Authority as a central body to license and regulate communication activities
and services. Others are the Electronic Communications Act of Ghana (Act 775, 2008), the
Ghana ICT for Accelerated Development (ICT4AD) Policy (2003) which was developed to
simultaneously target the development of the ICT sector and industry, as well as the use of
ICT as a broad-based enabler of development and the Ghana National Telecommunications
Policy of 2004.
For the first time, the 2010 PHC collected data on ownership of and access to ICT among
individuals and households. Information was sought about households which owned a
desktop or laptop computer. In addition, data were collected on ownership of mobile phones
among all household members aged 12 years and above. In addition, the 2010 PHC collected
information on ownership of fixed telephone lines at the household level in the country. It
further sought information on the use of the internet by individuals 12 years and older. These
data form the basis for analysis of developments in the ICT sector among all urban localities
in Ghana.
5.2 Use of the internet
As illustrated in Figure 5.1, while the urban localities in Ghana account for 50.9 percent of
Ghana’s population, only 12.7 percent of the urban population aged 12 years and older
reported using the internet. Similarly, the proportion of urban households with ownership of
computers across the regions was low. The Greater Accra Region reported the highest
proportion of its population using internet facilities (19.4 %). Ashanti (12.8%), Western
(11.9%) and Central (11.0%) regions followed closely whilst Upper East (5.9%), Brong

70
Ahafo (5.8%) and Northern (4.8%) recorded the lowest proportions. Females in all regions
reported substantially lower proportions of their population accessing the internet compared
to their male counterparts. Generally, in most regions, the ratio of internet use between the
sexes was one female to every two males. In the Greater Accra Region, however, the
variation between the sexes was wider with one female to five males who reportedly used the
internet. In contrast, it was three males to one female in the Northern and Upper West
regions. The widest gap in the use of internet facilities by sex was reported in the Volta
Region where about five percent of females compared to 56 percent of males had internet
access.
The low use of internet services is not surprising considering the obstacles to internet
connectivity across the country. These include low levels of computer literacy in the
population, poor infrastructure and unreliable power supply. In addition, it has been
established that the high cost of internet services in Africa, makes the cost of internet access
unaffordable to a large segment of the population (wikipedia.org/wiki/Internet_in_Africa,
26/11/13). Despite these observations, the actual numbers of internet users in the country
could be higher than that reported in the 2010 PHC. This is because, it has been noted, that
data on internet subscribers only partially reflects the actual number of internet users in
Africa as cybercafés and Internet Kiosks are common in the urban areas of many African
countries (wikipedia.org/wiki/Internet_in_Africa).
Figure 5.1: Population of urban localities 12 years and above using internet
by sex and region
5.3 Use of computers
Figure 5.2 indicates that, of the 3,049,366 households in urban localities in Ghana, only 12.4
percent reported ownership of a desktop computer or laptop. This appears low for a country
with urbanization beyond 50 percent. The situation at the regional level was no different.
Less than a quarter of all urban households in each region reported ownership of a computer.
12.7 11.9 11.0
19.4
7.2 8.212.8
5.8 4.8 5.9
10.0
17.0 15.7 14.8
78.4
56.1
11.6
17.5
8.5 7.08.8
15.0
8.9 8.3
7.814.4 4.6
5.3 8.73.4 2.7 3.3 5.5
0.0
10.0
20.0
30.0
40.0
50.0
60.0
70.0
80.0
90.0
All
Regions
Western Central Gt. Accra Volta Eastern Ashanti Brong
Ahafo
Northern Upper
East
Upper
West
Both Sexes
Male
Female

71
Greater Accra had the highest proportion (17.4%) of households owning computers and was
followed by Ashanti Region (13%) and Upper West Region (12.6%). The lowest proportions
of households with computers/laptops were in the Brong Ahafo (7.7%), Northern (7.0%) and
Volta (6.2%) regions.
Figure 5.2: Urban Households with ownership of desktop and laptop computers
by region
5.4 Use of cell phones
Figure 5.3 shows the percentage of the urban population 12 years and older having mobile
phones by sex and region. From the data available, it is evident that almost three-quarters of
all persons aged 12 years and above own a mobile phone in urban localities in the country.
The Greater Accra Region recorded the highest proportion of ownership of mobile phones of
75.0 percent. The Ashanti and Western regions followed with 68 percent and 60 percent
respectively. The region that reported the least proportion of ownership of mobile phones was
the Northern Region (43.1%). In all regions, a higher proportion of males than females
owned mobile phones. As presented in Figure 5.3, the results indicate few variations by
region and sex with regard to ownership of mobile phones. The high ownership of mobile
phones is consistent with observations made by the World Bank and other partners on the
rapid increases in the use of mobile phones in Africa including Ghana.
12.411.7
8.1
17.4
6.2
8.7
13
7.77
9.2
12.6
0
2
4
6
8
10
12
14
16
18
20
AllRegions
Western Central Gt. Accra Volta Eastern Ashanti BrongAhafo
Northern UpperEast
UpperWest

72
Figure 5.3: Urban Population 12 and above having mobile phones by sex and region
5.5 Ownership of fixed telephone lines
With the advent of mobile phones, the fixed line is fast becoming less important. Indeed, the
fixed lines were never readily available to most of the population in the country. Its use was
dominated by organisations and businesses in the public and private sector and the elite few
who could either afford a fixed line or were resident in areas where the infrastructure
permitted it. Figure 5.4 shows that the proportion of urban households with fixed lines was
less than five percent with the exception of Greater Accra which recorded 5.6 percent. The
Brong Ahafo Region by far recorded the lowest proportion of fixed telephone line ownership
of 1.4 percent, followed by Northern Region’s 1.4 percent. Comparing ownership of fixed
telephone lines and cell phones (Figure 5.3 versus Figure 5.4) shows the limited importance
that is attached to fixed telephone lines in the country.
Figure 5.4: Urban Households with ownership of fixed lines by region
63.459.9
55.9
75.0
52.1
56.8
67.7
52.8
43.1
45.950.3
68.164.7
61.5
79.0
57.261.1
72.0
57.7
50.4 52.2
58.1
59.2 55.4 51.0
71.4
47.853.2
63.9
48.6
36.240.4 43.0
0.0
10.0
20.0
30.0
40.0
50.0
60.0
70.0
80.0
90.0
All
Regions
Western Central Gt. Accra Volta Eastern Ashanti Brong
Ahafo
Northern Upper
East
Upper
West
Both Sexes
Male
Female
3.74.1
2.3
5.6
2.62.3
3.6
1.4 1.5
2.5
2.0
0
1
2
3
4
5
6
All Regions Western Central Gt. Accra Volta Eastern Ashanti BrongAhafo
Northern Upper East UpperWest
73
5.6 Conclusion
As earlier observed, 12.4 percent of urban households own computers with about the same
percentage (12.7%) having internet access. Regional variations in the ownership of
computers and internet use did not follow the same pattern. Greater Accra and Ashanti
regions recorded the highest proportions in the ownership of computers of 17.4 percent and
13.0 percent respectively. Internet access was the same with Greater Accra having 19.4
percent of its population and Ashanti with 12.8 percent with internet access. However, the
regions with the lowest proportions for both variables varied. For instance, with respect to
ownership of computers Volta Region had the lowest proportion at 6.2 percent whilst
Northern Region recorded the least proportion 4.8 percent with internet access.
With the exception of Northern Region which recorded 43.1 percent of all persons age 12
years and above owning a mobile phone, all other regions had over fifty percent of this
population owning a mobile phone. As has been observed, more males than females owned
mobile phones at national and regional levels. The Northern Region recorded the least male
(50.4%) and female (36.2%) populations owning mobile phones. In addition, the 2010 PHC
data reveal that only a small proportion (3.7%) of households owned fixed lines with Greater
Accra having the highest proportion at 5.6 percent and Brong Ahafo with the lowest at 1.4
percent.
Despite the high levels of urbanisation in the country, the use of ICTs is rather low.
Considering the impact ICTs on a country’s socio-economic development efforts must be
made to accelerate its use in the country. The government must support the building of
infrastructure and create an enabling environment for individuals and businesses to take
advantage of the opportunities that ICT offers.

74
CHAPTER SIX
URBAN MOBILITY
6.4 Introduction
Rapid urbanisation has implications for intra-city mobility of people as a result of increased
vehicular movement that tends to compete with human movement at the same time. This
usually happens when urban infrastructural development, particularly road construction and
expansion do not keep pace with the rate of urbanisation. As traffic on the roads increases,
commuting within the city becomes difficult and could negatively affect productivity and cost
of production.
Against this background, data from the 2007 and 2012 household transport surveys were
extracted to assess the degree to which urban mobility constitutes a challenge for urban
dwellers in Ghana. These are with reference to three key areas of development: school
attendance, visiting a health facility and daily commuting to the workplace in the city of
residence. This chapter, therefore, examines how the ten regions in Ghana compare with each
other with reference to the experiences of urban dwellers as they commute to school,
workplace and visit a health facility whenever it becomes necessary. The analysis provides us
with a fair idea regarding the urban mobility situation in each region and how the regions
compare with each other in the country in 2007 and 2012.
6.2 Urban mobility and school attendance
Both surveys investigated the average distance respondents commuted between their
residence and school. The results of the analysis of their responses are presented in Table 6.1.
It must be understood that in the city, the distance covered in order to attend school by
residents could vary depending on which school each one chooses irrespective of where it is
located. Therefore, the longer distance one covers may not necessarily mean absence of
schools within walking distance but may be just a matter of choice. This, notwithstanding, the
results present a fair account of differences in the average distance that commuters to school
covered since one is not restricted to choose schools from particular locations in the city and,
therefore, schools that may not be chosen by some residents may be selected by other
residents from other parts of the same city or town.
From Table 6.1, we find that at the national level, a little more than two in five of the eligible
urban dwellers commuted less than one kilometre to attend school in 2007. The figure
increased to more than 50 percent in 2012, suggesting that during the five-year period
between 2007 and 2012, there were improvements in the sense that a much higher proportion
of the urban dwelling school attendees commuted less distance to school than they did five
years earlier. Persons attending school at locations more than five kilometres from their place
of residence also reduced from eight percent in 2007 to about seven percent in 2012.
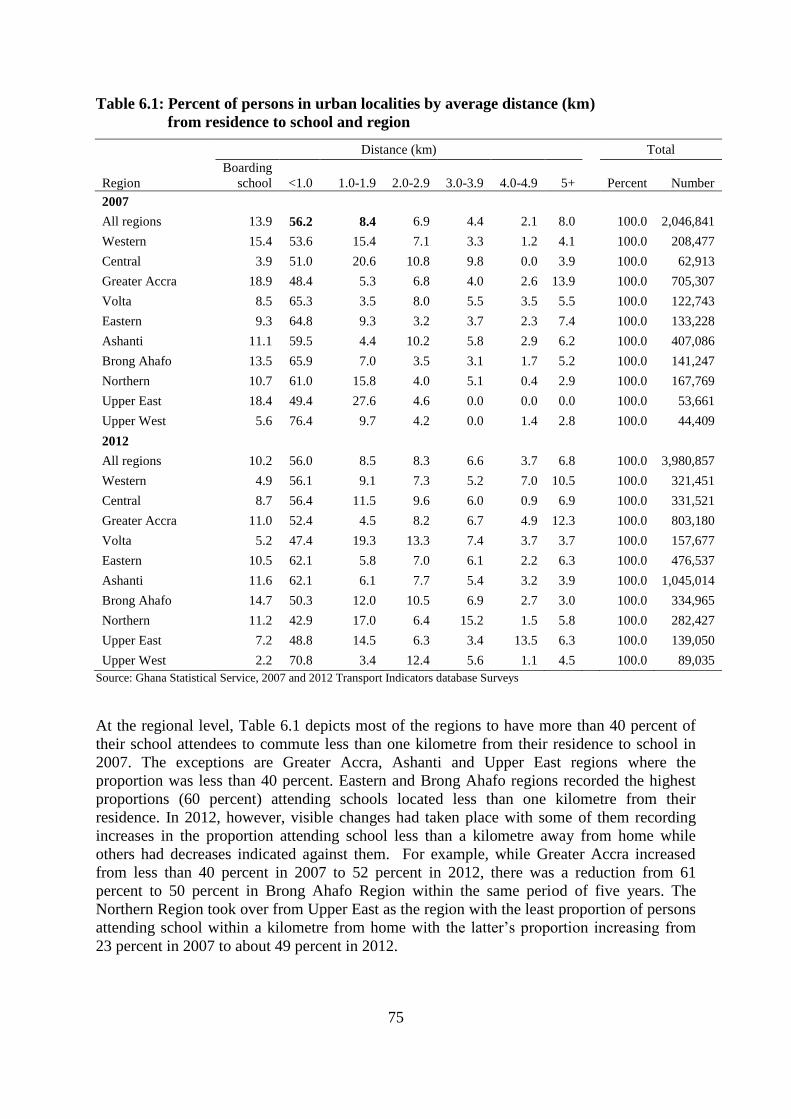
75
Table 6.1: Percent of persons in urban localities by average distance (km)
from residence to school and region
Region
Distance (km) Total
Boarding
school <1.0 1.0-1.9 2.0-2.9 3.0-3.9 4.0-4.9 5+
Percent Number
2007
All regions 13.9 56.2 8.4 6.9 4.4 2.1 8.0
100.0 2,046,841
Western 15.4 53.6 15.4 7.1 3.3 1.2 4.1
100.0 208,477
Central 3.9 51.0 20.6 10.8 9.8 0.0 3.9
100.0 62,913
Greater Accra 18.9 48.4 5.3 6.8 4.0 2.6 13.9
100.0 705,307
Volta 8.5 65.3 3.5 8.0 5.5 3.5 5.5
100.0 122,743
Eastern 9.3 64.8 9.3 3.2 3.7 2.3 7.4
100.0 133,228
Ashanti 11.1 59.5 4.4 10.2 5.8 2.9 6.2
100.0 407,086
Brong Ahafo 13.5 65.9 7.0 3.5 3.1 1.7 5.2
100.0 141,247
Northern 10.7 61.0 15.8 4.0 5.1 0.4 2.9
100.0 167,769
Upper East 18.4 49.4 27.6 4.6 0.0 0.0 0.0
100.0 53,661
Upper West 5.6 76.4 9.7 4.2 0.0 1.4 2.8
100.0 44,409
2012
All regions 10.2 56.0 8.5 8.3 6.6 3.7 6.8
100.0 3,980,857
Western 4.9 56.1 9.1 7.3 5.2 7.0 10.5
100.0 321,451
Central 8.7 56.4 11.5 9.6 6.0 0.9 6.9
100.0 331,521
Greater Accra 11.0 52.4 4.5 8.2 6.7 4.9 12.3
100.0 803,180
Volta 5.2 47.4 19.3 13.3 7.4 3.7 3.7
100.0 157,677
Eastern 10.5 62.1 5.8 7.0 6.1 2.2 6.3
100.0 476,537
Ashanti 11.6 62.1 6.1 7.7 5.4 3.2 3.9
100.0 1,045,014
Brong Ahafo 14.7 50.3 12.0 10.5 6.9 2.7 3.0
100.0 334,965
Northern 11.2 42.9 17.0 6.4 15.2 1.5 5.8
100.0 282,427
Upper East 7.2 48.8 14.5 6.3 3.4 13.5 6.3
100.0 139,050
Upper West 2.2 70.8 3.4 12.4 5.6 1.1 4.5 100.0 89,035
Source: Ghana Statistical Service, 2007 and 2012 Transport Indicators database Surveys
At the regional level, Table 6.1 depicts most of the regions to have more than 40 percent of
their school attendees to commute less than one kilometre from their residence to school in
2007. The exceptions are Greater Accra, Ashanti and Upper East regions where the
proportion was less than 40 percent. Eastern and Brong Ahafo regions recorded the highest
proportions (60 percent) attending schools located less than one kilometre from their
residence. In 2012, however, visible changes had taken place with some of them recording
increases in the proportion attending school less than a kilometre away from home while
others had decreases indicated against them. For example, while Greater Accra increased
from less than 40 percent in 2007 to 52 percent in 2012, there was a reduction from 61
percent to 50 percent in Brong Ahafo Region within the same period of five years. The
Northern Region took over from Upper East as the region with the least proportion of persons
attending school within a kilometre from home with the latter’s proportion increasing from
23 percent in 2007 to about 49 percent in 2012.
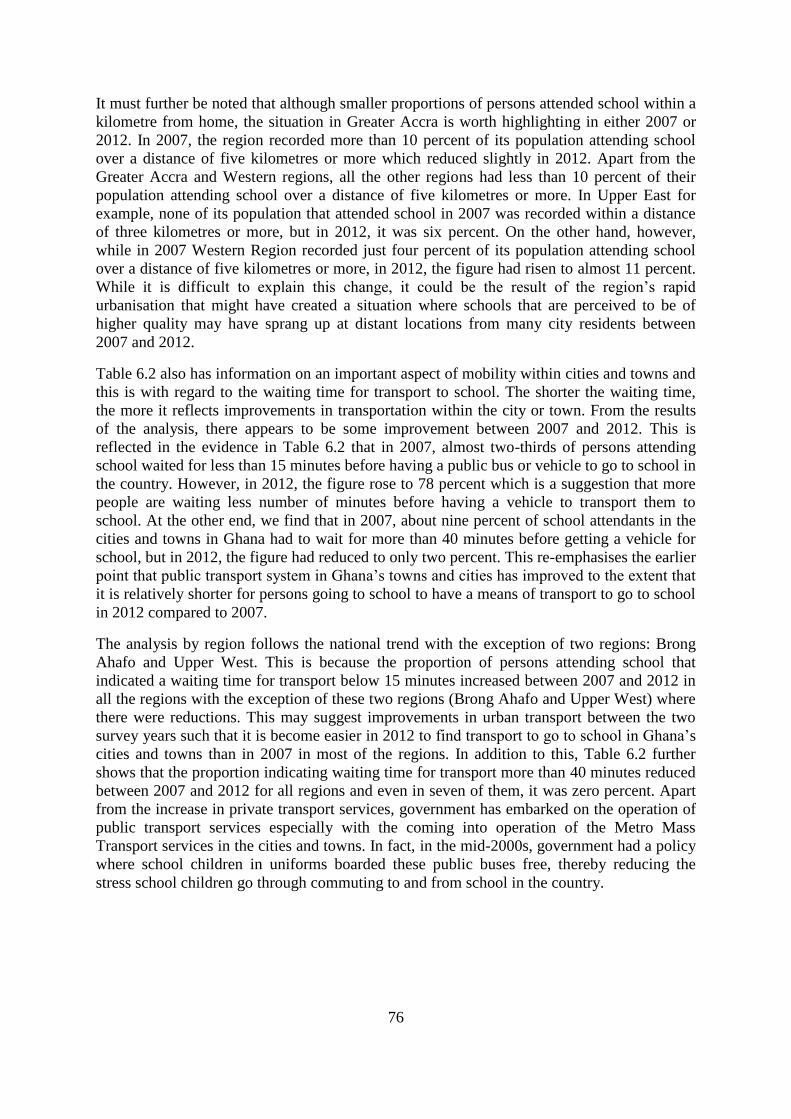
76
It must further be noted that although smaller proportions of persons attended school within a
kilometre from home, the situation in Greater Accra is worth highlighting in either 2007 or
2012. In 2007, the region recorded more than 10 percent of its population attending school
over a distance of five kilometres or more which reduced slightly in 2012. Apart from the
Greater Accra and Western regions, all the other regions had less than 10 percent of their
population attending school over a distance of five kilometres or more. In Upper East for
example, none of its population that attended school in 2007 was recorded within a distance
of three kilometres or more, but in 2012, it was six percent. On the other hand, however,
while in 2007 Western Region recorded just four percent of its population attending school
over a distance of five kilometres or more, in 2012, the figure had risen to almost 11 percent.
While it is difficult to explain this change, it could be the result of the region’s rapid
urbanisation that might have created a situation where schools that are perceived to be of
higher quality may have sprang up at distant locations from many city residents between
2007 and 2012.
Table 6.2 also has information on an important aspect of mobility within cities and towns and
this is with regard to the waiting time for transport to school. The shorter the waiting time,
the more it reflects improvements in transportation within the city or town. From the results
of the analysis, there appears to be some improvement between 2007 and 2012. This is
reflected in the evidence in Table 6.2 that in 2007, almost two-thirds of persons attending
school waited for less than 15 minutes before having a public bus or vehicle to go to school in
the country. However, in 2012, the figure rose to 78 percent which is a suggestion that more
people are waiting less number of minutes before having a vehicle to transport them to
school. At the other end, we find that in 2007, about nine percent of school attendants in the
cities and towns in Ghana had to wait for more than 40 minutes before getting a vehicle for
school, but in 2012, the figure had reduced to only two percent. This re-emphasises the earlier
point that public transport system in Ghana’s towns and cities has improved to the extent that
it is relatively shorter for persons going to school to have a means of transport to go to school
in 2012 compared to 2007.
The analysis by region follows the national trend with the exception of two regions: Brong
Ahafo and Upper West. This is because the proportion of persons attending school that
indicated a waiting time for transport below 15 minutes increased between 2007 and 2012 in
all the regions with the exception of these two regions (Brong Ahafo and Upper West) where
there were reductions. This may suggest improvements in urban transport between the two
survey years such that it is become easier in 2012 to find transport to go to school in Ghana’s
cities and towns than in 2007 in most of the regions. In addition to this, Table 6.2 further
shows that the proportion indicating waiting time for transport more than 40 minutes reduced
between 2007 and 2012 for all regions and even in seven of them, it was zero percent. Apart
from the increase in private transport services, government has embarked on the operation of
public transport services especially with the coming into operation of the Metro Mass
Transport services in the cities and towns. In fact, in the mid-2000s, government had a policy
where school children in uniforms boarded these public buses free, thereby reducing the
stress school children go through commuting to and from school in the country.

77
Table 6.2: Percent of persons in urban localities by waiting time for transport
to school and region
Region
Time (minutes) Total
<15 15-40 >40 % Number
2007
All regions 92.9 5.2 1.9 100.0 1,255,799
Western 96.1 1.7 2.2 100.0 143,097
Central 93.6 6.4 0.0 100.0 28,989
Greater Accra 91.2 7.3 1.6 100.0 441,627
Volta 87.1 9.7 3.2 100.0 38,241
Eastern 93.7 2.8 3.5 100.0 87,585
Ashanti 87.6 8.8 3.6 100.0 224,514
Brong Ahafo 94.9 3.6 1.4 100.0 85,118
Northern 99.6 0.0 0.4 100.0 162,218
Upper East 100.0 0.0 0.0 100.0 6,168
Upper West 100.0 0.0 0.0
100.0 38,241
2012
All regions 78.2 19.5 2.3 100.0 1,046,801
Western 59.7 36.4 3.9 100.0 86,243
Central 93.3 6.7 0.0 100.0 45,622
Greater Accra 78.7 18.3 3.0 100.0 317,500
Volta 83.3 16.7 0.0 100.0 14,016
Eastern 84.6 15.4 0.0 100.0 111,121
Ashanti 78.8 18.1 3.1 100.0 345,459
Brong Ahafo 67.4 32.6 0.0 100.0 86,249
Northern 97.1 2.9 0.0 100.0 29,187
Upper East 100.0 0.0 0.0 100.0 9,404
Upper West 50.0 50.0 0.0 100.0 2,001 Source: Ghana Statistical Service, 2007 and 2012 Transport Indicators database Surveys
Table 6.3 has information on the average travel time urban dwelling students reported it took
them to go to school in each of the ten regions in Ghana. The results do not suggest a general
reduction or increase in the average time spent going to school in the country but there are
some variations in the regions. A comparison between 2007 and 2012 shows a slight
reduction of the proportion that spent less than 10 minutes commuting to school in the urban
localities from 47 percent to 45 percent. At the extreme end also, we find that about four
percent of the respondents in 2007 reported to spend one hour or more going to school
compared to none in 2012. At the same time, the proportion spending between 20 and 39
minutes commuting to school increased from about 24 percent in 2007 to about 34 percent in
2012.
A look at the regional results also indicates that with the exception of Greater Accra and
Western regions where the proportion that said they used less than 10 minutes commuting to
school each day increased, in the other eight regions, there was a decrease. This suggests that
in these eight regions, a relatively higher proportion of school-going persons were spending
longer tome going to school. However, none of them in any of the 10 regions reported to be
using one hour or more going to school. The proportion that used 20-39 minutes on average
to commute to school was on the other hand higher in 2012 than in 2007 in each of the
regions. The overall picture, therefore, does not show consistency across all the regions, but
looking at the changes that had occurred at the two extreme ends of the scale, i.e., less than

78
10 minutes and one hour or more, it may appear that no serious changes had taken place in
the average time spent by commuters going to school in the regions between 2007 and 2012
although there are some obvious variations.
Table 6.3: Percent of persons in urban localities by average travel time (minutes)
to school and region
Region
Time (minutes) Total
<10 10-19 20-39 40-59 >60 Percent Number
2007
All regions 47.2 18.5 23.8 6.4 4.1 100.0 1,919,472
Western 33.5 20.6 28.2 15.2 2.5 100.0 194,908
Central 47.5 16.2 17.2 8.1 11.1 100.0 61,063
Greater Accra 40.5 17.3 29.5 7.2 5.6 100.0 645,786
Volta 45.3 19.3 22.9 5.2 7.3 100.0 118,425
Eastern 61.8 15.1 17.5 2.8 2.8 100.0 130,761
Ashanti 53.0 19.6 20.3 4.2 2.9 100.0 383,031
Brong Ahafo 56.7 21.6 18.7 1.9 1.0 100.0 128,294
Northern 55.0 19.9 19.9 1.5 3.7 100.0 167,152
Upper East 28.9 21.1 26.3 23.7 0.0 100.0 46,877
Upper West 80.0 11.4 8.6 0.0 0.0 100.0 43,176
2012
All regions 45.3 13.1 33.5 8.2 0.0 100.0 3,724,209
Western 34.6 14.5 43.9 7.1 0.0 100.0 301,291
Central 39.2 12.7 40.2 7.8 0.0 100.0 310,231
Greater Accra 51.3 11.8 31.1 5.8 0.0 100.0 762,313
Volta 22.1 23.8 44.3 9.8 0.0 100.0 142,494
Eastern 52.9 12.2 29.7 5.3 0.0 100.0 446,620
Ashanti 47.9 14.2 30.4 7.5 0.0 100.0 978,081
Brong Ahafo 40.8 13.6 35.6 10.0 0.0 100.0 309,893
Northern 49.7 11.5 30.9 7.9 0.0 100.0 260,966
Upper East 26.1 8.0 34.0 31.9 0.0 100.0 126,287
Upper West 50.0 7.0 30.2 12.8 0.0 100.0 86,034 Source: Ghana Statistical Service, 2007 and 2012 Transport Indicators database Surveys
Information collected on the main difficulties faced by persons going to school with respect
to transportation is presented in Table 6.4. From the information provided, we find that at the
national level, heavy traffic on the road attracted the highest proportion of respondents in
2007 as the main difficulty faced by the persons going to school in the urban localities in the
country. This was followed by bad roads (20.7%), long distance (16.7%) and long waiting
time for transport (10.9%). The other difficulties each attracted less than 10 percent of the
responses. In 2012, however, there were shifts in the responses where bad roads became the
most cited difficulty for persons going to school. Almost 30 percent cited bad roads as the
main difficulty faced and was followed by long waiting time (15.1%), no money for transport
(13.4%) and heavy traffic on road (12.8%). This is quite difficult to explain because one
wonders as to what happened between 2007 and 2012 for the proportion citing bad roads as a
main difficulty faced in going to school to increase by almost 10 percentage points. Perhaps
this might have been due to possible deterioration in some of the urban roads between 2007
and 2012.
Table 6.4 further shows that between 2007 and 2012, the shifts in what were considered as
the main difficulties faced by persons going to school in terms of transportation are quite
difficult to explain at the regional level. For example, in terms of bad roads as a difficulty,
five regions (Western, Greater Accra, Volta, Upper East and Upper West) recorded increases
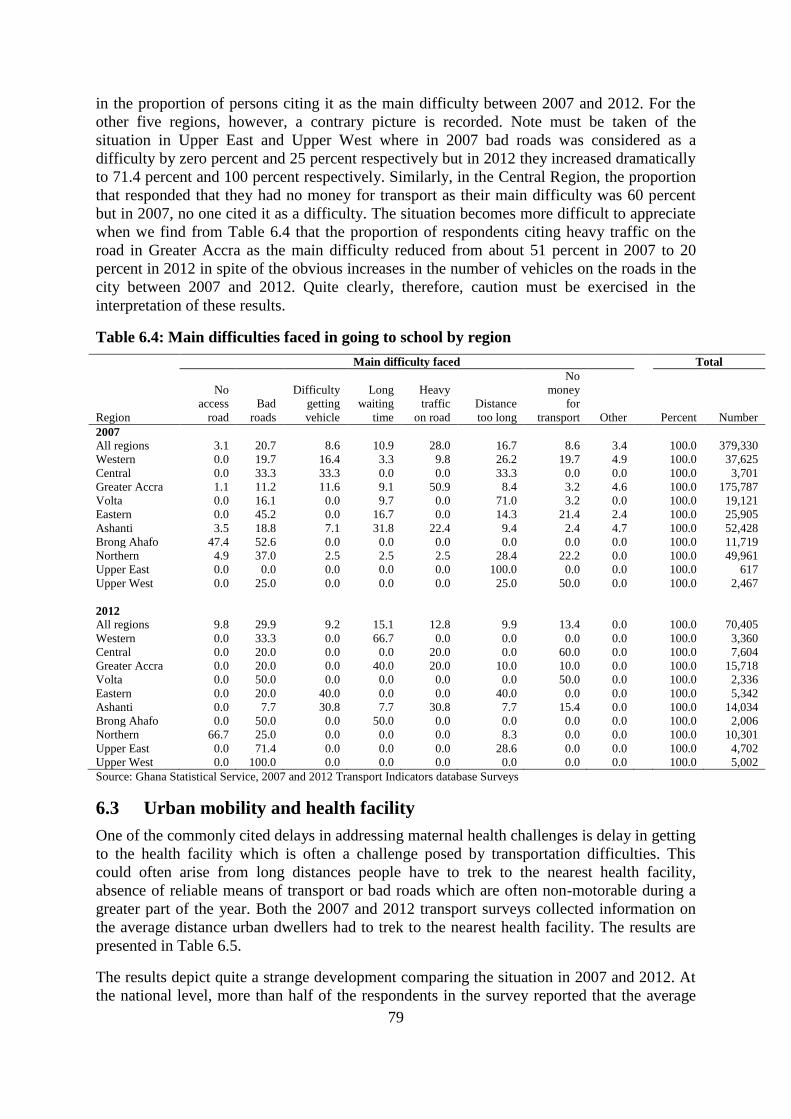
79
in the proportion of persons citing it as the main difficulty between 2007 and 2012. For the
other five regions, however, a contrary picture is recorded. Note must be taken of the
situation in Upper East and Upper West where in 2007 bad roads was considered as a
difficulty by zero percent and 25 percent respectively but in 2012 they increased dramatically
to 71.4 percent and 100 percent respectively. Similarly, in the Central Region, the proportion
that responded that they had no money for transport as their main difficulty was 60 percent
but in 2007, no one cited it as a difficulty. The situation becomes more difficult to appreciate
when we find from Table 6.4 that the proportion of respondents citing heavy traffic on the
road in Greater Accra as the main difficulty reduced from about 51 percent in 2007 to 20
percent in 2012 in spite of the obvious increases in the number of vehicles on the roads in the
city between 2007 and 2012. Quite clearly, therefore, caution must be exercised in the
interpretation of these results.
Table 6.4: Main difficulties faced in going to school by region
Region
Main difficulty faced Total
No
access
road
Bad
roads
Difficulty
getting
vehicle
Long
waiting
time
Heavy
traffic
on road
Distance
too long
No
money
for
transport Other Percent Number
2007 All regions 3.1 20.7 8.6 10.9 28.0 16.7 8.6 3.4 100.0 379,330
Western 0.0 19.7 16.4 3.3 9.8 26.2 19.7 4.9 100.0 37,625
Central 0.0 33.3 33.3 0.0 0.0 33.3 0.0 0.0 100.0 3,701
Greater Accra 1.1 11.2 11.6 9.1 50.9 8.4 3.2 4.6 100.0 175,787
Volta 0.0 16.1 0.0 9.7 0.0 71.0 3.2 0.0 100.0 19,121
Eastern 0.0 45.2 0.0 16.7 0.0 14.3 21.4 2.4 100.0 25,905
Ashanti 3.5 18.8 7.1 31.8 22.4 9.4 2.4 4.7 100.0 52,428
Brong Ahafo 47.4 52.6 0.0 0.0 0.0 0.0 0.0 0.0 100.0 11,719
Northern 4.9 37.0 2.5 2.5 2.5 28.4 22.2 0.0 100.0 49,961
Upper East 0.0 0.0 0.0 0.0 0.0 100.0 0.0 0.0 100.0 617
Upper West 0.0 25.0 0.0 0.0 0.0 25.0 50.0 0.0 100.0 2,467
2012 All regions 9.8 29.9 9.2 15.1 12.8 9.9 13.4 0.0 100.0 70,405
Western 0.0 33.3 0.0 66.7 0.0 0.0 0.0 0.0 100.0 3,360
Central 0.0 20.0 0.0 0.0 20.0 0.0 60.0 0.0 100.0 7,604
Greater Accra 0.0 20.0 0.0 40.0 20.0 10.0 10.0 0.0 100.0 15,718
Volta 0.0 50.0 0.0 0.0 0.0 0.0 50.0 0.0 100.0 2,336
Eastern 0.0 20.0 40.0 0.0 0.0 40.0 0.0 0.0 100.0 5,342
Ashanti 0.0 7.7 30.8 7.7 30.8 7.7 15.4 0.0 100.0 14,034
Brong Ahafo 0.0 50.0 0.0 50.0 0.0 0.0 0.0 0.0 100.0 2,006
Northern 66.7 25.0 0.0 0.0 0.0 8.3 0.0 0.0 100.0 10,301
Upper East 0.0 71.4 0.0 0.0 0.0 28.6 0.0 0.0 100.0 4,702
Upper West 0.0 100.0 0.0 0.0 0.0 0.0 0.0 0.0 100.0 5,002
Source: Ghana Statistical Service, 2007 and 2012 Transport Indicators database Surveys
6.3 Urban mobility and health facility
One of the commonly cited delays in addressing maternal health challenges is delay in getting
to the health facility which is often a challenge posed by transportation difficulties. This
could often arise from long distances people have to trek to the nearest health facility,
absence of reliable means of transport or bad roads which are often non-motorable during a
greater part of the year. Both the 2007 and 2012 transport surveys collected information on
the average distance urban dwellers had to trek to the nearest health facility. The results are
presented in Table 6.5.
The results depict quite a strange development comparing the situation in 2007 and 2012. At
the national level, more than half of the respondents in the survey reported that the average

80
distance from their residence to a health facility was less than one kilometre. However, in
2012, less than one percent of the respondents reported the average distance between their
residence and health facility to be less than one kilometre while almost 70 percent said the
distance was five kilometres or more. A similar picture is also shown at the regional level
where there are dramatic changes between 2007 and 2012 for the proportions indicating
average distance of five kilometres or more from their residence to a health facility. Unless
these constitute data challenges, it is difficult to explain the big change between 2007 and
2012. This should be subjected to further investigation because in five years, it is
unreasonable to conceive that health facilities that were within a kilometre reach are now so
far away that one needs to travel five kilometres or more before being able to access facility-
level health service.
Table 6.5: Average distance (km) to health facility by region
Region
Distance (km) Total
<1.0 1.0-1.9 2.0 -2.9 3.0-3.9 4.0- 4.9 5+ Percent Number
2007
All regions 56.6 11.5 10.9 8.0 4.6 8.4 100.0 1,341,379
Western 43.6 16.4 14.8 13.0 6.2 6.0 100.0 237,467
Central 63.2 19.7 1.3 6.6 2.6 6.6 100.0 46,877
Gt. Accra 74.5 4.8 8.7 3.3 1.4 7.2 100.0 434,071
Volta 37.6 19.8 15.8 12.9 5.0 8.9 100.0 62,296
Eastern 44.4 12.1 7.3 8.9 9.7 17.7 100.0 76,483
Ashanti 49.0 7.9 15.6 9.3 6.5 11.7 100.0 264,606
Brong Ahafo 47.6 26.2 14.6 6.8 1.0 3.9 100.0 63,530
Northern 55.8 16.8 3.0 10.7 8.1 5.6 100.0 121,509
Upper East 58.8 26.5 14.7 0.0 0.0 0.0 100.0 20,971
Upper West 40.9 4.5 0.0 13.6 4.5 36.4 100.0 13,570
2012
All regions 0.8 9.3 8.5 5.6 6.0 69.8 100.0 2,097,354
Western 0.8 4.0 4.8 3.2 8.0 79.2 100.0 140,005
Central 1.0 6.3 7.3 4.2 3.1 78.1 100.0 145,991
Gt. Accra 0.0 18.7 13.3 9.4 6.7 52.0 100.0 756,026
Volta 1.6 6.5 0.0 1.6 0.0 90.3 100.0 72,415
Eastern 3.4 1.9 7.3 5.8 3.4 78.2 100.0 220,104
Ashanti 0.9 4.9 8.6 3.2 8.9 73.6 100.0 376,766
Brong Ahafo 2.0 4.0 4.7 4.7 12.0 72.7 100.0 150,434
Northern 0.0 3.0 3.0 1.2 0.0 92.8 100.0 142,501
Upper East 0.0 0.0 0.0 1.2 2.4 96.5 100.0 57,098
Upper West 0.0 2.8 0.0 0.0 0.0 97.2 100.0 36,014 Source: Ghana Statistical Service, 2007 and 2012 Transport Indicators database Surveys
Table 6.6 provides information on the waiting time for urban dwellers in Ghana finding
transport to a health facility. The information indicates that between 2007 and 2012,
relatively more time is required to find transport to a health facility. At the national level, 86
percent of urban dwellers reported to spend less than 15 minutes looking transport to attend a
health facility in 2007 compared to a lower proportion of 64 percent. At the extreme end, we
find that the proportion spending 40 minutes or more to look for transport to a health facility
increased from 4.1 percent in 2007 to 28.1 percent. This suggests some deterioration in the
lives of the urban dwellers between 2007 and 2012.
A similar pattern is shown in the regions with the proportion reporting average waiting time
less than 15 minutes reducing while that for 40 minutes and more increased between 2007
and 2012. This suggests that with time, it is becoming increasingly more time consuming
81
finding transport to a health facility. For example, Volta Region recorded 4.5 percent of their
urban respondents in 2007 to wait for 40 minutes or more, but its corresponding figure in
2012 was as high as 46.4 percent. While this could be interpreted to mean more challenges
for urban dwellers in 2012 than in 2007, it could also mean that the increase in the urban
population in 2012 might have outran the pace at which public transport expanded during the
same period.
Table 6.6: Waiting time for transport to a health facility by region
Region
Time (minutes) Total
<15 15-40 >40 Percent Number
2007
All regions 86.1 9.8 4.1 100.0 4,276,254
Western 86.3 6.6 7.0 100.0 446,561
Central 99.0 0.5 0.5 100.0 121,509
Greater Accra 89.4 8.0 2.7 100.0 1,210,156
Volta 85.9 9.6 4.5 100.0 191,824
Eastern 86.1 12.5 1.4 100.0 355,275
Ashanti 78.4 16.1 5.6 100.0 1,028,817
Brong Ahafo 81.2 12.5 6.3 100.0 325,052
Northern 92.8 2.9 4.3 100.0 471,233
Upper East 91.3 8.7 0.0 100.0 14,186
Upper West 91.7 7.2 1.1 100.0 111,640
2012
All regions 64.2 7.7 28.1 100.0 901,442
Western 45.9 18.0 36.1 100.0 68,322
Central 65.5 9.1 25.5 100.0 83,641
Greater Accra 60.6 5.1 34.3 100.0 275,062
Volta 53.6 0.0 46.4 100.0 32,703
Eastern 62.4 10.5 27.1 100.0 142,106
Ashanti 75.6 7.0 17.4 100.0 216,992
Brong Ahafo 61.5 10.3 28.2 100.0 39,113
Northern 73.3 3.3 23.3 100.0 25,753
Upper East 75.0 0.0 25.0 100.0 10,748
Upper West 71.4 0.0 28.6 100.0 7,003
Source: Ghana Statistical Service, 2007 and 2012 Transport Indicators database Surveys
With respect to the average time spent going to a health facility, the results of the analysis
presented in Table 6.7 indicate that a higher proportion of urban residents in Ghana spent less
time in 2012 than in 2007. This is an indication of improvements in their living conditions
than five years earlier. For example, almost 46 percent of the urban dwellers in 2007 reported
to spend less than 10 minutes going to a health facility but in 2012, the figure increased to 59
percent. At the extreme end, however, the proportion that spent more than one hour getting to
a health facility increased by one percentage point from four to five between 2007 and 2012.
A similar pattern is shown by region as the proportion in each region reporting to spend less
than 10 minutes to a health facility increased quite substantially between 2007 and 2012 with
the exception of Greater Accra where there was a slight reduction from 52.5 percent to 51.2
percent. The increase between 2007 and 2012 was by far much higher in Upper East and
Upper West. What is interesting, however, is that none of them reported travel time between
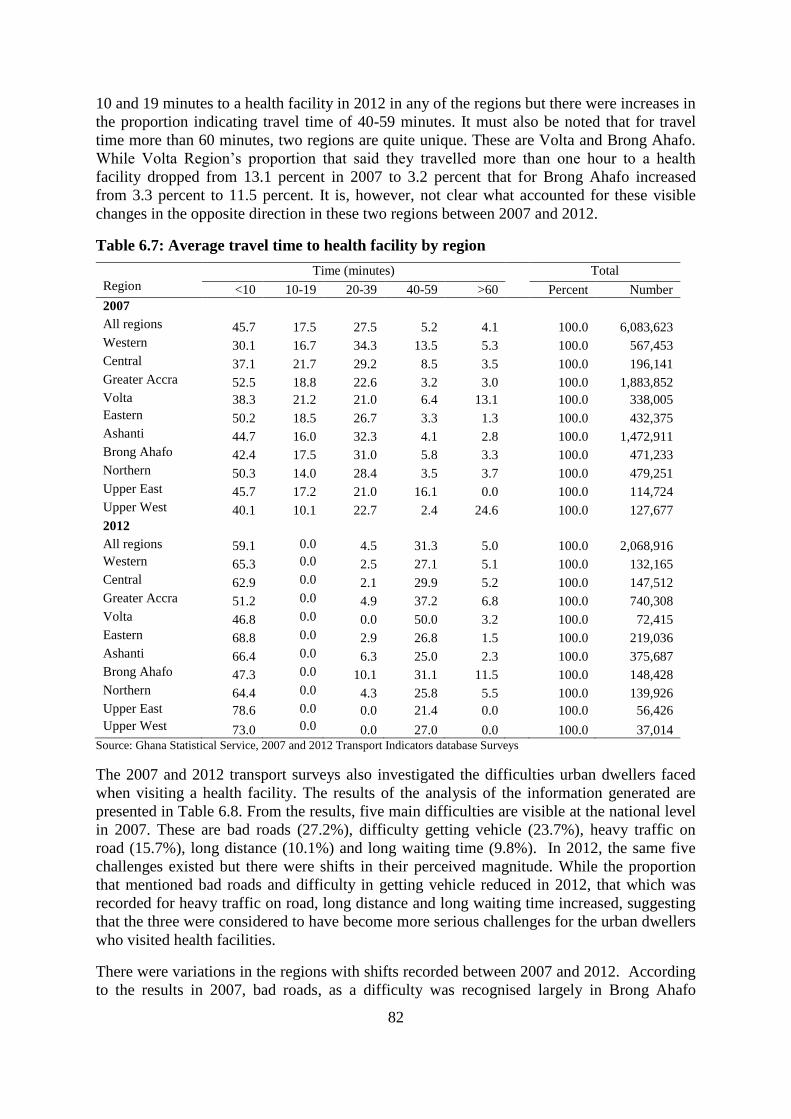
82
10 and 19 minutes to a health facility in 2012 in any of the regions but there were increases in
the proportion indicating travel time of 40-59 minutes. It must also be noted that for travel
time more than 60 minutes, two regions are quite unique. These are Volta and Brong Ahafo.
While Volta Region’s proportion that said they travelled more than one hour to a health
facility dropped from 13.1 percent in 2007 to 3.2 percent that for Brong Ahafo increased
from 3.3 percent to 11.5 percent. It is, however, not clear what accounted for these visible
changes in the opposite direction in these two regions between 2007 and 2012.
Table 6.7: Average travel time to health facility by region
Region
Time (minutes) Total
<10 10-19 20-39 40-59 >60 Percent Number
2007
All regions 45.7 17.5 27.5 5.2 4.1 100.0 6,083,623
Western 30.1 16.7 34.3 13.5 5.3 100.0 567,453
Central 37.1 21.7 29.2 8.5 3.5 100.0 196,141
Greater Accra 52.5 18.8 22.6 3.2 3.0 100.0 1,883,852
Volta 38.3 21.2 21.0 6.4 13.1 100.0 338,005
Eastern 50.2 18.5 26.7 3.3 1.3 100.0 432,375
Ashanti 44.7 16.0 32.3 4.1 2.8 100.0 1,472,911
Brong Ahafo 42.4 17.5 31.0 5.8 3.3 100.0 471,233
Northern 50.3 14.0 28.4 3.5 3.7 100.0 479,251
Upper East 45.7 17.2 21.0 16.1 0.0 100.0 114,724
Upper West 40.1 10.1 22.7 2.4 24.6 100.0 127,677
2012
All regions 59.1 0.0 4.5 31.3 5.0 100.0 2,068,916
Western 65.3 0.0 2.5 27.1 5.1 100.0 132,165
Central 62.9 0.0 2.1 29.9 5.2 100.0 147,512
Greater Accra 51.2 0.0 4.9 37.2 6.8 100.0 740,308
Volta 46.8 0.0 0.0 50.0 3.2 100.0 72,415
Eastern 68.8 0.0 2.9 26.8 1.5 100.0 219,036
Ashanti 66.4 0.0 6.3 25.0 2.3 100.0 375,687
Brong Ahafo 47.3 0.0 10.1 31.1 11.5 100.0 148,428
Northern 64.4 0.0 4.3 25.8 5.5 100.0 139,926
Upper East 78.6 0.0 0.0 21.4 0.0 100.0 56,426
Upper West 73.0 0.0 0.0 27.0 0.0 100.0 37,014 Source: Ghana Statistical Service, 2007 and 2012 Transport Indicators database Surveys
The 2007 and 2012 transport surveys also investigated the difficulties urban dwellers faced
when visiting a health facility. The results of the analysis of the information generated are
presented in Table 6.8. From the results, five main difficulties are visible at the national level
in 2007. These are bad roads (27.2%), difficulty getting vehicle (23.7%), heavy traffic on
road (15.7%), long distance (10.1%) and long waiting time (9.8%). In 2012, the same five
challenges existed but there were shifts in their perceived magnitude. While the proportion
that mentioned bad roads and difficulty in getting vehicle reduced in 2012, that which was
recorded for heavy traffic on road, long distance and long waiting time increased, suggesting
that the three were considered to have become more serious challenges for the urban dwellers
who visited health facilities.
There were variations in the regions with shifts recorded between 2007 and 2012. According
to the results in 2007, bad roads, as a difficulty was recognised largely in Brong Ahafo

83
(94.9%), Volta (46%) and Upper East (36.8%). By 2012, however, the three regions had seen
drastic changes with the proportion citing these as challenges reducing. For example, less
than 10 percent of the urban dwellers in Brong Ahafo and Volta regions indicated bad roads
as a challenge. On the other hand, Upper West recorded the highest proportion that cited
difficulty in getting vehicle to the health facility in 2012 (58.3%) although in 2007, it was
about 24 percent. Also interesting is the observation that in Brong Ahafo, half of the
respondents said getting vehicle was a difficulty in 2012 when in 2007 it was just one
percent.
Table 6.8: Main obstacles faced visiting a health facility by region
Source: Ghana Statistical Service, 2007 and 2012 Transport Indicators Database Surveys
Another observation that is worth noting from Table 6.8 is that heavy traffic on roads
appeared to be highest in Greater Accra and Ashanti regions in either 2007 or 2012 perhaps
due to the situation in Accra and Kumasi. However, while the magnitude of heavy traffic on
roads in Greater Accra was recorded to have reduced between 2007 and 2012 (from 38.9% to
30.3%), in Ashanti, it had increased from 20.1 percent to 28 percent. This could be due to
differences in new roads constructed or expanded in the two regions between 2007 and 2012.
For example, in Accra, the newly constructed road named George Walker Bush Highway
(popularly called N1 Road) has contributed a great deal in reducing traffic congestion on that
road.
6.4 Urban mobility and place of work
In the cities and towns, many inhabitants are faced with difficulties in the morning and
evening going to and from work. Apart from persons whose workplaces are within walking
Region
Main difficulty faced Total
No
access
road
Bad
roads
Difficulty
getting
vehicle
Long
waiting
time
Heavy
traffic
on road
Distance
too long
No
money
for
transport Other Percent Number
2007
All regions 1.3 27.2 23.7 9.8 15.7 10.1 7.0 5.3 100.0 1,372,373
Western 0.0 20.4 29.9 4.0 4.0 15.0 21.9 4.7 100.0 169,002
Central 0.0 12.5 37.5 0.0 0.0 0.0 0.0 50.0 100.0 4,934
Gt. Accra 1.0 22.8 12.8 12.8 38.9 1.4 0.6 9.7 100.0 317,034
Volta 0.0 46.0 20.7 8.0 0.0 22.7 2.7 0.0 100.0 92,520
Eastern 1.3 25.5 21.3 11.7 1.7 19.2 9.2 10.0 100.0 147,414
Ashanti 1.8 23.1 31.1 13.3 20.1 5.1 1.5 4.0 100.0 413,871
Brong Ahafo 4.0 94.9 1.0 0.0 0.0 0.0 0.0 0.0 100.0 61,063
Northern 2.1 12.4 37.6 4.6 0.0 18.0 25.3 0.0 100.0 119,659
Upper East 0.0 36.8 15.8 2.6 0.0 35.5 9.2 0.0 100.0 46,877
Upper West 1.3 27.2 23.7 9.8 15.7 10.1 7.0 5.3 100.0 1,372,373
2012
All regions 1.2 17.6 19.1 18.2 17.0 16.8 6.9 3.2 100.0 617,385
Western 0.0 17.9 10.7 3.6 21.4 28.6 7.1 10.7 100.0 31,361
Central 5.4 13.5 13.5 24.3 0.0 21.6 21.6 0.0 100.0 56,267
Gt. Accra 0.8 19.7 9.8 24.6 30.3 3.3 4.1 7.4 100.0 191,757
Volta 0.0 8.7 8.7 34.8 8.7 26.1 13.0 0.0 100.0 26,864
Eastern 0.0 27.7 24.6 10.8 3.1 29.2 1.5 3.1 100.0 69,450
Ashanti 0.0 8.5 22.9 24.6 28.0 10.2 5.9 0.0 100.0 127,388
Brong Ahafo 0.0 7.1 50.0 0.0 0.0 42.9 0.0 0.0 100.0 14,040
Northern 6.7 42.2 8.9 6.7 0.0 31.1 4.4 0.0 100.0 38,630
Upper East 0.0 10.7 39.3 0.0 0.0 37.5 12.5 0.0 100.0 37,617
Upper West 0.0 16.7 58.3 0.0 0.0 16.7 8.3 0.0 100.0 24,009
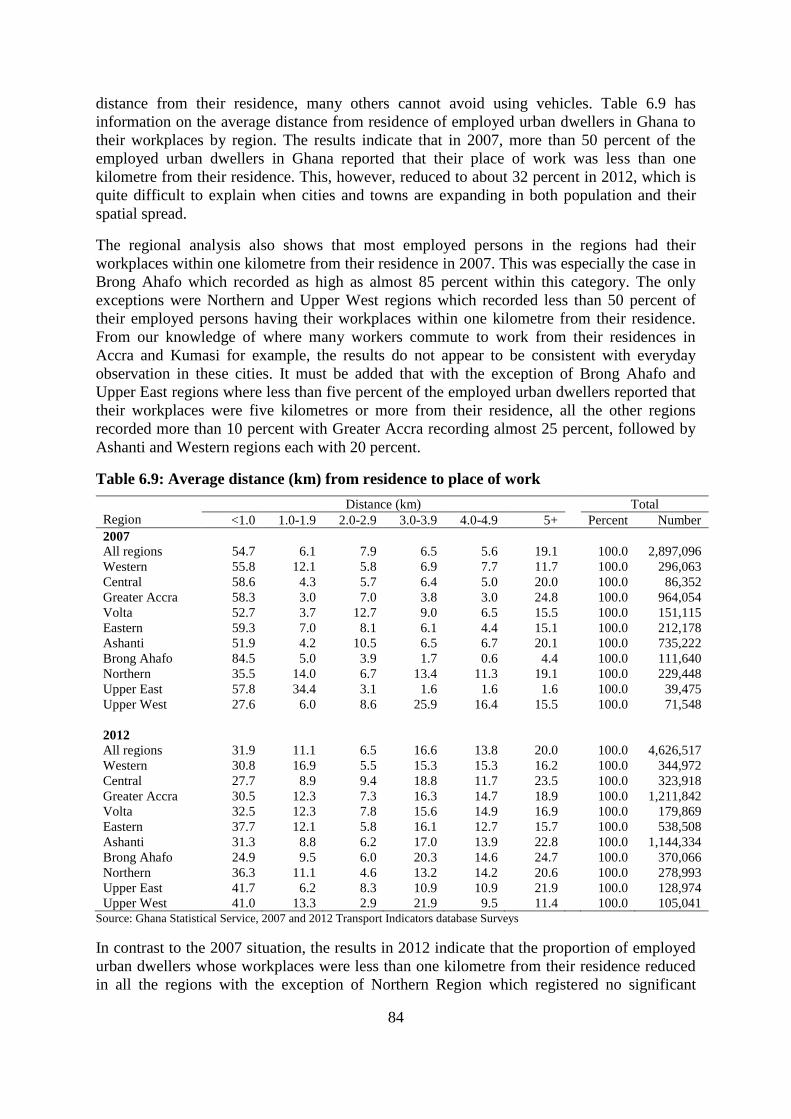
84
distance from their residence, many others cannot avoid using vehicles. Table 6.9 has
information on the average distance from residence of employed urban dwellers in Ghana to
their workplaces by region. The results indicate that in 2007, more than 50 percent of the
employed urban dwellers in Ghana reported that their place of work was less than one
kilometre from their residence. This, however, reduced to about 32 percent in 2012, which is
quite difficult to explain when cities and towns are expanding in both population and their
spatial spread.
The regional analysis also shows that most employed persons in the regions had their
workplaces within one kilometre from their residence in 2007. This was especially the case in
Brong Ahafo which recorded as high as almost 85 percent within this category. The only
exceptions were Northern and Upper West regions which recorded less than 50 percent of
their employed persons having their workplaces within one kilometre from their residence.
From our knowledge of where many workers commute to work from their residences in
Accra and Kumasi for example, the results do not appear to be consistent with everyday
observation in these cities. It must be added that with the exception of Brong Ahafo and
Upper East regions where less than five percent of the employed urban dwellers reported that
their workplaces were five kilometres or more from their residence, all the other regions
recorded more than 10 percent with Greater Accra recording almost 25 percent, followed by
Ashanti and Western regions each with 20 percent.
Table 6.9: Average distance (km) from residence to place of work
Region
Distance (km) Total
<1.0 1.0-1.9 2.0-2.9 3.0-3.9 4.0-4.9 5+ Percent Number
2007 All regions 54.7 6.1 7.9 6.5 5.6 19.1 100.0 2,897,096
Western 55.8 12.1 5.8 6.9 7.7 11.7 100.0 296,063
Central 58.6 4.3 5.7 6.4 5.0 20.0 100.0 86,352
Greater Accra 58.3 3.0 7.0 3.8 3.0 24.8 100.0 964,054
Volta 52.7 3.7 12.7 9.0 6.5 15.5 100.0 151,115
Eastern 59.3 7.0 8.1 6.1 4.4 15.1 100.0 212,178
Ashanti 51.9 4.2 10.5 6.5 6.7 20.1 100.0 735,222
Brong Ahafo 84.5 5.0 3.9 1.7 0.6 4.4 100.0 111,640
Northern 35.5 14.0 6.7 13.4 11.3 19.1 100.0 229,448
Upper East 57.8 34.4 3.1 1.6 1.6 1.6 100.0 39,475
Upper West 27.6 6.0 8.6 25.9 16.4 15.5 100.0 71,548
2012 All regions 31.9 11.1 6.5 16.6 13.8 20.0 100.0 4,626,517
Western 30.8 16.9 5.5 15.3 15.3 16.2 100.0 344,972
Central 27.7 8.9 9.4 18.8 11.7 23.5 100.0 323,918
Greater Accra 30.5 12.3 7.3 16.3 14.7 18.9 100.0 1,211,842
Volta 32.5 12.3 7.8 15.6 14.9 16.9 100.0 179,869
Eastern 37.7 12.1 5.8 16.1 12.7 15.7 100.0 538,508
Ashanti 31.3 8.8 6.2 17.0 13.9 22.8 100.0 1,144,334
Brong Ahafo 24.9 9.5 6.0 20.3 14.6 24.7 100.0 370,066
Northern 36.3 11.1 4.6 13.2 14.2 20.6 100.0 278,993
Upper East 41.7 6.2 8.3 10.9 10.9 21.9 100.0 128,974
Upper West 41.0 13.3 2.9 21.9 9.5 11.4 100.0 105,041 Source: Ghana Statistical Service, 2007 and 2012 Transport Indicators database Surveys
In contrast to the 2007 situation, the results in 2012 indicate that the proportion of employed
urban dwellers whose workplaces were less than one kilometre from their residence reduced
in all the regions with the exception of Northern Region which registered no significant

85
change and Upper West Region which increased to 41 percent from about 28 percent. The
proportion indicating a distance of three kilometres or more increased in almost all the
regions with a few exceptions between 2007 and 2012. This could suggest increases in the
spatial spread of the population in the urban centres as their populations increased, making
the workplaces new entrants to the cities and towns can find jobs become located farther
away from their places of residence.
A comparison between 2007 and 2012 with respect to the average travel time to place of
work among urban dwellers as presented in Table 6.10 suggests some important variations
which are not easy to explain. From the table, it is to be noticed that at the national level, the
proportion of persons responding to use less than 10 minutes to go to their workplace
increased from 35 percent in 2007 to about 41 percent in 2012. This appears to indicate that
workers spent relatively shorter time to travel to their workplaces in 2012 than five years
earlier. This is further reinforced by the observation that while in 2007 a little more than 20
percent of the employed urban dwellers in Ghana reported to spend one hour or more
travelling to their workplaces, none of them said so in 2012.
Table 6.10: Average travel time to workplace by region
Region
Time (minutes) Total
<10 10-19 20-39 40-59 60+ Percent Number
2007 All regions 35.4 15.7 17.0 10.3 21.6 100.0 1,671,057
Western 41.6 13.1 11.1 12.0 22.2 100.0 216,496
Central 51.9 11.4 8.9 3.8 24.1 100.0 48,727
Greater Accra 27.8 18.6 21.1 12.3 20.2 100.0 507,778
Volta 34.1 15.9 14.3 7.7 28.0 100.0 112,257
Eastern 37.3 14.8 14.1 9.9 23.9 100.0 87,585
Ashanti 34.4 16.6 18.3 10.6 20.1 100.0 437,926
Brong Ahafo 60.5 25.6 4.7 7.0 2.3 100.0 26,522
Northern 46.4 10.2 17.1 5.9 20.4 100.0 187,506
Upper East 15.4 7.7 7.7 30.8 38.5 100.0 8,018
Upper West 25.8 8.1 14.5 9.7 41.9 100.0 38,241
2012 All regions 40.8 6.1 40.9 12.2 0.0 100.0 3,786,373
Western 41.5 3.5 42.3 12.7 0.0 100.0 291,210
Central 41.3 5.4 42.5 10.8 0.0 100.0 253,964
Greater Accra 40.9 5.6 41.6 11.9 0.0 100.0 1,034,231
Volta 39.4 4.4 43.1 13.1 0.0 100.0 160,013
Eastern 43.4 10.0 37.1 9.5 0.0 100.0 440,209
Ashanti 40.9 5.7 41.5 11.9 0.0 100.0 921,944
Brong Ahafo 37.5 4.0 40.9 17.6 0.0 100.0 301,870
Northern 42.5 7.7 37.7 12.1 0.0 100.0 234,354
Upper East 36.1 12.0 34.3 17.6 0.0 100.0 72,548
Upper West 32.9 6.6 48.7 11.8 0.0 100.0 76,030 Source: Ghana Statistical Service, 2007 and 2012 Transport Indicators database Surveys
There appears to be some consistency at the regional level between 2007 and 2012 with few
exceptions. For example, in six of the regions, namely; Greater Accra, Volta, Eastern,
Ashanti, Upper East and Upper West, the proportion that indicated that it took them less than
10 minutes on average to reach their workplaces increased between 2007 and 2012. The
reverse was the case in Central, Brong Ahafo and Northern regions while Western Region
remained virtually the same. Those who spent between 20 and 39 minutes to get to their
workplaces were also much higher in all regions in 2012 than in 2007 while no one reported

86
travel time of one hour or more in 2012 compared to 20 percent or higher in all regions in
2007 except in Brong Ahafo where the proportion was less than five percent. This also
suggests that travel time to workplaces had relatively reduced between 2007 and 2012. This
is also quite difficult to explain considering that in 2012, more vehicles have been put on the
roads, resulting in heavier traffic congestion that could also reduce the speed at which urban
commuters are able to move to and from their workplaces.
6.5 Urban transport availability and reliability
The availability and reliability of urban transport could pose some challenges to urban
dwellers regarding their mobility. These challenges are examined relative to the time during
the day transport is considered available and its reliability in each region in Ghana in 2007
and 2012. These are analysed in Tables 6.11 and 6.12. The period during which transport is
said to be available is shown in Table 6.11. It is to be noted that there is a big variation
between the results of 2007 and 2012. At the national level, almost 70 percent of the urban
dwellers interviewed in 2007 said transport was available all day but in 2012 only about 13
percent said so. From the results, it may appear that five years later after 2007 the transport
situation in the urban areas in Ghana has been worse since only 13 percent of them indicated
that they can find transport all day. Again, transport availability is seen to have shifted from
all day to the morning and evening with about 41 percent and 36 percent respectively
attesting to this in 2012 compared to less than 10 percent in either case in 2007.
Interesting results are also observed from Table 6.11 pertaining to the regions. For example,
in eight of the regions, none said transport is available all day with the exception of Northern,
Upper East and Eastern regions. In the Northern Region, a very high proportion (97%)
indicated that they could find transport all day and in the Eastern and Upper East regions,
much lower proportions said so (4.6% and 36% respectively).
Furthermore, the regions vary quite dramatically regarding the period in the day transport is
seen to be available in the towns and cities in Ghana. In the Upper West for example in 2012,
all the respondents said transport was available during the evening while in Ashanti Region,
99 percent indicated transport availability in the morning. Similarly, about 81 percent of the
respondents in Greater Accra Region were of the opinion that transport was available in the
morning while in the Northern Region less than five percent said so. On the other hand,
transport was said to be available mainly in the evening and afternoon (almost 60% and 25%
respectively). These are interesting results which defy easy explanation and may, therefore,
require further investigation.

87
Table 6.11: Availability of transport by region
Region
Time of day Total
Morning Afternoon Evening All day Percent Number
2007
All regions 9.4 13.1 8.2 69.3 100.0 2,124,789
Western 3.2 17.0 9.8 70.0 100.0 195,525
Central 8.0 23.6 6.5 62.0 100.0 162,218
Greater Accra 35.0 5.7 13.0 46.3 100.0 75,866
Volta 12.2 20.3 11.6 55.9 100.0 212,795
Eastern 9.1 7.8 12.6 70.6 100.0 230,605
Ashanti 18.9 7.0 11.3 62.9 100.0 415,104
Brong Ahafo 1.7 52.5 15.8 30.0 100.0 74,016
Northern 5.7 10.7 4.6 79.0 100.0 375,629
Upper East 0.0 0.0 0.9 99.1 100.0 272,007
Upper West 5.6 30.6 1.7 62.2 100.0 111,023
2012
All regions 40.7 10.5 36.0 12.9 100.0 1,324,531
Western 29.2 13.2 57.6 0.0 100.0 272,170
Central 62.7 22.0 15.3 0.0 100.0 89,724
Greater Accra 80.6 13.3 6.1 0.0 100.0 154,034
Volta 28.2 16.0 55.7 0.0 100.0 153,005
Eastern 10.7 25.2 59.5 4.6 100.0 139,969
Ashanti 99.3 0.7 0.0 0.0 100.0 153,298
Brong Ahafo 45.1 0.8 54.1 0.0 100.0 133,384
Northern 2.3 0.6 0.0 97.1 100.0 150,227
Upper East 10.8 0.0 52.7 36.5 100.0 49,709
Upper West 0.0 0.0 100.0 0.0 100.0 29,011 Source: Ghana Statistical Service, 2007 and 2012 Transport Indicators database Surveys
In Table 6.12, the reliability of transport in the urban localities in each region is presented
once again for 2007 and 2012. From the results shown in the table, we observe that in 2007,
the transport situation was found to be more reliable than in 2012. This is evidenced by the
finding that 77 percent of the urban dwellers interviewed in 2007 were of the view that
transport was reliable compared to 60 percent in 2012. To strengthen this point, more than a
quarter of the respondents in 2012 said transport was not reliable compared to less than 10
percent in 2007. This somehow is consistent with the results in Table 6.11 that showed a
much smaller proportion of the respondents indicating transport availability all day in 2012
compared to 2007.
The results in the regions also tend to be consistent with the average for the country. The
proportion of the respondents that said transport was reliable in 2007 in each region was
much higher than that in 2012. For example, in the Central Region, as high as 91 percent of
the urban dwellers interviewed indicated that transport was reliable in 2007, but in 2012 this
reduced to 55 percent. In the same region in that same year, the proportion that reported that
transport was not reliable was just about six percent but in 2012, it increased to almost 37
percent. Again, in Upper East and Upper West, about 65 percent and 51 percent respectively
confirmed transport reliability in 2007, but in 2012, the proportions reduced to as low as 17
percent and three percent respectively to suggest a worsening transport situation five years
after the 2007 survey. On the other hand, zero percent and 20 percent respectively in Upper
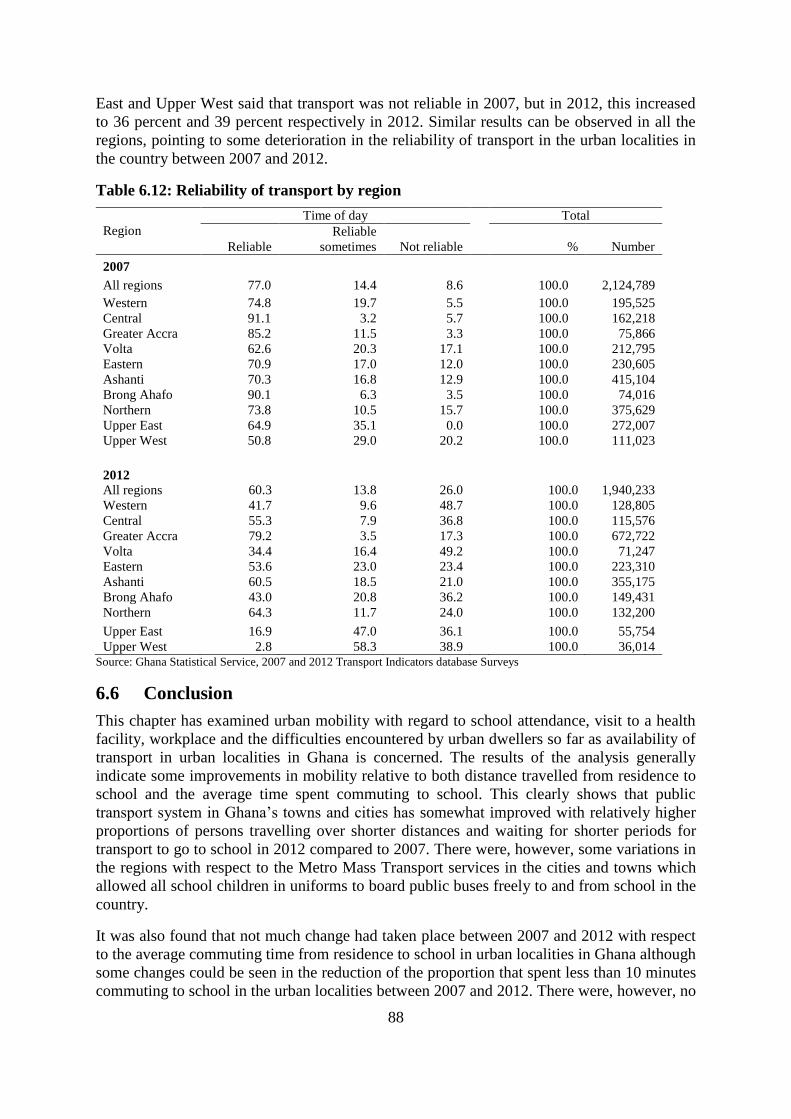
88
East and Upper West said that transport was not reliable in 2007, but in 2012, this increased
to 36 percent and 39 percent respectively in 2012. Similar results can be observed in all the
regions, pointing to some deterioration in the reliability of transport in the urban localities in
the country between 2007 and 2012.
Table 6.12: Reliability of transport by region
Region
Time of day Total
Reliable
Reliable
sometimes Not reliable % Number
2007
All regions 77.0 14.4 8.6 100.0 2,124,789
Western 74.8 19.7 5.5 100.0 195,525
Central 91.1 3.2 5.7 100.0 162,218
Greater Accra 85.2 11.5 3.3 100.0 75,866
Volta 62.6 20.3 17.1 100.0 212,795
Eastern 70.9 17.0 12.0 100.0 230,605
Ashanti 70.3 16.8 12.9 100.0 415,104
Brong Ahafo 90.1 6.3 3.5 100.0 74,016
Northern 73.8 10.5 15.7 100.0 375,629
Upper East 64.9 35.1 0.0 100.0 272,007
Upper West 50.8 29.0 20.2 100.0 111,023
2012
All regions 60.3 13.8 26.0 100.0 1,940,233
Western 41.7 9.6 48.7 100.0 128,805
Central 55.3 7.9 36.8 100.0 115,576
Greater Accra 79.2 3.5 17.3 100.0 672,722
Volta 34.4 16.4 49.2 100.0 71,247
Eastern 53.6 23.0 23.4 100.0 223,310
Ashanti 60.5 18.5 21.0 100.0 355,175
Brong Ahafo 43.0 20.8 36.2 100.0 149,431
Northern 64.3 11.7 24.0 100.0 132,200
Upper East 16.9 47.0 36.1 100.0 55,754
Upper West 2.8 58.3 38.9 100.0 36,014 Source: Ghana Statistical Service, 2007 and 2012 Transport Indicators database Surveys
6.6 Conclusion
This chapter has examined urban mobility with regard to school attendance, visit to a health
facility, workplace and the difficulties encountered by urban dwellers so far as availability of
transport in urban localities in Ghana is concerned. The results of the analysis generally
indicate some improvements in mobility relative to both distance travelled from residence to
school and the average time spent commuting to school. This clearly shows that public
transport system in Ghana’s towns and cities has somewhat improved with relatively higher
proportions of persons travelling over shorter distances and waiting for shorter periods for
transport to go to school in 2012 compared to 2007. There were, however, some variations in
the regions with respect to the Metro Mass Transport services in the cities and towns which
allowed all school children in uniforms to board public buses freely to and from school in the
country.
It was also found that not much change had taken place between 2007 and 2012 with respect
to the average commuting time from residence to school in urban localities in Ghana although
some changes could be seen in the reduction of the proportion that spent less than 10 minutes
commuting to school in the urban localities between 2007 and 2012. There were, however, no
89
consistency across all the regions although the proportion of respondents at the two extreme
ends of the scale, i.e., less than 10 minutes and one hour or more suggested no significant
changes were recorded between the two survey years in spite some obvious regional
variations between 2007 and 2012.
The results further suggest that heavy traffic on the urban roads constituted a big difficulty in
2007 but this shifted to bad roads, followed by heavy traffic in 2012. The expectation,
however, is that with new roads being constructed, one does not expect bad roads to be more
prominent as a difficulty in urban localities as the years roll by. Thus, if this is the thinking of
urban dwellers, then it may appear the rate at which urban roads are being improved may not
be the best.
Again, interesting results were registered regarding average distance to health facility from
the residence. In 2007, more than half of the urban residents interviewed said the average
distance to a health facility was less than one kilometre but in 2012, less than one percent
gave this response. One, therefore, wonders what had changed between 2007 and 2012 to
produce this result. Perhaps, with the urban sprawl in some cities and towns, some residents
have moved to settle at new developing suburbs farther away from health facilities but the
magnitude of such movement is still not known. It was also seen that urban residents were
spending longer time waiting for transport to go to a health facility in 2012 than in 2007, a
situation which is not easy to explain considering that between 2007 and 2012 public
transport has expanded in the urban areas in the country. This is also reinforced by the
finding that a higher proportion of respondents were spending less time than in 2007
travelling to a health facility, a situation that suggests some improvement in urban
transportation.
The difficulties that were mentioned to confront urban dwellers going to a health facility are
indications of more efforts needed to improve on public transport services in the urban
centres while taking steps to do away with bad roads in the cities and towns. This is because
bad roads, difficulty in getting vehicles and long waiting time for transport were cited as
some of the major transport difficulties by the urban dwellers that were interviewed. Greater
Accra and Ashanti were, however, peculiar in their mention of heavy traffic which could
have been influenced by the situation is Accra and Kumasi respectively.
Regarding place of work, it was quite interesting to find that in 2007 more than 50 percent of
the respondents had their workplace within one kilometre from their residence, but in 2012
this reduced to about 30 percent with some variations in the regions as usual. This is an
indication that with time, more and more urban dwellers are staying farther away from their
workplaces. This may be understood in the context that as the cities and towns expand
spatially, many people may stay farther away from their workplaces or the central business
district, thereby increasing their mobility challenges. In contrast to this, it was found that the
proportion of persons travelling on average 10 minutes to their workplaces increased between
2007 and 2012 which defies common understanding when the distance between their
residence and workplaces is seen to be increasing.
Finally, the results have indicated that urban transport was more reliable in 2007 compared to
2012 as a smaller proportion in 2012 said it was reliable than in 2007 and the reverse was the
case with respect to those who responded that it was not reliable. This was consistent in the
regions and shows that the state has to invest more in addressing the key challenges of urban
transport in the area of heavy traffic that often results from bad and narrow roads and
unreliable public transport system.
90
CHAPTER SEVEN
CONCLUSIONS, RECOMMENDATIONS AND
POLICY IMPLICATIONS
7.1 Summary
This Monograph has examined urbanisation in Ghana against the background of the rapid
pace at which the country has been urbanising since 1960 when a huge proportion of the
country’s population lived in localities classified as rural. Characterised by uneven spatial
distribution of population, urban primacy, slum growth, unemployment, environmental
deterioration and shortage of infrastructure, urbanisation in Ghana has been driven by
differences in natural increase and migration as well as government policies which have
either directly or indirectly affected the concentration of population or otherwise across the
country. While urbanisation is considered an important part of the development process, it
has not led to poverty reduction in Ghana since it brings in its tray its own challenges which
tend to vary spatially. The Monograph, therefore, had the aim of examining urbanisation
within the context of the challenges and opportunities that are associated with it as Ghana
strives to attain a higher middle income status.
The analysis sought to present an overview of the legal and policy frameworks that have
directly or indirectly affected the pattern and trend of urbanisation in Ghana and assessed the
living conditions and socio-economic characteristics of urban dwellers in the country. It also
examined the urban mobility situation in the country and compared it by region to bring out
their similarities and differences.
The 2010 Ghana Population and Housing Census (PHC) was the main source of data for the
analysis. However, the National Household Transport Surveys conducted by the Ghana
Statistical Service in 2007 and 2012 provided additional relevant data to aid an analysis of
urban mobility and the challenges that urban dwellers are confronted with regarding their
intra-city movements. Descriptive statistics based on cross-tabulations using percentages
were adopted in presenting the results of in the Monograph. Comparative analysis was also
adopted to bring out both gender and regional differences in urbanisation. Tables and charts
were used in presenting the results. In addition, Gini Concentration ratios were computed to
examine the degree of uneven distribution of the population in each region.
Reviewing the legal and policy frameworks that affected urbanisation since the pre-colonial
period, it was documented that urbanisation has been a consequence of economic
development and the movement of people from agricultural-based economies to
manufacturing and service-led economies. Ghana, like many African countries, has
experienced rapid urban growth without much industrialisation which is quite different from
that experienced in the advanced countries of Europe and North America. Quite clearly,
therefore, it is possible that economic growth in the rural sector can lead to urbanisation.
However, such a process of urbanisation may not necessarily promote growth depending on
the type of cities that may be created. Consequently, in spite of the rapid urbanisation that
Ghana has experienced, having been influenced by the legal and policy frameworks that have
been put in place, its impact on poverty reduction particularly in the urban centres or

91
localities is limited considering that Ghana is experiencing rapid urbanisation in the face of
slow growth in the manufacturing sector.
Weaknesses in the classification of urban localities that is solely based on population size
have been highlighted with proposals made for the way forward regarding the possibility of
adding other criteria including using the main economic activities a majority of residents is
engaged in, i.e., the functional classification of towns in addition to the population size.
The analysis has brought out important variations between the sex ratios of the urban versus
the rural populations in Ghana, suggesting a higher rate of migration of females into the
urban areas relative to the males. Differences in the age structure of the population between
the urban and rural localities in the country also could be traced to fertility differences where
rural areas exhibit higher fertility rates than the urban.
The trend in urbanisation at the regional level depicted all the regions with the exception of
Western, Central and Greater Accra to record consistent increases in the proportion of their
population living in urban localities since 1960. Greater Accra and Ashanti regions were,
however, the most urbanised with Upper West as the least in 2010. Drivers of urbanisation
included deliberate government policies such as decentralisation and area reclassification,
variation in spatial development in response to natural resource identification and utilisation
as well as natural increase and migration. Natural increase was, however, found to have
contributed more than migration towards urbanisation in all the regions with the exception of
Central and Volta regions. Western, Greater Accra, Ashanti and Brong Ahafo regions were
also found to be net in-migration regions but in the six remaining regions, net out-migration
took place in either 2000 or 2010.
Household conditions and characteristics of the urban population in Ghana were examined by
comparing the sexes and the regions. Overall, literacy was highest in Greater Accra and
lowest in Northern Region. It was also found that males in urban Ghana were more literate
than females. At the same time, males had relatively higher education than females with the
three northern regions being the most disadvantaged. However, literacy in English only was
higher among females than males and also higher in the three northern regions compared to
those in the south. Interestingly, literacy in French was very low among the urban population
in all the regions in the country. Again, most people do not go beyond the secondary school
level of education in the country. The educational gap between males and females was found
to be much wider in the Northern Region, which is an indication that more investment is
required to bridge the gap between males and females.
Half of the population 12 years and older in urban localities in Ghana were ever married with
almost five percent of them in informal or consensual unions. The females reported a higher
proportion married compared to the males, which could be due to the impact of polygyny
which allows one man to be married to more than one woman at the same time, a practice
which was found to be more prevalent in the three northern regions in the country. A higher
proportion of the females than males also reported to be separated, divorced or widowed in
all regions and may be due to a higher re-marriage rate among males than females in Ghana.
Analysis by religion showed a dominance of the Christian Religion with three in every four
persons professing to be Christian. However, the Islamic Religion was more dominant in the
three northern regions. With the exception of Upper West, a higher proportion of the females
were Christians compared to males, but the reverse was the case among those who professed
to be Moslems.
92
Analysis of housing characteristics and conditions revealed the dominance of compound
houses with three of four households reported to be in compound houses in all urban
localities in Ghana. Greater Accra and Ashanti regions were leading in the proportion of
households housed in kiosks and containers, obviously due to the large slum populations in
those two regions. There was, however, a dominance of concrete and cement blocks used to
construct the outer walls of most houses in urban Ghana with the exception of Northern and
Upper East regions where mud brick or earth was the most commonly used material for the
outer wall or floor of the dwelling units. It was also found that as high as 76 percent of the
urban households had one or two rooms for sleeping, a situation which depicted some
overcrowding at the household level.
Pipe-borne water facility for drinking was not universal in all urban localities in Ghana with
one-third of the urban households not having access to piped water facility either within or
outside the household dwelling unit. The three northern regions were the most disadvantaged.
Some 14 percent of urban households also used sachet water for drinking in the country. At
the same time, only a quarter of urban households in the country used their own separate
bathrooms, the remaining three-quarters sharing bathrooms while other households
patronised public bathrooms or using open spaces outside the house. Furthermore, only one-
fourth of the urban households reported to have access to water closet (WC) toilet facilities at
the household level.
The collection of solid waste was not universal in urban Ghana as only one-fifth of urban
households reported their solid waste to be collected while the rest dumped them at
designated public dumps/containers and others used open spaces. Liquid waste disposal also
showed a limited use of the sewerage system which was less than five percent, suggesting
that the sewerage system is not well developed in most urban localities in the country,
permitting many households to throw their liquid waste unto the street or outside the house.
Urban household energy use was quite high (80 percent on average) but varied very much
across the regions with some of the households using flashlights and torches while LPG for
household cooking was used by less than a third of urban households in Ghana. There was,
therefore, a high dependence on charcoal and wood for cooking with long-term negative
implications for the country’s forest resources. Many households also did not have separate
spaces for cooking and thereby used the veranda or open spaces in the house which could
have serious implications for fire out-breaks.
The analysis further showed that the private informal sector is the highest employer of the
active labour force in all the regions in the country with the public sector engaging less than
10 percent of the urban employed population. A higher proportion of males than females
were also working in the public sector. Again, only limited proportions of the employed
persons in urban localities were engaged in manufacturing while wholesale and retail trading
activities constituted the largest employer with regional variations.
Household ownership of computers was quite low with just a little more than one in 10 urban
households responding to own a computer. A similar proportion of urban dwellers also
reported to have access to the internet. The regional variation indicated that Greater Accra
and Ashanti regions ranked the highest in either household computer ownership or internet
access while Volta Region ranked the lowest in computer ownership with Northern Region
recording the least proportion with access to the internet.

93
In contrast to computer ownership, a much higher proportion of urban dwellers owned a
mobile phone which stood at more than 50 percent in all the regions with the exception of
Northern Region. More males than females also owned mobile phones. Ownership of fixed
phone lines was, however, very low and was less than five percent in all regions except in the
Greater Accra.
The results of the analysis of urban mobility generally indicated some improvements in
mobility relative to both distance travelled from residence to school and the average time
spent commuting to school. This is an indication that public transport system in Ghana’s
towns and cities has somewhat improved with relatively higher proportions of persons
travelling over shorter distances and waiting for shorter periods for transport to go to school
in 2012 compared to 2007. It appears that the introduction of the Metro Mass Transit services
in the cities and towns which allowed all school children in uniforms to board public buses
freely to and from school in the country has contributed immensely to this development.
The analysis further suggested that heavy traffic on the urban roads were a big difficulty in
2007, but in 2012, bad roads was considered the most serious challenge. Interesting results
were also recorded with respect to average distance to health facility. There were variations
between 2007 and 2012, where a far smaller proportion of the urban dwellers in 2012 said the
average distance to a health facility was less than one kilometre compared to 2007.
Furthermore, urban residents were spending longer time waiting for transport to go to a
health facility in 2012 than in 2007. Bad roads in the cities and towns, difficulty in getting
vehicles and long waiting time for transport were also mentioned as some of the major
transport difficulties urban dwellers reported to be facing. Heavy traffic was, however,
peculiar to Greater Accra and Ashanti regions.
It was also found that more than 50 percent of the urban dwellers that were interviewed in
2007 had their workplace within one kilometre from their residence. However, in 2012 this
reduced to about 30 percent with some variations in the regions. On the other hand, an
increase was recorded in the proportion of persons travelling on average 10 minutes to their
workplaces between 2007 and 2012. Urban transport appeared to be more reliable in 2007
than in 2012 considering that the proportion that said transport was reliable in 2012 was
higher than in 2007 while the reverse was recorded regarding those who responded that it was
not reliable. These findings present important policy implications for further action through
interventions.
7.2 Conclusions
Several important conclusions flow from the findings presented in this Monograph based
upon which policy recommendations and implications are postulated. These include the
uneven spatial distribution of the population in Ghana as a whole and specifically the urban
areas. This also translates into a variation in the degree and pace of urbanisation by region in
the country. Overall, urbanisation has been quite rapid but varies across the ten regions in the
country.
Different factors have been responsible for the pattern and trend of urbanisation in Ghana.
Natural increase is, however, a very important contributor to urbanisation in comparison with
internal migration. Therefore, so long as there are regional variations in fertility and
migration, urbanisation is likely to vary by region. Government and administrative policies
have also influenced and shaped the pattern of urbanisation either directly or indirectly.
Interestingly, unlike other developed countries, urbanisation is proceeding in the face of

94
limited manufacturing. Consequently, urbanisation has not contributed much to poverty
reduction among the population considering the myriad of challenges that confront the urban
economy today.
Literacy and education among urban dwellers tend to vary between males and females with
the latter being more disadvantaged. The three northern regions are also more disadvantaged
compared to their counterparts in the south.
Materials used for the construction of household dwellings which were found to be largely
compound houses are generally of higher quality but the three northern regions appear to lag
behind the other regions in the country. There are also diverse sources of water for drinking
in Ghana as pipe-borne water is not available to every urban household. Water closet toilet
facility accessibility is limited to many households and it will take some time for half of the
households in urban areas to access water closet at the household level. Linked to this is the
limited use of solid waste disposal by collection.
Furthermore, electricity use is not universal among urban households in Ghana. At the same
time, there is limited use of LPG as a source of cooking fuel, thereby making many urban
households depend on charcoal and wood which are the most commonly used sources of
household cooking fuel in the urban localities in the country.
In addition, there is a clear variation between males and females regarding their sectors of
employment in the urban areas. Although the private informal sector is the biggest employer
of urban labour force, relatively higher proportions of employed males were in the public
sector than females perhaps due to differences in education which place females at a
disadvantage.
Again, notwithstanding the high levels of urbanisation Ghana has seen in the recent past, use
of ICTs is low as a result of the low ownership of computers and internet access. Considering
the impact of ICTs on a country’s socio-economic development, efforts must be made to
accelerate its use in the country. The government must support the building of infrastructure
and create an enabling environment for individuals and businesses to take advantage of the
opportunities that ICT offers.
In addition, in spite of obvious improvements recorded between 2007 and 2012 with respect
to urban transport, there were still challenges posed to urban mobility that ought to be
addressed through policy actions. One important intervention, however, is the Metro Mass
Transit System that has assisted daily commuters in urban areas to undertake their socio-
economic activities. The need to expand such urban transport services without doubt requires
government’s priority attention.
Finally, the classification of urban localities based solely on population size presents
weaknesses which require a re-definition. This is because it is not enough to attain an urban
status simply by increasing population size without any signs of an urban economy.
Currently, many urban localities in Ghana have nothing urban about them except their large
population sizes.
7.3 Policy Recommendations
The conclusions presented call for a number of recommendations. The implementation of
these recommendations should, however, take into account the regional variations in the
results that have so far been documented in this Monograph.

95
Government must prioritise and increase its budgetary allocation to local authorities to enable
them meet the cost of providing services to their growing populations particularly in the
urban areas. This must be accompanied by greater accountability and citizens’ participation
to ensure funds are applied for the very purpose for which they are released.
Ghana does not lack in the availability of well-formulated policies and programmes. The
ability of government to implement these policies will go a long way to address the
challenges of urbanisation. The implementation of these policies and programmes need to be
supported with the requisite political will as well as with adequate financial, human and
technical resources. To this end, the relevant organisations and institutions should be
strengthened to effectively implement policies that have already been formulated. More
specifically, the 2012 National Urban Policy which was launched in 2013 should be
implemented to the letter. Similarly, the process that has recently been initiated to revise the
1994 National Population Policy (Revised Edition) should be supported to integrate the
urbanisation dynamics into the new policy while strengthening implementing agencies to
discharge their mandate effectively. Consequently, population management should be seen as
a critical component of sustainable development. This calls for intensification of programmes
that establish functional linkages between rapid population growth and development such as
the national family planning programme.
The national campaign towards universal LPG use should be intensified and ways found to
subsidise its use for household use relative to commercial usage by transport owners. This
will no doubt reduce the country’s dependence on the environment for their household energy
use.
The private informal sector which is the biggest employer of urban economically active
labour force should be strengthened and supported through micro finance facilities to expand
to provide more jobs for jobless unemployed youth in the urban areas in Ghana. This is the
case as the public sector is incapable to absorbing the labour force the nation turns out each
year.
Urban mobility should be made smooth through the expansion of existing public transport
systems such as the Metro Transit Mass Transport system. Government should also make it a
policy to develop and expand intra-city urban railway system in the country to ease urban
mobility challenges. Concrete efforts should also be made to integrate population dynamics
into urban spatial planning in order to ensure that urban roads are large enough to forestall
future heavy traffic that slows down movement.
Furthermore, policies regarding the provision of modern toilet facilities such as WC should
be enforced. The Metropolitan, Municipal and District Assemblies (MMDAs) should
strengthen their monitoring units to ensure that no new buildings are permitted without
evidence of a modern toilet facility. Steps should also be taken to assist existing housing units
to create modern toilet facilities within the existing structures.
Availability of current and high quality data are important for an understanding of population
dynamics including urbanisation. Efforts must, therefore, be made to improve relevant data
collection activities in the country. Government agencies such as the Town and Country
Planning Department and MMDAs must be resourced to enable them collect, analyse and
utilise data for urban planning and management. It is also necessary for government to
support the further analysis of available data from national population and housing censuses

96
and other surveys to provide government with the much needed information to inform
decision-making processes and policy actions.
As was discussed earlier in this Monograph, the statistical classification of an urban centre in
Ghana as a locality with a population of 5,000 or more lends itself to some weaknesses. It is
strongly recommended that the Ghana Statistical Service in consultation with government
and other stakeholders should consider re-defining an urban locality using not only the
population size but other factors such as the major economic activity a majority of the
population is engaged in. A national stakeholders and experts forum should be convened for
this purpose.
7.4 Policy Implications
The entire developing world is in transition and Ghana is no exception with more than 50
percent of its population residing in localities classified as urban. The rapid rate of
urbanisation has implications for economic growth and sustainable development of the
country. Urbanisation and urban growth processes play important roles in the economic and
demographic transition of the country and it is important that sound and favourable policies
are put in place to harness the benefits of this urban growth.
The country’s urban transition which pre-dates the colonial administration and has persisted
to date will require pragmatic and sustained efforts to curb the associated challenges that have
been highlighted in this Monograph. From the evidence so far presented, the pattern of
urbanisation in Ghana has been skewed with indications of urban primacy. The urban
infrastructure in the cities and towns of the country also shows a non-uniform pattern and
varying spatial development across the regions in the country. Examining the policy
implications of the recommendations presented is an important step towards realising the
benefits of urbanisation for the country’s development.
Strengthening local authorities through effective budgetary allocation for the provision of
services for the benefit of the growing urban population has the potential to enhance the
quality of life of the people. Efforts must, therefore, be made to regulate urban growth and
spatial distribution of the population in the country. Accelerating fertility decline will
ultimately reduce both the stock of potential migrants and the rates of natural population
increase in the cities, towns and potential urban localities. A variety of explicit fiscal
measures to stimulate economic activity in all parts of the country especially regions that
have characteristically been net out-migration regions must be adopted and implemented to
re-direct migration flows. In addition, the adoption and implementation of the Draft
Migration Policy is likely to strengthen efforts towards re-directing migration to where it is
mostly needed for development.
Improving living conditions of urban dwellers has the implication of reducing poverty levels
in the whole country considering the linkage between urban and rural communities in the
country. As Ghana moves toward a higher middle-income status, urbanisation processes are
more likely to have positive impacts on the poverty situation in the country. However, as the
population in urban localities increases, the absolute numbers of people living in poverty may
rise in the urban areas relative to the rural areas. More attention may be drawn to addressing
urban poverty challenges to the neglect of rural communities which could also be disastrous
and should be guarded against.
97
Reducing the inequalities among urban dwellers with respect to literacy, education, health,
and access to income between males and females must be key to changing the fortunes of the
urban dwellers. Strengthening institutions for the effective implementation of urban-specific
policies would go a long way to addressing the development inequalities that exist between
urban and rural localities. The National Urban Policy that was adopted in 2012 should be a
pivotal policy document around which the country’s development efforts should be centered
and its implementation must be prioritised. The policy with its accompanying Action Plan has
been well crafted through a broad stakeholder analysis and seeks to address the fundamental
problems associated with urban development and management in the country that have for a
long time plagued the country.
Lessons from Ghana’s recent history have shown that, formulating progressive policies,
passing laws and establishing institutions and agencies for implementation are not enough to
harness the potential of urbanisation or to ensure integrated urban development. These broad
policy aspirations and sectoral programmes (e.g., for education, health, housing, transport,
schools, etc.,) must be translated into workable strategies that align with the long-term vision
of a better quality of life for the population and must be financially supported so that they can
achieve their intended goals.
Effective enforcement of urban planning policies including intensifying campaigns on LPG
use for household cooking is likely to positively affect livelihoods in the urban areas and also
save our fragile environment from further deterioration. This, however, calls for the
strengthening of law and policy enforcement agencies and institutions in the country
particularly at the local and community level.
Rapid urbanisation will continue to be accompanied by challenges but available current and
high quality data have positive implications for the country’s ability to analyse the challenges
and be able to address them through carefully conceived and formulated policies that are
implementable. In addition to the regular censuses and national demographic and health
surveys, the organisation of regular migration surveys would improve the data situation in the
country to facilitate effective analysis and monitoring of urbanisation in the country so as to
be able to address its associated challenges which include urban primacy, slum growth, poor
housing, overcrowding, poverty, unemployment, environmental deterioration, sanitation and
shortage of infrastructure and facilities.

98
REFERENCES
Adarkwa K. K., 2012. “The changing face of Ghanaian towns” African Review of Economics
and Finance. Vol. 4, No. 1.
Anarfi, J.K. and Kwankye, S.O. (eds)., 2009. Independent child migration in Ghana. ISSER,
Accra, Ghana, pp. 132-170.
Anyinam, C., 1994, Spatial implications of structural adjustment in Ghana. Tijdschrift voor
Economische en Sociale Geografie, 85, (5), pp. 446- 60.
Bawa, S. D., 1995, Structural Adjustment Programmes and the Urban Informal Sector in
Ghana, Issues in Development, Discussion Paper 3, Geneva: International Labour
Organization.
Brown, C.K., 1986. “Urban Bias and Rural Development in Ghana”. Rural Development in
Ghana, edited by Brown, C.K. Ghana Universities Press, Accra, pp. 201-219.
Collins, J., 2004. “Transactions of the historical Society of Ghana” New Series, No. 8, pp.
208-226.
Coquery-Vidrovitch, C., 1991. The process of urbanization in Africa (From the origins to the
beginning of independence). African Studies Review 34(1): 1-98.
Dickson, K. B., 1968. Background to the problem of economic development in Northern
Ghana. Anals of the Association of American Geographers. Vol 58 pp. 686-696
Dickson, K. B., 1970. Urbanisation in precolonial Ghana. Annual Museum Lectures 1969-
1970, Accra. Ghana
Dickson, K. B., 1971. The Ghanaian town, its nature and function, Accra. Ghana Universities
Press.
Ghana Statistical Service. 1995. Analysis of Demographic Data, Vol. 2, Detailed Analysis
Reports, Accra. Ghana.
Ghana Statistical Service. 2005. Population data Analysis Report. Vol. 2. Policy implications
of population trends. Accra. Ghana Statistical Service.
Ghana Statistical Service. 2013. 2010 Population and housing census: National analytical
report. Accra. Ghana Statistical Service.
Government of Ghana, 2005, Draft National Housing Policy, Accra: Ministry of Water
Resources, Works and Housing.
Government of Ghana, 2012, National Urban Policy Framework, Accra. Ministry of Local
Government and Rural Development.
Grant R. and Yankson P. 2002. City Profile: Accra. Cities 20 (1) 65-74.
Gugler, J. and Flanagan, W. G., 1978. Urbanization and social change in West Africa.
Cambridge University Press, Cambridge.
99
International Labour Organisation (ILO)/Jobs and Skill Programme for Africa (JASPA).
1989. From redeployment to sustained employment generation: Challenges for Ghana
Programme of Economic Recovery and Development. Addis Ababa.
Jedwab, R. (nd). Why Is African Urbanization Different? Evidence from resource exports in
Ghana and Ivory Coast. PSE and LSE. JOB MARKET PAPER.
King, A.D., 1990. Urbanism, Colonialism, and the World-Economy: Cultural and Spatial
Foundations of the World Urban System. Routledge, London.
Kunateh, M.A., 2011 Ghana: FDI Inflows to Country up in 1st quarter of 2011. in
Mehretu, A., 1983. Cities of Sub-Saharan Africa. In: S. D. Brunn and J. F. Williams, eds.,
Cities of the World. Harper & Row, New York, pp. 243-279.
Njoh Ambe, J., 2007. Planning Power: Town Planning and Social Control in Colonial Africa.
University College London Press, London.
Obeng-Odoom, F., 2007, Enhancing urban productivity in Africa’, Social Science Research
Network, Opticon 1826 Journal, Vol. 2, No. 1, pp 1-9.
Obirih-Opareh, N., 1998, Evaluation of local government reform in Ghana: From colonial
roots to the present’, Report to the National Institutional Renewal Programme.
Olatunbosun, D., 1976. “Rural Development in Africa – An Integrated Approach”. Paper
presented at The Rural Development in Africa International Workshop, Organised by
the Commonwealth Secretariat, 10th - 18th April, University of Ibadan, Nigeria.
Owusu, G., 2005. Small Towns in Ghana: Justification for their inclusion under Ghana’s
Decentralisation Programme. African Studies Quarterly. Vol 8.
Post, J., 2001, Urban development and policy reform in Ghana’ in Adarkwa, Kwafo K. and J.
Post (eds.) Fate of the Tree, Accra: Woeli Publishing Services, pp. 17-23.
Quarcopome. S.S., 1992: Urbanisation, Land Alienation and Politics in Accra. Research
Reviews, NS Vol. 8, nos. 1 &2.
Radoki C., 1997. (ed.) Global forces, urban change and urban management in Africa in The
urban challenge in Africa: Growth and management of its large cities. Tokyo. United
Nations University Press.
Rakodi, C., 1992. Urbanization in Zambia. Papers in Planning Research, Department of City
and Regional Planning, University of Wales, Cardiff.
Songsore, Jacob, (1979), Structural Crisis, Dependent Capitalist Development and Regional
Inequality in Ghana, (ISS Occasional Papers, No. 71, The Hague).
Songsore. J. (nd). The urban transition in Ghana: Urbanization, national development and
poverty reduction. Prepared for the IIED as part of the eight country case studies on
urbanization.
Songsore, Jacob. 2009. The urban transition in Ghana: Urbanisation, National Development
and Poverty Reduction. Draft report to be presented at the IIED-UNFPA research
meeting on population and urbanization issues, London.

100
Songsore J., 2003. Towards a better understanding of Urban Change: Urbanisation, National
Development and Inequality in Ghana. Ghana Universities Press.
Songsore J., 2010. From everyday risks to disaster risks: Confronting ‘brown’ and ‘green’
issues in Ghana’s human settlements. Accra. Ghana Academy of Arts and Sciences.
Tawiah, E.O., 1995. Demographic Patterns and Sustainable Development in Ghana. Legon:
Regional Institute for Population Studies.
Tetteh, P.A., 1992. Population distribution and development planning in Ghana. Regional
Institute for Population Studies. Monograph Series No. 7, pp. 129-170
Yankson, P.W.K., 2006. Urbanisation Industrialisation and National Development:
Challenges and Prospects of Economic Reform and Globalisation. Ghana. Ghana
Universities Press.
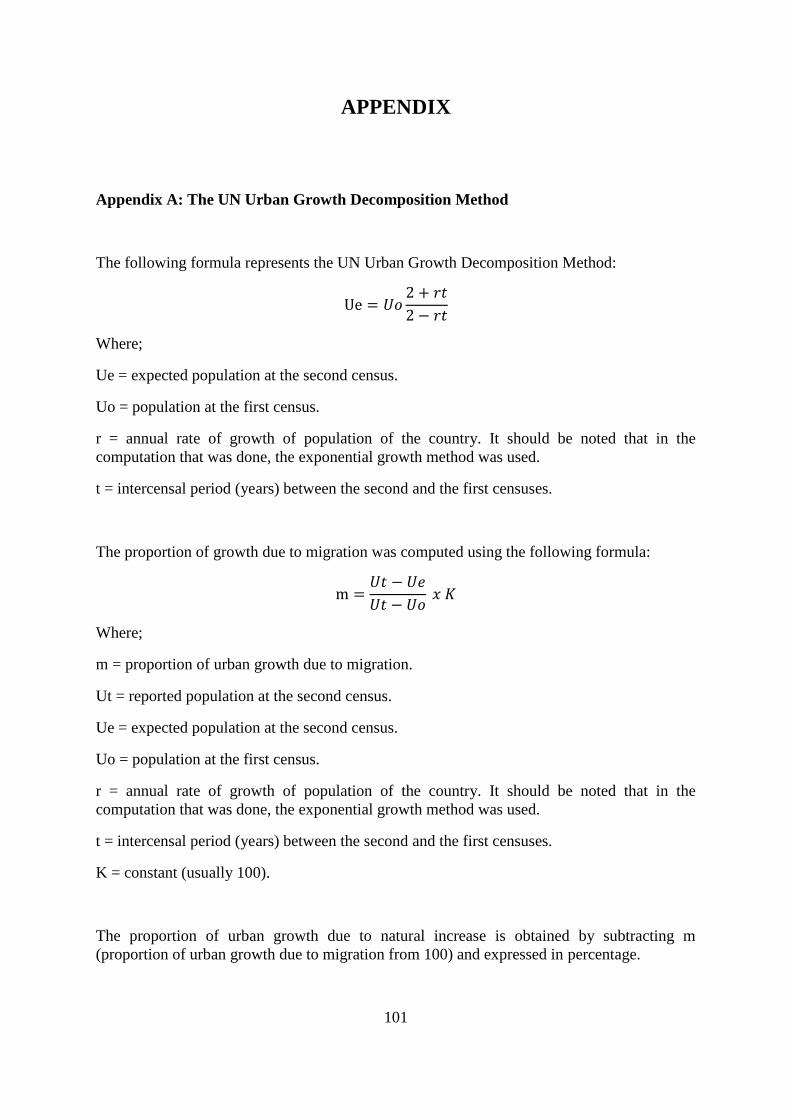
101
APPENDIX
Appendix A: The UN Urban Growth Decomposition Method
The following formula represents the UN Urban Growth Decomposition Method:
Ue = 𝑈𝑜2 + 𝑟𝑡
2 − 𝑟𝑡
Where;
Ue = expected population at the second census.
Uo = population at the first census.
r = annual rate of growth of population of the country. It should be noted that in the
computation that was done, the exponential growth method was used.
t = intercensal period (years) between the second and the first censuses.
The proportion of growth due to migration was computed using the following formula:
m =𝑈𝑡 − 𝑈𝑒
𝑈𝑡 − 𝑈𝑜 𝑥 𝐾
Where;
m = proportion of urban growth due to migration.
Ut = reported population at the second census.
Ue = expected population at the second census.
Uo = population at the first census.
r = annual rate of growth of population of the country. It should be noted that in the
computation that was done, the exponential growth method was used.
t = intercensal period (years) between the second and the first censuses.
K = constant (usually 100).
The proportion of urban growth due to natural increase is obtained by subtracting m
(proportion of urban growth due to migration from 100) and expressed in percentage.
Top Related