


Languages
Pages
Legal


The effect of improved hand hygiene compliance on nosocomial transmission of Staphylococcus aureus
Veronica Weterings1
J. van Esser1
R. van Etten1
J. Kluytmans1,2
ICPIC13-ABS-1497
1Amphia hospital Breda, Netherlands2VU university medical center Amsterdam,
Netherlands

I MINDInnovation in Microbiology and Infection control by New Design (I MIND)

I MIND
Aim to investigate the effect of improved hand hygiene compliance on nosocomial transmission between patients

I MIND
• September 2011 – December 2012• 32-bed oncology unit
• Nursing team• 35 nurses• 6 student nurses• 1 head nurse

Study design

I MIND: Intervention study
[0] Pre intervention
Sept. ‘11 Dec. ‘11 Jan. ‘12 Apr. ‘12 Aug. ‘12 Dec. ‘12

I MIND: Intervention study
[0] Pre intervention
[I] Increase numberof handalcohol
dispensers
Sept. ‘11 Dec. ‘11 Jan. ‘12 Apr. ‘12 Aug. ‘12 Dec. ‘12

Intervention [I]
Bathroom
Patient roomEntrance Lock room
Room for protective isolation

I MIND: Intervention study
[0] Pre intervention
[I] Increase numberof handalcohol
dispensers
[II] Education
Sept. ‘11 Dec. ‘11 Jan. ‘12 Apr. ‘12 Aug. ‘12 Dec. ‘12

I MIND: Intervention study
[0] Pre intervention
[I] Increase numberof handalcohol
dispensers
[II] Education
Sept. ‘11 Dec. ‘11 Jan. ‘12 Apr. ‘12
[III] New dispensers
Aug. ‘12 Dec. ‘12
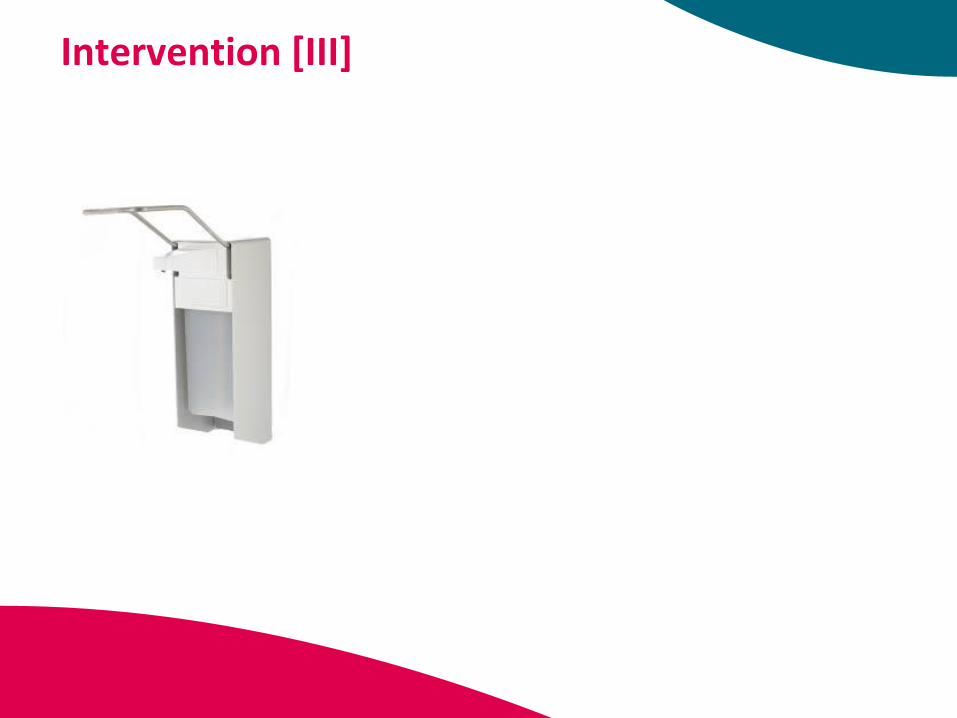
Intervention [III]

Badge
Data Collection Point (DCP)
Saves all hand hygiene moments• Dispenser no.• Liquid (soap/hand alcohol)• Time stamp
(Incl. badge no.)
Intervention [III]

I MIND: Intervention study
[0] Pre intervention
[I] Increase numberof handalcohol
dispensers
[II] Education
Sept. ‘11 Dec. ‘11 Jan. ‘12 Apr. ‘12
[III] New dispensers
[IV] Individual feedback
Aug. ‘12 Dec. ‘12

Intervention [IV]
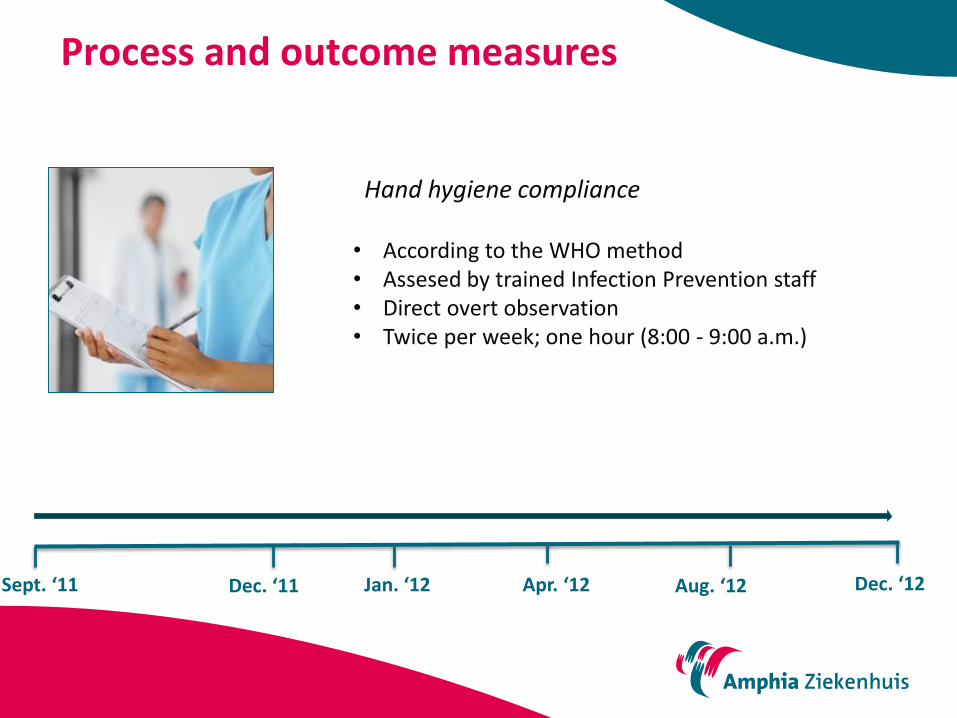
Process and outcome measures
Sept. ‘11 Dec. ‘11 Jan. ‘12 Apr. ‘12 Aug. ‘12 Dec. ‘12
• According to the WHO method• Assesed by trained Infection Prevention staff• Direct overt observation • Twice per week; one hour (8:00 - 9:00 a.m.)
Hand hygiene compliance

Process and outcome measures
Sept. ‘11 Dec. ‘11 Jan. ‘12 Apr. ‘12 Aug. ‘12 Dec. ‘12
Nosocomial transmission of S. aureus
• All hospitalised patients cultured weekly• Nose swab• Nasal carriage of S. aureus
• Strains were typed using AFLP

Results

Hand Hygiene compliance

Hand Hygiene compliance
Sessies
HHC%
Pre intervention[212/426; CI 44.9- 54.6]
49.8%

Hand Hygiene compliance
Sessies
HHC%
Pre intervention[212/426; CI 44.9- 54.6]
49.8%

Hand Hygiene compliance
Sessies
HHC%
49.8%
Increase dispensers[98/249; CI 33.2-45.7]
39.4%

Hand Hygiene compliance
Sessies
HHC%
49.8% 39.4%
Education[92/302; CI 25.3-36.0]
31.5%

Hand Hygiene compliance
Sessies
HHC%
49.8% 39.4%
New dispensers[196/436; CI 40.2-49.8]
31.5% 45.0%

Hand Hygiene compliance
Sessies
HHC%
49.8% 39.4%
Feedback[197/386; CI 45.9-56.1]
31.5% 45.0% 51.0%

Nosocomial transmission S. aureus

Nosocomial transmission S. aureus
Sessies
HHC%
49.8% 39.4% 31.5% 45.0% 51.0%
p<0,001

Nosocomial transmission S. aureus
Intervention period Education Feedback
Total patient populationon days of culture
266 298
S. aureus carriage

Nosocomial transmission S. aureus
Intervention period Education Feedback
Total patient populationon days of culture
266 298
Nasal swabs 246 (92.5%) 263 (88.2%)
Unique patients 141 (57.3%) 160 (60.8%)
S. aureus carriage

Nosocomial transmission S. aureus
Intervention period Education Feedback
Total patient populationon days of culture
266 298
Nasal swabs 246 (92.5%) 263 (88.2%)
Unique patients 141 (57.3%) 160 (60.8%) #
S. aureus isolates• Unique patients• % carriage unique pat.
6342
29.8%
5345
28.1% #
S. aureus carriage
# Not significant

Nosocomial transmission S. aureus
Intervention period Education Feedback
S. aureus isolates• Unique patients
6342
5345
Amplification Fragment Length Polymorphism (AFLP)
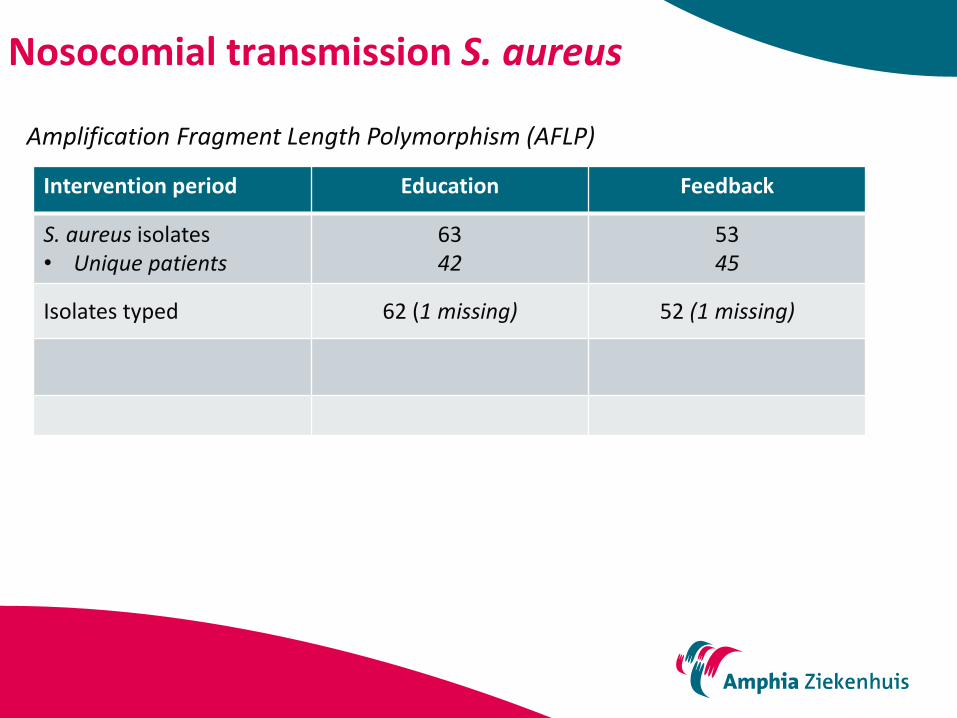
Nosocomial transmission S. aureus
Intervention period Education Feedback
S. aureus isolates• Unique patients
6342
5345
Isolates typed 62 (1 missing) 52 (1 missing)
Amplification Fragment Length Polymorphism (AFLP)

Nosocomial transmission S. aureus
Intervention period Education Feedback
S. aureus isolates• Unique patients
6341
5345
Isolates typed 62 (1 missing) 52 (1 missing)
Unrelated isolates 7 20
Amplification Fragment Length Polymorphism (AFLP)

Nosocomial transmission S. aureus
Intervention period Education Feedback
S. aureus isolates• Unique patients
6341
5345
Isolates typed 62 (1 missing) 52 (1 missing)
Unrelated isolates 7 20
AFLP Clusters 13 9
Amplification Fragment Length Polymorphism (AFLP)

Nosocomial transmission S. aureus
Intervention period Education Feedback
S. aureus isolates• Unique patients
6341
5345
Isolates typed 62 (1 missing) 52 (1 missing)
Unrelated isolates 7 20
AFLP Clusters- min, max - median
132-14 isolates
3 isolates
92-7 isolates3 isolates
Amplification Fragment Length Polymorphism (AFLP)
AFLP cluster ≠ nosocomial transmission!

For example:
AFLP Cluster Total isolates Unique patients Transmission?
A 2 1 No
B 11 6 Yes
Nosocomial transmission S. aureus

For example:
AFLP Cluster Total isolates Unique patients Transmission?
A 2 1 No
B 11 6 Yes
Nosocomial transmission S. aureus
Transmission index (TI)

Transmission Index (TI)
Primary cases + unrelated isolates
TI:Secundary cases
Transmission Index is the ratio between primary cases and secundary cases

Calculate primary and secundairy cases
For example:
AFLP Cluster
Total isolates Unique patients Primarycase
SecundaryCase(s)
A 2 1 1 0
B 11 6 1 5

Transmission Index (TI)
Intervention period Education Feedback
Primary cases + unrelatedisolates
20 29

Transmission Index (TI)
Intervention period Education Feedback
Primary cases + unrelatedisolates
20 29
Secundairy cases 22 17

Transmission Index (TI)
Intervention period Education Feedback
Primary cases + unrelatedisolates
20 29
Secundairy cases 22 17
Transmission index 1,1 (22/20) 0,6 (17/29)

Transmission Index (TI)
Intervention period Education Feedback
Primary cases + unrelatedisolates
20 29
Secundairy cases 22 17
Transmission index 1,1 (22/20) 0,6 (17/29)
An improvement of HHC from 31.5% to 52.9% (RR: 1.48; CI 1.18-1.87)
was associated with a 41% reduction of the TI

Conclusion

Conclusion
Improvement of hand hygiene compliance - using automatic dispensers - reduces the transmission of S. aureus in the hospital.

Acknowledgment
• Collegues from the Laboratory for microbiology and Infection control, in particular:
– Esther Weterings
– Marie Louise van Leest
• Health care workers of the oncology department
• Marjolein Kluytmans (Amphia Academy Infectious Disease Foundation)
• Dr. Robert Roosendaal; Medical Microbiology and Infection Control, VU university medical center Amsterdam

You cannot change what you
don’t acknowledge.
Dr. Phil

Nosocomial transmission S. aureus
Intervention period Education Feedback
Duration 10 weeks 14 weeks
Total patient population on days of culture 266 314
Unit occupancy rate 83,1% 70,1%
Total days hopitalized, on DOC
9,3 10,5
Mean age 65 66
Female 51,8% 68,8%*
General information
* Sign diff
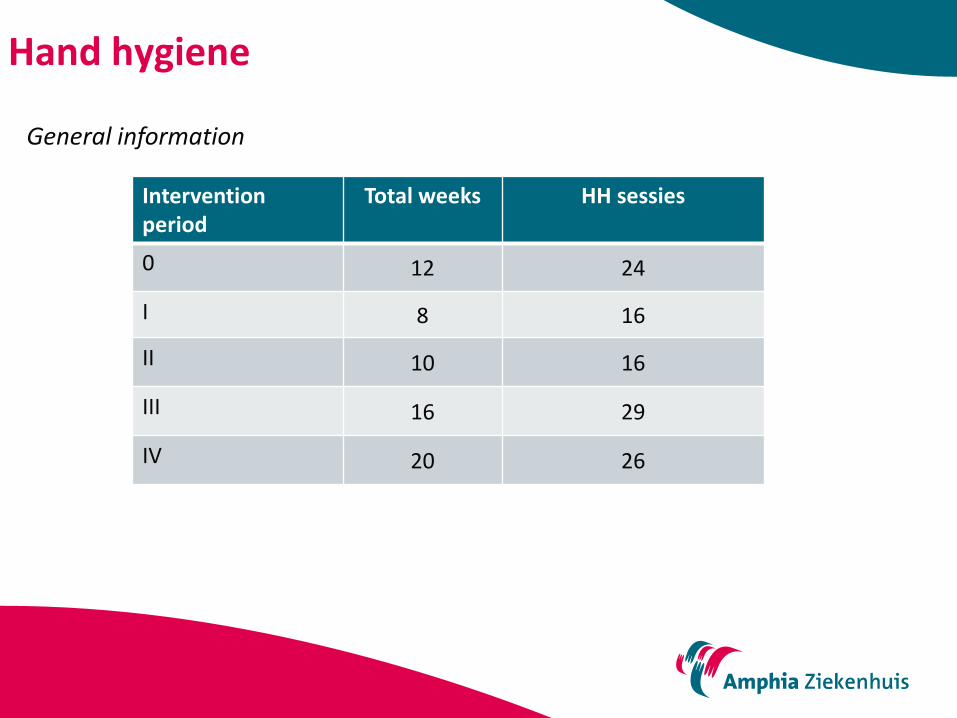
Hand hygiene
Interventionperiod
Total weeks HH sessies
0 12 24
I 8 16
II 10 16
III 16 29
IV 20 26
General information
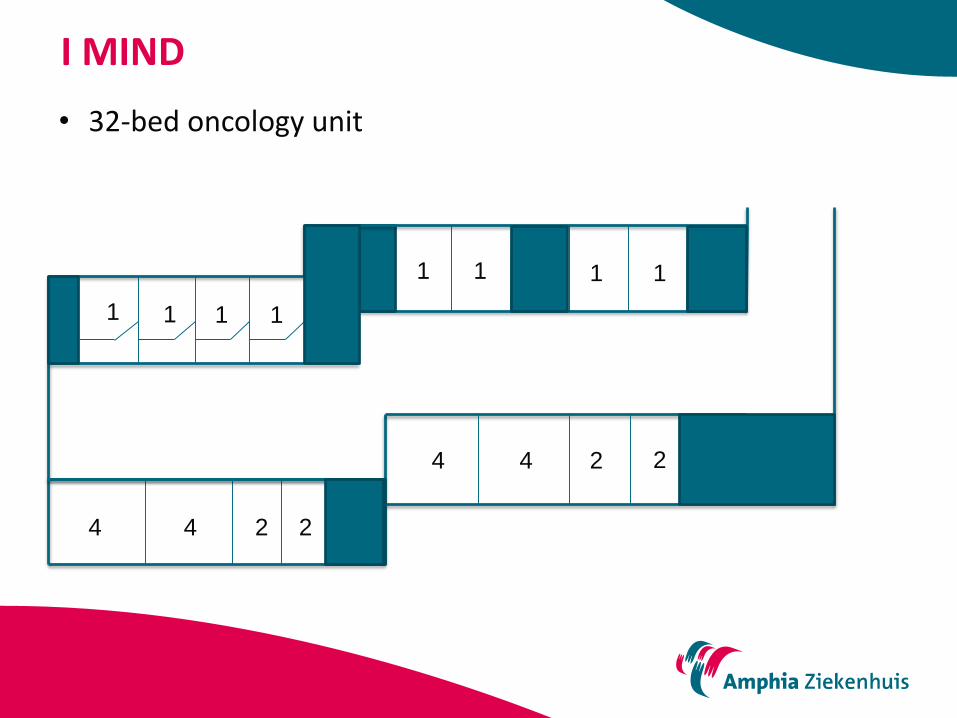
I MIND
• 32-bed oncology unit
1
4
1 1 1
4
44
1111
22
22

Hand Hygiene Management System

Hand Hygiene Management System
Top Related