


Languages
Pages
Legal


IAGP Neuquen 2008
Production Maintenance in Mature fields
How Monitoring Impacts Production…

2 - IAGP Neuquen 2008
Introduction
• Mature fields require an intensive monitoring in order to:
Understand the field behavior.
Characterize the reservoir
Detect opportunities to increase production and reserves workovers, stimulations, perforations, loops,
fractures, etc
Adjust dynamic models to provide accurate production forecasts and justify new projects
• BUT monitoring must be carefully chosen and followed from the very beginning of field
life
• “To much info kills info” each field requires a dedicated monitoring plan
• Operating costs must be kept under control as production is declining get the right data at the right time
• Examples of specific monitoring actions that had impact on production and reserves
Aguada Pichana: new fracture methodology adapted to heterogeneously depleted reservoir
San Roque: well performance actions to fill a production gap
3 - IAGP Neuquen 2008
Neuquen Basin – Aguada Pichana BlockNeuquen Basin – Aguada Pichana Block
SCHEMATICSCHEMATIC SECTIONSECTIONPrecuyo
Molles
Lajas
Auquilco + Lotena
Tordillo
Mulichinco
Agrio
Rayoso+
Huitrin
CR
ET
AC
EO
US
JUR
AS
SIC
Quintuco+
Vaca Muerta
Precuyo
Molles
Lajas
Auquilco + Lotena
Tordillo
Mulichinco
Agrio
Rayoso+
Huitrin
CR
ET
AC
EO
US
JUR
AS
SIC
Quintuco+
Vaca Muerta
Neuquen Basin Neuquen Basin
Sedimentary columnSedimentary column
Permeable Sandstones
Low – Very Low Permeability Sandstones
Low Permeability Sandstones (high Microporosity)
Shale to non reservoir Siltstone
Limestone to Calcareous Sandstone
Low Permeability Sandstones (high Microporosity-Aeolian Facies)
Sequence Boundary
ReferencesReferencesPermeable Sandstones
Low – Very Low Permeability Sandstones
Low Permeability Sandstones (high Microporosity)
Shale to non reservoir Siltstone
Limestone to Calcareous Sandstone
Low Permeability Sandstones (high Microporosity-Aeolian Facies)
Sequence Boundary
Permeable Sandstones
Low – Very Low Permeability Sandstones
Low Permeability Sandstones (high Microporosity)
Shale to non reservoir Siltstone
Limestone to Calcareous Sandstone
Low Permeability Sandstones (high Microporosity-Aeolian Facies)
Sequence Boundary
ReferencesReferences
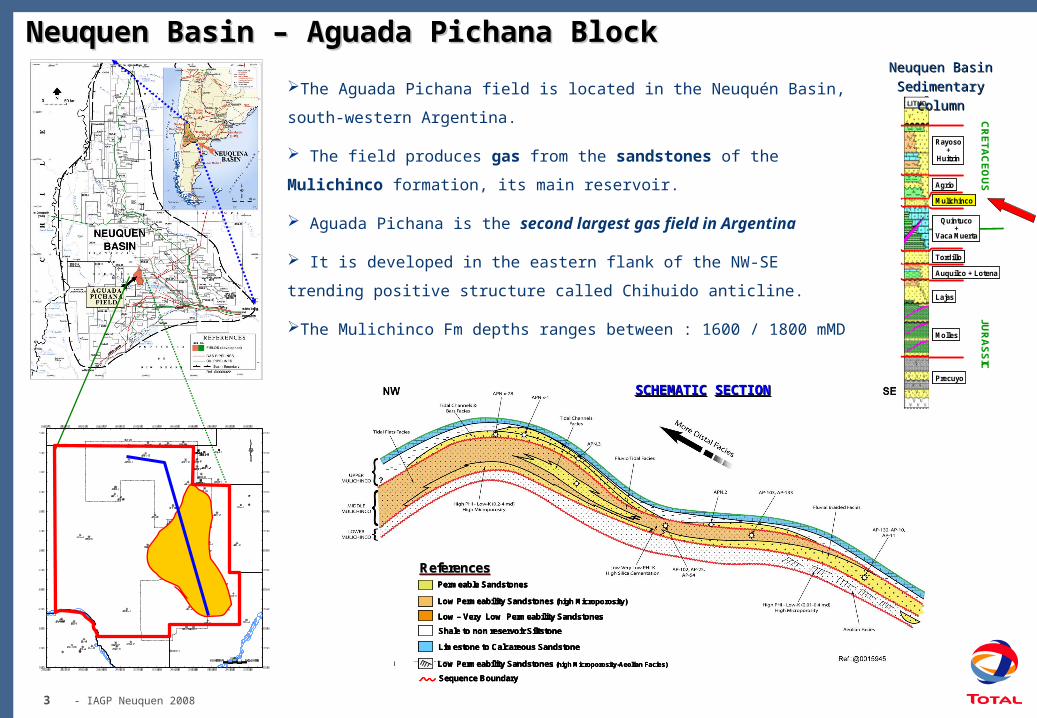
The Aguada Pichana field is located in the Neuquén Basin, south-western
Argentina.
The field produces gas from the sandstones of the Mulichinco formation, its
main reservoir.
Aguada Pichana is the second largest gas field in Argentina
It is developed in the eastern flank of the NW-SE trending positive structure
called Chihuido anticline.
The Mulichinco Fm depths ranges between : 1600 / 1800 mMD
4 - IAGP Neuquen 2008
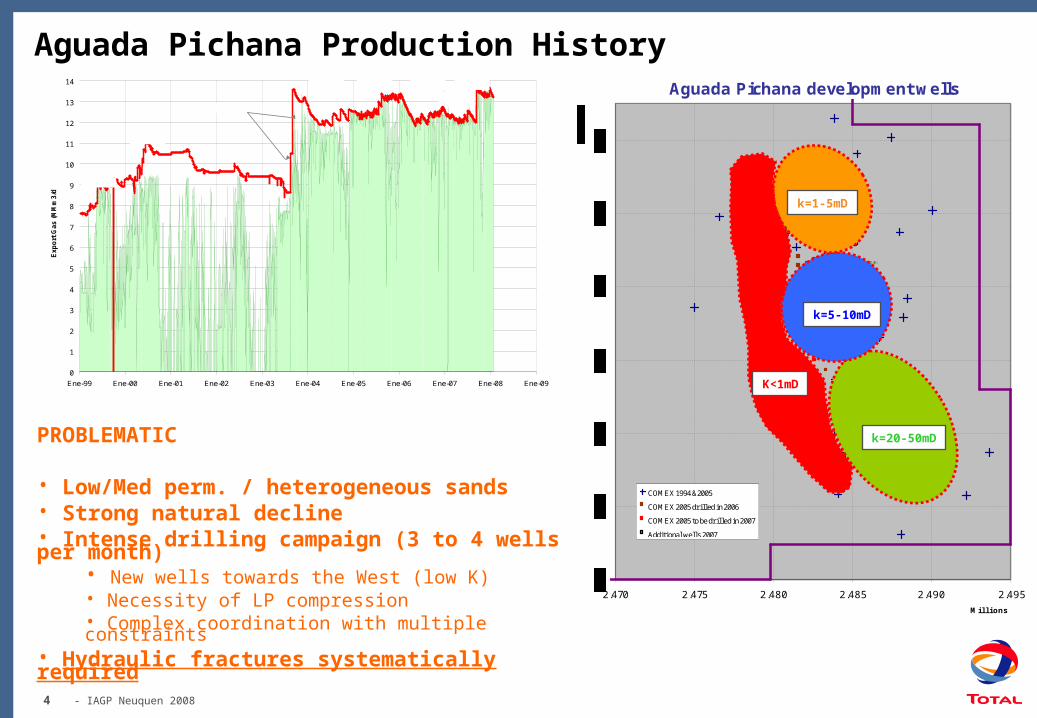
Aguada Pichana Production History
PROBLEMATIC
• Low/Med perm. / heterogeneous sands • Strong natural decline• Intense drilling campaign (3 to 4 wells per month)
• New wells towards the West (low K)• Necessity of LP compression• Complex coordination with multiple constraints
• Hydraulic fractures systematically required
Aguada Pichana development wells
A P -2 2 5
A P -2 2 2
A P -2 2 0:
A P -2 2 3
A P -1 8 7
A P -2 1 9 :
2.470 2.475 2.480 2.485 2.490 2.495
Mi l l ions
COMEX 1994 & 2005
COMEX 2005 drilled in 2006
COMEX 2005 to be drilled in 2007
Additional wells 2007
k=20-50mD
k=5-10mD
k=1-5mD
K<1mD0
1
2
3
4
5
6
7
8
9
10
11
12
13
14
Ene-99 Ene-00 Ene-01 Ene-02 Ene-03 Ene-04 Ene-05 Ene-06 Ene-07 Ene-08 Ene-09
Ex
po
rt G
as
(M
Mm
3/d
)
Wells 1999
Wells 2000
AP-136
Start up MP compressión
Wells 2004 (10)
Wells 2005 (24)
Wells 2006 (34)
Wells 2007 (34)
Start up LP
5 - IAGP Neuquen 2008
How to maintain the production plateau in AP ?
Continuous monitoring actions such as:
Well tests, Isochronal tests, MDT, PLT, fluid sampling, seismic surveys
allowed to define:
1. Drilling Campaign extensions thanks to adequate coring program and dedicated 3D seismic survey
• infill & delineation wells
• Step out wells
2. Production Optimizition & stimulations actions
• MP & LP compression inline with expectations thanks to an adapted monitoring and a good model history match
• New fracture design (wells without fracture don’t produce)
3. Future development projects in AP Block being studied
• LLP compression
• Well spacing reduction
• Low permeability reservoirs how to produce them economically ?
6 - IAGP Neuquen 2008
Well: AP-193
DATE PLOTTED: 03-Mar-2006
HORIZONTAL UNITS: METRES
Y COORDINATE: -
X COORDINATE: -
LONGITUDE: 69.0000
LATITUDE: 38.0000
LOCATION: X
COMPANY: Total Austral
VERTICAL SCALE: 1:500
DATE LOGGED: 03-Mar-2006
VERTICAL UNITS: METRES
DRILLED DEPTH: -
ELEVATION MEAS. REF.: -
MEASUREMENT REF.: DRILL FLOOR
SURFACE ELEVATION: -
DATUM FOR ELEVATION: GROUND LEVEL
RM
- @ -
RMC
- @ -
RMF
- @ -
DFD
-
BHT
- -
DEPTH (METRES)
1625.00-1742.00 -
SHT BIT S IZE
Composite
1650
1675
1700
1725
DEPTHMETRES
MULTIMIN.VOL_ILLITE_10 1
MULTIMIN.VOL_CALCITE_10 1
MULTIMIN.VOL_QUARTZ_10 1
MULTIMIN.VOL_ORTHOCL_10 1
MULTIMIN.VOL_UBNDWAT_10 1
1650
1675
1700
1725
1625.0
1742.0
DEPTH
1635.0
UPP MULI24.0
1659.0
MID MULI61.0
1720.0
LOW MULI17.0
1737.0
MULTIMIN.VOL_UIRRWAT_1V/V0.5 0
MULTIMIN.VOL_UFREWAT_1V/V0.5 0
MULTIMIN.VOL_UGAS_1V/V0.5 0
multimin.vol_uoilV/V0.5 0
MULTIMIN.VOL_UBNDWAT_1V/V0.5 0
MULTIMIN.PHIT_1V/V0.5 0
MULTIMIN.RHOG_1G/C32.6 3.1
MULTIMIN.KTIM_1MD0.01 1000
CMR.KTIM_1MD0.01 1000
mdt.mobility_1MD/CP0.01 1000
MULTIMIN.SWT_1V/V1 0
MULTIMIN.SWE_1V/V1 0
MULTIMIN.VOL_UWAT_1V/V0.5 0
MULTIMIN.PHIE_1V/V0.5 0
MULTIMIN.PHIT_1V/V0.5 0
CMR.CBP3_1V/V0.5 0
CMR.CBP4_1V/V0.5 0
CMR.CMRP_3MS_1V/V0.5 0
CMR.CBP1_1V/V0.5 0
CMR.CBP2_1V/V0.5 0
1650
1675
1700
1725
DEPTHMETRES
WIRE.HCAL_1IN5 15
WIRE.SP_1MV-80 20
WIRE.GR_1GAPI0 200
CMR.GR_1GAPI0 200
WIRE.TNPH_1V/V0.45 -0.15
WIRE.RHOZ_1G/C31.95 2.95
WIRE.HDRA_1G/C3-0.4 0.1
WIRE.U_1
B/C30 20
WIRE.PEFZ_1
B/E0 10
WIRE.AHT10_1
OHMM0.2 2000
WIRE.AHT20_1
OHMM0.2 2000
WIRE.AHT60_1
OHMM0.2 2000
WIRE.AHT90_1
OHMM0.2 2000
WIRE.DTCO_1
US/F140 40
PLT
60%
40%
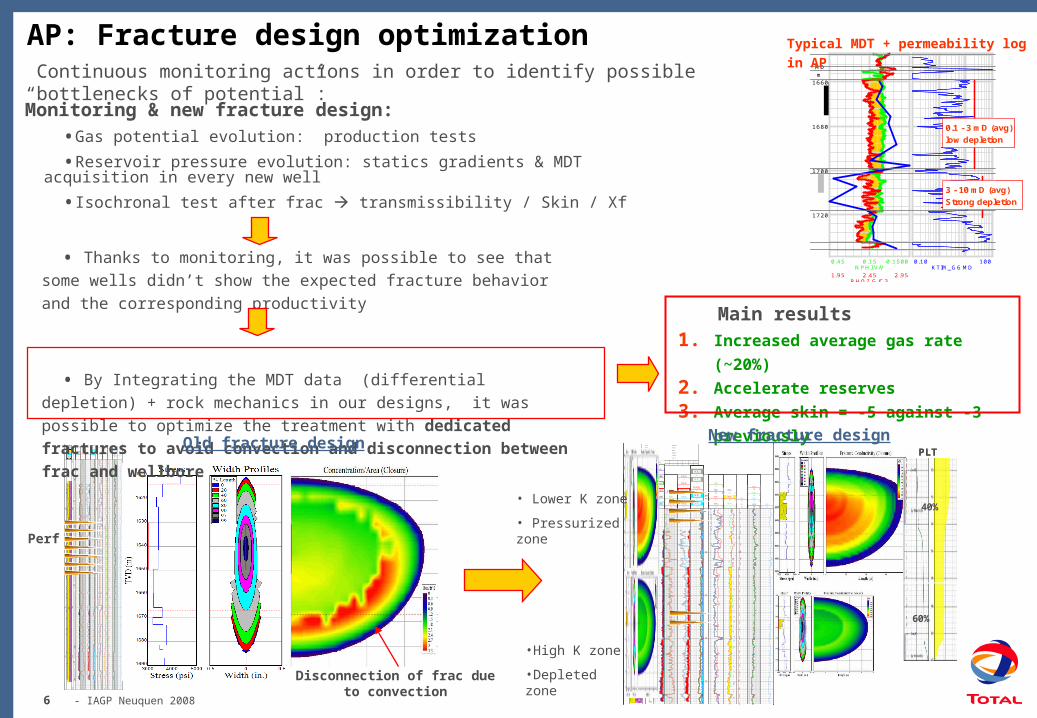
AP: Fracture design optimization Continuous monitoring actions in order to identify possible “bottlenecks of potential”:
Well: AP-193
DATE PLOTTED: 03-Mar-2006
HORIZONTAL UNITS: METRES
Y COORDINATE: -
X COORDINATE: -
LONGITUDE: 69.0000
LATITUDE: 38.0000
LOCATION: X
COMPANY: Total Austral
VERTICAL SCALE: 1:500
DATE LOGGED: 03-Mar-2006
VERTICAL UNITS: METRES
DRILLED DEPTH: -
ELEVATION MEAS. REF.: -
MEASUREMENT REF.: DRILL FLOOR
SURFACE ELEVATION: -
DATUM FOR ELEVATION: GROUND LEVEL
RM
- @ -
RMC
- @ -
RMF
- @ -
DFD
-
BHT
- -
DEPTH (METRES)
1625.00-1742.00 -
SHT BIT SIZE
Composite
1650
1675
1700
1725
DEPTHMETRES
MULTIMIN.VOL_ILLITE_10 1
MULTIMIN.VOL_CALCITE_10 1
MULTIMIN.VOL_QUARTZ_10 1
MULTIMIN.VOL_ORTHOCL_10 1
MULTIMIN.VOL_UBNDWAT_10 1
1650
1675
1700
1725
1625.0
1742.0
DEPTH
1635.0
UPP MULI24.0
1659.0
MID MULI61.0
1720.0
LOW MULI17.0
1737.0
MULTIMIN.VOL_UIRRWAT_1V/V0.5 0
MULTIMIN.VOL_UFREWAT_1V/V0.5 0
MULTIMIN.VOL_UGAS_1V/V0.5 0
multimin.vol_uoilV/V0.5 0
MULTIMIN.VOL_UBNDWAT_1V/V0.5 0
MULTIMIN.PHIT_1V/V0.5 0
MULTIMIN.RHOG_1G/C32.6 3.1
MULTIMIN.KTIM_1MD0.01 1000
CMR.KTIM_1MD0.01 1000
mdt.mobility_1MD/CP0.01 1000
MULTIMIN.SWT_1V/V1 0
MULTIMIN.SWE_1V/V1 0
MULTIMIN.VOL_UWAT_1V/V0.5 0
MULTIMIN.PHIE_1V/V0.5 0
MULTIMIN.PHIT_1V/V0.5 0
CMR.CBP3_1V/V0.5 0
CMR.CBP4_1V/V0.5 0
CMR.CMRP_3MS_1V/V0.5 0
CMR.CBP1_1V/V0.5 0
CMR.CBP2_1V/V0.5 0
1650
1675
1700
1725
DEPTHMETRES
WIRE.HCAL_1IN5 15
WIRE.SP_1MV-80 20
WIRE.GR_1GAPI0 200
CMR.GR_1GAPI0 200
WIRE.TNPH_1V/V0.45 -0.15
WIRE.RHOZ_1G/C31.95 2.95
WIRE.HDRA_1G/C3-0.4 0.1
WIRE.U_1
B/C30 20
WIRE.PEFZ_1
B/E0 10
WIRE.AHT10_1
OHMM0.2 2000
WIRE.AHT20_1
OHMM0.2 2000
WIRE.AHT60_1
OHMM0.2 2000
WIRE.AHT90_1
OHMM0.2 2000
WIRE.DTCO_1
US/F140 40
1. Increased average gas rate (~20%)
2. Accelerate reserves
3. Average skin = -5 against -3 previously
Monitoring & new fracture design:
•Gas potential evolution: production tests
•Reservoir pressure evolution: statics gradients & MDT acquisition in every new well
•Isochronal test after frac transmissibility / Skin / Xf
• Thanks to monitoring, it was possible to see that some wells didn’t show
the expected fracture behavior and the corresponding productivity
• By Integrating the MDT data (differential depletion) + rock mechanics in
our designs, it was possible to optimize the treatment with dedicated
fractures to avoid convection and disconnection between frac and
wellboreOld fracture design New fracture design
Disconnection of frac due to convection
Perf
•High K zone
•Depleted zone
• Lower K zone
• Pressurized zone
Main results
1 6 60
m
MD
1 6 80
1 7 00
1 7 20
N P H I V/V0 .4 5 -0 .1 5 0 00 .1 5
R H OZ G/C 31 .9 5 2 .9 52 .4 5
13 2 1 6 71 5 0
KTIM_ G6 MD0 .1 0 1 0 0
0.1 - 3 mD (avg)
low depletion
3 - 10 mD (avg)
Strong depletion
1 6 60
m
MD
1 6 80
1 7 00
1 7 20
N P H I V/V0 .4 5 -0 .1 5 0 00 .1 5
R H OZ G/C 31 .9 5 2 .9 52 .4 5
13 2 1 6 71 5 0
KTIM_ G6 MD0 .1 0 1 0 0
0.1 - 3 mD (avg)
low depletion
3 - 10 mD (avg)
Strong depletion
Typical MDT + permeability log in AP
7 - IAGP Neuquen 2008
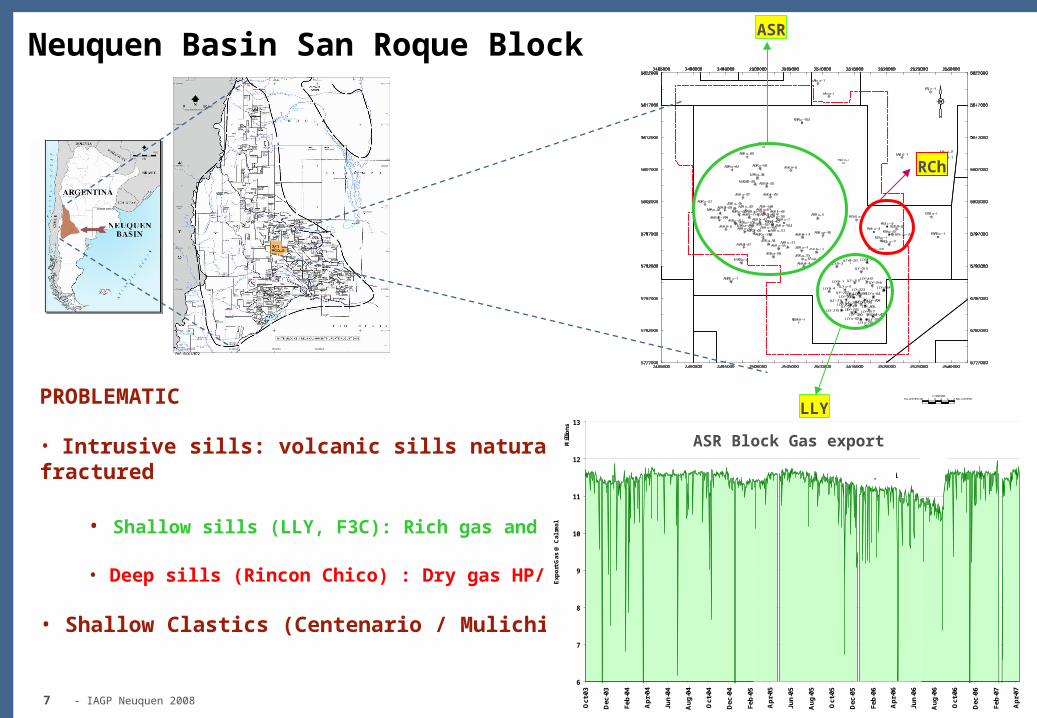
Neuquen Basin San Roque Block
PROBLEMATIC
• Intrusive sills: volcanic sills naturally fractured
• Shallow sills (LLY, F3C): Rich gas and oil
• Deep sills (Rincon Chico) : Dry gas HP/HT
• Shallow Clastics (Centenario / Mulichinco)
6
7
8
9
10
11
12
13
Oct
-03
Dec
-03
Feb
-04
Ap
r-04
Jun
-04
Au
g-0
4
Oct
-04
Dec
-04
Feb
-05
Ap
r-05
Jun
-05
Au
g-0
5
Oct
-05
Dec
-05
Feb
-06
Ap
r-06
Jun
-06
Au
g-0
6
Oct
-06
Dec
-06
Feb
-07
Ap
r-07
Mill
ion
s
Exp
ort
Gas
@ C
al r
eal
MP Start
Withoutpotenti
ASR Block Gas export
ASR
LLY
RCh

8 - IAGP Neuquen 2008
How to maintain the production plateau in ASR ?
1. Continuous monitoring actions:
• Well tests, Flow after flow tests, PLT, etc
2. Production optimization & stimulations actions
• Nodal Analysis: tubing resizing, loops, etch.
• MP & LP compression
• Optimizing selective completions in ASR clastics wells
• Acid stimulation with balls sealers: necessary in all filons target
• Re-perforations / re-stimulations with new acids treatments.
3. Future studies in ASR Block
• New technologies (batch fracs, new acids, local compression,…)
• Infill targets based on revised and history matched models
• New stimulation campaign based on recent success on filones

9 - IAGP Neuquen 2008
Aguada San Roque Clastics: Production Optimisation Example
Centenario C
Centenario A
Mulichinco
Optimization: based on good initial data per layer + pressure monitoring in neighboring wells, a multi layer nodal analysis was performed low risk of crossflow and potential production gain was identified
• Best configuration was found (M + Cent A + Cent C)
• Significant production increase was achieved
Gain: + 110 Km3/d from M + Cent A + Cent CASR-034
0
50,000
100,000
150,000
200,000
250,000
300,000
Aug-06 Sep-06 Oct-06 Nov-06 Dec-06 Jan-07 Feb-07 Mar-07 Apr-07 May-07 Jun-07 Jul-07 Aug-07
Ga
s R
ate
(m
3/d
)
M
CC
CAM
MMM
CC: 35 %CA: 55 %M: 10 %
10
- IAGP Neuquen 2008
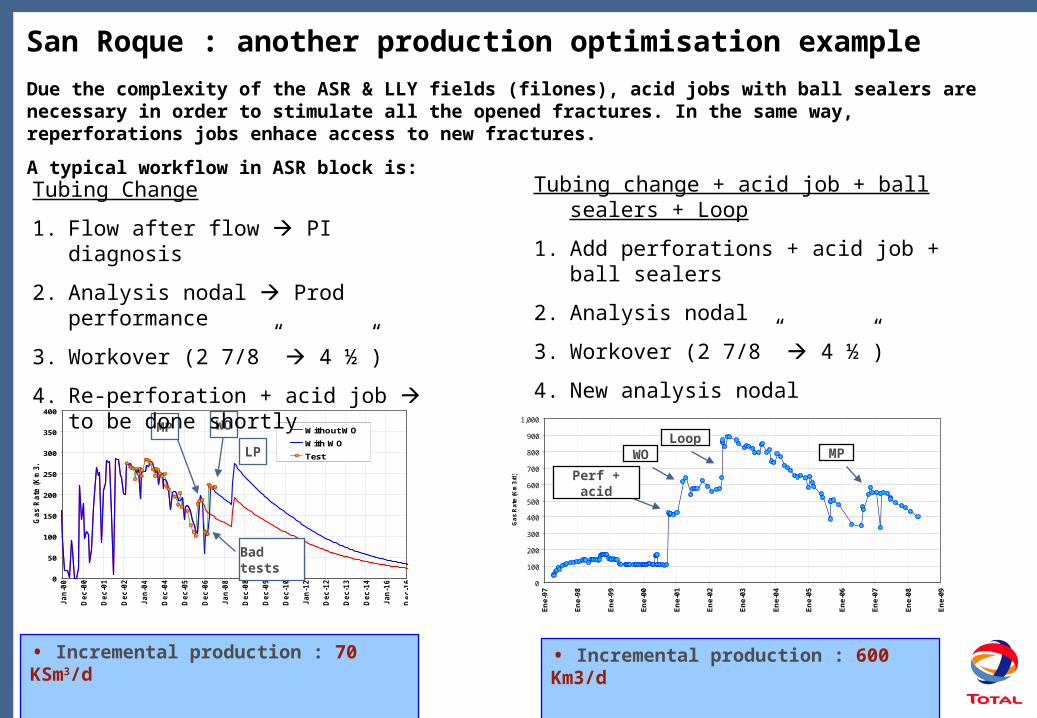
San Roque : another production optimisation example
• Incremental production : 70 KSm3/d
0
50
100
150
200
250
300
350
400
Jan
-00
Dec-0
0
Dec-0
1
Dec-0
2
Jan
-04
Dec-0
4
Dec-0
5
Dec-0
6
Jan
-08
Dec-0
8
Dec-0
9
Dec-1
0
Jan
-12
Dec-1
2
Dec-1
3
Dec-1
4
Jan
-16
Dec-1
6
Ga
s R
ate
(K
m3
/d)
Without WO
With WO
Test
Bad tests
MP WO
LP
Tubing Change
1. Flow after flow PI diagnosis
2. Analysis nodal Prod performance
3. Workover (2 7/8” 4 ½”)
4. Re-perforation + acid job to be done shortly
Tubing change + acid job + ball sealers + Loop
1. Add perforations + acid job + ball sealers
2. Analysis nodal
3. Workover (2 7/8” 4 ½”)
4. New analysis nodal
5. Loop
0
100
200
300
400
500
600
700
800
900
1,000
En
e-9
7
En
e-9
8
En
e-9
9
En
e-0
0
En
e-0
1
En
e-0
2
En
e-0
3
En
e-0
4
En
e-0
5
En
e-0
6
En
e-0
7
En
e-0
8
En
e-0
9
Ga
s R
ate
(K
m3
/d)
Perf + acid
WOLoop
MP
• Incremental production : 600 Km3/d
Due the complexity of the ASR & LLY fields (filones), acid jobs with ball sealers are necessary in order to stimulate all the opened fractures. In the same way, reperforations jobs enhace access to new fractures.
A typical workflow in ASR block is:
11 - IAGP Neuquen 2008
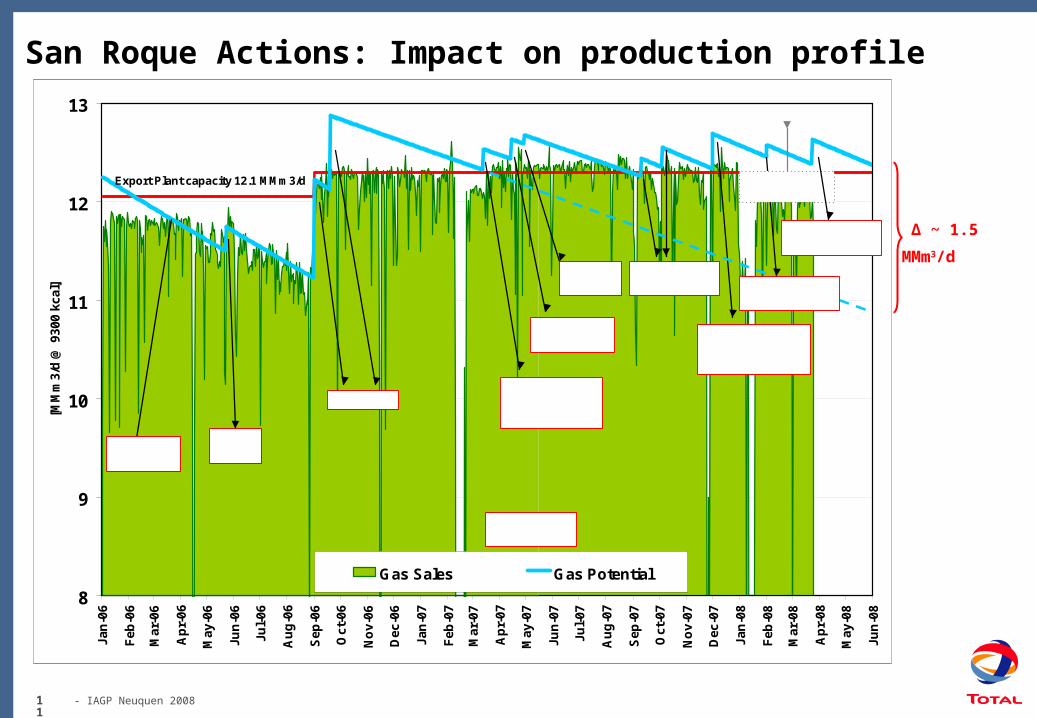
San Roque Actions: Impact on production profile
8
9
10
11
12
13Ja
n-0
6
Feb
-06
Mar
-06
Ap
r-06
May
-06
Jun
-06
Jul-
06
Au
g-0
6
Sep
-06
Oct
-06
No
v-06
Dec
-06
Jan
-07
Feb
-07
Mar
-07
Ap
r-07
May
-07
Jun
-07
Jul-
07
Au
g-0
7
Sep
-07
Oct
-07
No
v-07
Dec
-07
Jan
-08
Feb
-08
Mar
-08
Ap
r-08
May
-08
Jun
-08
[MM
m3/
d @
930
0 kc
al]
Gas Sales Gas Potential
Export Plant capacity 12.1 MMm3/d
Export Plant capacity 12.3 MMm3/d
MP plannedstart up
ASR-58WO
MP start up
Plant fire #3 & #4 closed
Wells close:WO ASR-36/104
LLY-203/20
Open sleevesASR-58/34
LLY-216Perf UMZ
New wellsASR-201 / 203
LLY-219 / LLY-202Perf UMZ + Acid
ASR-36 Acid
LLY-218Perf UMZ + Acid
LLYH-208Perf UMZ + Acid
Export Plant capacity 12 MMm3/d
Δ ~ 1.5 MMm3/d
12
- IAGP Neuquen 2008
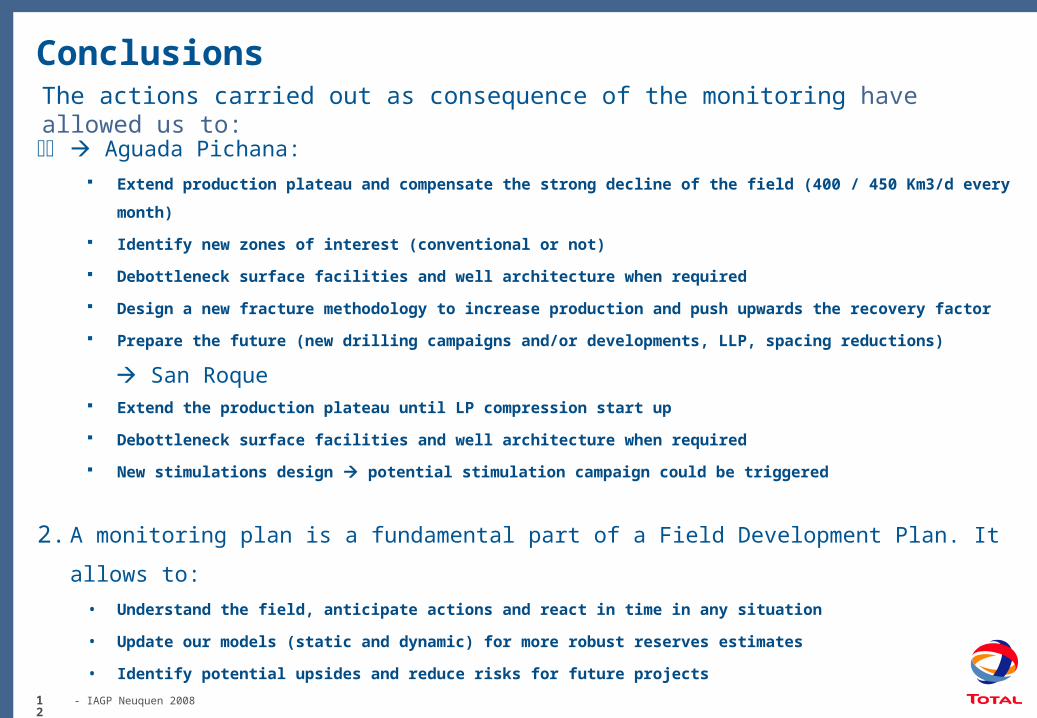
Conclusions
11 Aguada Pichana:
Extend production plateau and compensate the strong decline of the field (400 / 450 Km3/d every month)
Identify new zones of interest (conventional or not)
Debottleneck surface facilities and well architecture when required
Design a new fracture methodology to increase production and push upwards the recovery factor
Prepare the future (new drilling campaigns and/or developments, LLP, spacing reductions)
San Roque Extend the production plateau until LP compression start up
Debottleneck surface facilities and well architecture when required
New stimulations design potential stimulation campaign could be triggered
2. A monitoring plan is a fundamental part of a Field Development Plan. It allows to:
• Understand the field, anticipate actions and react in time in any situation
• Update our models (static and dynamic) for more robust reserves estimates
• Identify potential upsides and reduce risks for future projects
The actions carried out as consequence of the monitoring have allowed us to:

13
- IAGP Neuquen 2008
Final Word: Integration of disciplines is key
Well Performance Team
Well Completion Reservoir
Production / Surface facilities
Top Related