


Languages
Pages
Legal


DRAFT
HYDROLOGY AND DRAINAGE STUDY
MOUNT RUBIDOUX PARK
Riverside, California
Prepared for:
City of Riverside
3900 Main Street
Riverside, CA 92522
Prepared by:
AMEC 121 Innovation Drive, Suite 200
Irvine, California 92617-3094 (949) 642-0245
May 12, 2014
Project No. IR13164470

DRAFT
AMEC P:\164470\Docs\Hydrology and Drainage Study\Draft Report\MtRubidouxHydrology_Rpt Text_Rev1.docx i
TABLE OF CONTENTS
Page
1.0 INTRODUCTION ............................................................................................................ 1 1.1 PURPOSE AND OBJECTIVES ................................................................................... 1 1.2 SCOPE OF WORK .................................................................................................. 1 1.3 METHODOLOGY .................................................................................................... 2
2.0 BACKGROUND INFORMATION .................................................................................... 2 2.1 SITE LOCATION ..................................................................................................... 2 2.2 RECENT HISTORY OF UPROAD REPAIRS ................................................................ 2 2.3 RECENT STORM EVENTS ....................................................................................... 3 2.4 SITE RECONNAISSANCE ........................................................................................ 3
3.0 HYDROLOGY ................................................................................................................. 4 3.1 PRECIPITATION ..................................................................................................... 4 3.2 INFILTRATION ........................................................................................................ 5
3.2.1 Hydrologic Soil Group ............................................................................. 6 3.2.2 Soil Cover and Vegetation Type .............................................................. 6 3.2.3 Antecedent Moisture Conditions ............................................................. 6
3.3 ESTIMATION OF STORM RUNOFF PEAK DISCHARGE ............................................... 7
4.0 DRAINAGE ANALYSIS................................................................................................... 8 4.1 SITE INFRASTRUCTURE ......................................................................................... 8 4.2 NATURAL DRAINAGE FEATURES ............................................................................ 8 4.3 UPROAD HYDRAULICS ........................................................................................... 9 4.4 HYDRAULICS DISCUSSION ..................................................................................... 9 4.5 DEPOSITION OF SOIL ON THE UPROAD ................................................................. 11
5.0 RECOMMENDATIONS ................................................................................................. 12 5.1 ALTERNATIVES .................................................................................................... 12
5.1.1 Alternative 1 - Install Storm Drain System Along the Alignment of the Uproad ................................................................................................... 12
5.1.2 Alternative 2 - No Action ........................................................................ 14 5.1. 3 Alternative 3 – Install New AC Berm ..................................................... 14 5.1.4 Alternative 4 - Remove the AC Berms and Install Erosion Control
Measures ............................................................................................... 15 5.2 RECOMMENDATIONS ........................................................................................... 16
6.0 REFERENCES ............................................................................................................. 16
TABLES
Table 1 Uproad Tributary Sub-Areas Table 2 Storm Runoff Peak Flow Rates for 2-Year Storm Table 3 Storm Runoff Peak Flow Rates for 5-Year Storm Table 4 Storm Runoff Peak Flow Rates for 10-Year Storm Table 5 Storm Runoff Peak Flow Rates for 25-Year Storm

TABLE OF CONTENTS (Continued)
DRAFT
AMEC P:\164470\Docs\Hydrology and Drainage Study\Draft Report\MtRubidouxHydrology_Rpt Text_Rev1.docx ii
Table 6 Storm Runoff Peak Flow Rates for 50-Year Storm Table 7 Storm Runoff Peak Flow Rates for 100-Year Storm Table 8 Uproad Hydraulic Analysis for 2-Year Storm Table 9 Uproad Hydraulic Analysis for 5-Year Storm Table 10 Uproad Hydraulic Analysis for 10-Year Storm Table 11 Uproad Hydraulic Analysis for 25-Year Storm Table 12 Uproad Hydraulic Analysis for 50-Year Storm Table 13 Uproad Hydraulic Analysis for 100-Year Storm Table 14 Results of Uproad Hydraulic Analysis Table 15 Conceptual Construction Cost Estimates for Alternatives
FIGURES
Figure 1 Site Vicinity Map Figure 2 Hydrology Map Figure 3 Watershed Schematic Figure 4 Cross Section A Figure 5 Cross Section B Figure 6 Cross Section C Figure 7 Cross Section D Figure 8 Cross Section E Figure 9 Cross Section F Figure 10 Cross Section G Figure 11 Cross Section H Figure 12 Cross Section I Figure 13 Cross Section J Figure 14 Cross Section K Figure 15 Cross Section L Figure 16 Cross Section M Figure 17 Cross Section N Figure 18 Cross Section O Figure 19 Cross Section P Figure 20 Cross Section Q Figure 21 Cross Section R Figure 22 Cross Section S Figure 23 Cross Section T Figure 24 Cross Section U Figure 25 Cross Section V Figure 26 Cross Section W Figure 27 Cross Section X Figure 28 Cross Section Y Figure 29 Cross Section Z Figure 30 Cross Section AA Figure 31 Cross Section BB Figure 32 Cross Section CC Figure 33 Cross Section DD

TABLE OF CONTENTS (Continued)
DRAFT
AMEC P:\164470\Docs\Hydrology and Drainage Study\Draft Report\MtRubidouxHydrology_Rpt Text_Rev1.docx iii
Figure 34 Cross Section EE
APPENDIXES
Appendix A Mount Rubidoux Park Hydrologic Parameters Appendix B Maximum Capacity Uproad Hydraulic Analysis – FlowMaster Output Appendix C 2-Year Storm Uproad Hydraulic Analysis – FlowMaster Output Appendix D 5-Year Storm Uproad Hydraulic Analysis – FlowMaster Output Appendix E 10-Year Storm Uproad Hydraulic Analysis – FlowMaster Output Appendix F 25-Year Storm Uproad Hydraulic Analysis – FlowMaster Output Appendix G 50-Year Storm Uproad Hydraulic Analysis – FlowMaster Output Appendix H 100-Year Storm Uproad Hydraulic Analysis – FlowMaster Output

DRAFT
AMEC P:\164470\Docs\Hydrology and Drainage Study\Draft Report\MtRubidouxHydrology_Rpt Text_Rev1.docx 1
HYDROLOGY AND DRAINAGE STUDY Mount Rubidoux Park Riverside, California
1.0 INTRODUCTION
AMEC Environment & Infrastructure, Inc. (AMEC), has prepared this report on behalf of the
City of Riverside (City) to describe the methods and findings of a hydrology and drainage
study of a portion of a pedestrian pathway referred to as the “Uproad” at Mount Rubidoux
Park, Riverside, California (the site). The following sections of this report present the purpose
and scope of the study, describe general background information associated with the site,
discuss hydrology and drainage characteristics and analysis, and present alternatives and
recommendations for potential improvements.
1.1 PURPOSE AND OBJECTIVES
The purpose of this study was to assess hydrology and drainage conditions at the site.
Specific objectives were to:
identify, describe, and analyze hydrologic and hydraulic conditions of the Uproad;
evaluate whether recent road resurfacing, erosion measures, and repairs completed in 2009 and 2011 have exacerbated the existing surface flow from storm events on the side of the hill adjacent to Miramonte Place; and
recommend potential improvements if feasible and necessary.
1.2 SCOPE OF WORK
The scope of work for this study consisted of:
visiting the site to observe drainage features and recent roadway improvements;
performing a land survey of a portion of the Uproad to obtain data for existing site features and topography;
conducting a hydrologic analysis to estimate peak storm runoff;
conducting a hydraulic analysis to estimate the conveyance capacity of the Uproad;
proposing recommendations for drainage improvements at the site if feasible and necessary; and
preparing this report.
DRAFT
AMEC P:\164470\Docs\Hydrology and Drainage Study\Draft Report\MtRubidouxHydrology_Rpt Text_Rev1.docx 2
1.3 METHODOLOGY
Hydrologic and hydraulic calculations were performed in accordance with the Riverside County
Flood Control and Water Conservation District (the District) Hydrology Manual (RCHM;
Riverside County, 1978). Calculations were completed for the 2, 5, 10, 25, 50, and 100-year
recurrence interval storms for existing conditions at the Uproad.
Peak storm flow was calculated using the Rational Method described in the RCHM. Areas
contributing to storm flow were based on City furnished engineering drawings of the site that
AMEC verified and modified based on data from the land survey. The intensity-duration-
frequency relationship used was calculated with the regression equations and parameters
contained in the RCHM (Appendix A).
The hydraulics of street flow was modeled as an irregular channel using the FlowMaster
(Bentley, 2008) software package. The cross section perpendicular to the alignment of the
Uproad is not uniform and is not well represented by the typical symmetrical street sections.
2.0 BACKGROUND INFORMATION
This section provides information on the site location, relevant site history, and current site
information based on a recent site reconnaissance.
2.1 SITE LOCATION
Mount Rubidoux is an isolated granite hill and designated landmark located on the western
boundary of Riverside, California. The hill is a City park referred to as Mount Rubidoux Park
(park). The Santa Ana River runs along the base of the western face of Mount Rubidoux and
Mission Inn Avenue is the northern boundary of the park. An entrance to the park and the
beginning of the Uproad is located at the intersection of 9th Street and Mt. Rubidoux Drive.
Figure 1 shows Mount Rubidoux Park and its vicinity.
2.2 RECENT HISTORY OF UPROAD REPAIRS
In 2009, the City approved engineering plans and performed construction to repair two
portions of an asphalt concrete (AC) paved pedestrian path at the park referred to as the
Uproad and Downroad (Rick Engineering, 2009). The engineering plans included the
following repairs to the Uproad within the area of this study:
placement of one inch of AC pavement over existing pavement and application of fog
seal from Station 27+50 to 32+00 and from Station 36+50 to 40+75 (stationing is
approximate); and
DRAFT
AMEC P:\164470\Docs\Hydrology and Drainage Study\Draft Report\MtRubidouxHydrology_Rpt Text_Rev1.docx 3
construction of a two-foot wide AC swale, removal of existing AC pavement and
placement of four inches of AC pavement over existing sub-grade, and application of
fog seal from Station 32+00 to 36+50 and from Station 40+75 to 43+60.
A multiple-day storm event occurred at the site during December 16 through December 22,
2010. The storm runoff caused significant damage including “erosion that undermined the
road, mudslides and trail washouts, and fallen boulders” (City, 2011). The City Council
approved emergency repairs for the site in 2011. The City approved plans in 2011 to address
emergency road repairs at the site that included:
construction of 6-inch rolled AC berms along the downhill edge of the Uproad at select
locations; and
construction of gabion basket overside drains at select locations (Rick Engineering,
2011).
The gabion basket overside drains were located in discontinuities or gaps in the proposed AC
berms and appear to be designed to transmit runoff from the roadway and natural drainage
features back to the natural drainage features down-slope of the roadway. The rolled AC
berms were installed to prevent over the slope drainage that caused erosion on the steep
hillsides (Hilltop Geotechnical, 2011).
2.3 RECENT STORM EVENTS
On August 29, 2013, a storm event occurred at the site and nearby areas. A summer
thunderstorm delivered 2.2 inches of rainfall over a period of approximately two and half hours.
Hillside erosion occurred at the site depositing soil and debris along the road, particularly in
the canyon area near station 24+10 and station 32+25. The runoff from the storm caused
damage to several properties on Miramonte Place located at the eastern toe of Mount
Rubidoux.
2.4 SITE RECONNAISSANCE
AMEC performed a site visit on November 5, 2013 to observe drainage infrastructure and site
conditions visible from the City’s property at Mount Rubidoux. AMEC made visual
observations of topography at Mount Rubidoux to determine tributary areas that likely would
contribute to the residential properties that sustained damage from the runoff associated with
the August storm. The Uproad was cleared of debris and soils at the time of the site visit.
While at the site, AMEC staff noted repairs and infrastructure shown on the 2009 and 2011
road repair plans. At locations where the road crossed a larger, natural drainage feature like a

DRAFT
AMEC P:\164470\Docs\Hydrology and Drainage Study\Draft Report\MtRubidouxHydrology_Rpt Text_Rev1.docx 4
canyon where runoff is concentrated, the asphalt berms were discontinuous, generally
consistent with the 2011 emergency repair construction plans. However, the repairs did not
include a rock filled gabion basket at the discontinuity as required by the detail in the plans.
Instead, an asphalt apron leading to a slope reinforced with a combination of riprap and
shotcrete was constructed at the berm discontinuity.
AMEC returned to the site on November 22, 2013 to observe a forecasted storm event. The
storm event resulted in a total rainfall of 0.05 inches recorded at the University of California,
Riverside (U.C. Riverside, 2014). AMEC observed negligible runoff for this storm event. The
prior day’s storm event on November 21, 2013 resulted in 1.01 inches of rainfall recorded at
University of California, Riverside. AMEC noticed soil and debris deposited at certain
locations on the road on November 22, presumably from runoff from the prior day’s storm
event.
A land survey was completed in March 2014 to retrieve spatial and topographic data for the
Uproad corridor. Data from the survey were used to create cross sections necessary for
hydraulic analysis of the Uproad and to obtain a better understanding of the drainage
infrastructure and dimensions. The survey was limited in scope and focused on the area in
proximity to the recent damage from the August 2013 storm. Therefore, the upper tributary
sub-areas 1 through 8, shown on Figure 2, were not a part of the Uproad topographic survey.
3.0 HYDROLOGY
Hydrologic analysis and results of peak runoff calculations for the site are summarized here.
3.1 PRECIPITATION
The RCHM describes the three types of storms which can occur over Riverside County as
general winter storms, general summer storms, and high intensity thunderstorms. Of the three
types of storms, “most precipitation results from the general winter storms which occur in the
late fall or winter months and may have durations of several days” (RCHM, 1978).
Although most precipitation in the area results from general winter storms, the RCHM states:
“thunderstorms can occur at any time of the year causing extremely high rates of
precipitation for relatively short durations. Thunderstorms can occur either during
general storms, or as an isolated phenomena, but are most common from July through
September when moist unstable air subject to convective lifting may cover the
Southern California area” (1978).
DRAFT
AMEC P:\164470\Docs\Hydrology and Drainage Study\Draft Report\MtRubidouxHydrology_Rpt Text_Rev1.docx 5
The storm event that occurred in August 2013 appears to be an isolated thunderstorm and
falls within the period of the year when these events are most common. The City provided a
preliminary precipitation assessment conducted by a meteorologist for the storm event on
August 29, 2013. Data for the storm event is as follows:
“On 8.29.13, the City received approximately 2.2” of rain during the hours of 2:30 p.m.
to 4:56 p.m. However, “most” of the rain fell between 2:46 p.m. and 4:16 p.m.
Between 3:13 p.m. and 3:49 p.m., the rain was falling at a rate of 1.5” to 2.0” per hour.”
In the area of Mount Rubidoux, the point precipitation for the 100-year 1-hour storm is
1.06 inches of rainfall. Based on the data for the August storm, for 36 minutes, the period of
time between 3:13 p.m. and 3:49 p.m., rain fell at a rate of 1.5 to 2.0 inches per hour. The
amount of rain that fell within those 36 minutes ranges from 0.9 to 1.2 inches of rain.
Considering the rain that fell within the remaining 24 minutes (before or after this 36 minute
period), the magnitude of the August storm event is in the range of the 100-year precipitation
as described in the RCHM.
For this hydrologic analysis, estimation of peak runoff from the tributary areas is required to
determine the conveyance capacity of the existing drainage infrastructure. Because peak
runoff is estimated by the Rational Method, the isohyetal maps of point precipitation for the
1-hour storm contained within the RCHM were used to develop the intensity-frequency-
duration curves necessary for the calculations. Although the 1-hour map is used for this
analysis, the storm is assumed to be the more common general winter storm and not the less
common thunderstorm. The 1-hour duration map was developed by the District using
information and equations from the National Oceanic and Atmospheric Administration Atlas 2,
Precipitation-Frequency Atlas of the Western United States, Volume XI-California published in
1973. The 2-year and 100-year 1-hour precipitation depths for Mount Rubidoux are 0.52
inches and 1.06 inches respectively as shown on Plates D-4.3 and D-4.4 of the RCHM.
Determination of rainfall depth for the intervening return periods was accomplished by the
method described in the RCHM and documented in Appendix A.
3.2 INFILTRATION
Infiltration is the process of rainfall entering into pervious areas including soils and forest litter.
For the RCHM, infiltration is expressed as the rate in inches per hour that precipitation enters
the soil surface and is stored in the pore space. Haan et al. states the rate of infiltration is
dependent on “soil physical properties, vegetative cover, antecedent soil water conditions,
rainfall intensity, and the slope of the infiltrating surface” (1994). The percent of impervious
area is accounted for in the runoff coefficient that characterizes infiltration. The Uproad was
the primary impervious surface and composed 5% of the tributary area. In the following

DRAFT
AMEC P:\164470\Docs\Hydrology and Drainage Study\Draft Report\MtRubidouxHydrology_Rpt Text_Rev1.docx 6
sections, the factors affecting infiltration for hydrologic studies within Riverside County are
discussed.
3.2.1 Hydrologic Soil Group
The Natural Resource Conservation Service (NRCS, formerly the Soil Conservation Service)
and the US Forest Service have mapped the soils in many areas of Riverside County based
on the soil’s infiltration capabilities as classified by the NRCS. The NRCS categorized soils
into four hydrologic soil groups according to their minimum infiltration rate. The four hydrologic
soil groups consist of:
Group A – soils having high rates of infiltration (greater than 0.3 inches/hour);
Group B – soils having moderate rates of infiltration (0.15 – 0.3 inches/hour);
Group C – soils having low rates of infiltration (0.05 – 0.15 inches/hour); and
Group D – soils having very low rates of infiltration (0 - 0.05 inches/hour).
On plate C-1.15 of the RCHM, soil at Mount Rubidoux has been placed in the Group C
hydrologic soil group, meaning the soils have a moderately fine to fine texture, have a slow
rate of water transmission, and have a medium to high potential to produce runoff.
3.2.2 Soil Cover and Vegetation Type
The type of vegetation, or soil cover, as well as the quality and density of that soil cover within
the watershed have a major impact on the infiltration capacity of a given soil (RCHM, 1978).
The District uses the system developed by the NRCS to consider and account for soil cover.
The natural vegetation on the mountain is classified as coastal sage scrub, a vegetation type
found at relatively dry sites in lowland California and characterized by sub-woody shrubs that
are deciduous during the long summer dry season (Friends of Mount Rubidoux, 2014). The
Open Brush cover type described in the RCHM most closely matched the vegetation at the
site (Plate C-2 in Appendix A). Because the storm event used for this study is a general winter
storm occurring during the winter as opposed to the drier summer conditions, the quality of the
soil cover was considered to be in Fair condition. Fair cover quality is described as moderate
cover with 50 percent to 75 percent of the ground surface protected.
3.2.3 Antecedent Moisture Conditions
The RCHM defines antecedent moisture conditions (AMC) as the relative wetness of a
watershed just prior to a runoff producing storm event. If a storm event was preceded by a

DRAFT
AMEC P:\164470\Docs\Hydrology and Drainage Study\Draft Report\MtRubidouxHydrology_Rpt Text_Rev1.docx 7
separate, significant storm event that increased the water content of the soil, less storage is
available within the soil pore space. This is accounted for through the AMC as follows:
AMC I – Lowest runoff potential. The watershed soils are dry enough to allow
satisfactory grading or cultivation to take place.
AMC II – Moderate runoff potential, an intermediate condition.
AMC III – Highest runoff potential. The soil is practically saturated from antecedent
rains.
For the purposes of design hydrology, the RCHM requires using AMC II for hydrologic analysis
of the 10-year and 100-year storms. AMC II was the condition considered for the analysis.
3.3 ESTIMATION OF STORM RUNOFF PEAK DISCHARGE
Peak storm runoff generated from tributary areas was estimated using the Rational Method described in the RCHM. The Rational Method estimates peak discharge in cubic feet per second (cfs) based on the product of:
C, runoff coefficient that accounts for infiltration and its related factors as well as the proportion of pervious to impervious area;
I, intensity of rainfall in inches per hour (in/hr); and
A, tributary area in acres.
Using the elevation contours provided on the 2011 Mount Rubidoux Uproad Repair plans and
the Uproad survey data, tributary areas for the Uproad were delineated as shown on Figure 2.
The first bridge encountered on the Uproad marked the divide between the upper Uproad and
the lower Uproad, the area this analysis considers. Because the area just upstream of the
bridge as well as the bridge itself do not have berms on both sides of the roadway to contain
runoff collected and conveyed from the upper Uproad, runoff has the ability to flow off the
bridge to the natural drainage feature underneath the bridge. The tributary area totaling 25.4
acres was divided into 34 sub-areas (summarized in Table 1) to facilitate the Rational Method
analysis and more accurately determine the time of concentration. The ordering of the
sub-areas is sequential and a schematic of the watershed is shown in Figure 3. The point of
concentration, the location where the tributary area discharges runoff, was identified as the
end of the Uproad at its intersection with 9th Street.
In order to determine the time of concentration, travel time was calculated for each sub-area
and summed. The time of concentration for the initial sub-area was determined from the
nomograph in the RCHM shown on Plate D-3. The travel time through sub-area 2 was
DRAFT
AMEC P:\164470\Docs\Hydrology and Drainage Study\Draft Report\MtRubidouxHydrology_Rpt Text_Rev1.docx 8
determined from the RCHM’s Plate D-6.3 for natural mountain channels. For sub-areas 3
through 34, travel time was determined by modeling the Uproad as an open channel using the
Bentley FlowMaster software.
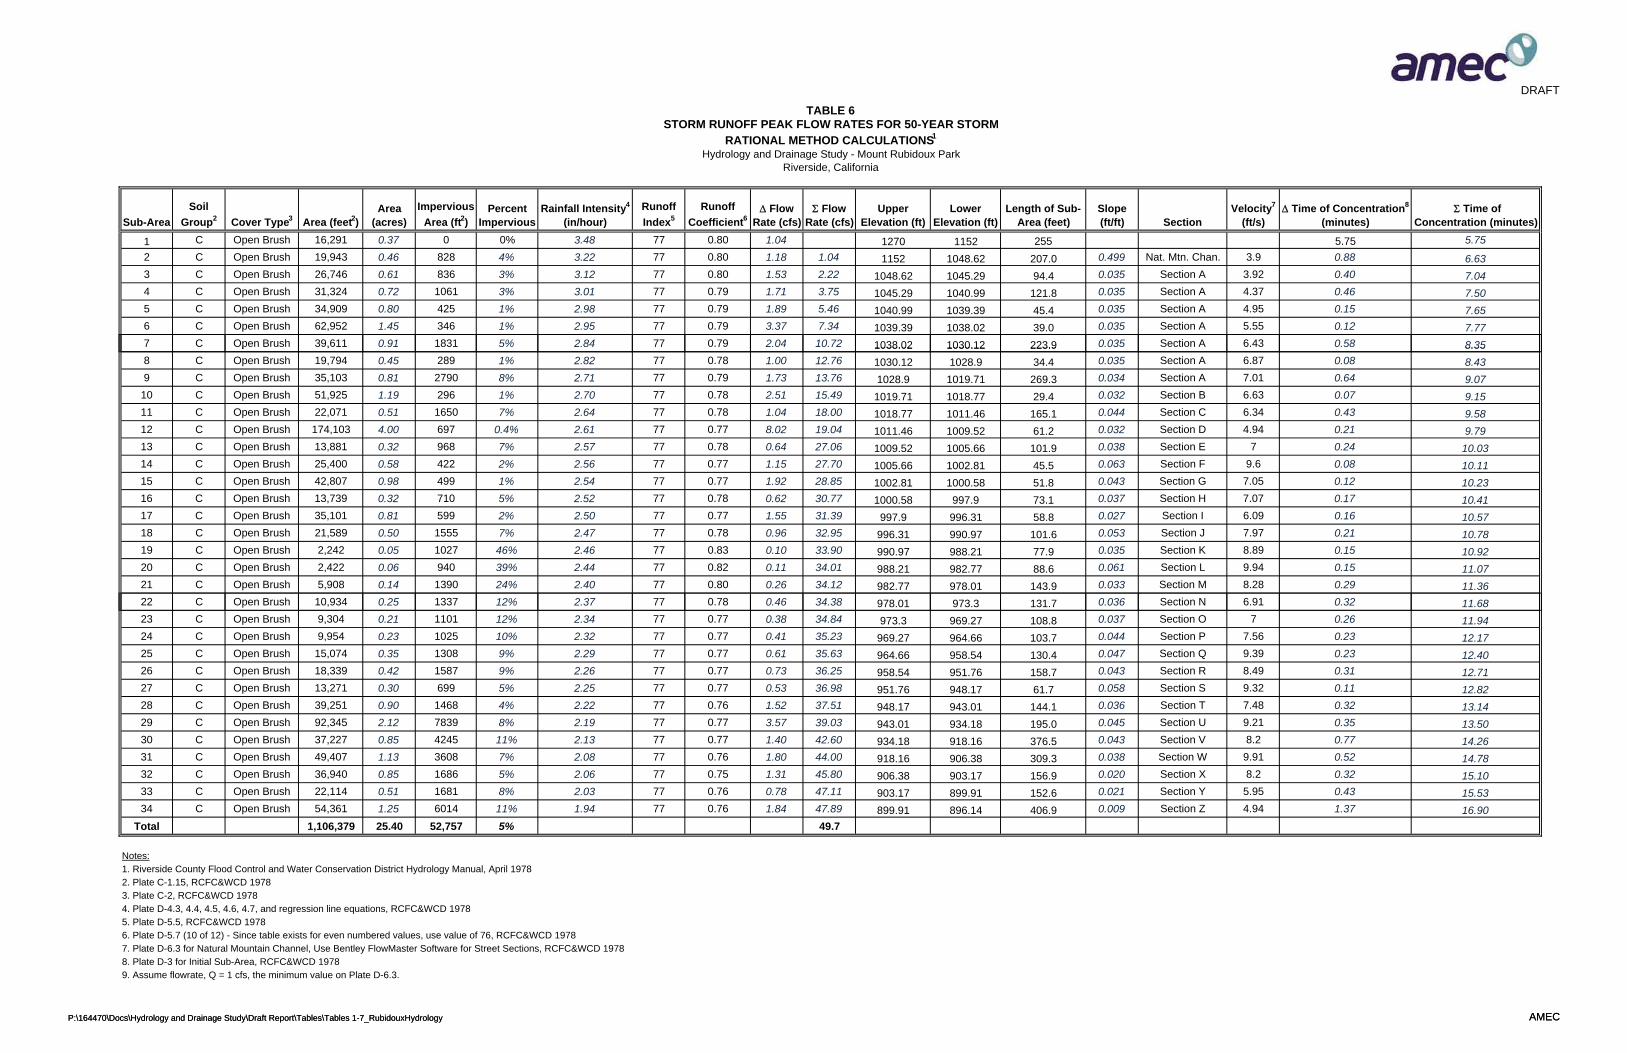
Tables 2 through 7 summarize the calculations for the Rational Method analysis for the
Uproad tributary area. The 2-year storm would produce approximately 22.7 cfs of runoff
assuming all flow reaches the point of concentration. The 5-year, 10-year, 25-year, 50-year,
and 100-year storms would produce 31.1 cfs, 36.1 cfs, 43.5 cfs, 49.7 cfs, and 55.2 cfs,
respectively.
4.0 DRAINAGE ANALYSIS
The drainage analysis and the results of hydraulic calculations for the site are summarized
here.
4.1 SITE INFRASTRUCTURE
Mount Rubidoux Park is a largely undeveloped urban open space park. The primary
infrastructure at the site is the roadway. The Uproad is approximately ten feet wide but widens
to sixteen feet at the site entrance at 9th Street. The road is composed of AC pavement and
generally the width of the road slopes downward towards the ascending slope of the hillside,
creating a depression where runoff can accumulate and flow along the uphill side of the
roadway (for an example, see Figure 4). The Uproad, in the area of this study, does not have
culverts to convey water underneath the roadway; therefore, runoff flowing in natural drainage
features that intersect with the Uproad flows directly onto the Uproad. If the Uproad was
initially constructed using culverts, the natural drainage features connected by the culverts
would more closely resemble the natural drainage patterns prior to construction of the Uproad.
As part of the road repairs completed in 2011, asphalt berms were constructed in selected
locations to prevent over the slope drainage. The locations of the asphalt berms are shown on
Figure 2. Small discontinuities in the asphalt berm were included in the design at locations of
natural drainage features. From the field reconnaissance, asphalt aprons leading to a slope
reinforced with a combination of riprap and shotcrete was constructed at the berm
discontinuities to provide erosion control for the slope.
4.2 NATURAL DRAINAGE FEATURES
Natural drainage features were identified primarily from topographic contour lines and some of
the larger channels were observed during the field reconnaissance. These natural drainage
features are locations where runoff has concentrated and incised channels through shearing
forces produced by the channelized flow.

DRAFT
AMEC P:\164470\Docs\Hydrology and Drainage Study\Draft Report\MtRubidouxHydrology_Rpt Text_Rev1.docx 9
The natural drainage feature located in sub-area 12 and 22, whose location is approximately
shown on Figure 2, is situated in the center of a steep canyon where runoff concentrates.
After the August 2013 storm event, the deposition of soil on the roadway at the location where
the Uproad intersects this natural drainage feature demonstrated the preferred flow path was
directly down the canyon and over the roadway for this storm event.
4.3 UPROAD HYDRAULICS
To determine the conveyance capacity of the Uproad, representative cross sections of the
roadway were plotted and analyzed. Each roadway cross section was modeled in the Bentley
FlowMaster software to calculate the maximum flow capacity of the roadway operating as an
open channel. The maximum flow capacity was determined to occur when the water surface
elevation reached the highest elevation within the roadway; runoff would flow within the
roadway without spilling outside of the roadway. Figures 4 through 34 represent cross
sections A through EE and visually illustrate the results of the analysis. The data input and
results of the model output for each cross section are contained within Appendix B.
Through the Ration Method hydrologic analysis, peak flowrates for storm runoff were
determined for the 2-year, 5-year, 10-year, 25-year, 50-year, and 100-year return periods.
The flowrate for any sub-area is the accumulation of runoff in that particular sub-area plus the
aggregation of runoff from each of the sub-areas upstream of that sub-area. For example,
runoff at the end of sub-area 5 is the sum of flow from sub-area 5 plus each preceding
sub-area (sub-areas 1 through 4). The peak flowrates for each sub-area for each storm was
modeled for each corresponding cross section. The results of the hydraulic analysis for the
2-year storm are summarized in Table 8. The results of the hydraulic analysis for the 5-year,
10-year, 25-year, 50-year, and 100-year storms are summarized in Tables 9 through 13,
respectively. The results of the open channel hydraulic analysis for each storm event are
contained in Appendixes C through H.
4.4 HYDRAULICS DISCUSSION
The maximum conveyance capacity of each of the cross sections was compared to the
calculated storm runoff expected at each cross section. The results of the comparison are
summarized in Table 14. For the 2-year storm, 21 of the 31 cross sections of the Uproad have
the capacity to convey the runoff generated by the storm. For the sections that do not have
the capacity to convey the runoff, flow essentially spills out of the roadway, likely draining over
the adjacent slope. This runoff will then flow directly down the hill to a natural drainage feature
or potentially is picked up by the road below, if applicable. For the 10-year storm, the number
of cross sections of the Uproad capable of conveying the runoff is 16 of the 31. For the
100-year storm, the number is reduced to 12 cross sections.
DRAFT
AMEC P:\164470\Docs\Hydrology and Drainage Study\Draft Report\MtRubidouxHydrology_Rpt Text_Rev1.docx 10
The Uproad does not have the capability to convey the full flow from the upper sub-areas at
certain cross sections; therefore, the hydraulic model is approximate because it does not
quantify and account for the lost flow in the cross sections that follow.
Noting the maximum discharges for each cross section (Table 14), the range for the Uproad
can be seen to vary from 1.9 cfs to 215.7 cfs. A range in conveyance capacity of the roadway
would be acceptable if the capacity steadily increased as one moved downstream; the
roadway at the bottom of the watershed would require a higher conveyance capacity because
flow accumulates as one moves downstream. The conveyance capacity of the Uproad varies
considerably between nearby cross sections: Section C can convey 215.7 cfs while just
downstream at Section D the capacity is 11.4 cfs. There is little consistency in the
conveyance capacity of the Uproad.
Another demonstration of the variability in conveyance capacity between cross sections in
close proximity begins with Section BB. Section BB (Figure 31) is capable of conveying the
100-year storm flow. Section N (Figure 17), approximately 25 feet downstream of Section BB,
is not able to convey the 2-year storm flow without spilling outside of the roadway. Section O
(Figure 18), approximately 110 feet downstream of Section N, is capable of conveying the
100-year storm flow.
The canyon in sub-area 12 is an area that has been observed to flow outside or over the
roadway. Section D is representative of the Uproad geometry in the vicinity of the canyon and
is not capable of conveying the flow for a 2-year or larger storm. The AC pavement of the
roadway in this area was replaced in 2009 and an AC berm was constructed in 2011. One of
the primary deficiencies of this cross section is that the roadway is sloped towards the
descending slope of the hillside and the AC berm is the only element that provides this area of
the Uproad some ability to convey water (Figure 7). Therefore, if the AC berm was not
constructed, most runoff that flows to this section would spill off the roadway and over the
downhill slope.
One of the objectives of this study was to analyze the construction of the AC berm along
sections of the Uproad adjacent to the residential properties along Miramonte Place. For
Section P, shown in Figure 19, the construction of the AC berm appears to not have a
substantial impact on the cross section’s ability to convey storm runoff; the 100-year storm
water surface just reaches the elevation of the bottom of the AC berm. For Sections L, Q, and
AA, the berm markedly improves the conveyance capacity; the 2-year storm runoff would
exceed each of these cross sections if the AC berm were not constructed (see Figures 15, 20,
and 30). By comparing the Section Q and Section CC shown on Figures 20 and 32, the
impact of the AC berm is apparent. Section Q contains a berm and Section CC does not.
DRAFT
AMEC P:\164470\Docs\Hydrology and Drainage Study\Draft Report\MtRubidouxHydrology_Rpt Text_Rev1.docx 11
Section Q can convey the 100-year storm runoff whereas Section CC, 50 feet downstream,
cannot convey the 2-year storm runoff.
The construction of the AC berm generally provides protection to the properties that are
shielded by the AC berm. The AC berms provide protection by changing the drainage
patterns. Runoff that would have flowed onto a property prior to construction of the AC berm
is now redirected downstream. This runoff has the potential to exacerbate conditions for
properties downstream. Although it is possible to identify the properties that are protected by
the AC berm, it is difficult to readily identify the properties where conditions are exacerbated by
the construction of the AC berm. There are stretches of the Uproad that do not have an AC
berm but are capable of conveying the 100-year storm runoff. There are also stretches of the
Uproad that have very little conveyance capacity. If a property in one of the areas with little
conveyance capacity is downstream of a property protected by an AC berm, the damage from
the runoff would be incremental and not all due to flow redirected by the AC berm because the
property had deficient protection before the construction of the AC berm.
The discontinuity in the AC berm located at Section M adds complexity to the analysis. Runoff
flowing along the roadway has momentum and therefore will not simply redirect itself to flow
out of the discontinuity. The short discontinuity in the AC berm acts as a side weir where the
flow in the roadway will continue along the roadway due to momentum but some water that is
higher in elevation than the bottom of the discontinuity will spill out of the gap in the AC berm.
If the discontinuity located at Section M were downstream of a natural drainage feature that
crosses the road, the situation would be different. Flow from the natural drainage feature at
the center of the canyon would be in line with the opening and flow immediately out of the
discontinuity. As it stands, the discontinuity is not downstream of the natural drainage feature
in the canyon and is actually higher in elevation. Quantifying the amount of flow through a
side weir is a complex analysis. But considering the surrounding AC berm both upstream and
downstream of this particular discontinuity, the overall protection afforded by the berms is
greater than if the berms were not constructed.
4.5 DEPOSITION OF SOIL ON THE UPROAD
Soil is eroded from the hillsides and is transported and deposited on the Uproad. The
deposition of the soil on the Uproad is highly dynamic depending on the varying intensity of the
precipitation and resulting runoff. Soil deposited on the Uproad was observed in sub-area 12
after the storm event in August and November 2013. The soil deposited in the roadway
blanketed the roadway and the AC berm and appeared to have the potential to act as a dam
preventing some runoff from continuing past the deposited soil forcing that runoff over the
downhill slope. The deposition of soil on the Uproad has the potential to redirect runoff and
adds uncertainty to the flow patterns during storm events.

DRAFT
AMEC P:\164470\Docs\Hydrology and Drainage Study\Draft Report\MtRubidouxHydrology_Rpt Text_Rev1.docx 12
5.0 RECOMMENDATIONS
The alternatives for addressing drainage at the site and recommendations are summarized
here.
5.1 ALTERNATIVES
Drainage infrastructure, consisting primarily of the AC berm, provides uneven and varying
levels of protection from storm runoff along the alignment of the Uproad adjacent to the
residencies on Miramonte Place. In addition to the intermittent nature of the drainage
infrastructure, the roadway cross section changes along the alignment of the Uproad adding
variability to its conveyance capacity.
Three strategies have been evaluated for the City to manage the drainage at Mount Rubidoux
Park. The first strategy is to provide an even and consistent level of drainage control along the
Uproad. This option would require reaching a consensus on the quantity of flow that the
drainage infrastructure would handle followed by construction to install traditional drainage
infrastructure. Alternative 1, described in the following section, addresses this strategy.
The second strategy is to continue to provide partial drainage control, as the existing drainage
infrastructure does, and address damage caused by runoff and erosion as it arises.
Alternatives 2 and 3 describe scenarios that would provide partial drainage control.
The third strategy is to limit drainage control to what is provided by the roadway without the AC
berm and restore drainage patterns to those prior to construction of the AC berm. The AC
berm installed in 2011 appears to be used solely for erosion control for the slope but has had
the unintended consequence of providing partial drainage control. Slope and erosion control
measures would be constructed in erosion prone areas within the tributary area and along the
Uproad. The erosion control measures, made of porous materials such as riprap and rock
filled gabion baskets, would have less influence on drainage patterns than the AC berms.
Alternative 4 in Section 5.1.4 describes this scenario.
The cost estimates developed for these alternatives are based on a conceptual design and
should be considered order-of-magnitude estimates. A more detailed design may reveal
higher costs unaccounted for in the conceptual design or may reveal efficiencies leading to
lower costs.
5.1.1 Alternative 1 - Install Storm Drain System Along the Alignment of the Uproad
Alternative 1 involves the construction of a storm drain system comprised of catch basins,
storm drains, and manholes to collect and convey the storm runoff. This alternative considers
full drainage control for the Uproad up to a predetermined storm event. The alignment of the

DRAFT
AMEC P:\164470\Docs\Hydrology and Drainage Study\Draft Report\MtRubidouxHydrology_Rpt Text_Rev1.docx 13
storm drain for this alternative follows the Uproad down the hill, then proceeds southeast on
Ninth Street where the storm drain would connect to the existing storm drain located on Cedar
Street. The alignment was selected in order to stay within the park’s boundary. The storm
drains’ route is circuitous and changes direction numerous times in order to stay within the
roadway; this alignment is not ideal for storm drain hydraulics as gradual changes in direction
of flow are preferred. Another possible variation of this option that was not developed would
involve constructing a storm drain system that goes directly down the face of Mount Rubidoux
at the location of the largest canyon. This would entail crossing the Uproad and traversing a
residential property until reaching Miramonte Place. The storm drain would go southwest on
Miramonte Place, then turn southeast on Fourteenth Street eventually joining the existing
storm drain located on Pine Street. The more direct alignment would require acquisition of a
storm drain easement on residential property.
The effectiveness of this alternative depends on the ability to collect and convey the storm
runoff accumulated at the point of concentration to a storm drain downstream. The closest
storm drain is located at the intersection of 9th Street and Cedar Street. The available capacity
in this storm drain is currently not known but may be available from the City of Riverside Public
Works Department. To facilitate collection of runoff, minor grading and the use of local
depressions around the catch basins would be necessary. Erosion control measures in the
vicinity of the catch basins would be used to reduce the amount of sediment transported and
deposited within the storm drain. Despite the inclusion of erosion control measures, long term
maintenance would be required to remove accumulated sediment within the catch basins and
storm drain that would reduce the flow capacity.
This alternative could be implemented with standard construction materials and methods.
Implementation of this alternative is contingent upon the availability of capacity in the existing
storm drain on Cedar Street. Constructing a storm drain system would require extensive
excavation and trenching in the Uproad. A geotechnical investigation would be necessary to
assess the subsurface conditions and to determine the feasibility of construction in proximity to
slopes susceptible to erosion.
A conceptual cost estimate was developed for Alternative 1 and is summarized in Table 15.
The conceptual storm drain system associated with this cost estimate was sized to convey the
peak runoff from the 10-year storm. Alternative 1 requires the installation of 5526 linear feet of
reinforced concrete pipe, 31 manholes, and 26 catch basins. The estimated capital
construction cost to implement Alternative 1 is approximately $1,705,500.
DRAFT
AMEC P:\164470\Docs\Hydrology and Drainage Study\Draft Report\MtRubidouxHydrology_Rpt Text_Rev1.docx 14
5.1.2 Alternative 2 - No Action
A “no action” alternative would leave the site and existing drainage system in place with no
alterations. The existing drainage improvements were installed as part of the 2009 and 2011
road repairs and consist primarily of AC berms and swales. The existing drainage
improvements provide partial drainage control at the site, presumably focused on slope
protection in the areas that were damaged by soil erosion after the December 2010 storm.
The effectiveness of the current drainage improvements was discussed in previous sections.
At locations on the Uproad shielded by an AC berm, drainage control was improved. At
locations on the Uproad not having an AC berm, drainage control was not improved. This
alternative is partially effective in controlling drainage and providing erosion control.
Implementation of this alternative requires no additional action. There are no construction
costs associated with this alternative.
5.1. 3 Alternative 3 – Install New AC Berm
Alternative 3 involves the construction of a new AC berm along the Uproad behind the
residencies located at 4165 and 4143 Miramonte Place. The berm would match the height
and width of the existing berm and would span the 120-foot gap between the two existing
berms. The new berm would provide drainage control for these residencies, one of which
sustained damage from the August 2013 storm. The changes associated with this alternative
are focused on providing drainage control for a property that appears to have been impacted
by the partial drainage control provided by the drainage improvements constructed in 2011.
This alternative is effective in providing drainage control for properties at 4165 and 4143
Miramonte Place but reroutes runoff flowing onto said properties downstream, potentially
resulting in flow entering other properties downstream. However, immediately following the
existing berm, there is a rock- lined swale located at Station 18+65 that allows roadway
overflow to enter the residential property located at 4085 Miramonte Place and presumably
onto the roadway. Although this swale appears to have the ability to direct some runoff off the
roadway, the capacity of the swale is not known. It is unclear what capacity the City can rely
on the drainage swale or if the City can improve the capacity of the swale. Alternative 3
provides drainage control for the adjacent residential properties but the drainage pattern of the
rerouted flow is uncertain.
Alternative 3 can be implemented with standard construction materials and methods in a short
timeframe. The scope of the construction involves installation of 120 feet of AC berm
estimated to have a capital construction cost of $41,250. Table 15 summarizes the
construction cost for the drainage improvement.

DRAFT
AMEC P:\164470\Docs\Hydrology and Drainage Study\Draft Report\MtRubidouxHydrology_Rpt Text_Rev1.docx 15
5.1.4 Alternative 4 - Remove the AC Berms and Install Erosion Control Measures
For Alternative 4, all of the AC berms along the Uproad adjacent to the residencies on
Miramonte Place would be removed. Consequently, removing the AC berms would reduce
drainage control. This alternative would attempt to reestablish the drainage patterns that
existed prior to the construction of the AC berms. Assuming the AC berms were installed for
erosion control, other measures protecting against erosion would be placed along the shoulder
of the roadway as well as in the canyon and around natural drainage features. These
measures would help to reduce erosion while decreasing the overall effects of altering the
drainage pattern. The design would utilize a combination of riprap, gabion baskets, and other
measures that would allow flow through and around the additions. Introduction of native
vegetation may be an option to aid in erosion control if it is acceptable and does not require
long-term irrigation.
The AC berms redirected flow as well as concentrated flow. The removal of the AC berms
would allow runoff to disburse to a wider area and not concentrate and be released at sections
of the Uproad where the roadway has a lower conveyance capacity. The effectiveness of this
alternative relies on the implicit notion that the flow patterns prior to the construction of the AC
berm were acceptable. Also, the erosion control measures used would need to be roughly as
effective at providing protection as the AC berm where it was successful at providing drainage
control. Erosion control measures would need to be thorough and widespread, not just
located at the location of the AC berm to be removed. If erosion occurs in the upper portion of
the tributary area and is transported and deposited along the lower portion of the Uproad, the
deposited soil may reduce the ability of runoff to flow through the erosion control measures
and may result in the runoff being redirected. Long-term inspection, maintenance, and
periodic replacement of the erosion control measures will be required, especially after large
storm events.
This alternative could be implemented with standard construction materials and methods. The
challenge to implementation of this alternative is determining the correct locations and extent
of the erosion control measures necessary and simultaneously considering the impacts on the
natural landscape and habitat within the park.
Alternative 4 includes the removal of 655 linear feet of AC berm, installation of gabion baskets
totaling 4269 square yards, and placement of rip rap covering 1856 square yards of land. The
estimated capital construction cost to implement Alternative 4 is approximately $664,100 and
summarized in Table 15.

DRAFT
AMEC P:\164470\Docs\Hydrology and Drainage Study\Draft Report\MtRubidouxHydrology_Rpt Text_Rev1.docx 16
5.2 RECOMMENDATIONS
The alternatives provided for drainage improvement at the site are not ideal. The preferred
method of dealing with drainage is during the planning stage of land development. The
development of the residencies along Miramonte Place would have benefitted from drainage
infrastructure that would have allowed drainage to flow directly downhill from Mount Rubidoux.
Also, the inclusion of culverts under the Uproad during initial construction would have retained
more of the natural drainage patterns at the site.
Implementing Alternative 1 will require extensive construction along the Uproad and limit
access to the park. Construction activities will extend outside of the site and the available
capacity of the storm drain on Cedar Street is currently not known. The costs for Alternative 1
are high relative to the other alternatives.
Alternatives 2 and 3 require little to no construction but provide only partial drainage control.
Results similar to those experienced after the August 2013 storm event can be expected for
large storm events in the future.
Alternative 4 minimizes drainage control in an effort to restore drainage patterns prior to the
emergency road repairs conducted in 2009 and 2011. The viability of the alternative relies on
the notion that drainage patterns prior to the emergency road repair were acceptable.
It is recommended that the City review its available resources and determine acceptable risks
associated with the alternatives. A long-term, comprehensive approach for dealing with
drainage at Mount Rubidoux is recommended.
6.0 REFERENCES
City of Riverside, Parks, Recreation & Community Services Department, 2011, City Council Memorandum - Subject: Mt. Rubidoux Trail/Roadway – Resolution Declaring the Roadway Stabilization and Repairs an Urgent Necessity for Preservation of Life, Health and Property; Authorization for Emergency Work – Supplemental Appropriation.
Friends of Mt. Rubidoux, 2014, Natural Resources – Plants, available at http://www.mt-
rubidoux.org/ Haan, C.T., Barfield, B.J., and Hayes, J.C., 1994, Design Hydrology and Sedimentology for
Small Catchments, Academic Press. Hilltop Geotechnical, Inc., 2011, Report of Mount Rubidoux Park Emergency Road Repair,
Riverside, California, January 12. Rick Engineering Company, 2011, Mount Rubidoux Emergency Road Repairs 2011
(Engineering Plans)
DRAFT
AMEC P:\164470\Docs\Hydrology and Drainage Study\Draft Report\MtRubidouxHydrology_Rpt Text_Rev1.docx 17
Rick Engineering Company, 2009, Mount Rubidoux Road Repair (Engineering Plans) Riverside County Flood Control and Water Conservation District, 1978, Hydrology Manual University of California, Riverside (U.C. Riverside), 2014, University of California Cooperative
Extension – Riverside County, U.C. Riverside, Riverside – Daily Totals for November; available at http://ceriverside.ucanr.edu/about/weather_667/?weather=monthlyinfo&station=44&month=11

TABLES

DRAFT
Area I.D. Area (feet2)Area
(acres)Upper Station
Lower Station
Centerline Distance
(feet)
Upper Elevation
(feet)
Lower Elevation
(feet)
Elevation
(feet)Assigned Cross
Section
1 16,291 0.37 255.0 1270 1152 118 Initial Subarea
2 19,943 0.46 207.0 1152 1048.62 103.38 Mountain Channel
3 26,746 0.61 4294.41 4200.00 94.4 1048.62 1045.29 3.33 A
4 31,324 0.72 4200.00 4078.19 121.8 1045.29 1040.99 4.3 A
5 34,909 0.80 4078.19 4032.75 45.4 1040.99 1039.39 1.6 A
6 62,952 1.45 4032.75 3993.77 39.0 1039.39 1038.02 1.37 A
7 39,611 0.91 3993.77 3769.90 223.9 1038.02 1030.12 7.9 A
8 19,794 0.45 3769.90 3735.49 34.4 1030.12 1028.9 1.22 A
9 35,103 0.81 3735.49 3466.17 269.3 1028.9 1019.71 9.19 A
10 51,925 1.19 3466.17 3436.79 29.4 1019.71 1018.77 0.94 B
11 22,071 0.51 3436.79 3271.70 165.1 1018.77 1011.46 7.31 C
12 174,103 4.00 3271.70 3210.53 61.2 1011.46 1009.52 1.94 D
13 13,881 0.32 3210.53 3108.64 101.9 1009.52 1005.66 3.86 E
14 25,400 0.58 3108.64 3063.18 45.5 1005.66 1002.81 2.85 F
15 42,807 0.98 3063.18 3011.35 51.8 1002.81 1000.58 2.23 G
16 13,739 0.32 3011.35 2938.26 73.1 1000.58 997.9 2.68 H
17 35,101 0.81 2938.26 2879.51 58.8 997.9 996.31 1.59 I
18 21,589 0.50 2879.51 2777.89 101.6 996.31 990.97 5.34 J
19 2,242 0.05 2777.89 2700.00 77.9 990.97 988.21 2.76 K
20 2,422 0.06 2700.00 2611.43 88.6 988.21 982.77 5.44 L
21 5,908 0.14 2611.43 2467.53 143.9 982.77 978.01 4.76 M
22 10,934 0.25 2467.53 2335.83 131.7 978.01 973.3 4.71 N
23 9,304 0.21 2335.83 2227.05 108.8 973.3 969.27 4.03 O
24 9 954 0 23 2227 05 2123 36 103 7 969 27 964 66 4 61 P
UPROAD TRIBUTARY SUB-AREAS TABLE 1
Riverside, CaliforniaHydrology and Drainage Study - Mount Rubidoux Park
P:\164470\Docs\Hydrology and Drainage Study\Draft Report\Tables\Tables 1-7_RubidouxHydrology AMEC
24 9,954 0.23 2227.05 2123.36 103.7 969.27 964.66 4.61 P
25 15,074 0.35 2123.36 1992.92 130.4 964.66 958.54 6.12 Q
26 18,339 0.42 1992.92 1834.23 158.7 958.54 951.76 6.78 R
27 13,271 0.30 1834.23 1772.55 61.7 951.76 948.17 3.59 S
28 39,251 0.90 1772.55 1628.50 144.1 948.17 943.01 5.16 T
29 92,345 2.12 1628.50 1433.53 195.0 943.01 934.18 8.83 U
30 37,227 0.85 1433.53 1057.06 376.5 934.18 918.16 16.02 V
31 49,407 1.13 1057.06 747.74 309.3 918.16 906.38 11.78 W
32 36,940 0.85 747.74 590.89 156.9 906.38 903.17 3.21 X
33 22,114 0.51 590.89 438.31 152.6 903.17 899.91 3.26 Y
34 54,361 1.25 438.31 31.43 406.9 899.91 896.14 3.77 Z
Total 25.40
P:\164470\Docs\Hydrology and Drainage Study\Draft Report\Tables\Tables 1-7_RubidouxHydrology AMEC

DRAFT
Sub-Area
Soil
Group2 Cover Type3 Area (feet2)Area
(acres)
Impervious
Area (ft2)Percent
ImperviousRainfall Intensity4
(in/hour)
Runoff
Index5
Runoff
Coefficient6 Flow
Rate (cfs) Flow
Rate (cfs)Upper
Elevation (ft)Lower
Elevation (ft)Length of Sub-
Area (feet)Slope (ft/ft) Section
Velocity7
(ft/s) Time of Concentration8
(minutes) Time of
Concentration (minutes)
1 C Open Brush 16,291 0.37 0 0% 1.88 77 0.73 0.51 1270 1152 255 5.75 5.75
2 C Open Brush 19,943 0.46 828 4% 1.74 77 0.73 0.58 0.51 1152 1048.62 207.0 0.499 Nat. Mtn. Chan.9 3.9 0.88 6.63
3 C Open Brush 26,746 0.61 836 3% 1.68 77 0.73 0.75 1.10 1048.62 1045.29 94.4 0.035 Section A 3.46 0.45 7.09
4 C Open Brush 31,324 0.72 1061 3% 1.61 77 0.73 0.85 1.85 1045.29 1040.99 121.8 0.035 Section A 3.78 0.54 7.63
5 C Open Brush 34,909 0.80 425 1% 1.59 77 0.70 0.89 2.69 1040.99 1039.39 45.4 0.035 Section A 4.08 0.19 7.81
6 C Open Brush 62,952 1.45 346 1% 1.57 77 0.70 1.59 3.58 1039.39 1038.02 39.0 0.035 Section A 4.32 0.15 7.96
7 C Open Brush 39,611 0.91 1831 5% 1.50 77 0.71 0.97 5.18 1038.02 1030.12 223.9 0.035 Section A 4.85 0.77 8.73
TABLE 2STORM RUNOFF PEAK FLOW RATES FOR 2-YEAR STORM
RATIONAL METHOD CALCULATIONS1
Hydrology and Drainage Study - Mount Rubidoux ParkRiverside, California
P:\164470\Docs\Hydrology and Drainage Study\Draft Report\Tables\Tables 1-7_RubidouxHydrology AMEC
7 C Open Brush 39,611 0.91 1831 5% 1.50 77 0.71 0.97 5.18 1038.02 1030.12 223.9 0.035 Section A 4.85 0.77 8.73
8 C Open Brush 19,794 0.45 289 1% 1.48 77 0.70 0.47 6.14 1030.12 1028.9 34.4 0.035 Section A 5.19 0.11 8.84
9 C Open Brush 35,103 0.81 2790 8% 1.41 77 0.71 0.81 6.61 1028.9 1019.71 269.3 0.034 Section A 5.29 0.85 9.69
10 C Open Brush 51,925 1.19 296 1% 1.40 77 0.69 1.16 7.42 1019.71 1018.77 29.4 0.032 Section B 5.48 0.09 9.78
11 C Open Brush 22,071 0.51 1650 7% 1.37 77 0.69 0.48 8.58 1018.77 1011.46 165.1 0.044 Section C 5.51 0.50 10.28
12 C Open Brush 174,103 4.00 697 0.4% 1.35 77 0.68 3.66 9.05 1011.46 1009.52 61.2 0.032 Section D 3.84 0.27 10.55
13 C Open Brush 13,881 0.32 968 7% 1.33 77 0.69 0.29 12.72 1009.52 1005.66 101.9 0.038 Section E 5.25 0.32 10.87
14 C Open Brush 25,400 0.58 422 2% 1.32 77 0.68 0.52 13.01 1005.66 1002.81 45.5 0.063 Section F 7.21 0.11 10.97
15 C Open Brush 42,807 0.98 499 1% 1.31 77 0.67 0.86 13.53 1002.81 1000.58 51.8 0.043 Section G 5.45 0.16 11.13
16 C Open Brush 13,739 0.32 710 5% 1.29 77 0.68 0.28 14.39 1000.58 997.9 73.1 0.037 Section H 5.43 0.22 11.36
17 C Open Brush 35,101 0.81 599 2% 1.28 77 0.67 0.69 14.67 997.9 996.31 58.8 0.027 Section I 4.7 0.21 11.56
18 C Open Brush 21,589 0.50 1555 7% 1.26 77 0.68 0.43 15.36 996.31 990.97 101.6 0.053 Section J 5.91 0.29 11.85
19 C Open Brush 2,242 0.05 1027 46% 1.25 77 0.77 0.05 15.79 990.97 988.21 77.9 0.035 Section K 6.94 0.19 12.04
20 C Open Brush 2,422 0.06 940 39% 1.24 77 0.76 0.05 15.84 988.21 982.77 88.6 0.061 Section L 7.57 0.20 12.23
21 C Open Brush 5,908 0.14 1390 24% 1.22 77 0.73 0.12 15.89 982.77 978.01 143.9 0.033 Section M 6.21 0.39 12.62
22 C Open Brush 10,934 0.25 1337 12% 1.20 77 0.68 0.20 16.01 978.01 973.3 131.7 0.036 Section N 5.13 0.43 13.05
23 C Open Brush 9,304 0.21 1101 12% 1.18 77 0.68 0.17 16.21 973.3 969.27 108.8 0.037 Section O 5.45 0.33 13.38
24 C Open Brush 9,954 0.23 1025 10% 1.17 77 0.68 0.18 16.38 969.27 964.66 103.7 0.044 Section P 5.91 0.29 13.67
25 C Open Brush 15,074 0.35 1308 9% 1.15 77 0.67 0.27 16.57 964.66 958.54 130.4 0.047 Section Q 7.08 0.31 13.98
26 C Open Brush 18,339 0.42 1587 9% 1.13 77 0.67 0.32 16.83 958.54 951.76 158.7 0.043 Section R 6.32 0.42 14.40
27 C Open Brush 13,271 0.30 699 5% 1.13 77 0.67 0.23 17.15 951.76 948.17 61.7 0.058 Section S 6.94 0.15 14.55
28 C Open Brush 39,251 0.90 1468 4% 1.11 77 0.67 0.67 17.38 948.17 943.01 144.1 0.036 Section T 5.55 0.43 14.98
29 C Open Brush 92,345 2.12 7839 8% 1.09 77 0.67 1.55 18.05 943.01 934.18 195.0 0.045 Section U 6.89 0.47 15.45
30 C Open Brush 37,227 0.85 4245 11% 1.06 77 0.67 0.61 19.61 934.18 918.16 376.5 0.043 Section V 6.97 0.90 16.35
31 C Open Brush 49,407 1.13 3608 7% 1.03 77 0.65 0.76 20.21 918.16 906.38 309.3 0.038 Section W 7.45 0.69 17.04
32 C Open Brush 36,940 0.85 1686 5% 1.02 77 0.65 0.56 20.97 906.38 903.17 156.9 0.020 Section X 6.27 0.42 17.46
33 C Open Brush 22,114 0.51 1681 8% 1.00 77 0.66 0.34 21.54 903.17 899.91 152.6 0.021 Section Y 4.48 0.57 18.03
34 C Open Brush 54,361 1.25 6014 11% 0.95 77 0.66 0.78 21.87 899.91 896.14 406.9 0.009 Section Z 3.75 1.81 19.84
Total 1,106,379 25.40 52,757 5% 22.7
Notes:1. Riverside County Flood Control and Water Conservation District Hydrology Manual, April 19782. Plate C-1.15, RCFC&WCD 19783. Plate C-2, RCFC&WCD 19784. Plate D-4.3, 4.4, 4.5, 4.6, 4.7, and regression line equations, RCFC&WCD 19785. Plate D-5.5, RCFC&WCD 19786. Plate D-5.7 (10 of 12) - Since table exists for even numbered values, use value of 76, RCFC&WCD 19787. Plate D-6.3 for Natural Mountain Channel, Use Bentley FlowMaster Software for Street Sections, RCFC&WCD 19788. Plate D-3 for Initial Sub-Area, RCFC&WCD 19789. Assume flowrate, Q = 1 cfs, the minimum value on Plate D-6.3.
P:\164470\Docs\Hydrology and Drainage Study\Draft Report\Tables\Tables 1-7_RubidouxHydrology AMEC

DRAFT
Sub-Area
Soil
Group2 Cover Type3 Area (feet2)Area
(acres)
Impervious
Area (ft2)Percent
ImperviousRainfall Intensity4
(in/hour)
Runoff
Index5
Runoff
Coefficient6 Flow
Rate (cfs) Flow
Rate (cfs)Upper
Elevation (ft)Lower
Elevation (ft)Length of Sub-
Area (feet)Slope (ft/ft) Section
Velocity7
(ft/s) Time of Concentration8
(minutes) Time of
Concentration (minutes)
1 C Open Brush 16,291 0.37 0 0% 2.39 77 0.76 0.68 1270 1152 255 5.75 5.75
2 C Open Brush 19,943 0.46 828 4% 2.22 77 0.76 0.77 0.68 1152 1048.62 207.0 0.499 Nat. Mtn. Chan. 3.9 0.88 6.63
3 C Open Brush 26,746 0.61 836 3% 2.14 77 0.76 1.00 1.45 1048.62 1045.29 94.4 0.035 Section A 3.61 0.44 7.07
4 C Open Brush 31,324 0.72 1061 3% 2.06 77 0.75 1.11 2.45 1045.29 1040.99 121.8 0.035 Section A 4.01 0.51 7.58
5 C Open Brush 34,909 0.80 425 1% 2.04 77 0.74 1.21 3.56 1040.99 1039.39 45.4 0.035 Section A 4.32 0.18 7.75
6 C Open Brush 62,952 1.45 346 1% 2.02 77 0.74 2.16 4.77 1039.39 1038.02 39.0 0.035 Section A 4.7 0.14 7.89
7 C Open Brush 39,611 0.91 1831 5% 1.93 77 0.74 1.30 6.93 1038.02 1030.12 223.9 0.035 Section A 5.43 0.69 8.58
TABLE 3STORM RUNOFF PEAK FLOW RATES FOR 5-YEAR STORM
RATIONAL METHOD CALCULATIONS1
Hydrology and Drainage Study - Mount Rubidoux ParkRiverside, California
P:\164470\Docs\Hydrology and Drainage Study\Draft Report\Tables\Tables 1-7_RubidouxHydrology AMEC
8 C Open Brush 19,794 0.45 289 1% 1.92 77 0.73 0.64 8.23 1030.12 1028.9 34.4 0.035 Section A 5.8 0.10 8.68
9 C Open Brush 35,103 0.81 2790 8% 1.83 77 0.75 1.11 8.86 1028.9 1019.71 269.3 0.034 Section A 5.92 0.76 9.43
10 C Open Brush 51,925 1.19 296 1% 1.82 77 0.73 1.59 9.97 1019.71 1018.77 29.4 0.032 Section B 5.86 0.08 9.52
11 C Open Brush 22,071 0.51 1650 7% 1.77 77 0.73 0.66 11.56 1018.77 1011.46 165.1 0.044 Section C 5.51 0.50 10.02
12 C Open Brush 174,103 4.00 697 0.4% 1.75 77 0.72 5.04 12.21 1011.46 1009.52 61.2 0.032 Section D 4.26 0.24 10.26
13 C Open Brush 13,881 0.32 968 7% 1.72 77 0.73 0.40 17.25 1009.52 1005.66 101.9 0.038 Section E 5.88 0.29 10.55
14 C Open Brush 25,400 0.58 422 2% 1.72 77 0.72 0.72 17.65 1005.66 1002.81 45.5 0.063 Section F 8.06 0.09 10.64
15 C Open Brush 42,807 0.98 499 1% 1.70 77 0.72 1.21 18.37 1002.81 1000.58 51.8 0.043 Section G 5.96 0.14 10.78
16 C Open Brush 13,739 0.32 710 5% 1.69 77 0.73 0.39 19.58 1000.58 997.9 73.1 0.037 Section H 6.05 0.20 10.99
17 C Open Brush 35,101 0.81 599 2% 1.67 77 0.71 0.96 19.96 997.9 996.31 58.8 0.027 Section I 5.15 0.19 11.18
18 C Open Brush 21,589 0.50 1555 7% 1.65 77 0.72 0.59 20.92 996.31 990.97 101.6 0.053 Section J 6.67 0.25 11.43
19 C Open Brush 2,242 0.05 1027 46% 1.64 77 0.80 0.07 21.51 990.97 988.21 77.9 0.035 Section K 7.78 0.17 11.60
20 C Open Brush 2,422 0.06 940 39% 1.62 77 0.79 0.07 21.58 988.21 982.77 88.6 0.061 Section L 8.47 0.17 11.77
21 C Open Brush 5,908 0.14 1390 24% 1.60 77 0.76 0.16 21.65 982.77 978.01 143.9 0.033 Section M 6.94 0.35 12.12
22 C O B h 10 934 0 2 1337 12% 1 77 0 73 0 29 21 81 0 036 S i N 5 79 0 3822 C Open Brush 10,934 0.25 1337 12% 1.57 77 0.73 0.29 21.81 978.01 973.3 131.7 0.036 Section N 5.79 0.38 12.50
23 C Open Brush 9,304 0.21 1101 12% 1.55 77 0.72 0.24 22.10 973.3 969.27 108.8 0.037 Section O 6.05 0.30 12.80
24 C Open Brush 9,954 0.23 1025 10% 1.54 77 0.72 0.25 22.34 969.27 964.66 103.7 0.044 Section P 6.53 0.26 13.06
25 C Open Brush 15,074 0.35 1308 9% 1.52 77 0.72 0.38 22.59 964.66 958.54 130.4 0.047 Section Q 7.96 0.27 13.33
26 C Open Brush 18,339 0.42 1587 9% 1.50 77 0.72 0.45 22.97 958.54 951.76 158.7 0.043 Section R 7.13 0.37 13.70
27 C Open Brush 13,271 0.30 699 5% 1.49 77 0.71 0.32 23.43 951.76 948.17 61.7 0.058 Section S 7.83 0.13 13.84
28 C Open Brush 39,251 0.90 1468 4% 1.47 77 0.71 0.94 23.75 948.17 943.01 144.1 0.036 Section T 6.26 0.38 14.22
29 C Open Brush 92,345 2.12 7839 8% 1.44 77 0.71 2.17 24.69 943.01 934.18 195.0 0.045 Section U 7.77 0.42 14.64
30 C Open Brush 37,227 0.85 4245 11% 1.40 77 0.71 0.85 26.86 934.18 918.16 376.5 0.043 Section V 7.09 0.88 15.52
31 C Open Brush 49,407 1.13 3608 7% 1.37 77 0.69 1.07 27.71 918.16 906.38 309.3 0.038 Section W 8.37 0.62 16.14
32 C Open Brush 36,940 0.85 1686 5% 1.35 77 0.69 0.79 28.78 906.38 903.17 156.9 0.020 Section X 6.99 0.37 16.51
33 C Open Brush 22,114 0.51 1681 8% 1.33 77 0.70 0.47 29.57 903.17 899.91 152.6 0.021 Section Y 5.03 0.51 17.02
34 C Open Brush 54,361 1.25 6014 11% 1.27 77 0.69 1.09 30.05 899.91 896.14 406.9 0.009 Section Z 4.17 1.63 18.64
Total 1,106,379 25.40 52,757 5% 31.1
Notes:1. Riverside County Flood Control and Water Conservation District Hydrology Manual, April 19782. Plate C-1.15, RCFC&WCD 19783. Plate C-2, RCFC&WCD 19784. Plate D-4.3, 4.4, 4.5, 4.6, 4.7, and regression line equations, RCFC&WCD 19785. Plate D-5.5, RCFC&WCD 19786. Plate D-5.7 (10 of 12) - Since table exists for even numbered values, use value of 76, RCFC&WCD 19787. Plate D-6.3 for Natural Mountain Channel, Use Bentley FlowMaster Software for Street Sections, RCFC&WCD 19788. Plate D-3 for Initial Sub-Area, RCFC&WCD 19789. Assume flowrate, Q = 1 cfs, the minimum value on Plate D-6.3.
P:\164470\Docs\Hydrology and Drainage Study\Draft Report\Tables\Tables 1-7_RubidouxHydrology AMEC

DRAFT
Sub-Area
Soil
Group2 Cover Type3 Area (feet2)Area
(acres)
Impervious
Area (ft2)Percent
ImperviousRainfall Intensity4
(in/hour)
Runoff
Index5
Runoff
Coefficient6 Flow
Rate (cfs) Flow
Rate (cfs)Upper
Elevation (ft)Lower
Elevation (ft)Length of Sub-
Area (feet)Slope (ft/ft) Section
Velocity7
(ft/s) Time of Concentration8
(minutes) Time of
Concentration (minutes)
1 C Open Brush 16,291 0.37 0 0% 2.69 77 0.78 0.79 1270 1152 255 5.75 5.75
2 C Open Brush 19,943 0.46 828 4% 2.49 77 0.78 0.89 0.79 1152 1048.62 207.0 0.499 Nat. Mtn. Chan. 3.9 0.88 6.63
3 C Open Brush 26,746 0.61 836 3% 2.41 77 0.78 1.15 1.67 1048.62 1045.29 94.4 0.035 Section A 3.71 0.42 7.06
4 C Open Brush 31,324 0.72 1061 3% 2.32 77 0.77 1.28 2.83 1045.29 1040.99 121.8 0.035 Section A 4.11 0.49 7.55
5 C Open Brush 34,909 0.80 425 1% 2.29 77 0.76 1.40 4.11 1040.99 1039.39 45.4 0.035 Section A 4.46 0.17 7.72
6 C Open Brush 62,952 1.45 346 1% 2.27 77 0.76 2.49 5.51 1039.39 1038.02 39.0 0.035 Section A 4.97 0.13 7.85
7 C Open Brush 39,611 0.91 1831 5% 2.17 77 0.76 1.50 8.00 1038 02 1030 12 223 9 0.035 Section A 5.75 0.65 8 50
TABLE 4STORM RUNOFF PEAK FLOW RATES FOR 10-YEAR STORM
RATIONAL METHOD CALCULATIONS1
Hydrology and Drainage Study - Mount Rubidoux ParkRiverside, California
P:\164470\Docs\Hydrology and Drainage Study\Draft Report\Tables\Tables 1-7_RubidouxHydrology AMEC
7 C Open Brush 39,611 0.91 1831 5% 2.17 77 0.76 1.50 8.00 1038.02 1030.12 223.9 0.035 Section A 5.75 0.65 8.50
8 C Open Brush 19,794 0.45 289 1% 2.16 77 0.75 0.74 9.50 1030.12 1028.9 34.4 0.035 Section A 6.13 0.09 8.60
9 C Open Brush 35,103 0.81 2790 8% 2.07 77 0.76 1.27 10.24 1028.9 1019.71 269.3 0.034 Section A 6.26 0.72 9.31
10 C Open Brush 51,925 1.19 296 1% 2.06 77 0.74 1.82 11.51 1019.71 1018.77 29.4 0.032 Section B 5.97 0.08 9.39
11 C Open Brush 22,071 0.51 1650 7% 2.00 77 0.75 0.76 13.32 1018.77 1011.46 165.1 0.044 Section C 5.66 0.49 9.88
12 C Open Brush 174,103 4.00 697 0.4% 1.98 77 0.74 5.85 14.09 1011.46 1009.52 61.2 0.032 Section D 4.47 0.23 10.11
13 C Open Brush 13,881 0.32 968 7% 1.95 77 0.75 0.47 19.94 1009.52 1005.66 101.9 0.038 Section E 6.22 0.27 10.38
14 C Open Brush 25,400 0.58 422 2% 1.94 77 0.74 0.84 20.40 1005.66 1002.81 45.5 0.063 Section F 8.52 0.09 10.47
15 C Open Brush 42,807 0.98 499 1% 1.93 77 0.73 1.38 21.24 1002.81 1000.58 51.8 0.043 Section G 6.29 0.14 10.61
16 C Open Brush 13,739 0.32 710 5% 1.91 77 0.74 0.45 22.63 1000.58 997.9 73.1 0.037 Section H 6.37 0.19 10.80
17 C Open Brush 35,101 0.81 599 2% 1.89 77 0.73 1.11 23.07 997.9 996.31 58.8 0.027 Section I 5.44 0.18 10.98
18 C Open Brush 21,589 0.50 1555 7% 1.87 77 0.74 0.69 24.18 996.31 990.97 101.6 0.053 Section J 7.06 0.24 11.22
19 C Open Brush 2,242 0.05 1027 46% 1.86 77 0.80 0.08 24.87 990.97 988.21 77.9 0.035 Section K 8.19 0.16 11.38
20 C Open Brush 2,422 0.06 940 39% 1.84 77 0.80 0.08 24.95 988.21 982.77 88.6 0.061 Section L 8.92 0.17 11.54
21 C Open Brush 5,908 0.14 1390 24% 1.81 77 0.77 0.19 25.03 982.77 978.01 143.9 0.033 Section M 7.34 0.33 11.87
22 C Open Brush 10,934 0.25 1337 12% 1.78 77 0.74 0.33 25.22 978.01 973.3 131.7 0.036 Section N 6.13 0.36 12.23
23 C Open Brush 9,304 0.21 1101 12% 1.76 77 0.74 0.28 25.55 973.3 969.27 108.8 0.037 Section O 6.34 0.29 12.51
24 C Open Brush 9,954 0.23 1025 10% 1.74 77 0.74 0.29 25.83 969.27 964.66 103.7 0.044 Section P 6.85 0.25 12.77
25 C Open Brush 15,074 0.35 1308 9% 1.72 77 0.74 0.44 26.12 964.66 958.54 130.4 0.047 Section Q 8.39 0.26 13.03
26 C Open Brush 18,339 0.42 1587 9% 1.70 77 0.74 0.53 26.56 958.54 951.76 158.7 0.043 Section R 7.54 0.35 13.38
27 C Open Brush 13,271 0.30 699 5% 1.69 77 0.73 0.38 27.09 951.76 948.17 61.7 0.058 Section S 8.28 0.12 13.50
28 C Open Brush 39,251 0.90 1468 4% 1.67 77 0.72 1.08 27.47 948.17 943.01 144.1 0.036 Section T 6.63 0.36 13.86
29 C Open Brush 92,345 2.12 7839 8% 1.64 77 0.73 2.54 28.55 943.01 934.18 195.0 0.045 Section U 8.19 0.40 14.26
30 C Open Brush 37,227 0.85 4245 11% 1.59 77 0.73 0.99 31.09 934.18 918.16 376.5 0.043 Section V 7.41 0.85 15.11
31 C Open Brush 49,407 1.13 3608 7% 1.56 77 0.72 1.27 32.08 918.16 906.38 309.3 0.038 Section W 8.84 0.58 15.69
32 C Open Brush 36,940 0.85 1686 5% 1.54 77 0.71 0.93 33.35 906.38 903.17 156.9 0.020 Section X 7.35 0.36 16.04
33 C Open Brush 22,114 0.51 1681 8% 1.51 77 0.72 0.55 34.28 903.17 899.91 152.6 0.021 Section Y 5.31 0.48 16.52
34 C Open Brush 54,361 1.25 6014 11% 1.44 77 0.71 1.28 34.83 899.91 896.14 406.9 0.009 Section Z 4.4 1.54 18.07
Total 1,106,379 25.40 52,757 5% 36.1
Notes:1. Riverside County Flood Control and Water Conservation District Hydrology Manual, April 19782. Plate C-1.15, RCFC&WCD 19783. Plate C-2, RCFC&WCD 19784. Plate D-4.3, 4.4, 4.5, 4.6, 4.7, and regression line equations, RCFC&WCD 19785. Plate D-5.5, RCFC&WCD 19786. Plate D-5.7 (10 of 12) - Since table exists for even numbered values, use value of 76, RCFC&WCD 19787. Plate D-6.3 for Natural Mountain Channel, Use Bentley FlowMaster Software for Street Sections, RCFC&WCD 19788. Plate D-3 for Initial Sub-Area, RCFC&WCD 19789. Assume flowrate, Q = 1 cfs, the minimum value on Plate D-6.3.
P:\164470\Docs\Hydrology and Drainage Study\Draft Report\Tables\Tables 1-7_RubidouxHydrology AMEC

DRAFT
Sub-Area
Soil
Group2 Cover Type3 Area (feet2)Area
(acres)
Impervious
Area (ft2)Percent
ImperviousRainfall Intensity4
(in/hour)
Runoff
Index5
Runoff
Coefficient6 Flow
Rate (cfs) Flow
Rate (cfs)Upper
Elevation (ft)Lower
Elevation (ft)Length of Sub-
Area (feet)Slope (ft/ft) Section
Velocity7
(ft/s) Time of Concentration8
(minutes) Time of
Concentration (minutes)
1 C Open Brush 16,291 0.37 0 0% 3.12 77 0.79 0.92 1270 1152 255 5.75 5.75
2 C Open Brush 19,943 0.46 828 4% 2.88 77 0.79 1.04 0.92 1152 1048.62 207.0 0.499 Nat. Mtn. Chan. 3.9 0.88 6.63
3 C Open Brush 26,746 0.61 836 3% 2.79 77 0.79 1.35 1.96 1048.62 1045.29 94.4 0.035 Section A 3.82 0.41 7.05
4 C Open Brush 31,324 0.72 1061 3% 2.69 77 0.78 1.51 3.32 1045.29 1040.99 121.8 0.035 Section A 4.25 0.48 7.52
5 C Open Brush 34,909 0.80 425 1% 2.66 77 0.78 1.66 4.83 1040.99 1039.39 45.4 0.035 Section A 4.72 0.16 7.68
6 C Open Brush 62,952 1.45 346 1% 2.64 77 0.78 2.97 6.49 1039.39 1038.02 39.0 0.035 Section A 5.3 0.12 7.81
7 C Open Brush 39,611 0.91 1831 5% 2.53 77 0.78 1.80 9.47 1038 02 1030 12 223 9 0.035 Section A 6.12 0.61 8 42
TABLE 5STORM RUNOFF PEAK FLOW RATES FOR 25-YEAR STORM
RATIONAL METHOD CALCULATIONS1
Hydrology and Drainage Study - Mount Rubidoux ParkRiverside, California
P:\164470\Docs\Hydrology and Drainage Study\Draft Report\Tables\Tables 1-7_RubidouxHydrology AMEC
7 C Open Brush 39,611 0.91 1831 5% 2.53 77 0.78 1.80 9.47 1038.02 1030.12 223.9 0.035 Section A 6.12 0.61 8.42
8 C Open Brush 19,794 0.45 289 1% 2.52 77 0.77 0.88 11.26 1030.12 1028.9 34.4 0.035 Section A 6.55 0.09 8.50
9 C Open Brush 35,103 0.81 2790 8% 2.42 77 0.78 1.52 12.14 1028.9 1019.71 269.3 0.034 Section A 6.68 0.67 9.18
10 C Open Brush 51,925 1.19 296 1% 2.41 77 0.77 2.21 13.66 1019.71 1018.77 29.4 0.032 Section B 6.35 0.08 9.25
11 C Open Brush 22,071 0.51 1650 7% 2.34 77 0.77 0.91 15.87 1018.77 1011.46 165.1 0.044 Section C 6.04 0.46 9.71
12 C Open Brush 174,103 4.00 697 0.4% 2.32 77 0.76 7.04 16.79 1011.46 1009.52 61.2 0.032 Section D 4.74 0.22 9.92
13 C Open Brush 13,881 0.32 968 7% 2.29 77 0.77 0.56 23.82 1009.52 1005.66 101.9 0.038 Section E 6.66 0.25 10.18
14 C Open Brush 25,400 0.58 422 2% 2.27 77 0.76 1.01 24.38 1005.66 1002.81 45.5 0.063 Section F 9.13 0.08 10.26
15 C Open Brush 42,807 0.98 499 1% 2.26 77 0.76 1.69 25.39 1002.81 1000.58 51.8 0.043 Section G 6.71 0.13 10.39
16 C Open Brush 13,739 0.32 710 5% 2.24 77 0.76 0.54 27.08 1000.58 997.9 73.1 0.037 Section H 6.77 0.18 10.57
17 C Open Brush 35,101 0.81 599 2% 2.22 77 0.75 1.34 27.62 997.9 996.31 58.8 0.027 Section I 5.82 0.17 10.74
18 C Open Brush 21,589 0.50 1555 7% 2.19 77 0.76 0.83 28.96 996.31 990.97 101.6 0.053 Section J 7.58 0.22 10.96
19 C Open Brush 2,242 0.05 1027 46% 2.18 77 0.82 0.09 29.79 990.97 988.21 77.9 0.035 Section K 8.59 0.15 11.11
20 C Open Brush 2,422 0.06 940 39% 2.16 77 0.81 0.10 29.88 988.21 982.77 88.6 0.061 Section L 9.51 0.16 11.27
21 C Open Brush 5,908 0.14 1390 24% 2.13 77 0.79 0.23 29.97 982.77 978.01 143.9 0.033 Section M 7.87 0.30 11.57
22 C Open Brush 10,934 0.25 1337 12% 2.10 77 0.76 0.40 30.20 978.01 973.3 131.7 0.036 Section N 6.57 0.33 11.91
23 C Open Brush 9,304 0.21 1101 12% 2.07 77 0.76 0.34 30.60 973.3 969.27 108.8 0.037 Section O 6.72 0.27 12.18
24 C Open Brush 9,954 0.23 1025 10% 2.05 77 0.76 0.36 30.94 969.27 964.66 103.7 0.044 Section P 7.25 0.24 12.42
25 C Open Brush 15,074 0.35 1308 9% 2.03 77 0.76 0.53 31.30 964.66 958.54 130.4 0.047 Section Q 8.97 0.24 12.66
26 C Open Brush 18,339 0.42 1587 9% 2.00 77 0.76 0.64 31.83 958.54 951.76 158.7 0.043 Section R 8.08 0.33 12.99
27 C Open Brush 13,271 0.30 699 5% 1.99 77 0.75 0.46 32.47 951.76 948.17 61.7 0.058 Section S 8.87 0.12 13.10
28 C Open Brush 39,251 0.90 1468 4% 1.97 77 0.75 1.33 32.93 948.17 943.01 144.1 0.036 Section T 7.12 0.34 13.44
29 C Open Brush 92,345 2.12 7839 8% 1.94 77 0.76 3.12 34.25 943.01 934.18 195.0 0.045 Section U 8.77 0.37 13.81
30 C Open Brush 37,227 0.85 4245 11% 1.88 77 0.75 1.20 37.37 934.18 918.16 376.5 0.043 Section V 7.87 0.80 14.61
31 C Open Brush 49,407 1.13 3608 7% 1.84 77 0.74 1.55 38.58 918.16 906.38 309.3 0.038 Section W 9.45 0.55 15.15
32 C Open Brush 36,940 0.85 1686 5% 1.82 77 0.74 1.14 40.12 906.38 903.17 156.9 0.020 Section X 7.83 0.33 15.49
33 C Open Brush 22,114 0.51 1681 8% 1.79 77 0.74 0.67 41.26 903.17 899.91 152.6 0.021 Section Y 5.67 0.45 15.93
34 C Open Brush 54,361 1.25 6014 11% 1.71 77 0.74 1.58 41.94 899.91 896.14 406.9 0.009 Section Z 4.71 1.44 17.37
Total 1,106,379 25.40 52,757 5% 43.5
Notes:1. Riverside County Flood Control and Water Conservation District Hydrology Manual, April 19782. Plate C-1.15, RCFC&WCD 19783. Plate C-2, RCFC&WCD 19784. Plate D-4.3, 4.4, 4.5, 4.6, 4.7, and regression line equations, RCFC&WCD 19785. Plate D-5.5, RCFC&WCD 19786. Plate D-5.7 (10 of 12) - Since table exists for even numbered values, use value of 76, RCFC&WCD 19787. Plate D-6.3 for Natural Mountain Channel, Use Bentley FlowMaster Software for Street Sections, RCFC&WCD 19788. Plate D-3 for Initial Sub-Area, RCFC&WCD 19789. Assume flowrate, Q = 1 cfs, the minimum value on Plate D-6.3.
P:\164470\Docs\Hydrology and Drainage Study\Draft Report\Tables\Tables 1-7_RubidouxHydrology AMEC
DRAFT
Sub-Area
Soil
Group2 Cover Type3 Area (feet2)Area
(acres)
Impervious
Area (ft2)Percent
ImperviousRainfall Intensity4
(in/hour)
Runoff
Index5
Runoff
Coefficient6 Flow
Rate (cfs) Flow
Rate (cfs)Upper
Elevation (ft)Lower
Elevation (ft)Length of Sub-
Area (feet)Slope (ft/ft) Section
Velocity7
(ft/s) Time of Concentration8
(minutes) Time of
Concentration (minutes)
1 C Open Brush 16,291 0.37 0 0% 3.48 77 0.80 1.04 1270 1152 255 5.75 5.75
2 C Open Brush 19,943 0.46 828 4% 3.22 77 0.80 1.18 1.04 1152 1048.62 207.0 0.499 Nat. Mtn. Chan. 3.9 0.88 6.63
3 C Open Brush 26,746 0.61 836 3% 3.12 77 0.80 1.53 2.22 1048.62 1045.29 94.4 0.035 Section A 3.92 0.40 7.04
4 C Open Brush 31,324 0.72 1061 3% 3.01 77 0.79 1.71 3.75 1045.29 1040.99 121.8 0.035 Section A 4.37 0.46 7.50
5 C Open Brush 34,909 0.80 425 1% 2.98 77 0.79 1.89 5.46 1040.99 1039.39 45.4 0.035 Section A 4.95 0.15 7.65
6 C Open Brush 62,952 1.45 346 1% 2.95 77 0.79 3.37 7.34 1039.39 1038.02 39.0 0.035 Section A 5.55 0.12 7.77
7 C Open Brush 39,611 0.91 1831 5% 2.84 77 0.79 2.04 10.72 1038.02 1030.12 223.9 0.035 Section A 6.43 0.58 8.35
TABLE 6STORM RUNOFF PEAK FLOW RATES FOR 50-YEAR STORM
RATIONAL METHOD CALCULATIONS1
Hydrology and Drainage Study - Mount Rubidoux ParkRiverside, California
P:\164470\Docs\Hydrology and Drainage Study\Draft Report\Tables\Tables 1-7_RubidouxHydrology AMEC
p , 1038.02 1030.12 223.9 8.35
8 C Open Brush 19,794 0.45 289 1% 2.82 77 0.78 1.00 12.76 1030.12 1028.9 34.4 0.035 Section A 6.87 0.08 8.43
9 C Open Brush 35,103 0.81 2790 8% 2.71 77 0.79 1.73 13.76 1028.9 1019.71 269.3 0.034 Section A 7.01 0.64 9.07
10 C Open Brush 51,925 1.19 296 1% 2.70 77 0.78 2.51 15.49 1019.71 1018.77 29.4 0.032 Section B 6.63 0.07 9.15
11 C Open Brush 22,071 0.51 1650 7% 2.64 77 0.78 1.04 18.00 1018.77 1011.46 165.1 0.044 Section C 6.34 0.43 9.58
12 C Open Brush 174,103 4.00 697 0.4% 2.61 77 0.77 8.02 19.04 1011.46 1009.52 61.2 0.032 Section D 4.94 0.21 9.79
13 C Open Brush 13,881 0.32 968 7% 2.57 77 0.78 0.64 27.06 1009.52 1005.66 101.9 0.038 Section E 7 0.24 10.03
14 C Open Brush 25,400 0.58 422 2% 2.56 77 0.77 1.15 27.70 1005.66 1002.81 45.5 0.063 Section F 9.6 0.08 10.11
15 C Open Brush 42,807 0.98 499 1% 2.54 77 0.77 1.92 28.85 1002.81 1000.58 51.8 0.043 Section G 7.05 0.12 10.23
16 C Open Brush 13,739 0.32 710 5% 2.52 77 0.78 0.62 30.77 1000.58 997.9 73.1 0.037 Section H 7.07 0.17 10.41
17 C Open Brush 35,101 0.81 599 2% 2.50 77 0.77 1.55 31.39 997.9 996.31 58.8 0.027 Section I 6.09 0.16 10.57
18 C Open Brush 21,589 0.50 1555 7% 2.47 77 0.78 0.96 32.95 996.31 990.97 101.6 0.053 Section J 7.97 0.21 10.78
19 C Open Brush 2,242 0.05 1027 46% 2.46 77 0.83 0.10 33.90 990.97 988.21 77.9 0.035 Section K 8.89 0.15 10.92
20 C Open Brush 2,422 0.06 940 39% 2.44 77 0.82 0.11 34.01 988.21 982.77 88.6 0.061 Section L 9.94 0.15 11.07
21 C Open Brush 5,908 0.14 1390 24% 2.40 77 0.80 0.26 34.12 982.77 978.01 143.9 0.033 Section M 8.28 0.29 11.36
22 C Open Brush 10,934 0.25 1337 12% 2.37 77 0.78 0.46 34.38 978.01 973.3 131.7 0.036 Section N 6.91 0.32 11.68
23 C Open Brush 9,304 0.21 1101 12% 2.34 77 0.77 0.38 34.84 973.3 969.27 108.8 0.037 Section O 7 0.26 11.94
24 C Open Brush 9,954 0.23 1025 10% 2.32 77 0.77 0.41 35.23 969.27 964.66 103.7 0.044 Section P 7.56 0.23 12.17
25 C Open Brush 15,074 0.35 1308 9% 2.29 77 0.77 0.61 35.63 964.66 958.54 130.4 0.047 Section Q 9.39 0.23 12.40
26 C Open Brush 18,339 0.42 1587 9% 2.26 77 0.77 0.73 36.25 958.54 951.76 158.7 0.043 Section R 8.49 0.31 12.71
27 C Open Brush 13,271 0.30 699 5% 2.25 77 0.77 0.53 36.98 951.76 948.17 61.7 0.058 Section S 9.32 0.11 12.82
28 C Open Brush 39,251 0.90 1468 4% 2.22 77 0.76 1.52 37.51 948.17 943.01 144.1 0.036 Section T 7.48 0.32 13.14
29 C Open Brush 92,345 2.12 7839 8% 2.19 77 0.77 3.57 39.03 943.01 934.18 195.0 0.045 Section U 9.21 0.35 13.50
30 C Open Brush 37,227 0.85 4245 11% 2.13 77 0.77 1.40 42.60 934.18 918.16 376.5 0.043 Section V 8.2 0.77 14.26
31 C Open Brush 49,407 1.13 3608 7% 2.08 77 0.76 1.80 44.00 918.16 906.38 309.3 0.038 Section W 9.91 0.52 14.78
32 C Open Brush 36,940 0.85 1686 5% 2.06 77 0.75 1.31 45.80 906.38 903.17 156.9 0.020 Section X 8.2 0.32 15.10
33 C Open Brush 22,114 0.51 1681 8% 2.03 77 0.76 0.78 47.11 903.17 899.91 152.6 0.021 Section Y 5.95 0.43 15.53
34 C Open Brush 54,361 1.25 6014 11% 1.94 77 0.76 1.84 47.89 899.91 896.14 406.9 0.009 Section Z 4.94 1.37 16.90
Total 1,106,379 25.40 52,757 5% 49.7
Notes:1. Riverside County Flood Control and Water Conservation District Hydrology Manual, April 19782. Plate C-1.15, RCFC&WCD 19783. Plate C-2, RCFC&WCD 19784. Plate D-4.3, 4.4, 4.5, 4.6, 4.7, and regression line equations, RCFC&WCD 19785. Plate D-5.5, RCFC&WCD 19786. Plate D-5.7 (10 of 12) - Since table exists for even numbered values, use value of 76, RCFC&WCD 19787. Plate D-6.3 for Natural Mountain Channel, Use Bentley FlowMaster Software for Street Sections, RCFC&WCD 19788. Plate D-3 for Initial Sub-Area, RCFC&WCD 19789. Assume flowrate, Q = 1 cfs, the minimum value on Plate D-6.3.
P:\164470\Docs\Hydrology and Drainage Study\Draft Report\Tables\Tables 1-7_RubidouxHydrology AMEC
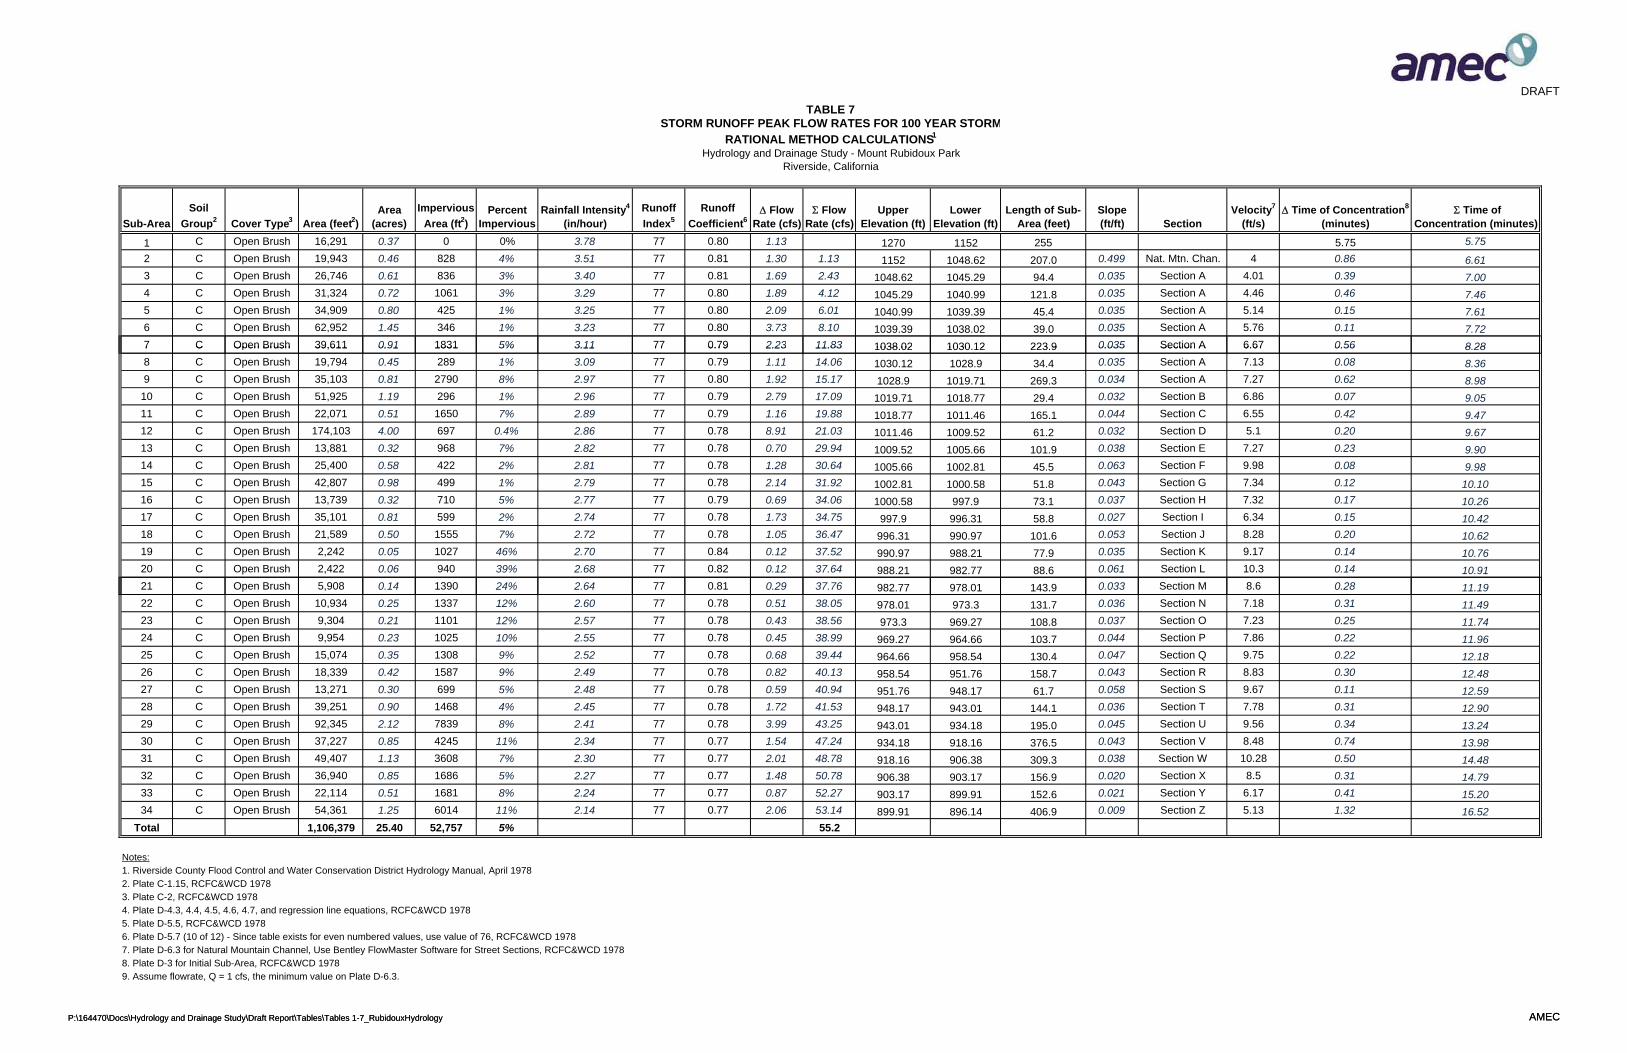
DRAFT
Sub-Area
Soil
Group2 Cover Type3 Area (feet2)Area
(acres)
Impervious
Area (ft2)Percent
ImperviousRainfall Intensity4
(in/hour)
Runoff
Index5
Runoff
Coefficient6 Flow
Rate (cfs) Flow
Rate (cfs)Upper
Elevation (ft)Lower
Elevation (ft)Length of Sub-
Area (feet)Slope (ft/ft) Section
Velocity7
(ft/s) Time of Concentration8
(minutes) Time of
Concentration (minutes)
1 C Open Brush 16,291 0.37 0 0% 3.78 77 0.80 1.13 1270 1152 255 5.75 5.75
2 C Open Brush 19,943 0.46 828 4% 3.51 77 0.81 1.30 1.13 1152 1048.62 207.0 0.499 Nat. Mtn. Chan. 4 0.86 6.61
3 C Open Brush 26,746 0.61 836 3% 3.40 77 0.81 1.69 2.43 1048.62 1045.29 94.4 0.035 Section A 4.01 0.39 7.00
4 C Open Brush 31,324 0.72 1061 3% 3.29 77 0.80 1.89 4.12 1045.29 1040.99 121.8 0.035 Section A 4.46 0.46 7.46
5 C Open Brush 34,909 0.80 425 1% 3.25 77 0.80 2.09 6.01 1040.99 1039.39 45.4 0.035 Section A 5.14 0.15 7.61
6 C Open Brush 62,952 1.45 346 1% 3.23 77 0.80 3.73 8.10 1039.39 1038.02 39.0 0.035 Section A 5.76 0.11 7.72
7 C Open Brush 39,611 0.91 1831 5% 3.11 77 0.79 2.23 11.83 1038 02 1030 12 223 9 0.035 Section A 6.67 0.56 8 28
TABLE 7STORM RUNOFF PEAK FLOW RATES FOR 100 YEAR STORM
RATIONAL METHOD CALCULATIONS1
Hydrology and Drainage Study - Mount Rubidoux ParkRiverside, California
P:\164470\Docs\Hydrology and Drainage Study\Draft Report\Tables\Tables 1-7_RubidouxHydrology AMEC
7 C Open Brush 39,611 0.91 1831 5% 3.11 77 0.79 2.23 11.83 1038.02 1030.12 223.9 0.035 Section A 6.67 0.56 8.28
8 C Open Brush 19,794 0.45 289 1% 3.09 77 0.79 1.11 14.06 1030.12 1028.9 34.4 0.035 Section A 7.13 0.08 8.36
9 C Open Brush 35,103 0.81 2790 8% 2.97 77 0.80 1.92 15.17 1028.9 1019.71 269.3 0.034 Section A 7.27 0.62 8.98
10 C Open Brush 51,925 1.19 296 1% 2.96 77 0.79 2.79 17.09 1019.71 1018.77 29.4 0.032 Section B 6.86 0.07 9.05
11 C Open Brush 22,071 0.51 1650 7% 2.89 77 0.79 1.16 19.88 1018.77 1011.46 165.1 0.044 Section C 6.55 0.42 9.47
12 C Open Brush 174,103 4.00 697 0.4% 2.86 77 0.78 8.91 21.03 1011.46 1009.52 61.2 0.032 Section D 5.1 0.20 9.67
13 C Open Brush 13,881 0.32 968 7% 2.82 77 0.78 0.70 29.94 1009.52 1005.66 101.9 0.038 Section E 7.27 0.23 9.90
14 C Open Brush 25,400 0.58 422 2% 2.81 77 0.78 1.28 30.64 1005.66 1002.81 45.5 0.063 Section F 9.98 0.08 9.98
15 C Open Brush 42,807 0.98 499 1% 2.79 77 0.78 2.14 31.92 1002.81 1000.58 51.8 0.043 Section G 7.34 0.12 10.10
16 C Open Brush 13,739 0.32 710 5% 2.77 77 0.79 0.69 34.06 1000.58 997.9 73.1 0.037 Section H 7.32 0.17 10.26
17 C Open Brush 35,101 0.81 599 2% 2.74 77 0.78 1.73 34.75 997.9 996.31 58.8 0.027 Section I 6.34 0.15 10.42
18 C Open Brush 21,589 0.50 1555 7% 2.72 77 0.78 1.05 36.47 996.31 990.97 101.6 0.053 Section J 8.28 0.20 10.62
19 C Open Brush 2,242 0.05 1027 46% 2.70 77 0.84 0.12 37.52 990.97 988.21 77.9 0.035 Section K 9.17 0.14 10.76
20 C Open Brush 2,422 0.06 940 39% 2.68 77 0.82 0.12 37.64 988.21 982.77 88.6 0.061 Section L 10.3 0.14 10.91
21 C Open Brush 5,908 0.14 1390 24% 2.64 77 0.81 0.29 37.76 982.77 978.01 143.9 0.033 Section M 8.6 0.28 11.19
22 C Open Brush 10,934 0.25 1337 12% 2.60 77 0.78 0.51 38.05 978.01 973.3 131.7 0.036 Section N 7.18 0.31 11.49
23 C Open Brush 9,304 0.21 1101 12% 2.57 77 0.78 0.43 38.56 973.3 969.27 108.8 0.037 Section O 7.23 0.25 11.74
24 C Open Brush 9,954 0.23 1025 10% 2.55 77 0.78 0.45 38.99 969.27 964.66 103.7 0.044 Section P 7.86 0.22 11.96
25 C Open Brush 15,074 0.35 1308 9% 2.52 77 0.78 0.68 39.44 964.66 958.54 130.4 0.047 Section Q 9.75 0.22 12.18
26 C Open Brush 18,339 0.42 1587 9% 2.49 77 0.78 0.82 40.13 958.54 951.76 158.7 0.043 Section R 8.83 0.30 12.48
27 C Open Brush 13,271 0.30 699 5% 2.48 77 0.78 0.59 40.94 951.76 948.17 61.7 0.058 Section S 9.67 0.11 12.59
28 C Open Brush 39,251 0.90 1468 4% 2.45 77 0.78 1.72 41.53 948.17 943.01 144.1 0.036 Section T 7.78 0.31 12.90
29 C Open Brush 92,345 2.12 7839 8% 2.41 77 0.78 3.99 43.25 943.01 934.18 195.0 0.045 Section U 9.56 0.34 13.24
30 C Open Brush 37,227 0.85 4245 11% 2.34 77 0.77 1.54 47.24 934.18 918.16 376.5 0.043 Section V 8.48 0.74 13.98
31 C Open Brush 49,407 1.13 3608 7% 2.30 77 0.77 2.01 48.78 918.16 906.38 309.3 0.038 Section W 10.28 0.50 14.48
32 C Open Brush 36,940 0.85 1686 5% 2.27 77 0.77 1.48 50.78 906.38 903.17 156.9 0.020 Section X 8.5 0.31 14.79
33 C Open Brush 22,114 0.51 1681 8% 2.24 77 0.77 0.87 52.27 903.17 899.91 152.6 0.021 Section Y 6.17 0.41 15.20
34 C Open Brush 54,361 1.25 6014 11% 2.14 77 0.77 2.06 53.14 899.91 896.14 406.9 0.009 Section Z 5.13 1.32 16.52
Total 1,106,379 25.40 52,757 5% 55.2
Notes:1. Riverside County Flood Control and Water Conservation District Hydrology Manual, April 19782. Plate C-1.15, RCFC&WCD 19783. Plate C-2, RCFC&WCD 19784. Plate D-4.3, 4.4, 4.5, 4.6, 4.7, and regression line equations, RCFC&WCD 19785. Plate D-5.5, RCFC&WCD 19786. Plate D-5.7 (10 of 12) - Since table exists for even numbered values, use value of 76, RCFC&WCD 19787. Plate D-6.3 for Natural Mountain Channel, Use Bentley FlowMaster Software for Street Sections, RCFC&WCD 19788. Plate D-3 for Initial Sub-Area, RCFC&WCD 19789. Assume flowrate, Q = 1 cfs, the minimum value on Plate D-6.3.
P:\164470\Docs\Hydrology and Drainage Study\Draft Report\Tables\Tables 1-7_RubidouxHydrology AMEC
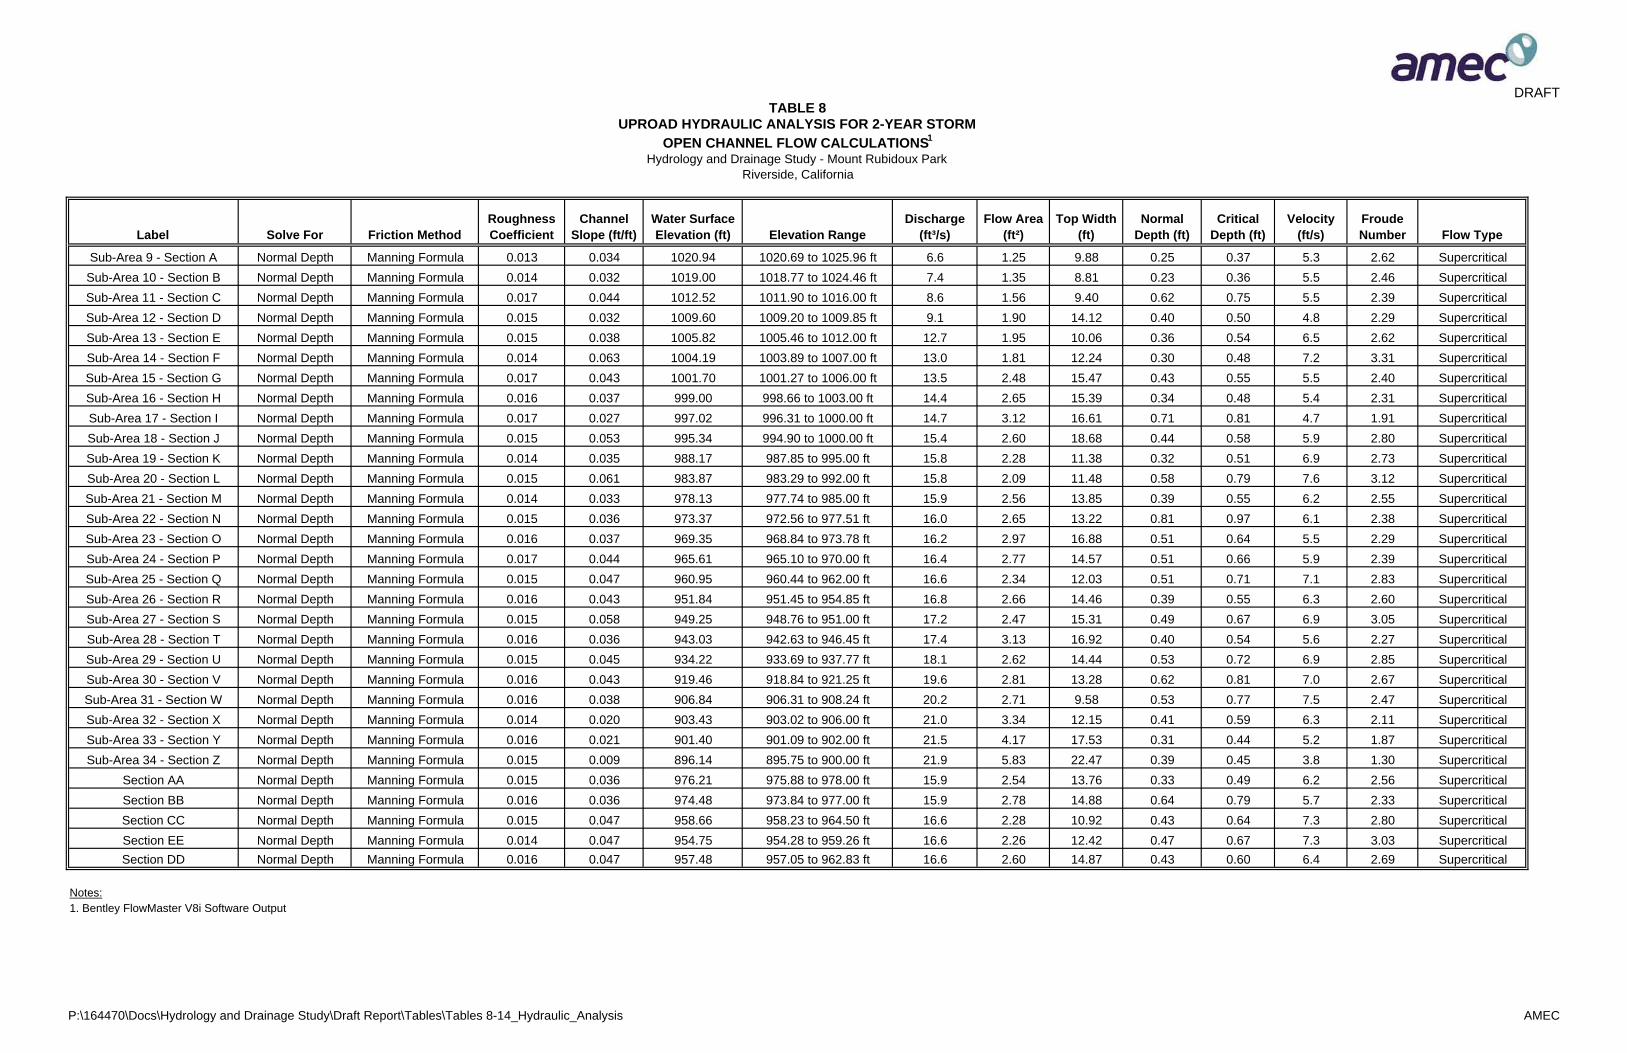
DRAFT
Label Solve For Friction MethodRoughness Coefficient
Channel Slope (ft/ft)
Water Surface Elevation (ft) Elevation Range
Discharge (ft³/s)
Flow Area (ft²)
Top Width (ft)
Normal Depth (ft)
Critical Depth (ft)
Velocity (ft/s)
Froude Number Flow Type
Sub-Area 9 - Section A Normal Depth Manning Formula 0.013 0.034 1020.94 1020.69 to 1025.96 ft 6.6 1.25 9.88 0.25 0.37 5.3 2.62 Supercritical
Sub-Area 10 - Section B Normal Depth Manning Formula 0.014 0.032 1019.00 1018.77 to 1024.46 ft 7.4 1.35 8.81 0.23 0.36 5.5 2.46 Supercritical
Sub-Area 11 - Section C Normal Depth Manning Formula 0.017 0.044 1012.52 1011.90 to 1016.00 ft 8.6 1.56 9.40 0.62 0.75 5.5 2.39 Supercritical
Sub-Area 12 - Section D Normal Depth Manning Formula 0.015 0.032 1009.60 1009.20 to 1009.85 ft 9.1 1.90 14.12 0.40 0.50 4.8 2.29 Supercritical
Sub-Area 13 - Section E Normal Depth Manning Formula 0.015 0.038 1005.82 1005.46 to 1012.00 ft 12.7 1.95 10.06 0.36 0.54 6.5 2.62 Supercritical
Sub-Area 14 - Section F Normal Depth Manning Formula 0.014 0.063 1004.19 1003.89 to 1007.00 ft 13.0 1.81 12.24 0.30 0.48 7.2 3.31 Supercritical
Sub-Area 15 - Section G Normal Depth Manning Formula 0.017 0.043 1001.70 1001.27 to 1006.00 ft 13.5 2.48 15.47 0.43 0.55 5.5 2.40 Supercritical
Sub-Area 16 - Section H Normal Depth Manning Formula 0.016 0.037 999.00 998.66 to 1003.00 ft 14.4 2.65 15.39 0.34 0.48 5.4 2.31 Supercritical
Sub-Area 17 - Section I Normal Depth Manning Formula 0.017 0.027 997.02 996.31 to 1000.00 ft 14.7 3.12 16.61 0.71 0.81 4.7 1.91 Supercritical
Sub-Area 18 - Section J Normal Depth Manning Formula 0.015 0.053 995.34 994.90 to 1000.00 ft 15.4 2.60 18.68 0.44 0.58 5.9 2.80 Supercritical
Sub-Area 19 - Section K Normal Depth Manning Formula 0.014 0.035 988.17 987.85 to 995.00 ft 15.8 2.28 11.38 0.32 0.51 6.9 2.73 Supercritical
Sub-Area 20 - Section L Normal Depth Manning Formula 0.015 0.061 983.87 983.29 to 992.00 ft 15.8 2.09 11.48 0.58 0.79 7.6 3.12 Supercritical
Sub-Area 21 - Section M Normal Depth Manning Formula 0.014 0.033 978.13 977.74 to 985.00 ft 15.9 2.56 13.85 0.39 0.55 6.2 2.55 Supercritical
Sub-Area 22 - Section N Normal Depth Manning Formula 0.015 0.036 973.37 972.56 to 977.51 ft 16.0 2.65 13.22 0.81 0.97 6.1 2.38 Supercritical
Sub-Area 23 - Section O Normal Depth Manning Formula 0.016 0.037 969.35 968.84 to 973.78 ft 16.2 2.97 16.88 0.51 0.64 5.5 2.29 Supercritical
Sub-Area 24 - Section P Normal Depth Manning Formula 0.017 0.044 965.61 965.10 to 970.00 ft 16.4 2.77 14.57 0.51 0.66 5.9 2.39 Supercritical
Sub-Area 25 - Section Q Normal Depth Manning Formula 0.015 0.047 960.95 960.44 to 962.00 ft 16.6 2.34 12.03 0.51 0.71 7.1 2.83 Supercritical
Sub-Area 26 - Section R Normal Depth Manning Formula 0.016 0.043 951.84 951.45 to 954.85 ft 16.8 2.66 14.46 0.39 0.55 6.3 2.60 Supercritical
Sub-Area 27 - Section S Normal Depth Manning Formula 0.015 0.058 949.25 948.76 to 951.00 ft 17.2 2.47 15.31 0.49 0.67 6.9 3.05 Supercritical
Sub-Area 28 - Section T Normal Depth Manning Formula 0.016 0.036 943.03 942.63 to 946.45 ft 17.4 3.13 16.92 0.40 0.54 5.6 2.27 Supercritical
Sub-Area 29 - Section U Normal Depth Manning Formula 0.015 0.045 934.22 933.69 to 937.77 ft 18.1 2.62 14.44 0.53 0.72 6.9 2.85 Supercritical
Sub-Area 30 - Section V Normal Depth Manning Formula 0.016 0.043 919.46 918.84 to 921.25 ft 19.6 2.81 13.28 0.62 0.81 7.0 2.67 Supercritical
Sub-Area 31 - Section W Normal Depth Manning Formula 0.016 0.038 906.84 906.31 to 908.24 ft 20.2 2.71 9.58 0.53 0.77 7.5 2.47 Supercritical
Sub-Area 32 - Section X Normal Depth Manning Formula 0.014 0.020 903.43 903.02 to 906.00 ft 21.0 3.34 12.15 0.41 0.59 6.3 2.11 Supercritical
Sub-Area 33 - Section Y Normal Depth Manning Formula 0.016 0.021 901.40 901.09 to 902.00 ft 21.5 4.17 17.53 0.31 0.44 5.2 1.87 Supercritical
Sub-Area 34 - Section Z Normal Depth Manning Formula 0.015 0.009 896.14 895.75 to 900.00 ft 21.9 5.83 22.47 0.39 0.45 3.8 1.30 Supercritical
Section AA Normal Depth Manning Formula 0.015 0.036 976.21 975.88 to 978.00 ft 15.9 2.54 13.76 0.33 0.49 6.2 2.56 Supercritical
Section BB Normal Depth Manning Formula 0.016 0.036 974.48 973.84 to 977.00 ft 15.9 2.78 14.88 0.64 0.79 5.7 2.33 Supercritical
Section CC Normal Depth Manning Formula 0.015 0.047 958.66 958.23 to 964.50 ft 16.6 2.28 10.92 0.43 0.64 7.3 2.80 Supercritical
Section EE Normal Depth Manning Formula 0.014 0.047 954.75 954.28 to 959.26 ft 16.6 2.26 12.42 0.47 0.67 7.3 3.03 Supercritical
Section DD Normal Depth Manning Formula 0.016 0.047 957.48 957.05 to 962.83 ft 16.6 2.60 14.87 0.43 0.60 6.4 2.69 Supercritical
Notes:1. Bentley FlowMaster V8i Software Output
TABLE 8UPROAD HYDRAULIC ANALYSIS FOR 2-YEAR STORM
OPEN CHANNEL FLOW CALCULATIONS1
Hydrology and Drainage Study - Mount Rubidoux Park Riverside, California
P:\164470\Docs\Hydrology and Drainage Study\Draft Report\Tables\Tables 8-14_Hydraulic_Analysis AMEC

DRAFT
Label Solve For Friction MethodRoughness Coefficient
Channel Slope (ft/ft)
Water Surface Elevation (ft) Elevation Range
Discharge (ft³/s)
Flow Area (ft²)
Top Width (ft)
Normal Depth (ft)
Critical Depth (ft)
Velocity (ft/s)
Froude Number Flow Type
Sub-Area 9 - Section A Normal Depth Manning Formula 0.013 0.034 1020.97 1020.69 to 1025.96 ft 8.9 1.50 9.95 0.28 0.42 5.9 2.69 Supercritical
Sub-Area 10 - Section B Normal Depth Manning Formula 0.014 0.032 1019.04 1018.77 to 1024.46 ft 10.0 1.70 9.88 0.27 0.42 5.9 2.49 Supercritical
Sub-Area 11 - Section C Normal Depth Manning Formula 0.016 0.044 1012.57 1011.90 to 1016.00 ft 11.6 2.10 13.72 0.67 0.79 5.5 2.48 Supercritical
Sub-Area 12 - Section D Normal Depth Manning Formula 0.015 0.032 1009.63 1009.20 to 1009.85 ft 12.2 2.35 14.96 0.43 0.55 5.2 2.31 Supercritical
Sub-Area 13 - Section E Normal Depth Manning Formula 0.015 0.038 1005.87 1005.46 to 1012.00 ft 17.3 2.40 10.86 0.41 0.61 7.2 2.69 Supercritical
Sub-Area 14 - Section F Normal Depth Manning Formula 0.014 0.063 1004.22 1003.89 to 1007.00 ft 17.7 2.19 12.56 0.33 0.55 8.1 3.40 Supercritical
Sub-Area 15 - Section G Normal Depth Manning Formula 0.016 0.043 1001.74 1001.27 to 1006.00 ft 18.4 3.08 16.96 0.47 0.62 6.0 2.47 Supercritical
Sub-Area 16 - Section H Normal Depth Manning Formula 0.016 0.037 999.04 998.66 to 1003.00 ft 19.6 3.24 15.79 0.38 0.54 6.1 2.36 Supercritical
Sub-Area 17 - Section I Normal Depth Manning Formula 0.017 0.027 997.06 996.31 to 1000.00 ft 20.0 3.88 18.39 0.75 0.87 5.2 1.98 Supercritical
Sub-Area 18 - Section J Normal Depth Manning Formula 0.015 0.053 995.37 994.90 to 1000.00 ft 20.9 3.13 18.73 0.47 0.64 6.7 2.88 Supercritical
Sub-Area 19 - Section K Normal Depth Manning Formula 0.014 0.035 988.21 987.85 to 995.00 ft 21.5 2.77 11.55 0.36 0.60 7.8 2.80 Supercritical
Sub-Area 20 - Section L Normal Depth Manning Formula 0.015 0.061 983.91 983.29 to 992.00 ft 21.6 2.55 11.72 0.62 0.87 8.5 3.20 Supercritical
Sub-Area 21 - Section M Normal Depth Manning Formula 0.014 0.033 978.17 977.74 to 985.00 ft 21.7 3.12 14.22 0.43 0.63 6.9 2.61 Supercritical
Sub-Area 22 - Section N Normal Depth Manning Formula 0.015 0.036 973.41 972.56 to 977.51 ft 21.8 3.20 13.26 0.85 1.05 6.8 2.44 Supercritical
Sub-Area 23 - Section O Normal Depth Manning Formula 0.016 0.037 969.39 968.84 to 973.78 ft 22.1 3.66 17.53 0.55 0.70 6.1 2.33 Supercritical
Sub-Area 24 - Section P Normal Depth Manning Formula 0.017 0.044 965.65 965.10 to 970.00 ft 22.3 3.42 15.70 0.55 0.73 6.5 2.47 Supercritical
Sub-Area 25 - Section Q Normal Depth Manning Formula 0.015 0.047 960.99 960.44 to 962.00 ft 22.6 2.84 12.17 0.55 0.80 8.0 2.90 Supercritical
Sub-Area 26 - Section R Normal Depth Manning Formula 0.016 0.043 951.88 951.45 to 954.85 ft 23.0 3.22 14.51 0.43 0.63 7.1 2.67 Supercritical
Sub-Area 27 - Section S Normal Depth Manning Formula 0.015 0.058 949.28 948.76 to 951.00 ft 23.4 2.99 15.41 0.52 0.74 7.8 3.13 Supercritical
Sub-Area 28 - Section T Normal Depth Manning Formula 0.016 0.036 943.07 942.63 to 946.45 ft 23.8 3.79 16.95 0.44 0.61 6.3 2.34 Supercritical
Sub-Area 29 - Section U Normal Depth Manning Formula 0.015 0.045 934.26 933.69 to 937.77 ft 24.7 3.18 14.59 0.57 0.80 7.8 2.93 Supercritical
Sub-Area 30 - Section V Normal Depth Manning Formula 0.015 0.043 919.53 918.84 to 921.25 ft 26.9 3.79 17.87 0.69 0.89 7.1 2.72 Supercritical
Sub-Area 31 - Section W Normal Depth Manning Formula 0.016 0.038 906.90 906.31 to 908.24 ft 27.7 3.31 9.70 0.59 0.89 8.4 2.53 Supercritical
Sub-Area 32 - Section X Normal Depth Manning Formula 0.014 0.020 903.49 903.02 to 906.00 ft 28.8 4.12 12.46 0.47 0.69 7.0 2.14 Supercritical
Sub-Area 33 - Section Y Normal Depth Manning Formula 0.016 0.021 901.46 901.09 to 902.00 ft 29.6 5.08 17.80 0.37 0.53 5.8 1.92 Supercritical
Sub-Area 34 - Section Z Normal Depth Manning Formula 0.015 0.009 896.20 895.75 to 900.00 ft 30.1 7.21 23.26 0.45 0.52 4.2 1.32 Supercritical
Section AA Normal Depth Manning Formula 0.015 0.036 976.25 975.88 to 978.00 ft 21.7 3.09 13.98 0.37 0.57 7.0 2.62 Supercritical
Section BB Normal Depth Manning Formula 0.016 0.036 974.53 973.84 to 977.00 ft 21.7 3.43 15.57 0.69 0.86 6.3 2.37 Supercritical
Section CC Normal Depth Manning Formula 0.015 0.047 958.70 958.23 to 964.50 ft 22.6 2.76 10.98 0.47 0.73 8.2 2.88 Supercritical
Section DD Normal Depth Manning Formula 0.016 0.047 957.52 957.05 to 962.83 ft 22.6 3.15 15.01 0.47 0.68 7.2 2.76 Supercritical
Section EE Normal Depth Manning Formula 0.014 0.047 954.79 954.28 to 959.26 ft 22.6 2.75 12.59 0.51 0.76 8.2 3.11 Supercritical
Notes:1. Bentley FlowMaster V8i Software Output
TABLE 9UPROAD HYDRAULIC ANALYSIS FOR 5-YEAR STORM
OPEN CHANNEL FLOW CALCULATIONS1
Hydrology and Drainage Study - Mount Rubidoux Park Riverside, California
P:\164470\Docs\Hydrology and Drainage Study\Draft Report\Tables\Tables 8-14_Hydraulic_Analysis AMEC
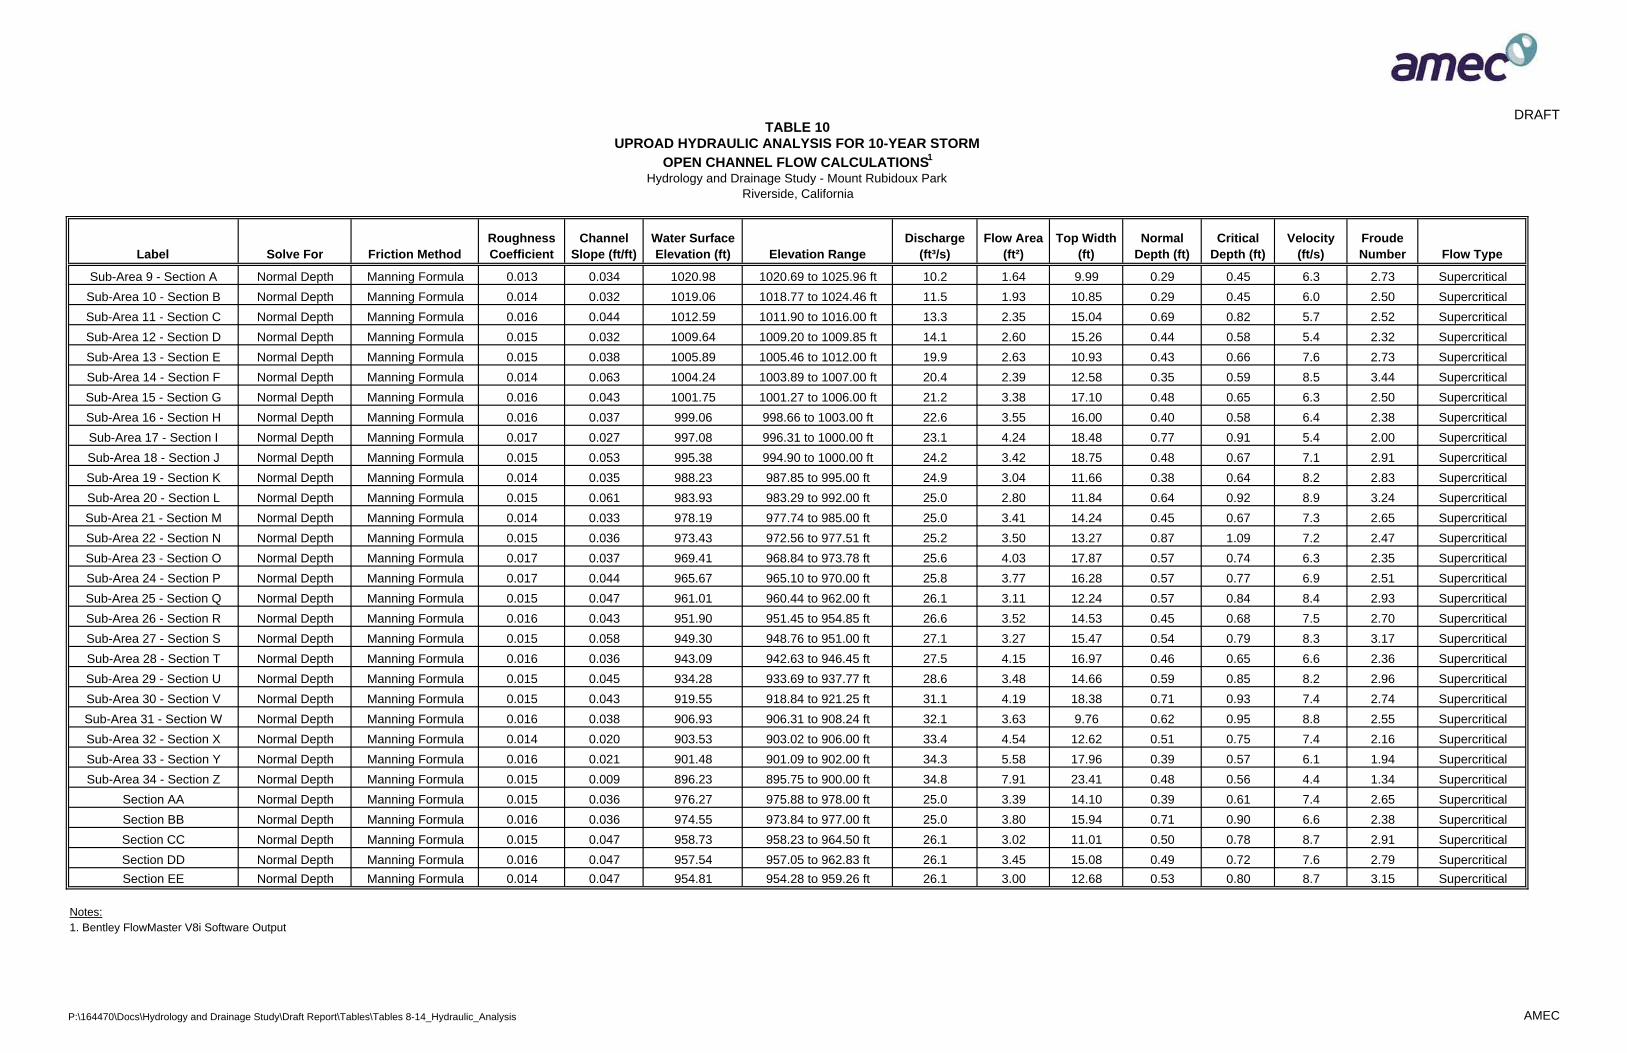
DRAFT
Label Solve For Friction MethodRoughness Coefficient
Channel Slope (ft/ft)
Water Surface Elevation (ft) Elevation Range
Discharge (ft³/s)
Flow Area (ft²)
Top Width (ft)
Normal Depth (ft)
Critical Depth (ft)
Velocity (ft/s)
Froude Number Flow Type
Sub-Area 9 - Section A Normal Depth Manning Formula 0.013 0.034 1020.98 1020.69 to 1025.96 ft 10.2 1.64 9.99 0.29 0.45 6.3 2.73 Supercritical
Sub-Area 10 - Section B Normal Depth Manning Formula 0.014 0.032 1019.06 1018.77 to 1024.46 ft 11.5 1.93 10.85 0.29 0.45 6.0 2.50 Supercritical
Sub-Area 11 - Section C Normal Depth Manning Formula 0.016 0.044 1012.59 1011.90 to 1016.00 ft 13.3 2.35 15.04 0.69 0.82 5.7 2.52 Supercritical
Sub-Area 12 - Section D Normal Depth Manning Formula 0.015 0.032 1009.64 1009.20 to 1009.85 ft 14.1 2.60 15.26 0.44 0.58 5.4 2.32 Supercritical
Sub-Area 13 - Section E Normal Depth Manning Formula 0.015 0.038 1005.89 1005.46 to 1012.00 ft 19.9 2.63 10.93 0.43 0.66 7.6 2.73 Supercritical
Sub-Area 14 - Section F Normal Depth Manning Formula 0.014 0.063 1004.24 1003.89 to 1007.00 ft 20.4 2.39 12.58 0.35 0.59 8.5 3.44 Supercritical
Sub-Area 15 - Section G Normal Depth Manning Formula 0.016 0.043 1001.75 1001.27 to 1006.00 ft 21.2 3.38 17.10 0.48 0.65 6.3 2.50 Supercritical
Sub-Area 16 - Section H Normal Depth Manning Formula 0.016 0.037 999.06 998.66 to 1003.00 ft 22.6 3.55 16.00 0.40 0.58 6.4 2.38 Supercritical
Sub-Area 17 - Section I Normal Depth Manning Formula 0.017 0.027 997.08 996.31 to 1000.00 ft 23.1 4.24 18.48 0.77 0.91 5.4 2.00 Supercritical
Sub-Area 18 - Section J Normal Depth Manning Formula 0.015 0.053 995.38 994.90 to 1000.00 ft 24.2 3.42 18.75 0.48 0.67 7.1 2.91 Supercritical
Sub-Area 19 - Section K Normal Depth Manning Formula 0.014 0.035 988.23 987.85 to 995.00 ft 24.9 3.04 11.66 0.38 0.64 8.2 2.83 Supercritical
Sub-Area 20 - Section L Normal Depth Manning Formula 0.015 0.061 983.93 983.29 to 992.00 ft 25.0 2.80 11.84 0.64 0.92 8.9 3.24 Supercritical
Sub-Area 21 - Section M Normal Depth Manning Formula 0.014 0.033 978.19 977.74 to 985.00 ft 25.0 3.41 14.24 0.45 0.67 7.3 2.65 Supercritical
Sub-Area 22 - Section N Normal Depth Manning Formula 0.015 0.036 973.43 972.56 to 977.51 ft 25.2 3.50 13.27 0.87 1.09 7.2 2.47 Supercritical
Sub-Area 23 - Section O Normal Depth Manning Formula 0.017 0.037 969.41 968.84 to 973.78 ft 25.6 4.03 17.87 0.57 0.74 6.3 2.35 Supercritical
Sub-Area 24 - Section P Normal Depth Manning Formula 0.017 0.044 965.67 965.10 to 970.00 ft 25.8 3.77 16.28 0.57 0.77 6.9 2.51 Supercritical
Sub-Area 25 - Section Q Normal Depth Manning Formula 0.015 0.047 961.01 960.44 to 962.00 ft 26.1 3.11 12.24 0.57 0.84 8.4 2.93 Supercritical
Sub-Area 26 - Section R Normal Depth Manning Formula 0.016 0.043 951.90 951.45 to 954.85 ft 26.6 3.52 14.53 0.45 0.68 7.5 2.70 Supercritical
Sub-Area 27 - Section S Normal Depth Manning Formula 0.015 0.058 949.30 948.76 to 951.00 ft 27.1 3.27 15.47 0.54 0.79 8.3 3.17 Supercritical
Sub-Area 28 - Section T Normal Depth Manning Formula 0.016 0.036 943.09 942.63 to 946.45 ft 27.5 4.15 16.97 0.46 0.65 6.6 2.36 Supercritical
Sub-Area 29 - Section U Normal Depth Manning Formula 0.015 0.045 934.28 933.69 to 937.77 ft 28.6 3.48 14.66 0.59 0.85 8.2 2.96 Supercritical
Sub-Area 30 - Section V Normal Depth Manning Formula 0.015 0.043 919.55 918.84 to 921.25 ft 31.1 4.19 18.38 0.71 0.93 7.4 2.74 Supercritical
Sub-Area 31 - Section W Normal Depth Manning Formula 0.016 0.038 906.93 906.31 to 908.24 ft 32.1 3.63 9.76 0.62 0.95 8.8 2.55 Supercritical
Sub-Area 32 - Section X Normal Depth Manning Formula 0.014 0.020 903.53 903.02 to 906.00 ft 33.4 4.54 12.62 0.51 0.75 7.4 2.16 Supercritical
Sub-Area 33 - Section Y Normal Depth Manning Formula 0.016 0.021 901.48 901.09 to 902.00 ft 34.3 5.58 17.96 0.39 0.57 6.1 1.94 Supercritical
Sub-Area 34 - Section Z Normal Depth Manning Formula 0.015 0.009 896.23 895.75 to 900.00 ft 34.8 7.91 23.41 0.48 0.56 4.4 1.34 Supercritical
Section AA Normal Depth Manning Formula 0.015 0.036 976.27 975.88 to 978.00 ft 25.0 3.39 14.10 0.39 0.61 7.4 2.65 Supercritical
Section BB Normal Depth Manning Formula 0.016 0.036 974.55 973.84 to 977.00 ft 25.0 3.80 15.94 0.71 0.90 6.6 2.38 Supercritical
Section CC Normal Depth Manning Formula 0.015 0.047 958.73 958.23 to 964.50 ft 26.1 3.02 11.01 0.50 0.78 8.7 2.91 Supercritical
Section DD Normal Depth Manning Formula 0.016 0.047 957.54 957.05 to 962.83 ft 26.1 3.45 15.08 0.49 0.72 7.6 2.79 Supercritical
Section EE Normal Depth Manning Formula 0.014 0.047 954.81 954.28 to 959.26 ft 26.1 3.00 12.68 0.53 0.80 8.7 3.15 Supercritical
Notes:1. Bentley FlowMaster V8i Software Output
TABLE 10UPROAD HYDRAULIC ANALYSIS FOR 10-YEAR STORM
OPEN CHANNEL FLOW CALCULATIONS1
Hydrology and Drainage Study - Mount Rubidoux Park Riverside, California
P:\164470\Docs\Hydrology and Drainage Study\Draft Report\Tables\Tables 8-14_Hydraulic_Analysis AMEC

DRAFT
Label Solve For Friction MethodRoughness Coefficient
Channel Slope (ft/ft)
Water Surface Elevation (ft) Elevation Range
Discharge (ft³/s)
Flow Area (ft²)
Top Width (ft)
Normal Depth (ft)
Critical Depth (ft)
Velocity (ft/s)
Froude Number Flow Type
Sub-Area 9 - Section A Normal Depth Manning Formula 0.013 0.034 1021.00 1020.69 to 1025.96 ft 12.1 1.82 10.04 0.31 0.49 6.7 2.77 Supercritical
Sub-Area 10 - Section B Normal Depth Manning Formula 0.014 0.032 1019.08 1018.77 to 1024.46 ft 13.7 2.15 10.97 0.31 0.48 6.4 2.53 Supercritical
Sub-Area 11 - Section C Normal Depth Manning Formula 0.016 0.044 1012.60 1011.90 to 1016.00 ft 15.9 2.63 15.19 0.70 0.86 6.0 2.56 Supercritical
Sub-Area 12 - Section D Normal Depth Manning Formula 0.015 0.032 1009.67 1009.20 to 1009.85 ft 16.8 2.94 15.67 0.47 0.61 5.7 2.33 Supercritical
Sub-Area 13 - Section E Normal Depth Manning Formula 0.015 0.038 1005.92 1005.46 to 1012.00 ft 23.8 2.94 11.02 0.46 0.72 8.1 2.77 Supercritical
Sub-Area 14 - Section F Normal Depth Manning Formula 0.014 0.063 1004.26 1003.89 to 1007.00 ft 24.4 2.67 12.60 0.37 0.65 9.1 3.50 Supercritical
Sub-Area 15 - Section G Normal Depth Manning Formula 0.017 0.043 1001.78 1001.27 to 1006.00 ft 25.4 3.78 17.30 0.51 0.69 6.7 2.53 Supercritical
Sub-Area 16 - Section H Normal Depth Manning Formula 0.016 0.037 999.09 998.66 to 1003.00 ft 27.1 4.00 16.30 0.43 0.63 6.8 2.41 Supercritical
Sub-Area 17 - Section I Normal Depth Manning Formula 0.017 0.027 997.11 996.31 to 1000.00 ft 27.6 4.75 18.60 0.80 0.96 5.8 2.03 Supercritical
Sub-Area 18 - Section J Normal Depth Manning Formula 0.015 0.053 995.40 994.90 to 1000.00 ft 29.0 3.82 18.78 0.50 0.72 7.6 2.96 Supercritical
Sub-Area 19 - Section K Normal Depth Manning Formula 0.014 0.035 988.27 987.85 to 995.00 ft 29.8 3.47 12.05 0.42 0.71 8.6 2.83 Supercritical
Sub-Area 20 - Section L Normal Depth Manning Formula 0.016 0.061 983.96 983.29 to 992.00 ft 29.9 3.14 12.02 0.67 0.98 9.5 3.28 Supercritical
Sub-Area 21 - Section M Normal Depth Manning Formula 0.014 0.033 978.22 977.74 to 985.00 ft 30.0 3.81 14.26 0.48 0.73 7.9 2.69 Supercritical
Sub-Area 22 - Section N Normal Depth Manning Formula 0.015 0.036 973.46 972.56 to 977.51 ft 30.2 3.91 13.30 0.90 1.15 7.7 2.51 Supercritical
Sub-Area 23 - Section O Normal Depth Manning Formula 0.017 0.037 969.44 968.84 to 973.78 ft 30.6 4.55 18.34 0.60 0.79 6.7 2.38 Supercritical
Sub-Area 24 - Section P Normal Depth Manning Formula 0.017 0.044 965.70 965.10 to 970.00 ft 30.9 4.27 17.07 0.60 0.82 7.3 2.55 Supercritical
Sub-Area 25 - Section Q Normal Depth Manning Formula 0.015 0.047 961.05 960.44 to 962.00 ft 31.3 3.49 12.35 0.61 0.91 9.0 2.97 Supercritical
Sub-Area 26 - Section R Normal Depth Manning Formula 0.016 0.043 951.93 951.45 to 954.85 ft 31.8 3.94 14.57 0.48 0.74 8.1 2.74 Supercritical
Sub-Area 27 - Section S Normal Depth Manning Formula 0.015 0.058 949.33 948.76 to 951.00 ft 32.5 3.66 15.55 0.57 0.84 8.9 3.22 Supercritical
Sub-Area 28 - Section T Normal Depth Manning Formula 0.016 0.036 943.12 942.63 to 946.45 ft 32.9 4.63 16.99 0.49 0.71 7.1 2.40 Supercritical
Sub-Area 29 - Section U Normal Depth Manning Formula 0.015 0.045 934.31 933.69 to 937.77 ft 34.3 3.90 14.77 0.62 0.91 8.8 3.01 Supercritical
Sub-Area 30 - Section V Normal Depth Manning Formula 0.016 0.043 919.58 918.84 to 921.25 ft 37.4 4.75 18.80 0.74 0.98 7.9 2.76 Supercritical
Sub-Area 31 - Section W Normal Depth Manning Formula 0.017 0.038 906.98 906.31 to 908.24 ft 38.6 4.08 9.85 0.67 1.04 9.5 2.59 Supercritical
Sub-Area 32 - Section X Normal Depth Manning Formula 0.014 0.020 903.57 903.02 to 906.00 ft 40.1 5.13 12.80 0.55 0.83 7.8 2.18 Supercritical
Sub-Area 33 - Section Y Normal Depth Manning Formula 0.016 0.021 901.52 901.09 to 902.00 ft 41.3 6.28 18.18 0.43 0.63 6.6 1.97 Supercritical
Sub-Area 34 - Section Z Normal Depth Manning Formula 0.016 0.009 896.28 895.75 to 900.00 ft 41.9 8.91 23.64 0.53 0.61 4.7 1.35 Supercritical
Section AA Normal Depth Manning Formula 0.015 0.036 976.30 975.88 to 978.00 ft 30.0 3.81 14.26 0.42 0.67 7.9 2.69 Supercritical
Section BB Normal Depth Manning Formula 0.016 0.036 974.58 973.84 to 977.00 ft 30.0 4.31 16.45 0.74 0.95 7.0 2.40 Supercritical
Section CC Normal Depth Manning Formula 0.015 0.047 958.76 958.23 to 964.50 ft 31.3 3.38 11.06 0.53 0.86 9.3 2.95 Supercritical
Section DD Normal Depth Manning Formula 0.016 0.047 957.57 957.05 to 962.83 ft 31.3 3.87 15.19 0.52 0.78 8.1 2.83 Supercritical
Section EE Normal Depth Manning Formula 0.016 0.047 957.57 957.05 to 962.83 ft 31.3 3.87 15.19 0.52 0.78 8.1 2.83 Supercritical
Notes:1. Bentley FlowMaster V8i Software Output
TABLE 11UPROAD HYDRAULIC ANALYSIS FOR 25-YEAR STORM
OPEN CHANNEL FLOW CALCULATIONS1
Hydrology and Drainage Study - Mount Rubidoux Park Riverside, California
P:\164470\Docs\Hydrology and Drainage Study\Draft Report\Tables\Tables 8-14_Hydraulic_Analysis AMEC

DRAFT
Label Solve For Friction MethodRoughness Coefficient
Channel Slope (ft/ft)
Water Surface Elevation (ft) Elevation Range
Discharge (ft³/s)
Flow Area (ft²)
Top Width (ft)
Normal Depth (ft)
Critical Depth (ft)
Velocity (ft/s)
Froude Number Flow Type
Sub-Area 9 - Section A Normal Depth Manning Formula 0.013 0.034 1021.01 1020.69 to 1025.96 ft 13.8 1.96 10.09 0.32 0.52 7.0 2.80 Supercritical
Sub-Area 10 - Section B Normal Depth Manning Formula 0.014 0.032 1019.10 1018.77 to 1024.46 ft 15.5 2.34 11.07 0.33 0.52 6.6 2.55 Supercritical
Sub-Area 11 - Section C Normal Depth Manning Formula 0.016 0.044 1012.62 1011.90 to 1016.00 ft 18.0 2.85 15.30 0.72 0.89 6.3 2.58 Supercritical
Sub-Area 12 - Section D Normal Depth Manning Formula 0.015 0.032 1009.68 1009.20 to 1009.85 ft 19.0 3.21 15.99 0.48 0.64 5.9 2.34 Supercritical
Sub-Area 13 - Section E Normal Depth Manning Formula 0.015 0.038 1005.94 1005.46 to 1012.00 ft 27.1 3.18 11.08 0.48 0.76 8.5 2.80 Supercritical
Sub-Area 14 - Section F Normal Depth Manning Formula 0.014 0.063 1004.28 1003.89 to 1007.00 ft 27.7 2.88 12.62 0.39 0.69 9.6 3.54 Supercritical
Sub-Area 15 - Section G Normal Depth Manning Formula 0.017 0.043 1001.79 1001.27 to 1006.00 ft 28.9 4.09 17.34 0.52 0.73 7.1 2.56 Supercritical
Sub-Area 16 - Section H Normal Depth Manning Formula 0.016 0.037 999.11 998.66 to 1003.00 ft 30.8 4.35 16.53 0.45 0.67 7.1 2.43 Supercritical
Sub-Area 17 - Section I Normal Depth Manning Formula 0.017 0.027 997.13 996.31 to 1000.00 ft 31.3 5.13 18.69 0.82 0.99 6.1 2.05 Supercritical
Sub-Area 18 - Section J Normal Depth Manning Formula 0.015 0.053 995.42 994.90 to 1000.00 ft 33.0 4.13 18.80 0.52 0.76 8.0 3.00 Supercritical
Sub-Area 19 - Section K Normal Depth Manning Formula 0.014 0.035 988.30 987.85 to 995.00 ft 33.9 3.81 12.36 0.45 0.76 8.9 2.82 Supercritical
Sub-Area 20 - Section L Normal Depth Manning Formula 0.016 0.061 983.98 983.29 to 992.00 ft 34.0 3.42 12.16 0.69 1.03 9.9 3.30 Supercritical
Sub-Area 21 - Section M Normal Depth Manning Formula 0.014 0.033 978.24 977.74 to 985.00 ft 34.1 4.12 14.28 0.50 0.77 8.3 2.71 Supercritical
Sub-Area 22 - Section N Normal Depth Manning Formula 0.015 0.036 973.49 972.56 to 977.51 ft 34.4 4.23 13.32 0.93 1.20 8.1 2.54 Supercritical
Sub-Area 23 - Section O Normal Depth Manning Formula 0.017 0.037 969.46 968.84 to 973.78 ft 34.8 4.98 18.71 0.62 0.83 7.0 2.39 Supercritical
Sub-Area 24 - Section P Normal Depth Manning Formula 0.017 0.044 965.72 965.10 to 970.00 ft 35.2 4.66 17.57 0.62 0.86 7.6 2.59 Supercritical
Sub-Area 25 - Section Q Normal Depth Manning Formula 0.015 0.047 961.07 960.44 to 962.00 ft 35.6 3.79 12.43 0.63 0.96 9.4 3.00 Supercritical
Sub-Area 26 - Section R Normal Depth Manning Formula 0.016 0.043 951.95 951.45 to 954.85 ft 36.3 4.27 14.60 0.50 0.79 8.5 2.77 Supercritical
Sub-Area 27 - Section S Normal Depth Manning Formula 0.015 0.058 949.35 948.76 to 951.00 ft 37.0 3.97 15.61 0.59 0.89 9.3 3.26 Supercritical
Sub-Area 28 - Section T Normal Depth Manning Formula 0.016 0.036 943.15 942.63 to 946.45 ft 37.5 5.01 17.01 0.52 0.75 7.5 2.43 Supercritical
Sub-Area 29 - Section U Normal Depth Manning Formula 0.015 0.045 934.33 933.69 to 937.77 ft 39.0 4.24 14.85 0.64 0.96 9.2 3.04 Supercritical
Sub-Area 30 - Section V Normal Depth Manning Formula 0.016 0.043 919.60 918.84 to 921.25 ft 42.6 5.19 19.13 0.76 1.03 8.2 2.78 Supercritical
Sub-Area 31 - Section W Normal Depth Manning Formula 0.017 0.038 907.02 906.31 to 908.24 ft 44.0 4.44 9.92 0.71 1.11 9.9 2.61 Supercritical
Sub-Area 32 - Section X Normal Depth Manning Formula 0.014 0.020 903.61 903.02 to 906.00 ft 45.8 5.58 12.90 0.59 0.89 8.2 2.20 Supercritical
Sub-Area 33 - Section Y Normal Depth Manning Formula 0.016 0.021 901.55 901.09 to 902.00 ft 47.1 6.84 18.36 0.46 0.68 6.9 1.99 Supercritical
Sub-Area 34 - Section Z Normal Depth Manning Formula 0.016 0.009 896.31 895.75 to 900.00 ft 47.9 9.69 23.81 0.56 0.66 4.9 1.36 Supercritical
Section AA Normal Depth Manning Formula 0.015 0.036 976.32 975.88 to 978.00 ft 34.1 4.14 14.38 0.44 0.72 8.2 2.71 Supercritical
Section BB Normal Depth Manning Formula 0.016 0.036 974.61 973.84 to 977.00 ft 34.1 4.72 16.84 0.77 0.99 7.2 2.41 Supercritical
Section CC Normal Depth Manning Formula 0.015 0.047 958.79 958.23 to 964.50 ft 35.6 3.67 11.10 0.56 0.91 9.7 2.97 Supercritical
Section DD Normal Depth Manning Formula 0.016 0.047 957.59 957.05 to 962.83 ft 35.6 4.20 15.27 0.54 0.82 8.5 2.85 Supercritical
Section EE Normal Depth Manning Formula 0.014 0.047 954.86 954.28 to 959.26 ft 35.6 3.66 12.89 0.58 0.92 9.8 3.23 Supercritical
Notes:1. Bentley FlowMaster V8i Software Output
TABLE 12UPROAD HYDRAULIC ANALYSIS FOR 50-YEAR STORM
OPEN CHANNEL FLOW CALCULATIONS1
Hydrology and Drainage Study - Mount Rubidoux Park Riverside, California
P:\164470\Docs\Hydrology and Drainage Study\Draft Report\Tables\Tables 8-14_Hydraulic_Analysis AMEC

DRAFT
Label Solve For Friction MethodRoughness Coefficient
Channel Slope (ft/ft)
Water Surface Elevation (ft) Elevation Range
Discharge (ft³/s)
Flow Area (ft²)
Top Width (ft)
Normal Depth (ft)
Critical Depth (ft)
Velocity (ft/s)
Froude Number Flow Type
Sub-Area 9 - Section A Normal Depth Manning Formula 0.013 0.034 1021.02 1020.69 to 1025.96 ft 15.2 2.09 10.12 0.33 0.54 7.3 2.82 Supercritical
Sub-Area 10 - Section B Normal Depth Manning Formula 0.014 0.032 1019.11 1018.77 to 1024.46 ft 17.1 2.49 11.15 0.34 0.54 6.9 2.56 Supercritical
Sub-Area 11 - Section C Normal Depth Manning Formula 0.016 0.044 1012.63 1011.90 to 1016.00 ft 19.9 3.04 15.40 0.73 0.91 6.6 2.60 Supercritical
Sub-Area 12 - Section D Normal Depth Manning Formula 0.015 0.032 1009.70 1009.20 to 1009.85 ft 21.0 3.44 16.26 0.50 0.66 6.1 2.34 Supercritical
Sub-Area 13 - Section E Normal Depth Manning Formula 0.015 0.038 1005.96 1005.46 to 1012.00 ft 29.9 3.39 11.09 0.50 0.80 8.8 2.82 Supercritical
Sub-Area 14 - Section F Normal Depth Manning Formula 0.014 0.063 1004.29 1003.89 to 1007.00 ft 30.6 3.07 12.63 0.40 0.73 10.0 3.57 Supercritical
Sub-Area 15 - Section G Normal Depth Manning Formula 0.017 0.043 1001.81 1001.27 to 1006.00 ft 31.9 4.35 17.35 0.54 0.76 7.3 2.58 Supercritical
Sub-Area 16 - Section H Normal Depth Manning Formula 0.016 0.037 999.13 998.66 to 1003.00 ft 34.1 4.65 16.72 0.47 0.70 7.3 2.45 Supercritical
Sub-Area 17 - Section I Normal Depth Manning Formula 0.017 0.027 997.15 996.31 to 1000.00 ft 34.8 5.49 18.77 0.84 1.02 6.3 2.07 Supercritical
Sub-Area 18 - Section J Normal Depth Manning Formula 0.015 0.053 995.44 994.90 to 1000.00 ft 36.5 4.41 18.82 0.54 0.79 8.3 3.02 Supercritical
Sub-Area 19 - Section K Normal Depth Manning Formula 0.014 0.035 988.32 987.85 to 995.00 ft 37.5 4.09 12.51 0.47 0.80 9.2 2.83 Supercritical
Sub-Area 20 - Section L Normal Depth Manning Formula 0.016 0.061 984.00 983.29 to 992.00 ft 37.6 3.65 12.27 0.71 1.07 10.3 3.33 Supercritical
Sub-Area 21 - Section M Normal Depth Manning Formula 0.014 0.033 978.26 977.74 to 985.00 ft 37.8 4.39 14.29 0.52 0.81 8.6 2.73 Supercritical
Sub-Area 22 - Section N Normal Depth Manning Formula 0.015 0.036 973.51 972.56 to 977.51 ft 38.1 4.51 13.33 0.95 1.24 8.4 2.56 Supercritical
Sub-Area 23 - Section O Normal Depth Manning Formula 0.017 0.037 969.48 968.84 to 973.78 ft 38.6 5.33 19.02 0.64 0.86 7.2 2.41 Supercritical
Sub-Area 24 - Section P Normal Depth Manning Formula 0.017 0.044 965.74 965.10 to 970.00 ft 39.0 4.96 17.64 0.64 0.90 7.9 2.61 Supercritical
Sub-Area 25 - Section Q Normal Depth Manning Formula 0.015 0.047 961.09 960.44 to 962.00 ft 39.4 4.04 12.49 0.65 1.01 9.8 3.02 Supercritical
Sub-Area 26 - Section R Normal Depth Manning Formula 0.016 0.043 951.97 951.45 to 954.85 ft 40.1 4.55 14.62 0.52 0.83 8.8 2.79 Supercritical
Sub-Area 27 - Section S Normal Depth Manning Formula 0.015 0.058 949.36 948.76 to 951.00 ft 40.9 4.23 15.66 0.60 0.93 9.7 3.28 Supercritical
Sub-Area 28 - Section T Normal Depth Manning Formula 0.016 0.036 943.16 942.63 to 946.45 ft 41.5 5.34 17.02 0.53 0.79 7.8 2.45 Supercritical
Sub-Area 29 - Section U Normal Depth Manning Formula 0.015 0.045 934.35 933.69 to 937.77 ft 43.3 4.52 14.92 0.66 1.00 9.6 3.06 Supercritical
Sub-Area 30 - Section V Normal Depth Manning Formula 0.016 0.043 919.62 918.84 to 921.25 ft 47.2 5.57 19.40 0.78 1.07 8.5 2.79 Supercritical
Sub-Area 31 - Section W Normal Depth Manning Formula 0.017 0.038 907.05 906.31 to 908.24 ft 48.8 4.74 9.98 0.74 1.17 10.3 2.63 Supercritical
Sub-Area 32 - Section X Normal Depth Manning Formula 0.014 0.020 903.64 903.02 to 906.00 ft 50.8 5.97 12.99 0.62 0.94 8.5 2.21 Supercritical
Sub-Area 33 - Section Y Normal Depth Manning Formula 0.016 0.021 901.58 901.09 to 902.00 ft 52.3 7.31 18.50 0.49 0.73 7.2 2.01 Supercritical
Sub-Area 34 - Section Z Normal Depth Manning Formula 0.016 0.009 896.34 895.75 to 900.00 ft 53.1 10.36 23.96 0.59 0.69 5.1 1.38 Supercritical
Section AA Normal Depth Manning Formula 0.015 0.036 976.34 975.88 to 978.00 ft 37.8 4.42 14.49 0.46 0.76 8.5 2.73 Supercritical
Section BB Normal Depth Manning Formula 0.016 0.036 974.63 973.84 to 977.00 ft 37.8 5.07 17.17 0.79 1.02 7.5 2.42 Supercritical
Section CC Normal Depth Manning Formula 0.015 0.047 958.81 958.23 to 964.50 ft 39.4 3.92 11.13 0.58 0.96 10.1 2.99 Supercritical
Section DD Normal Depth Manning Formula 0.016 0.047 957.61 957.05 to 962.83 ft 39.4 4.48 15.33 0.56 0.86 8.8 2.87 Supercritical
Section EE Normal Depth Manning Formula 0.014 0.047 954.88 954.28 to 959.26 ft 39.4 3.89 12.91 0.60 0.96 10.1 3.25 Supercritical
Notes:1. Bentley FlowMaster V8i Software Output
TABLE 13UPROAD HYDRAULIC ANALYSIS FOR 100-YEAR STORM
OPEN CHANNEL FLOW CALCULATIONS1
Hydrology and Drainage Study - Mount Rubidoux Park Riverside, California
P:\164470\Docs\Hydrology and Drainage Study\Draft Report\Tables\Tables 8-14_Hydraulic_Analysis AMEC
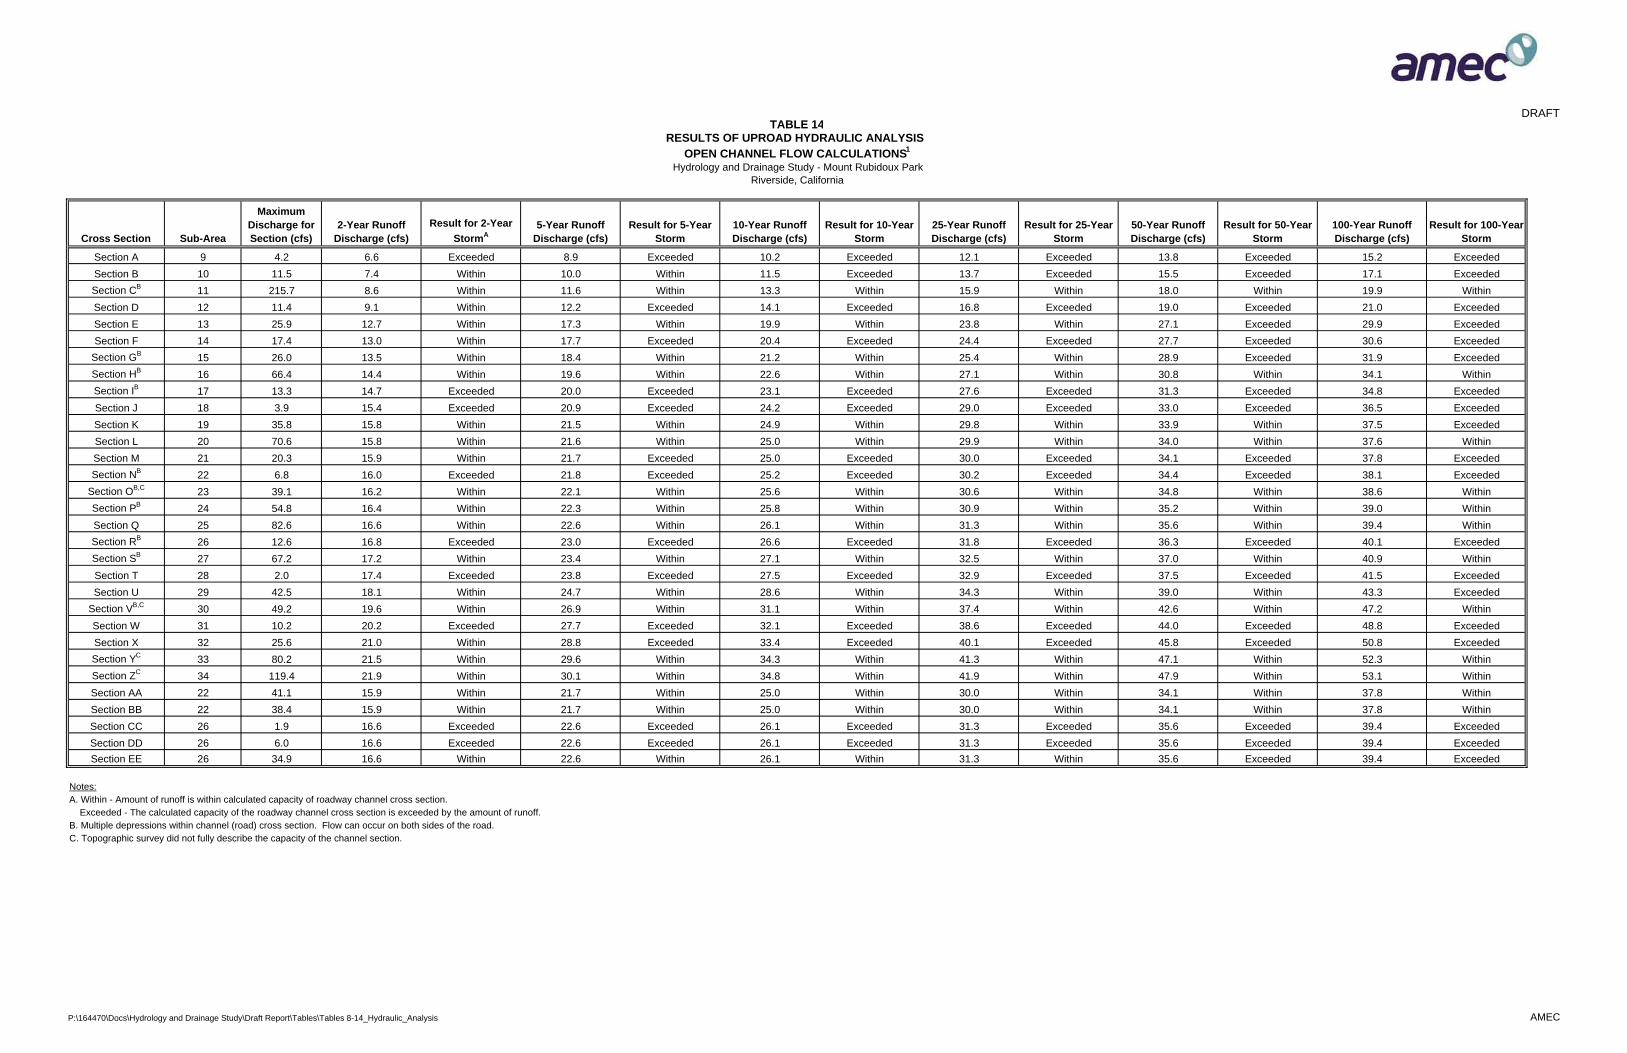
DRAFT
Cross Section Sub-Area
Maximum Discharge for Section (cfs)
2-Year Runoff Discharge (cfs)
Result for 2-Year
StormA5-Year Runoff
Discharge (cfs)Result for 5-Year
Storm10-Year Runoff Discharge (cfs)
Result for 10-Year Storm
25-Year Runoff Discharge (cfs)
Result for 25-Year Storm
50-Year Runoff Discharge (cfs)
Result for 50-Year Storm
100-Year Runoff Discharge (cfs)
Result for 100-Year Storm
Section A 9 4.2 6.6 Exceeded 8.9 Exceeded 10.2 Exceeded 12.1 Exceeded 13.8 Exceeded 15.2 Exceeded
Section B 10 11.5 7.4 Within 10.0 Within 11.5 Exceeded 13.7 Exceeded 15.5 Exceeded 17.1 Exceeded
Section CB 11 215.7 8.6 Within 11.6 Within 13.3 Within 15.9 Within 18.0 Within 19.9 Within
Section D 12 11.4 9.1 Within 12.2 Exceeded 14.1 Exceeded 16.8 Exceeded 19.0 Exceeded 21.0 Exceeded
Section E 13 25.9 12.7 Within 17.3 Within 19.9 Within 23.8 Within 27.1 Exceeded 29.9 Exceeded
Section F 14 17.4 13.0 Within 17.7 Exceeded 20.4 Exceeded 24.4 Exceeded 27.7 Exceeded 30.6 Exceeded
Section GB 15 26.0 13.5 Within 18.4 Within 21.2 Within 25.4 Within 28.9 Exceeded 31.9 Exceeded
Section HB 16 66.4 14.4 Within 19.6 Within 22.6 Within 27.1 Within 30.8 Within 34.1 Within
Section IB 17 13.3 14.7 Exceeded 20.0 Exceeded 23.1 Exceeded 27.6 Exceeded 31.3 Exceeded 34.8 Exceeded
Section J 18 3.9 15.4 Exceeded 20.9 Exceeded 24.2 Exceeded 29.0 Exceeded 33.0 Exceeded 36.5 Exceeded
Section K 19 35.8 15.8 Within 21.5 Within 24.9 Within 29.8 Within 33.9 Within 37.5 Exceeded
Section L 20 70.6 15.8 Within 21.6 Within 25.0 Within 29.9 Within 34.0 Within 37.6 Within
Section M 21 20.3 15.9 Within 21.7 Exceeded 25.0 Exceeded 30.0 Exceeded 34.1 Exceeded 37.8 Exceeded
Section NB 22 6.8 16.0 Exceeded 21.8 Exceeded 25.2 Exceeded 30.2 Exceeded 34.4 Exceeded 38.1 Exceeded
Section OB,C 23 39.1 16.2 Within 22.1 Within 25.6 Within 30.6 Within 34.8 Within 38.6 Within
Section PB 24 54.8 16.4 Within 22.3 Within 25.8 Within 30.9 Within 35.2 Within 39.0 Within
Section Q 25 82.6 16.6 Within 22.6 Within 26.1 Within 31.3 Within 35.6 Within 39.4 Within
Section RB 26 12.6 16.8 Exceeded 23.0 Exceeded 26.6 Exceeded 31.8 Exceeded 36.3 Exceeded 40.1 Exceeded
Section SB 27 67.2 17.2 Within 23.4 Within 27.1 Within 32.5 Within 37.0 Within 40.9 Within
Section T 28 2.0 17.4 Exceeded 23.8 Exceeded 27.5 Exceeded 32.9 Exceeded 37.5 Exceeded 41.5 Exceeded
Section U 29 42.5 18.1 Within 24.7 Within 28.6 Within 34.3 Within 39.0 Within 43.3 Exceeded
Section VB,C 30 49.2 19.6 Within 26.9 Within 31.1 Within 37.4 Within 42.6 Within 47.2 Within
Section W 31 10.2 20.2 Exceeded 27.7 Exceeded 32.1 Exceeded 38.6 Exceeded 44.0 Exceeded 48.8 Exceeded
Section X 32 25.6 21.0 Within 28.8 Exceeded 33.4 Exceeded 40.1 Exceeded 45.8 Exceeded 50.8 Exceeded
Section YC 33 80.2 21.5 Within 29.6 Within 34.3 Within 41.3 Within 47.1 Within 52.3 Within
Section ZC 34 119.4 21.9 Within 30.1 Within 34.8 Within 41.9 Within 47.9 Within 53.1 Within
Section AA 22 41.1 15.9 Within 21.7 Within 25.0 Within 30.0 Within 34.1 Within 37.8 Within
Section BB 22 38.4 15.9 Within 21.7 Within 25.0 Within 30.0 Within 34.1 Within 37.8 Within
Section CC 26 1.9 16.6 Exceeded 22.6 Exceeded 26.1 Exceeded 31.3 Exceeded 35.6 Exceeded 39.4 Exceeded
Section DD 26 6.0 16.6 Exceeded 22.6 Exceeded 26.1 Exceeded 31.3 Exceeded 35.6 Exceeded 39.4 Exceeded
Section EE 26 34.9 16.6 Within 22.6 Within 26.1 Within 31.3 Within 35.6 Exceeded 39.4 Exceeded
Notes:A. Within - Amount of runoff is within calculated capacity of roadway channel cross section. Exceeded - The calculated capacity of the roadway channel cross section is exceeded by the amount of runoff.B. Multiple depressions within channel (road) cross section. Flow can occur on both sides of the road.C. Topographic survey did not fully describe the capacity of the channel section.
TABLE 14RESULTS OF UPROAD HYDRAULIC ANALYSIS
OPEN CHANNEL FLOW CALCULATIONS1
Hydrology and Drainage Study - Mount Rubidoux ParkRiverside, California
P:\164470\Docs\Hydrology and Drainage Study\Draft Report\Tables\Tables 8-14_Hydraulic_Analysis AMEC
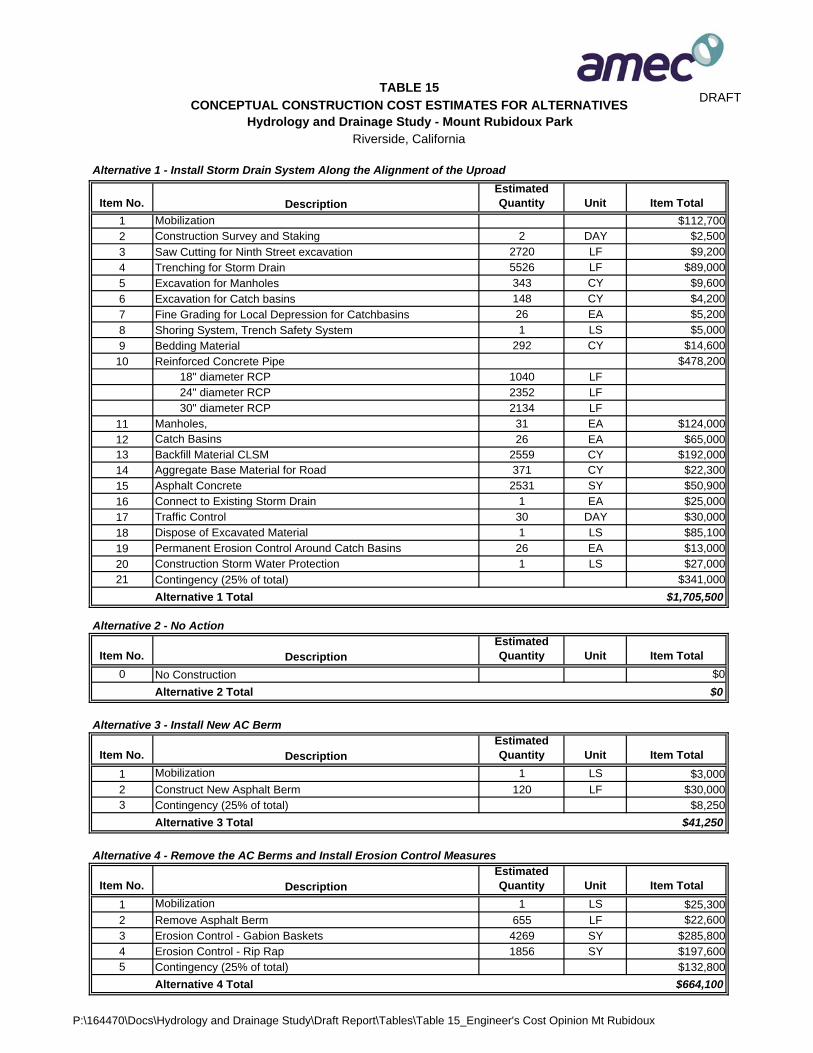
DRAFT
Alternative 1 - Install Storm Drain System Along the Alignment of the Uproad
Item No.Estimated Quantity Unit Item Total
1 $112,7002 Construction Survey and Staking 2 DAY $2,500
3 Saw Cutting for Ninth Street excavation 2720 LF $9,200
4 Trenching for Storm Drain 5526 LF $89,000
5 Excavation for Manholes 343 CY $9,600
6 Excavation for Catch basins 148 CY $4,200
7 Fine Grading for Local Depression for Catchbasins 26 EA $5,200
8 Shoring System, Trench Safety System 1 LS $5,000
9 Bedding Material 292 CY $14,600
10 Reinforced Concrete Pipe $478,20018" diameter RCP 1040 LF24" diameter RCP 2352 LF30" diameter RCP 2134 LF
11 Manholes, 31 EA $124,000
12 26 EA $65,00013 Backfill Material CLSM 2559 CY $192,00014 Aggregate Base Material for Road 371 CY $22,300
15 Asphalt Concrete 2531 SY $50,900
16 Connect to Existing Storm Drain 1 EA $25,000
17 Traffic Control 30 DAY $30,000
18 Dispose of Excavated Material 1 LS $85,100
19 Permanent Erosion Control Around Catch Basins 26 EA $13,000
20 Construction Storm Water Protection 1 LS $27,00021 Contingency (25% of total) $341,000
Alternative 1 Total $1,705,500
Alternative 2 - No Action
Item No.Estimated Quantity Unit Item Total
0 No Construction $0
Alternative 2 Total $0
Alternative 3 - Install New AC Berm
Item No.Estimated Quantity Unit Item Total
1 1 LS $3,0002 Construct New Asphalt Berm 120 LF $30,0003 Contingency (25% of total) $8,250
Alternative 3 Total $41,250
Alternative 4 - Remove the AC Berms and Install Erosion Control Measures
Item No.Estimated Quantity Unit Item Total
1 1 LS $25,3002 Remove Asphalt Berm 655 LF $22,600
3 Erosion Control - Gabion Baskets 4269 SY $285,8004 Erosion Control - Rip Rap 1856 SY $197,6005 Contingency (25% of total) $132,800
Alternative 4 Total $664,100
Description
Description
Mobilization
Description
Mobilization
TABLE 15
CONCEPTUAL CONSTRUCTION COST ESTIMATES FOR ALTERNATIVES
Description
Mobilization
Catch Basins
Hydrology and Drainage Study - Mount Rubidoux ParkRiverside, California
P:\164470\Docs\Hydrology and Drainage Study\Draft Report\Tables\Table 15_Engineer's Cost Opinion Mt Rubidoux
FIGURES
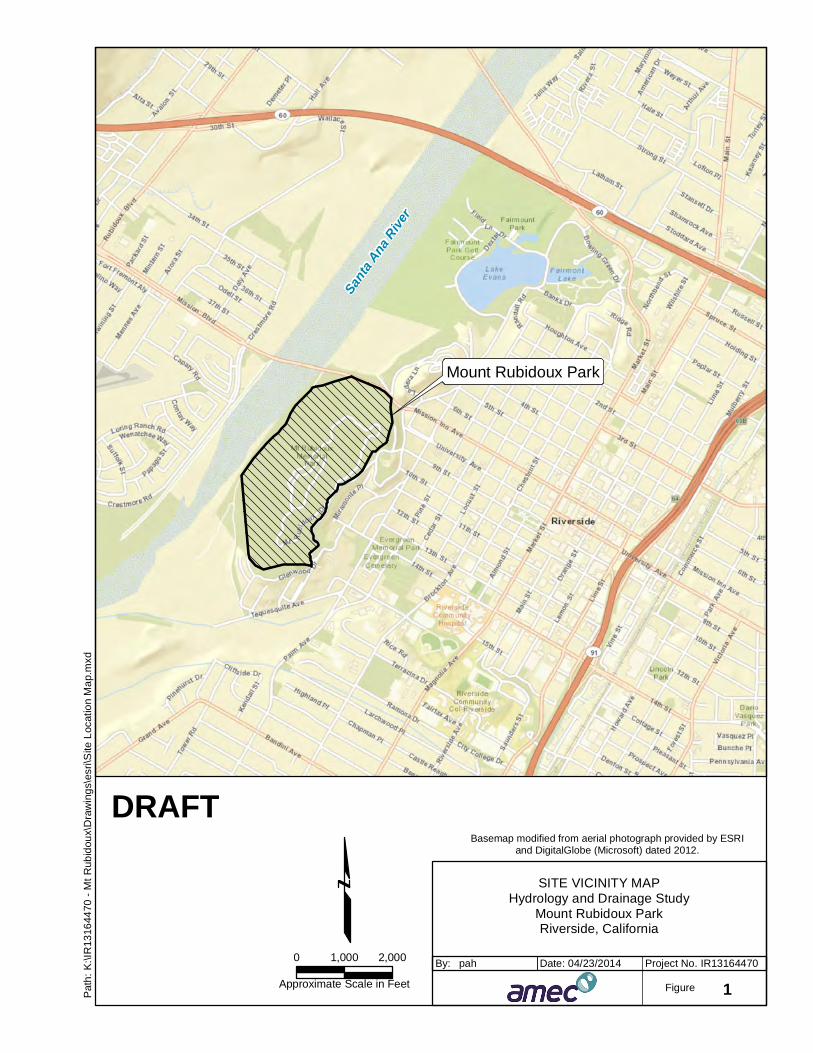
Mount Rubidoux Park
Santa
Ana Rive
r
DRAFTSITE VICINITY MAP
Hydrology and Drainage StudyMount Rubidoux ParkRiverside, California
IR13164470
1pah Date: 04/23/20140 2,0001,000
Approximate Scale in Feet
By: Project No.
Figure
Basemap modified from aerial photograph provided by ESRIand DigitalGlobe (Microsoft) dated 2012.
Pat
h:
K:\I
R13
1644
70 -
Mt
Rub
idou
x\D
raw
ing
s\es
ri\S
ite L
ocat
ion
Ma
p.m
xd
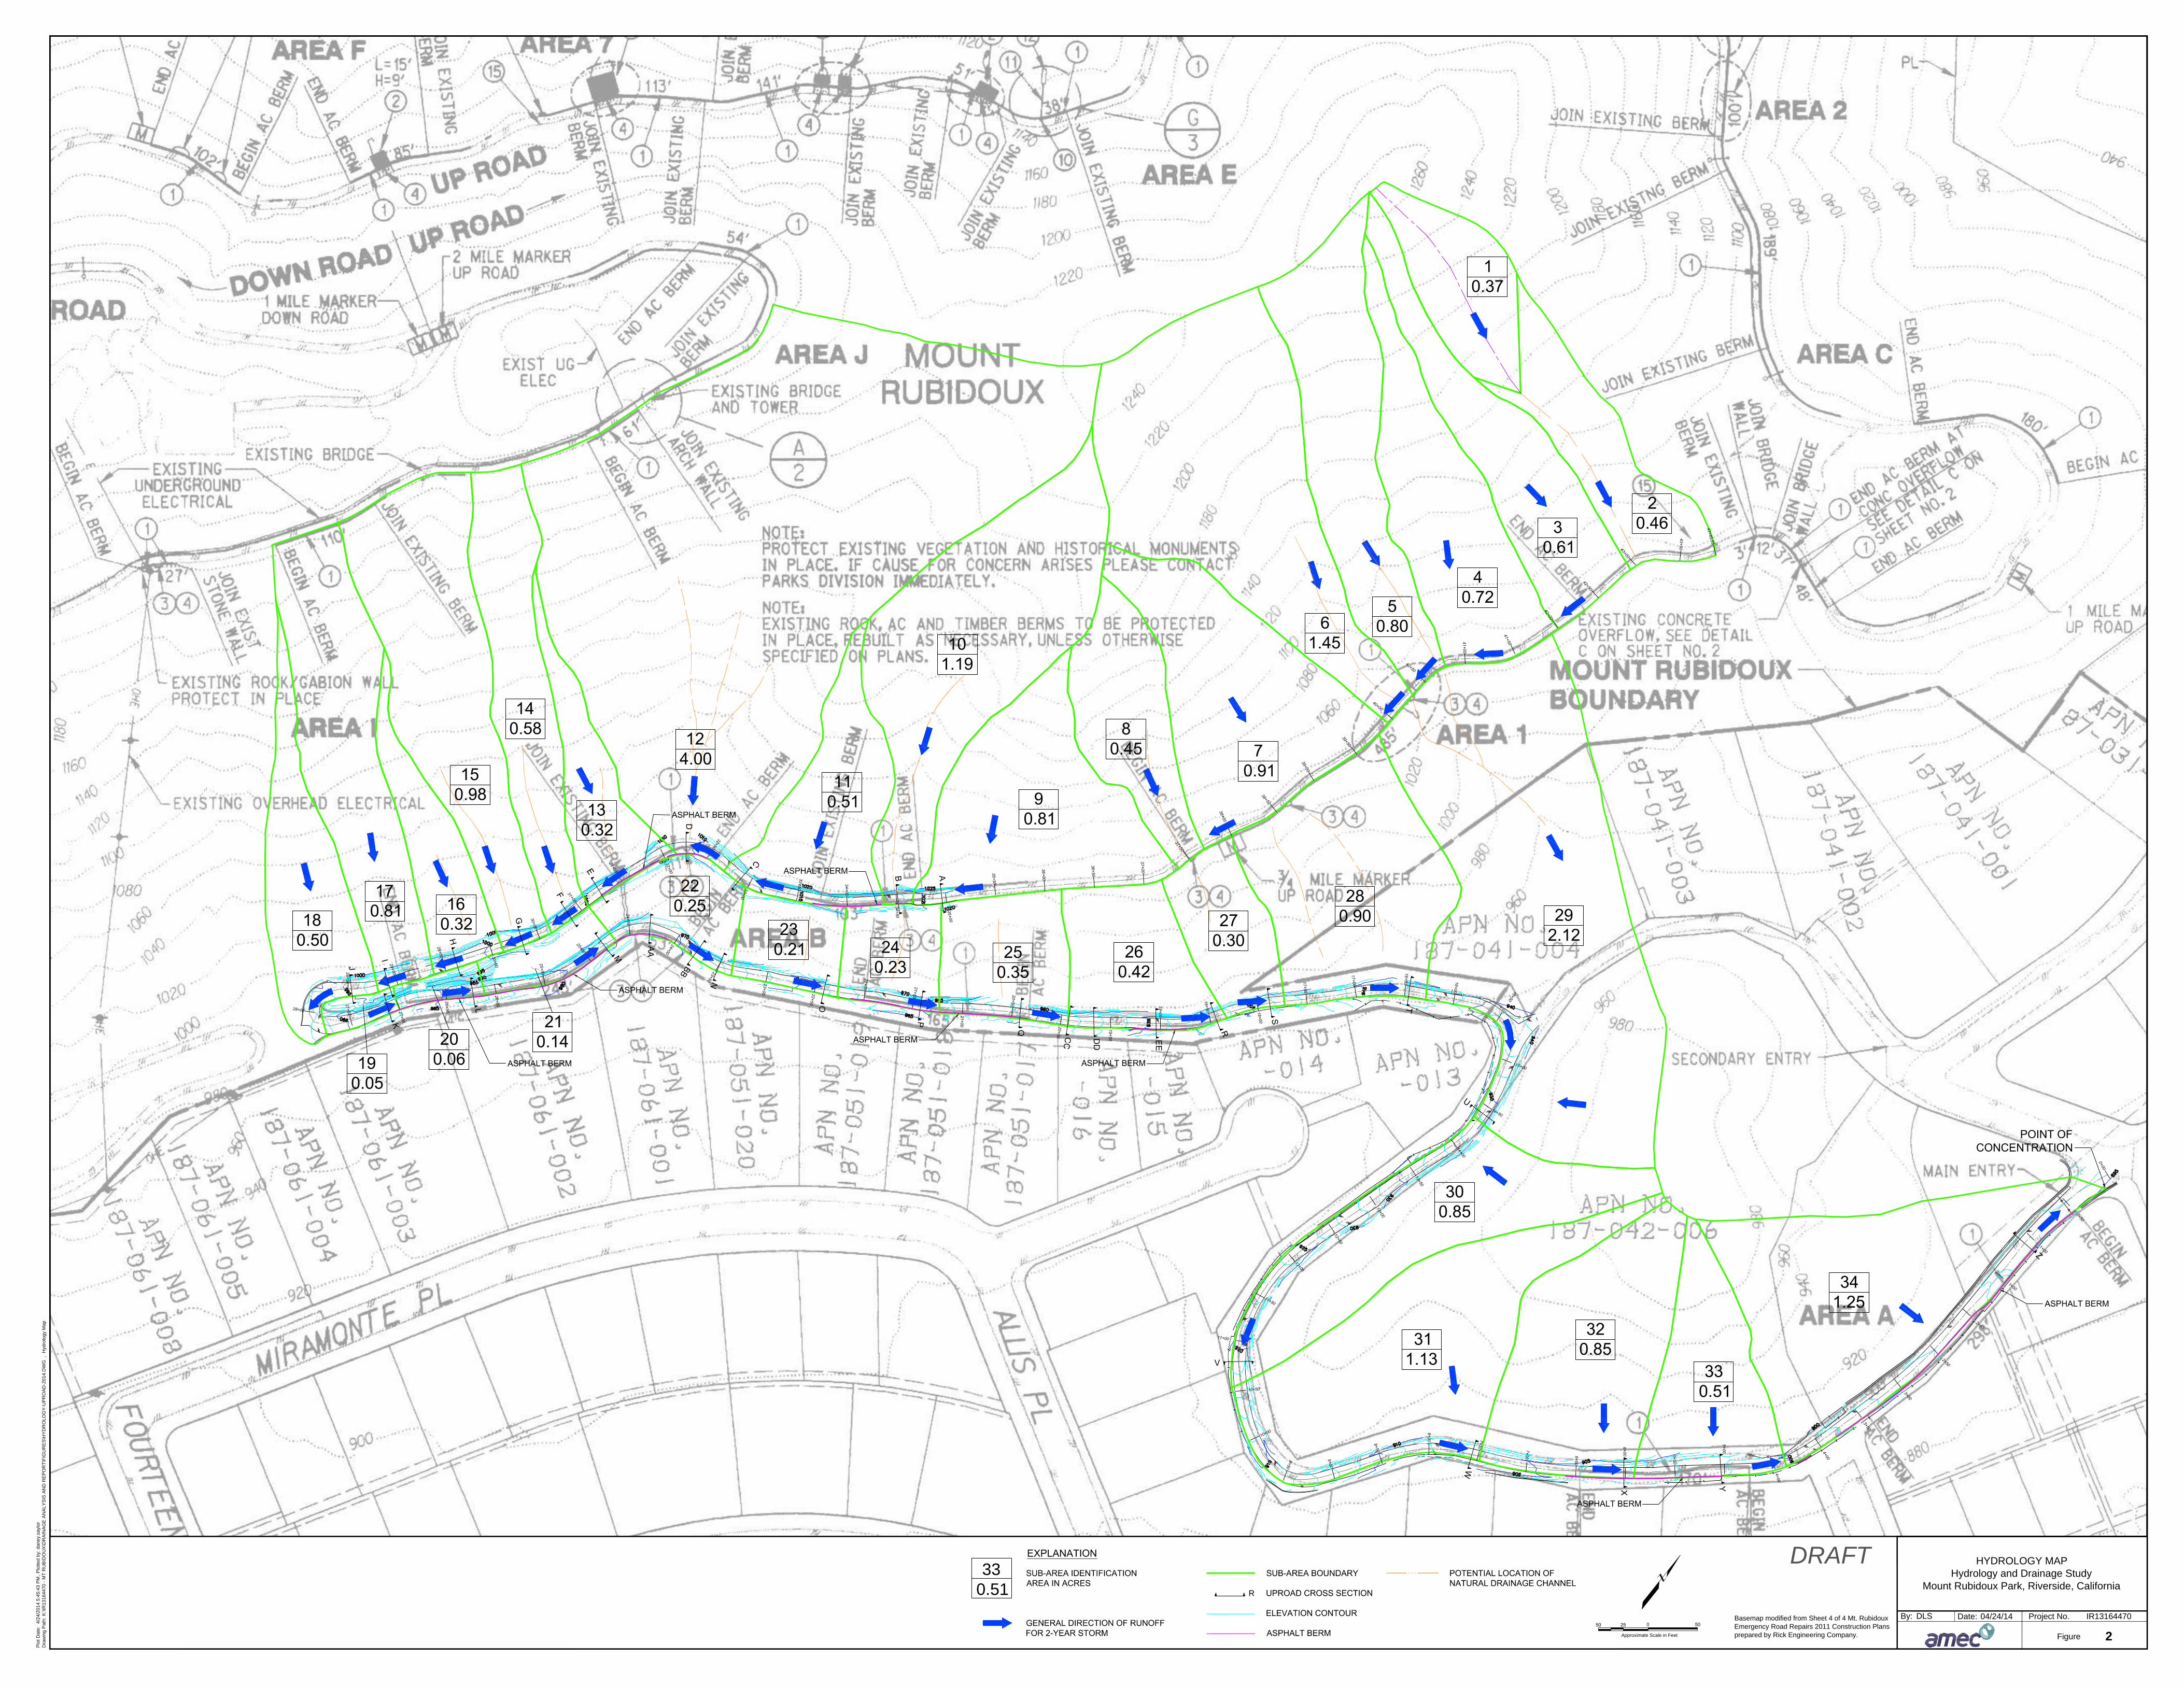
0
Approximate Scale in Feet
HYDROLOGY MAPHydrology and Drainage Study
Mount Rubidoux Park, Riverside, California
Basemap modified from Sheet 4 of 4 Mt. RubidouxEmergency Road Repairs 2011 Construction Plansprepared by Rick Engineering Company.
Project No.Date:By: DLS IR13164470
Figure 2
04/24/14
Plo
t D
ate
: 4
/24/2
014 5
:45:4
3 P
M,
Plo
tted b
y: d
aney.
sayl
or
Dra
win
g P
ath
: K
:\IR
13164470 -
MT
RU
BID
OU
X\D
RA
INA
GE
AN
ALY
SIS
AN
D R
EP
OR
T\F
IGU
RE
S\H
YD
RO
LO
GY
-UP
RO
AD
-2014.D
WG
, H
ydro
logy
Map
330.51 R
DRAFT
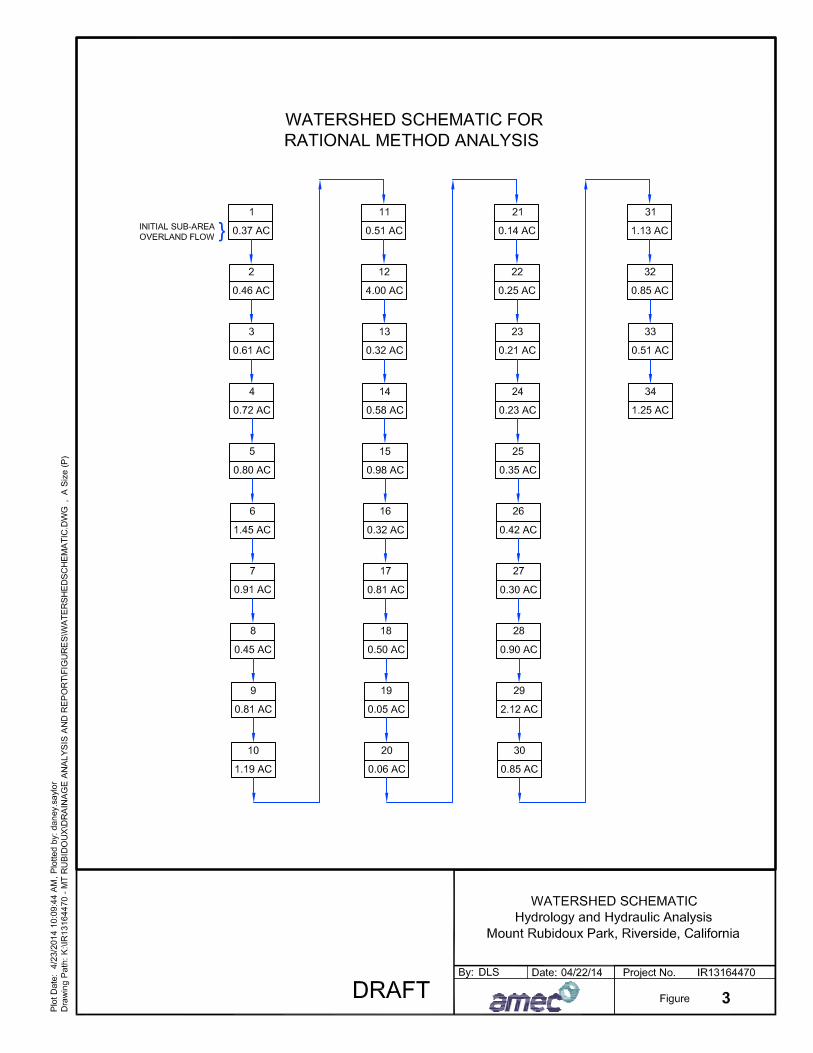
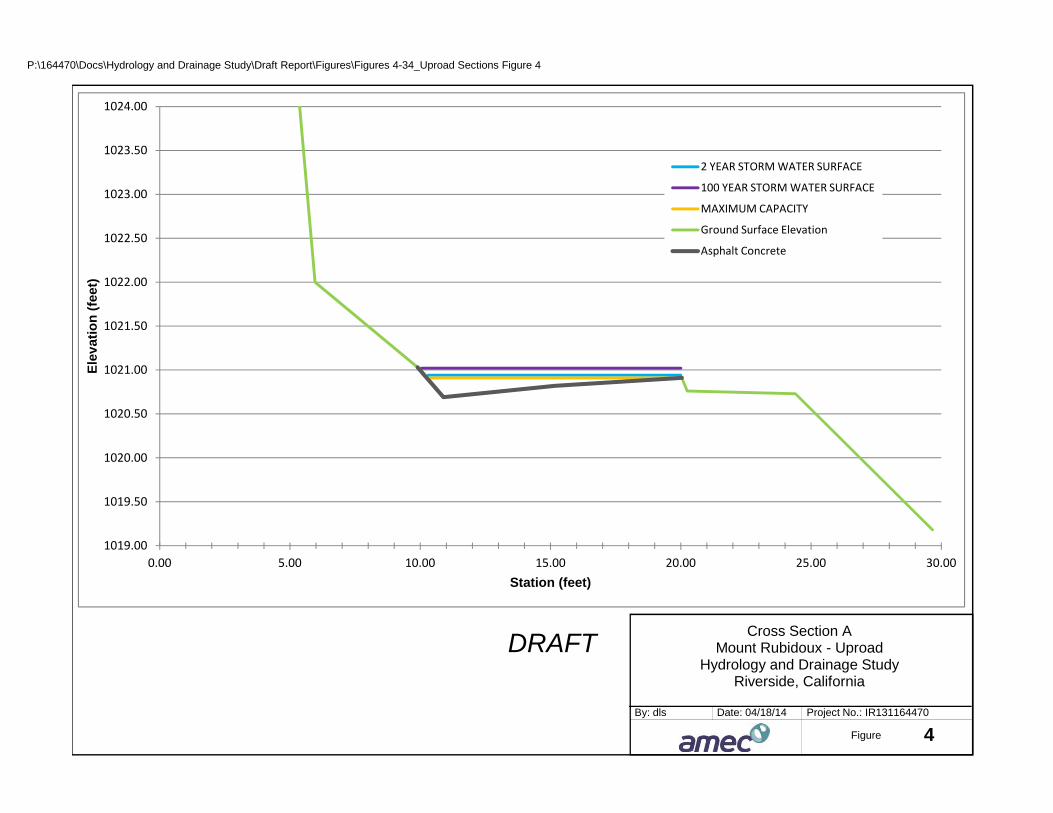
P:\164470\Docs\Hydrology and Drainage Study\Draft Report\Figures\Figures 4-34_Uproad Sections Figure 4
1020.50
1021.00
1021.50
1022.00
1022.50
1023.00
1023.50
1024.00E
lev
atio
n (
feet
)
2 YEAR STORM WATER SURFACE
100 YEAR STORM WATER SURFACE
MAXIMUM CAPACITY
Ground Surface Elevation
Asphalt Concrete
Cross Section AMount Rubidoux - Uproad
Hydrology and Drainage StudyRiverside, California
Project No.: IR131164470
4Date: 04/18/14By: dls
Figure
1019.00
1019.50
1020.00
0.00 5.00 10.00 15.00 20.00 25.00 30.00Station (feet)
DRAFT
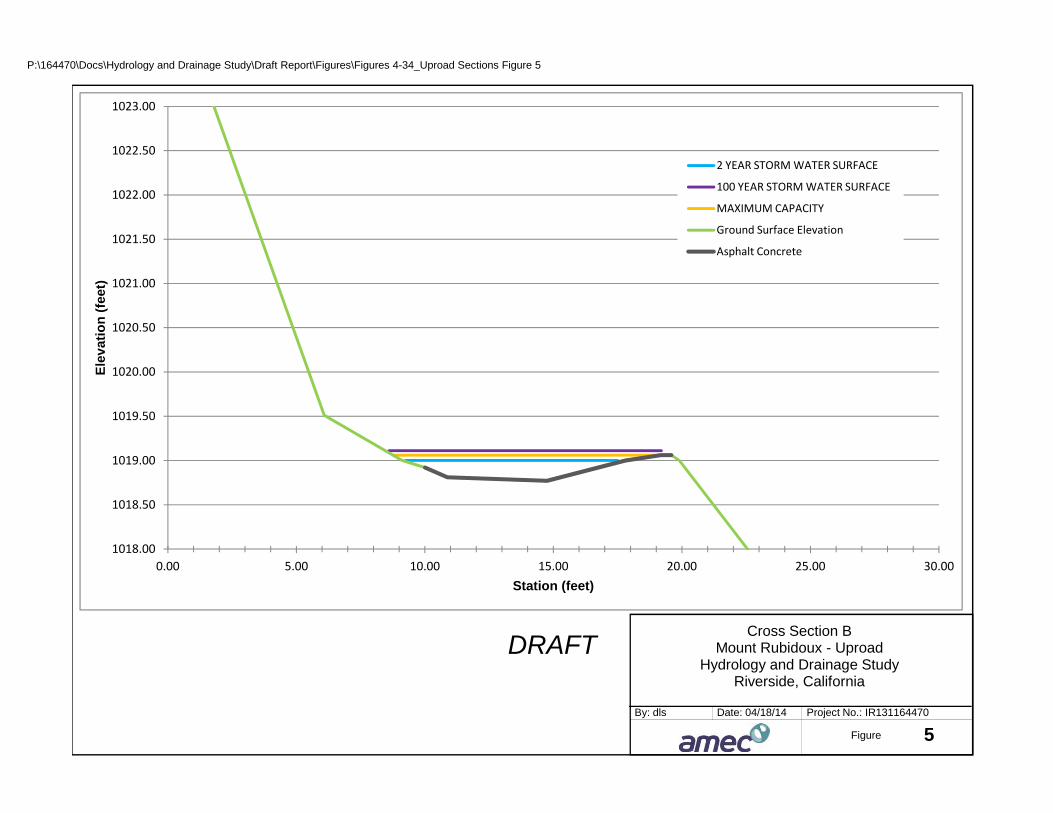
P:\164470\Docs\Hydrology and Drainage Study\Draft Report\Figures\Figures 4-34_Uproad Sections Figure 5
1019.50
1020.00
1020.50
1021.00
1021.50
1022.00
1022.50
1023.00E
lev
atio
n (
feet
)
2 YEAR STORM WATER SURFACE
100 YEAR STORM WATER SURFACE
MAXIMUM CAPACITY
Ground Surface Elevation
Asphalt Concrete
Cross Section BMount Rubidoux - Uproad
Hydrology and Drainage StudyRiverside, California
Project No.: IR131164470
5Date: 04/18/14By: dls
Figure
1018.00
1018.50
1019.00
0.00 5.00 10.00 15.00 20.00 25.00 30.00Station (feet)
DRAFT
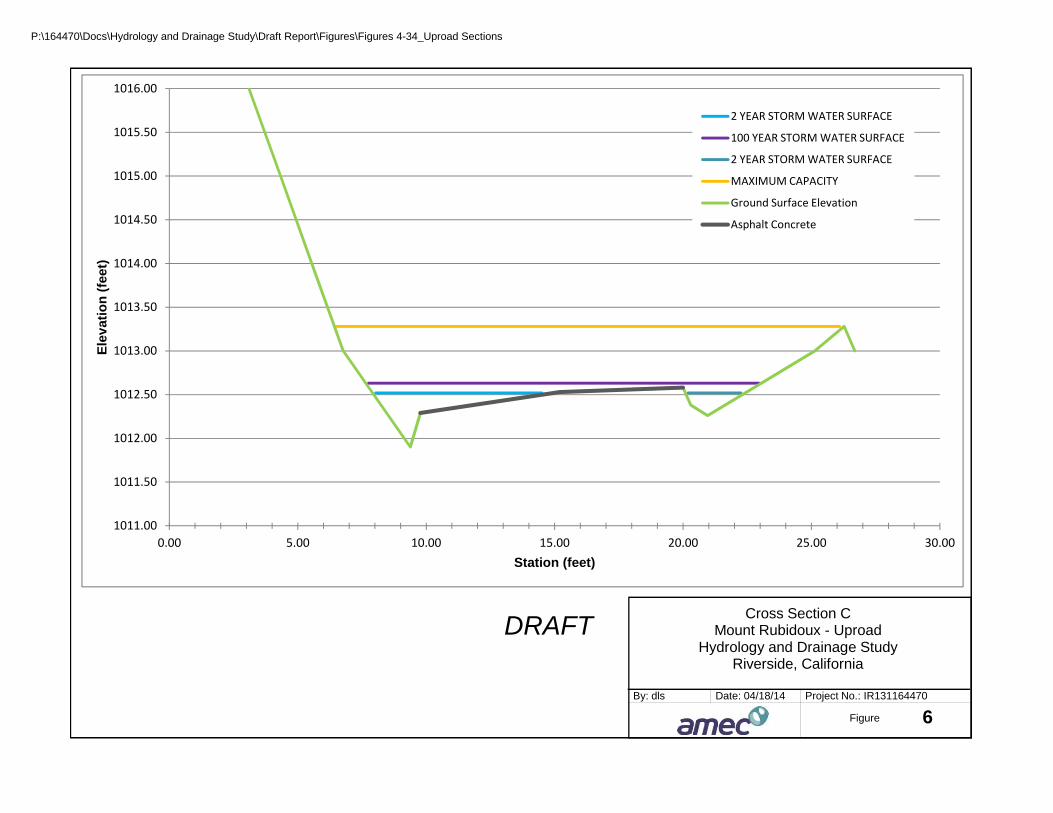
P:\164470\Docs\Hydrology and Drainage Study\Draft Report\Figures\Figures 4-34_Uproad Sections
1012.50
1013.00
1013.50
1014.00
1014.50
1015.00
1015.50
1016.00E
lev
atio
n (
feet
)2 YEAR STORM WATER SURFACE
100 YEAR STORM WATER SURFACE
2 YEAR STORM WATER SURFACE
MAXIMUM CAPACITY
Ground Surface Elevation
Asphalt Concrete
Cross Section CMount Rubidoux - Uproad
Hydrology and Drainage StudyRiverside, California
Project No.: IR131164470
6Date: 04/18/14By: dls
Figure
1011.00
1011.50
1012.00
0.00 5.00 10.00 15.00 20.00 25.00 30.00Station (feet)
DRAFT
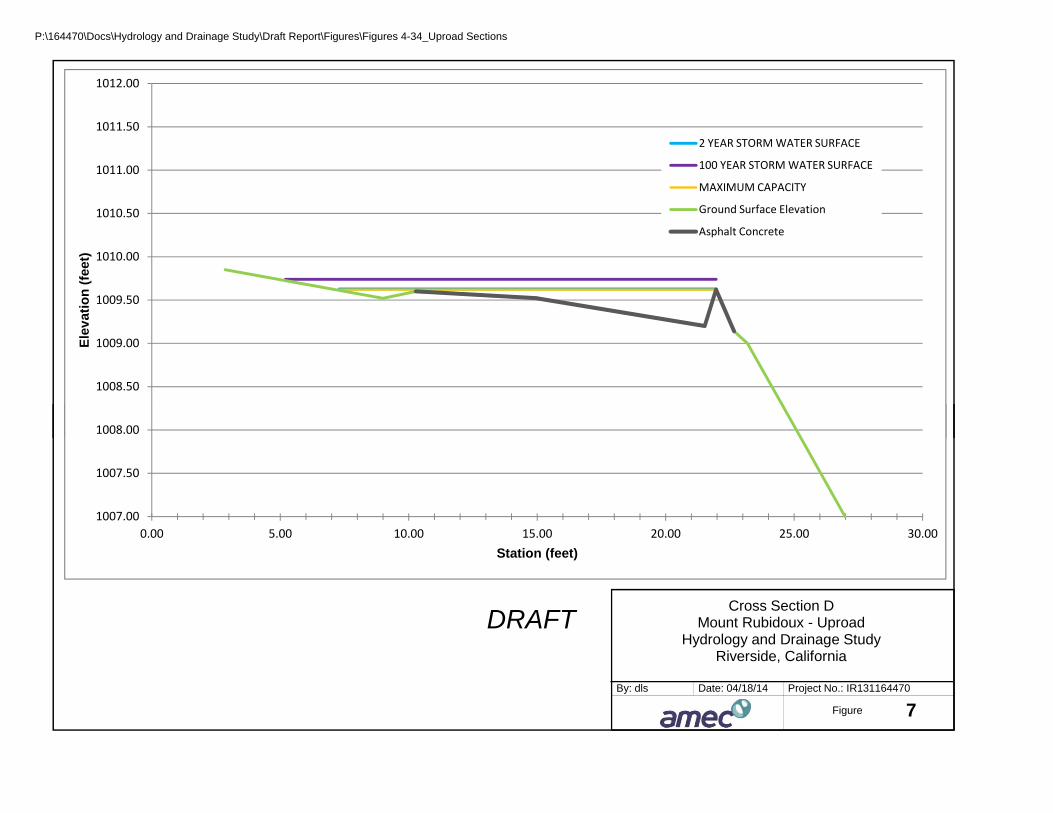
P:\164470\Docs\Hydrology and Drainage Study\Draft Report\Figures\Figures 4-34_Uproad Sections
1008.00
1008.50
1009.00
1009.50
1010.00
1010.50
1011.00
1011.50
1012.00E
lev
atio
n (
feet
)
2 YEAR STORM WATER SURFACE
100 YEAR STORM WATER SURFACE
MAXIMUM CAPACITY
Ground Surface Elevation
Asphalt Concrete
Cross Section DMount Rubidoux - Uproad
Hydrology and Drainage StudyRiverside, California
Project No.: IR131164470
7Date: 04/18/14By: dls
Figure
1007.00
1007.50
1008.00
0.00 5.00 10.00 15.00 20.00 25.00 30.00Station (feet)
DRAFT
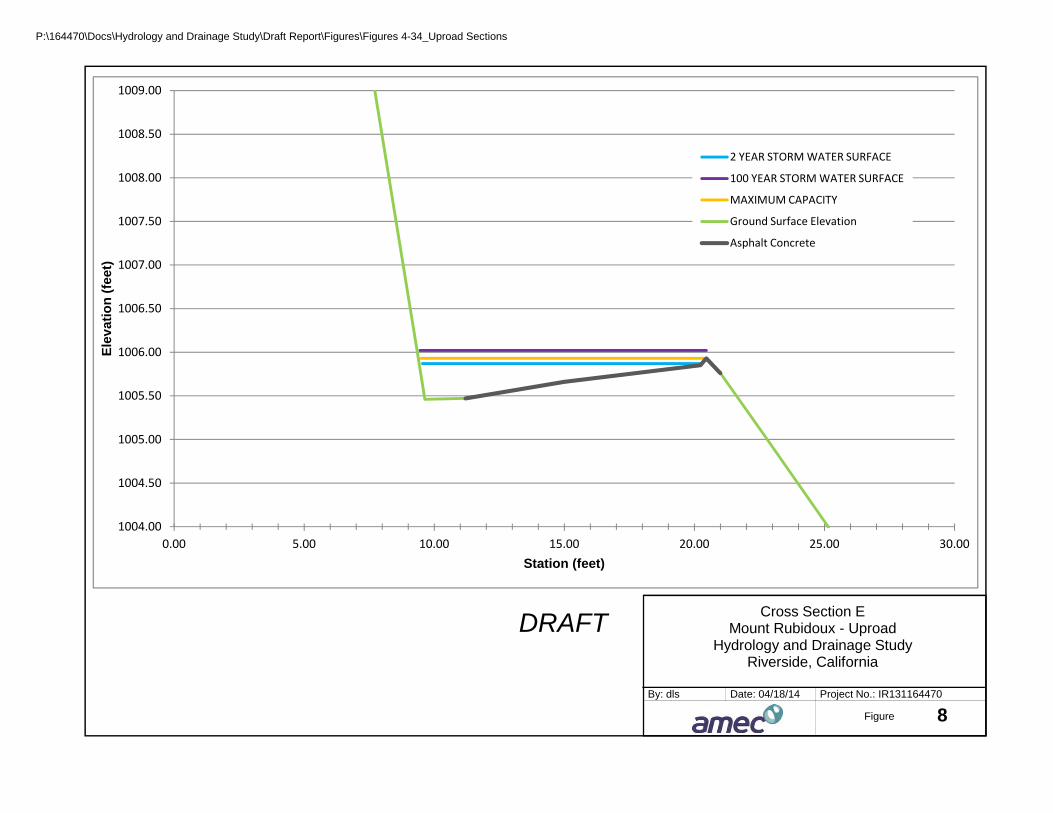
P:\164470\Docs\Hydrology and Drainage Study\Draft Report\Figures\Figures 4-34_Uproad Sections
1005.50
1006.00
1006.50
1007.00
1007.50
1008.00
1008.50
1009.00E
lev
atio
n (
feet
)
2 YEAR STORM WATER SURFACE
100 YEAR STORM WATER SURFACE
MAXIMUM CAPACITY
Ground Surface Elevation
Asphalt Concrete
Cross Section EMount Rubidoux - Uproad
Hydrology and Drainage StudyRiverside, California
Project No.: IR131164470
8Date: 04/18/14By: dls
Figure
1004.00
1004.50
1005.00
0.00 5.00 10.00 15.00 20.00 25.00 30.00Station (feet)
DRAFT
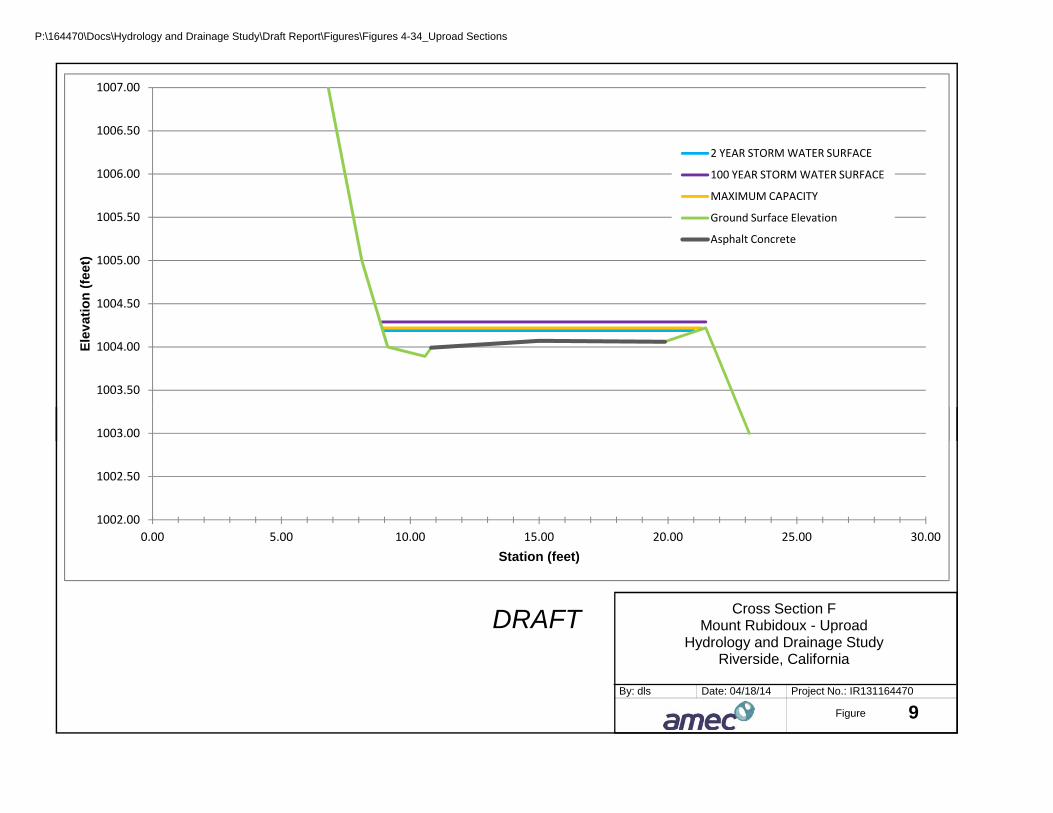
P:\164470\Docs\Hydrology and Drainage Study\Draft Report\Figures\Figures 4-34_Uproad Sections
1003.00
1003.50
1004.00
1004.50
1005.00
1005.50
1006.00
1006.50
1007.00E
lev
atio
n (
feet
)
2 YEAR STORM WATER SURFACE
100 YEAR STORM WATER SURFACE
MAXIMUM CAPACITY
Ground Surface Elevation
Asphalt Concrete
Cross Section FMount Rubidoux - Uproad
Hydrology and Drainage StudyRiverside, California
Project No.: IR131164470
9Date: 04/18/14By: dls
Figure
1002.00
1002.50
1003.00
0.00 5.00 10.00 15.00 20.00 25.00 30.00Station (feet)
DRAFT

P:\164470\Docs\Hydrology and Drainage Study\Draft Report\Figures\Figures 4-34_Uproad Sections
1001.00
1001.50
1002.00
1002.50
1003.00
1003.50
1004.00
1004.50
1005.00E
lev
atio
n (
feet
)
2 YEAR STORM WATER SURFACE
100 YEAR STORM WATER SURFACE
2 YEAR STORM WATER SURFACE
MAXIMUM CAPACITY
Ground Surface Elevation
Asphalt Concrete
Cross Section GMount Rubidoux - Uproad
Hydrology and Drainage StudyRiverside, California
Project No.: IR131164470
10Date: 04/18/14By: dls
Figure
1000.00
1000.50
1001.00
0.00 5.00 10.00 15.00 20.00 25.00 30.00Station (feet)
DRAFT

P:\164470\Docs\Hydrology and Drainage Study\Draft Report\Figures\Figures 4-34_Uproad Sections
998.50
999.00
999.50
1000.00
1000.50
1001.00
1001.50
1002.00E
lev
atio
n (
feet
)
2 YEAR STORM WATER SURFACE
100 YEAR STORM WATER SURFACE
MAXIMUM CAPACITY
Ground Surface Elevation
Asphalt Concrete
Cross Section HMount Rubidoux - Uproad
Hydrology and Drainage StudyRiverside, California
Project No.: IR131164470
11Date: 04/18/14By: dls
Figure
997.00
997.50
998.00
0.00 5.00 10.00 15.00 20.00 25.00 30.00Station (feet)
DRAFT

P:\164470\Docs\Hydrology and Drainage Study\Draft Report\Figures\Figures 4-34_Uproad Sections
996.00
996.50
997.00
997.50
998.00
998.50
999.00
999.50
1000.00E
lev
atio
n (
feet
)
2 YEAR STORM WATER SURFACE
100 YEAR STORM WATER SURFACE
2 YEAR STORM WATER SURFACE
MAXIMUM CAPACITY
MAXIMUM CAPACITY
Ground Surface Elevation
Asphalt Concrete
Cross Section IMount Rubidoux - Uproad
Hydrology and Drainage StudyRiverside, California
Project No.: IR131164470
12Date: 04/21/14By: dls
Figure
995.00
995.50
996.00
0.00 5.00 10.00 15.00 20.00 25.00 30.00Station (feet)
DRAFT

P:\164470\Docs\Hydrology and Drainage Study\Draft Report\Figures\Figures 4-34_Uproad Sections
994.00
994.50
995.00
995.50
996.00
996.50
997.00
997.50
998.00E
lev
atio
n (
feet
)
2 YEAR STORM WATER SURFACE
100 YEAR STORM WATER SURFACE
MAXIMUM CAPACITY
Ground Surface Elevation
Asphalt Concrete
Cross Section JMount Rubidoux - Uproad
Hydrology and Drainage StudyRiverside, California
Project No.: IR131164470
13Date: 04/21/14By: dls
Figure
993.00
993.50
994.00
0.00 5.00 10.00 15.00 20.00 25.00 30.00Station (feet)
DRAFT

P:\164470\Docs\Hydrology and Drainage Study\Draft Report\Figures\Figures 4-34_Uproad Sections
987.00
987.50
988.00
988.50
989.00
989.50
990.00
990.50
991.00E
lev
atio
n (
feet
)
2 YEAR STORM WATER SURFACE
100 YEAR STORM WATER SURFACE
MAXIMUM CAPACITY
Ground Surface Elevation
Asphalt Concrete
Cross Section KMount Rubidoux - Uproad
Hydrology and Drainage StudyRiverside, California
Project No.: IR131164470
14Date: 04/21/14By: dls
Figure
986.00
986.50
987.00
0.00 5.00 10.00 15.00 20.00 25.00 30.00Station (feet)
DRAFT
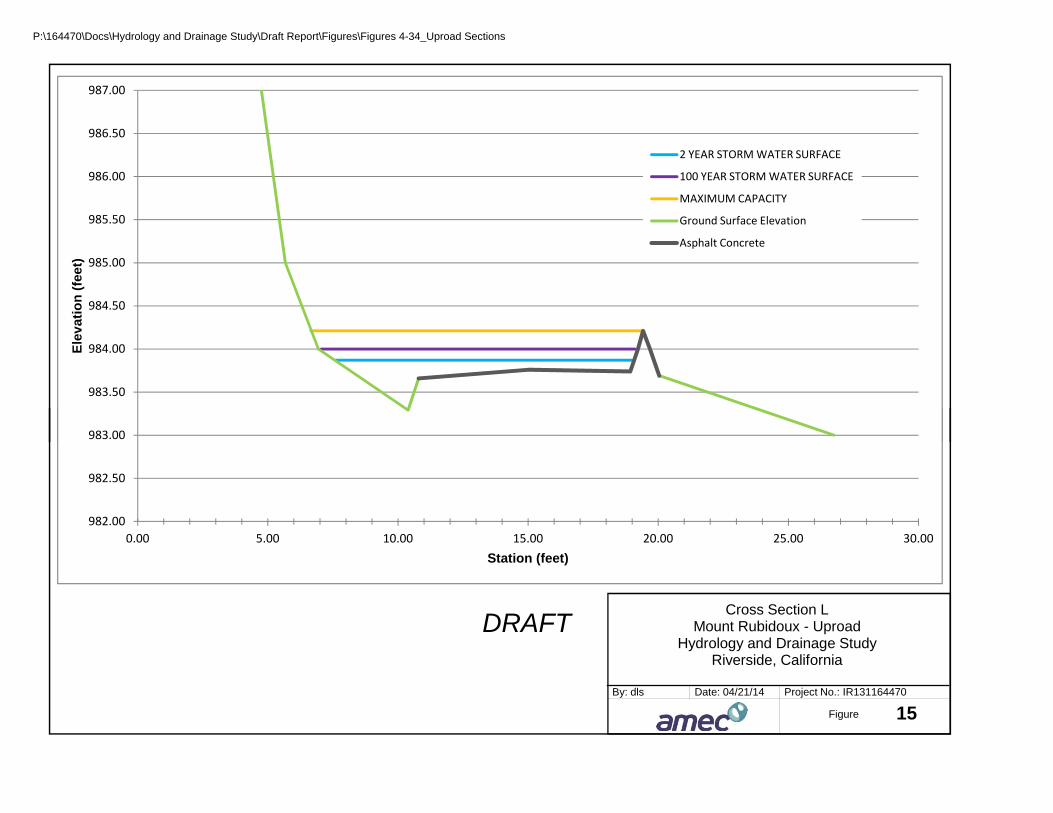
P:\164470\Docs\Hydrology and Drainage Study\Draft Report\Figures\Figures 4-34_Uproad Sections
983.00
983.50
984.00
984.50
985.00
985.50
986.00
986.50
987.00E
lev
atio
n (
feet
)
2 YEAR STORM WATER SURFACE
100 YEAR STORM WATER SURFACE
MAXIMUM CAPACITY
Ground Surface Elevation
Asphalt Concrete
Cross Section LMount Rubidoux - Uproad
Hydrology and Drainage StudyRiverside, California
Project No.: IR131164470
15Date: 04/21/14By: dls
Figure
982.00
982.50
983.00
0.00 5.00 10.00 15.00 20.00 25.00 30.00Station (feet)
DRAFT

P:\164470\Docs\Hydrology and Drainage Study\Draft Report\Figures\Figures 4-34_Uproad Sections
977.50
978.00
978.50
979.00
979.50
980.00
980.50
981.00E
lev
atio
n (
feet
)
2 YEAR STORM WATER SURFACE
100 YEAR STORM WATER SURFACE
MAXIMUM CAPACITY
Ground Surface Elevation
Asphalt Concrete
Cross Section MMount Rubidoux - Uproad
Hydrology and Drainage StudyRiverside, California
Project No.: IR131164470
16Date: 04/21/14By: dls
Figure
976.00
976.50
977.00
0.00 5.00 10.00 15.00 20.00 25.00 30.00Station (feet)
DRAFT
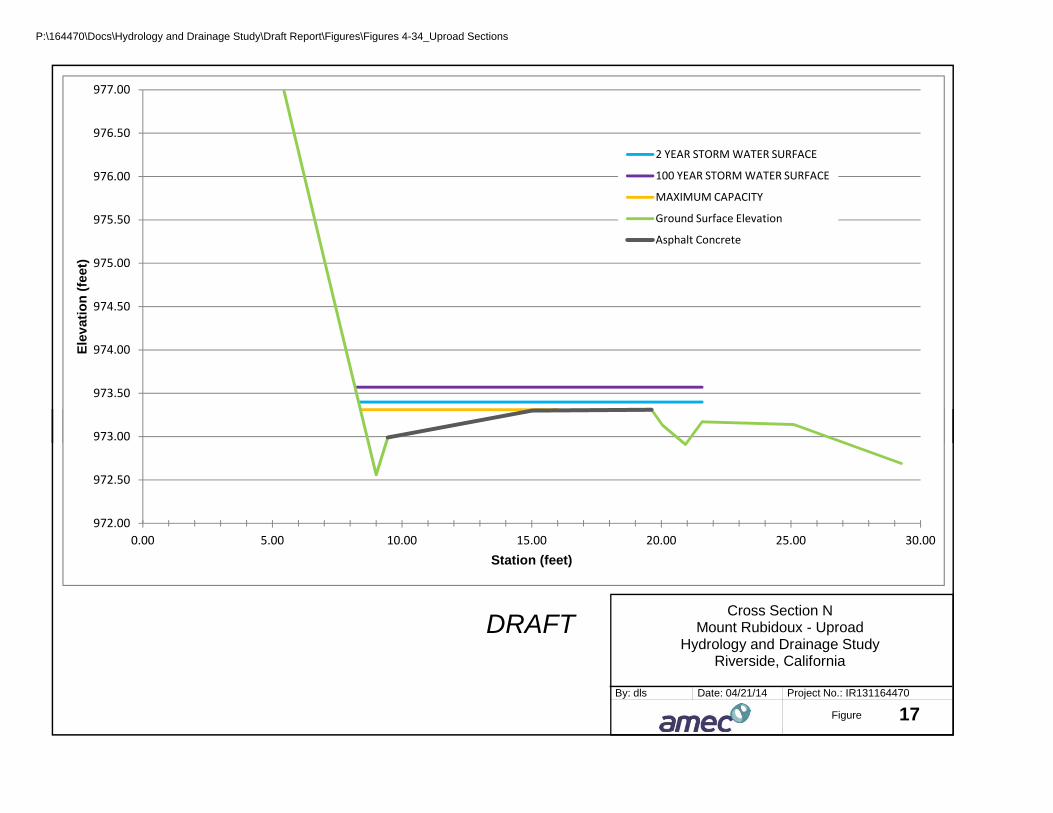
P:\164470\Docs\Hydrology and Drainage Study\Draft Report\Figures\Figures 4-34_Uproad Sections
973.00
973.50
974.00
974.50
975.00
975.50
976.00
976.50
977.00E
lev
atio
n (
feet
)
2 YEAR STORM WATER SURFACE
100 YEAR STORM WATER SURFACE
MAXIMUM CAPACITY
Ground Surface Elevation
Asphalt Concrete
Cross Section NMount Rubidoux - Uproad
Hydrology and Drainage StudyRiverside, California
Project No.: IR131164470
17Date: 04/21/14By: dls
Figure
972.00
972.50
973.00
0.00 5.00 10.00 15.00 20.00 25.00 30.00Station (feet)
DRAFT
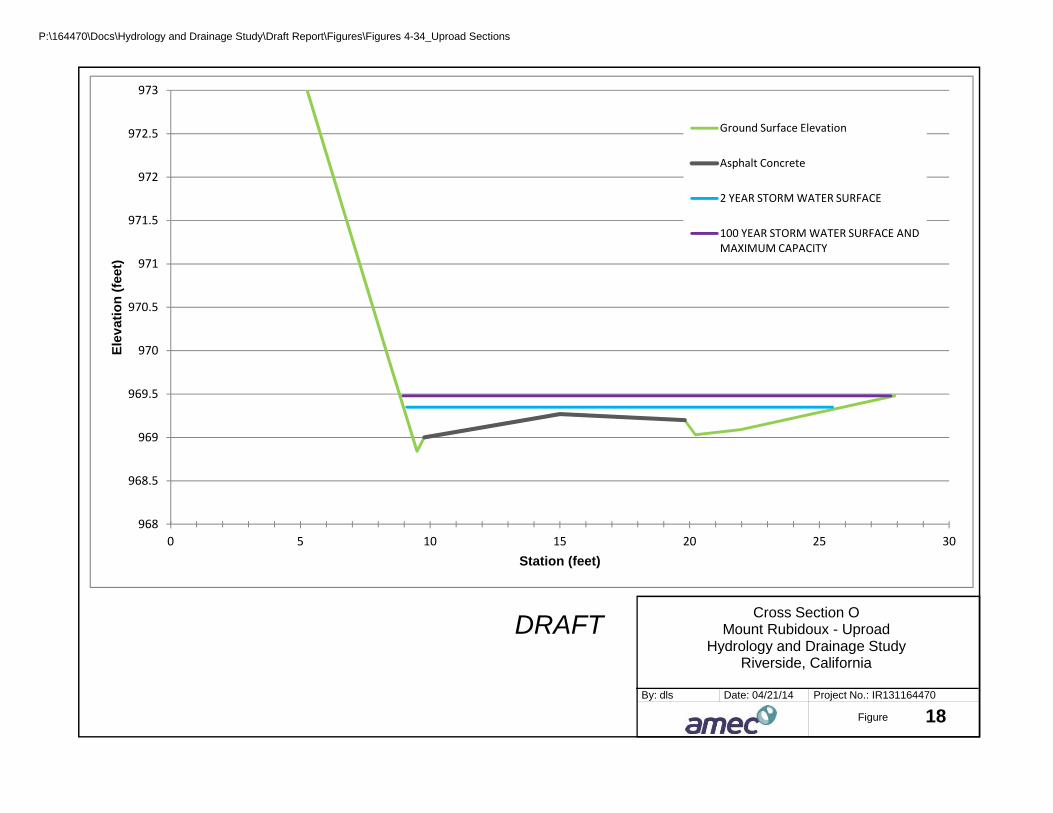
P:\164470\Docs\Hydrology and Drainage Study\Draft Report\Figures\Figures 4-34_Uproad Sections
969.5
970
970.5
971
971.5
972
972.5
973
Ele
vat
ion
(fe
et)
Ground Surface Elevation
Asphalt Concrete
2 YEAR STORM WATER SURFACE
100 YEAR STORM WATER SURFACE AND MAXIMUM CAPACITY
Cross Section OMount Rubidoux - Uproad
Hydrology and Drainage StudyRiverside, California
Project No.: IR131164470
18Date: 04/21/14By: dls
Figure
968
968.5
969
0 5 10 15 20 25 30Station (feet)
DRAFT

P:\164470\Docs\Hydrology and Drainage Study\Draft Report\Figures\Figures 4-34_Uproad Sections
965.00
965.50
966.00
966.50
967.00
967.50
968.00
968.50
969.00E
lev
atio
n (
feet
)
2 YEAR STORM WATER SURFACE
100 YEAR STORM WATER SURFACEMAXIMUM CAPACITY
Ground Surface Elevation
Cross Section PMount Rubidoux - Uproad
Hydrology and Drainage StudyRiverside, California
Project No.: IR131164470
19Date: 04/21/14By: dls
Figure
964.00
964.50
965.00
0.00 5.00 10.00 15.00 20.00 25.00 30.00Station (feet)
DRAFT

P:\164470\Docs\Hydrology and Drainage Study\Draft Report\Figures\Figures 4-34_Uproad Sections
960.00
960.50
961.00
961.50
962.00
962.50
963.00
963.50
964.00E
lev
atio
n (
feet
)
2 YEAR STORM WATER SURFACE
100 YEAR STORM WATER SURFACE
MAXIMUM CAPACITY
Ground Surface Elevation
Asphalt Concrete
Cross Section QMount Rubidoux - Uproad
Hydrology and Drainage StudyRiverside, California
Project No.: IR131164470
20Date: 04/21/14By: dls
Figure
959.00
959.50
960.00
0.00 5.00 10.00 15.00 20.00 25.00 30.00Station (feet)
DRAFT
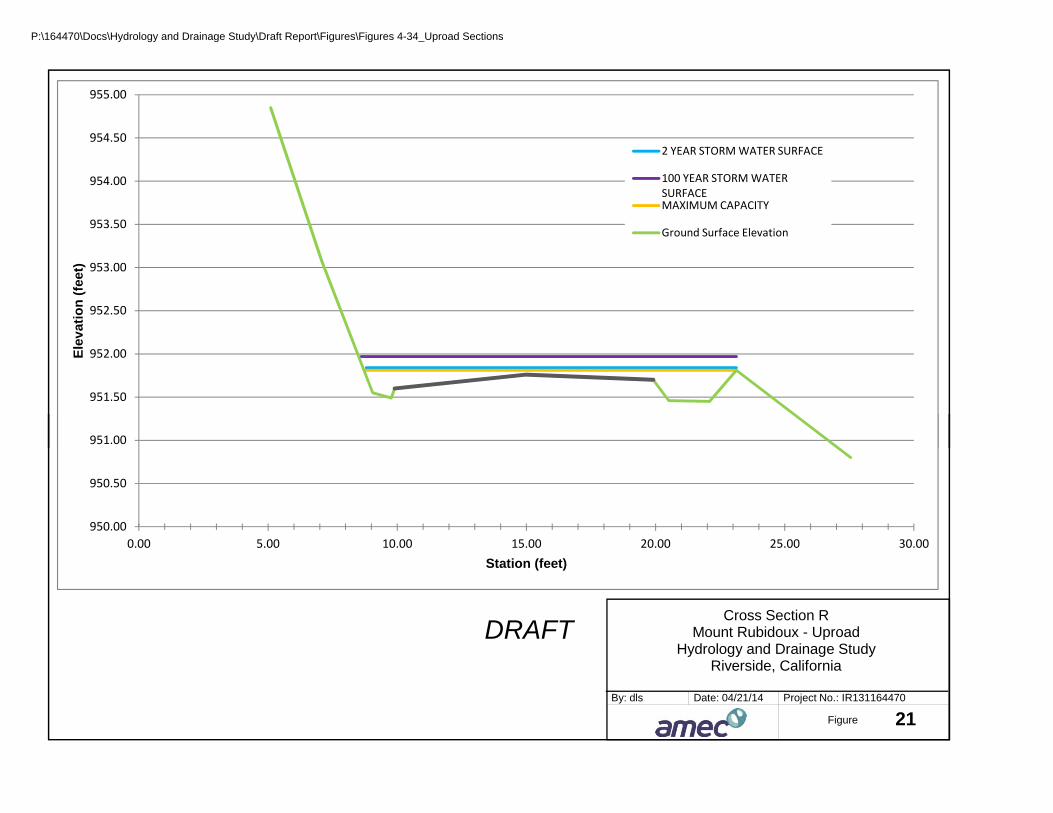
P:\164470\Docs\Hydrology and Drainage Study\Draft Report\Figures\Figures 4-34_Uproad Sections
951.00
951.50
952.00
952.50
953.00
953.50
954.00
954.50
955.00E
lev
atio
n (
feet
)
2 YEAR STORM WATER SURFACE
100 YEAR STORM WATER SURFACEMAXIMUM CAPACITY
Ground Surface Elevation
Cross Section RMount Rubidoux - Uproad
Hydrology and Drainage StudyRiverside, California
Project No.: IR131164470
21Date: 04/21/14By: dls
Figure
950.00
950.50
951.00
0.00 5.00 10.00 15.00 20.00 25.00 30.00Station (feet)
DRAFT
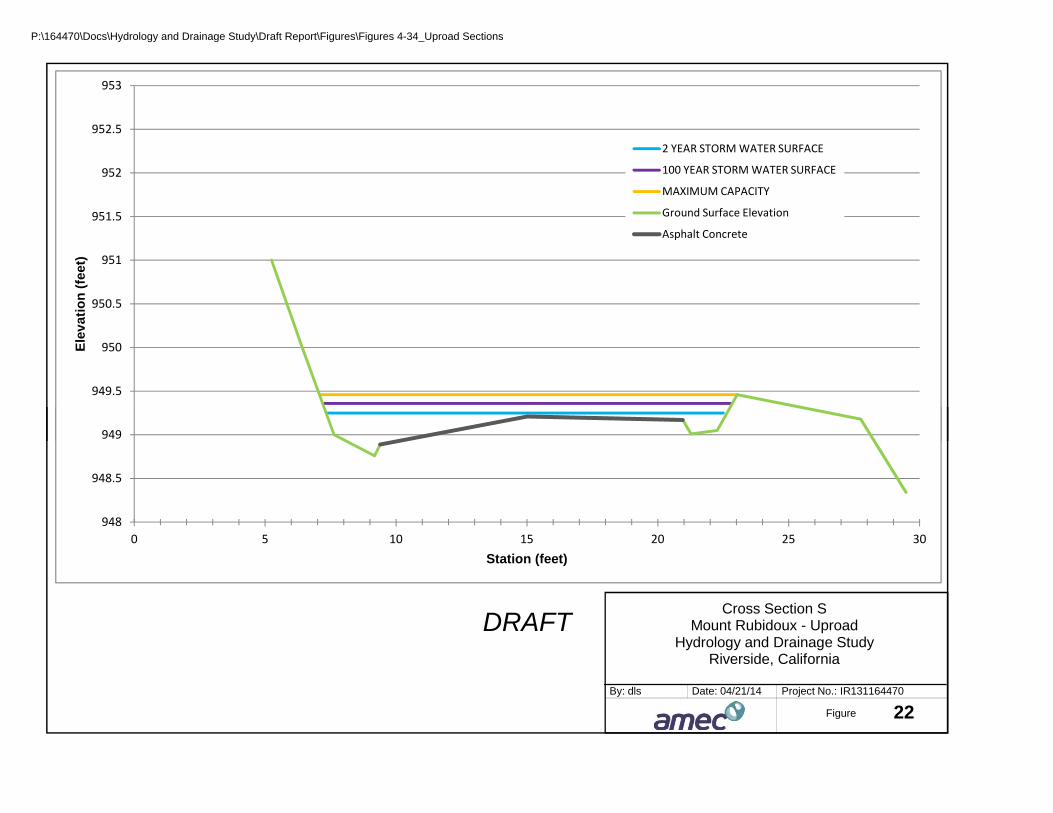
P:\164470\Docs\Hydrology and Drainage Study\Draft Report\Figures\Figures 4-34_Uproad Sections
949
949.5
950
950.5
951
951.5
952
952.5
953E
lev
atio
n (
feet
)
2 YEAR STORM WATER SURFACE
100 YEAR STORM WATER SURFACE
MAXIMUM CAPACITY
Ground Surface Elevation
Asphalt Concrete
Cross Section SMount Rubidoux - Uproad
Hydrology and Drainage StudyRiverside, California
Project No.: IR131164470
22Date: 04/21/14By: dls
Figure
948
948.5
949
0 5 10 15 20 25 30Station (feet)
DRAFT

P:\164470\Docs\Hydrology and Drainage Study\Draft Report\Figures\Figures 4-34_Uproad Sections
942.50
943.00
943.50
944.00
944.50
945.00
945.50
946.00E
lev
atio
n (
feet
)
2 YEAR STORM WATER SURFACE
100 YEAR STORM WATER SURFACE
MAXIMUM CAPACITY
Ground Surface Elevation
Asphalt Concrete
Cross Section TMount Rubidoux - Uproad
Hydrology and Drainage StudyRiverside, California
Project No.: IR131164470
23Date: 04/21/14By: dls
Figure
941.00
941.50
942.00
0.00 5.00 10.00 15.00 20.00 25.00 30.00Station (feet)
DRAFT

P:\164470\Docs\Hydrology and Drainage Study\Draft Report\Figures\Figures 4-34_Uproad Sections
934.50
935.00
935.50
936.00
936.50
937.00
937.50
938.00
Ele
vat
ion
(fe
et)
2 YEAR STORM WATER SURFACE
100 YEAR STORM WATER SURFACE AND MAXIMUM CAPACITY
Ground Surface Elevation
Asphalt Concrete
Cross Section UMount Rubidoux - Uproad
Hydrology and Drainage StudyRiverside, California
Project No.: IR131164470
24Date: 04/21/14By: dls
Figure
933.00
933.50
934.00
0.00 5.00 10.00 15.00 20.00 25.00 30.00Station (feet)
DRAFT
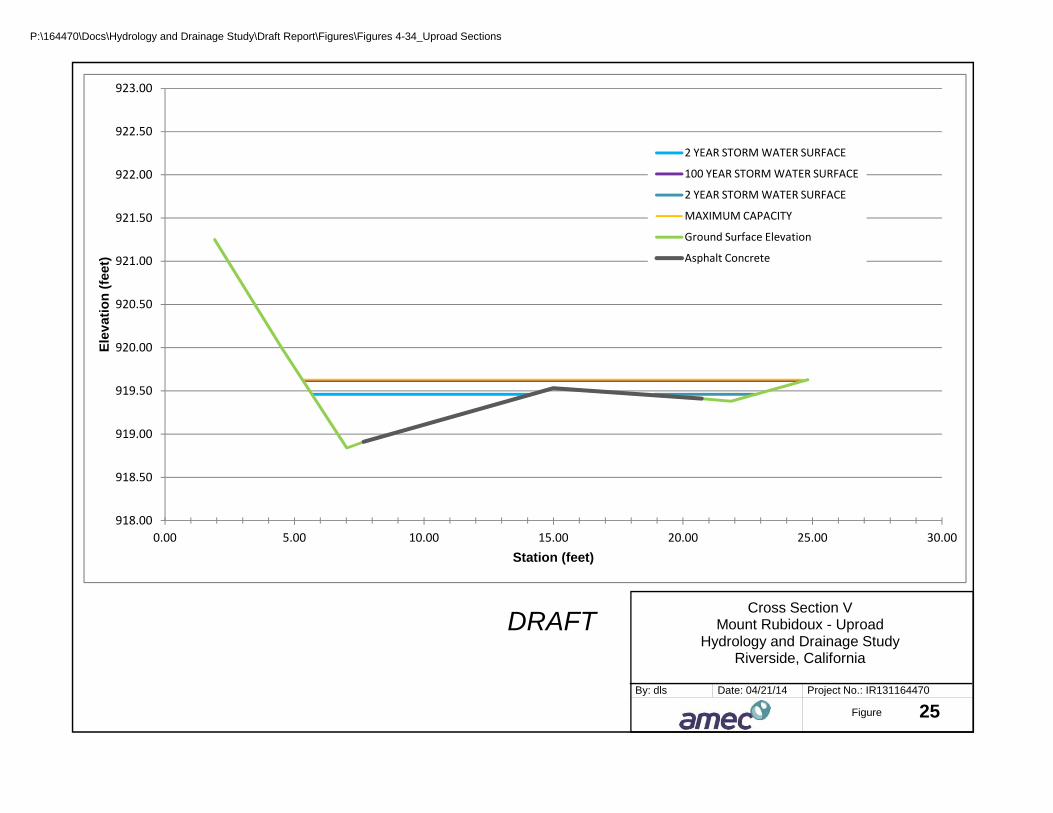
P:\164470\Docs\Hydrology and Drainage Study\Draft Report\Figures\Figures 4-34_Uproad Sections
919.50
920.00
920.50
921.00
921.50
922.00
922.50
923.00E
lev
atio
n (
feet
)
2 YEAR STORM WATER SURFACE
100 YEAR STORM WATER SURFACE
2 YEAR STORM WATER SURFACE
MAXIMUM CAPACITY
Ground Surface Elevation
Asphalt Concrete
Cross Section VMount Rubidoux - Uproad
Hydrology and Drainage StudyRiverside, California
Project No.: IR131164470
25Date: 04/21/14By: dls
Figure
918.00
918.50
919.00
0.00 5.00 10.00 15.00 20.00 25.00 30.00Station (feet)
DRAFT
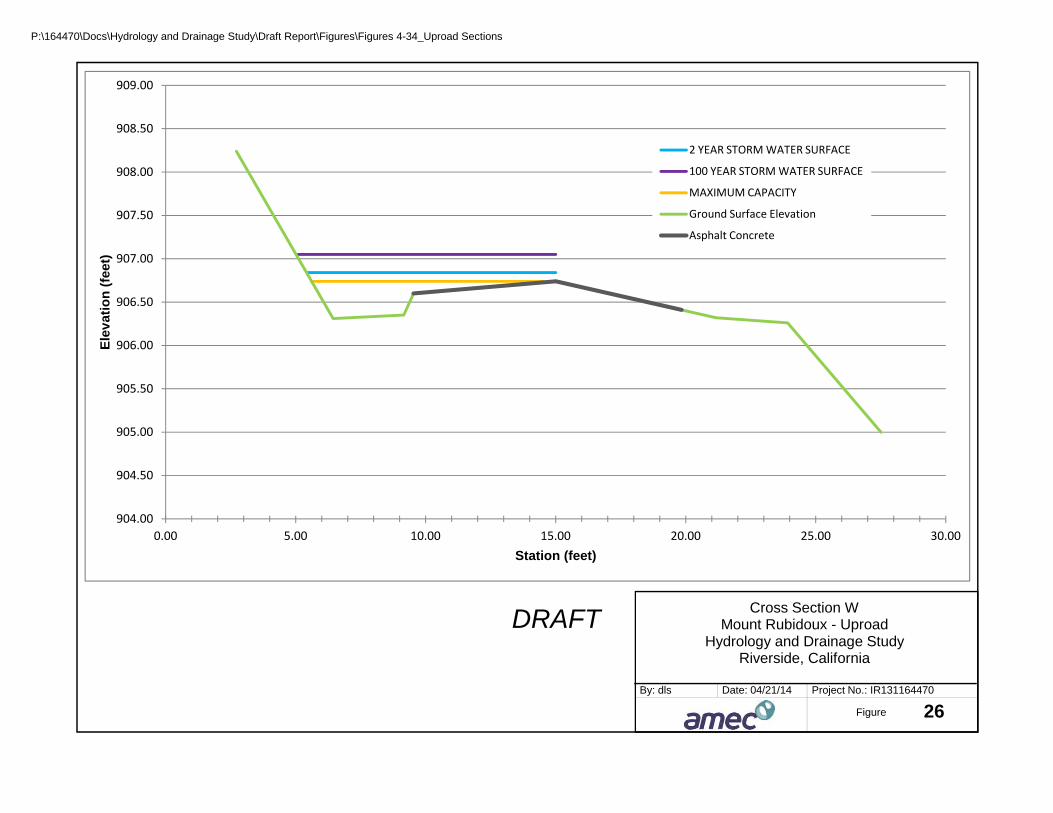
P:\164470\Docs\Hydrology and Drainage Study\Draft Report\Figures\Figures 4-34_Uproad Sections
905.50
906.00
906.50
907.00
907.50
908.00
908.50
909.00E
lev
atio
n (
feet
)
2 YEAR STORM WATER SURFACE
100 YEAR STORM WATER SURFACE
MAXIMUM CAPACITY
Ground Surface Elevation
Asphalt Concrete
Cross Section WMount Rubidoux - Uproad
Hydrology and Drainage StudyRiverside, California
Project No.: IR131164470
26Date: 04/21/14By: dls
Figure
904.00
904.50
905.00
0.00 5.00 10.00 15.00 20.00 25.00 30.00Station (feet)
DRAFT
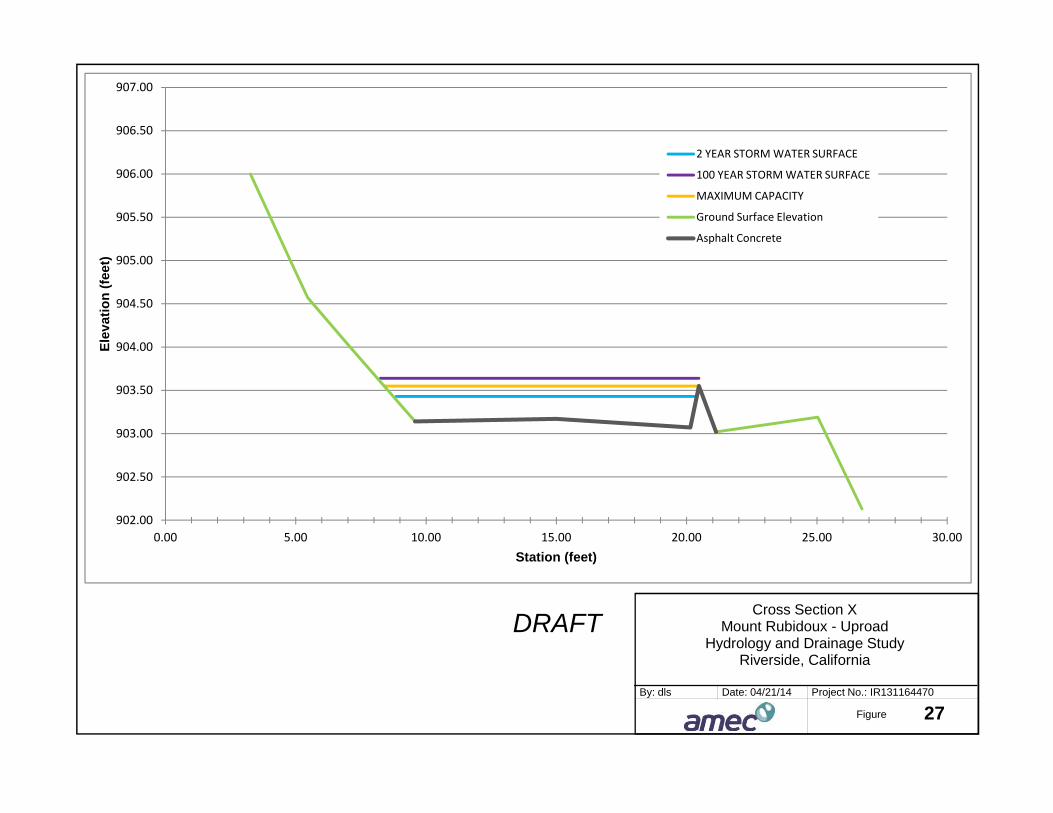
903.50
904.00
904.50
905.00
905.50
906.00
906.50
907.00E
lev
atio
n (
feet
)
2 YEAR STORM WATER SURFACE
100 YEAR STORM WATER SURFACE
MAXIMUM CAPACITY
Ground Surface Elevation
Asphalt Concrete
Cross Section XMount Rubidoux - Uproad
Hydrology and Drainage StudyRiverside, California
Project No.: IR131164470
27Date: 04/21/14By: dls
Figure
902.00
902.50
903.00
0.00 5.00 10.00 15.00 20.00 25.00 30.00Station (feet)
DRAFT
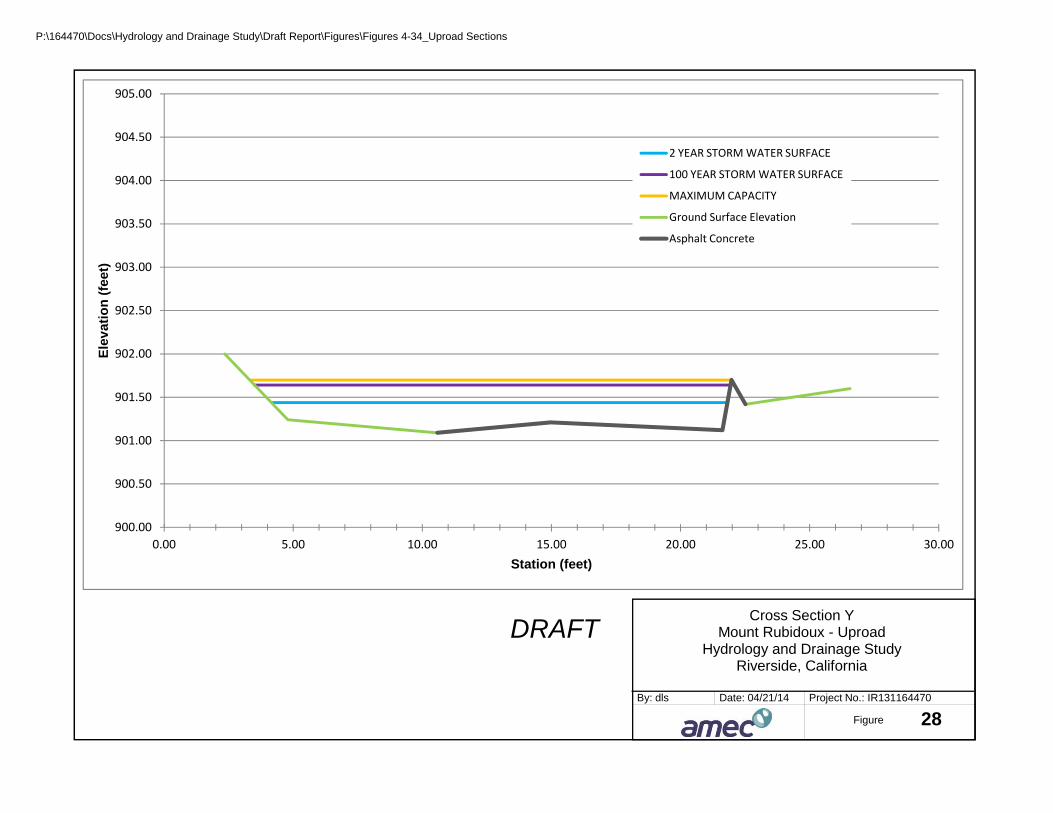
P:\164470\Docs\Hydrology and Drainage Study\Draft Report\Figures\Figures 4-34_Uproad Sections
901.50
902.00
902.50
903.00
903.50
904.00
904.50
905.00E
lev
atio
n (
feet
)
2 YEAR STORM WATER SURFACE
100 YEAR STORM WATER SURFACE
MAXIMUM CAPACITY
Ground Surface Elevation
Asphalt Concrete
Cross Section YMount Rubidoux - Uproad
Hydrology and Drainage StudyRiverside, California
Project No.: IR131164470
28Date: 04/21/14By: dls
Figure
900.00
900.50
901.00
0.00 5.00 10.00 15.00 20.00 25.00 30.00Station (feet)
DRAFT
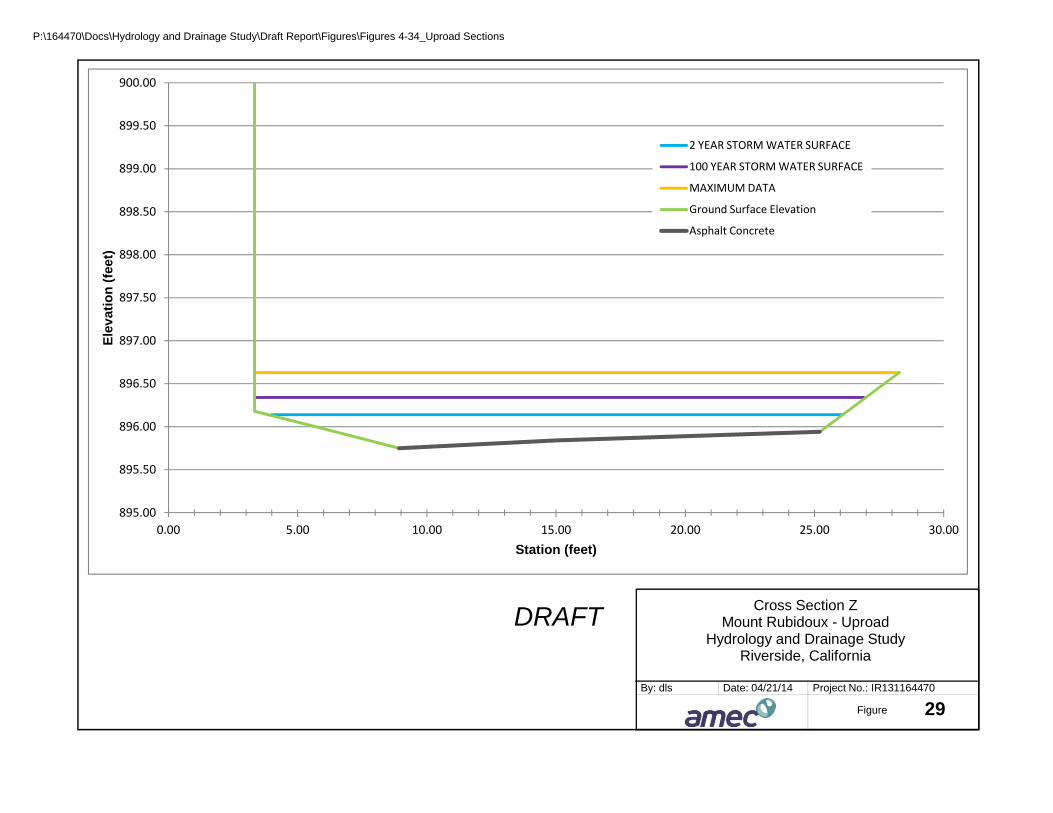
P:\164470\Docs\Hydrology and Drainage Study\Draft Report\Figures\Figures 4-34_Uproad Sections
896 00
896.50
897.00
897.50
898.00
898.50
899.00
899.50
900.00
Ele
vat
ion
(fe
et)
2 YEAR STORM WATER SURFACE
100 YEAR STORM WATER SURFACE
MAXIMUM DATA
Ground Surface Elevation
Asphalt Concrete
Cross Section ZMount Rubidoux - Uproad
Hydrology and Drainage StudyRiverside, California
Project No.: IR131164470
29Date: 04/21/14By: dls
Figure
895.00
895.50
896.00
0.00 5.00 10.00 15.00 20.00 25.00 30.00Station (feet)
DRAFT

P:\164470\Docs\Hydrology and Drainage Study\Draft Report\Figures\Figures 4-34_Uproad Sections
976 00
976.50
977.00
977.50
978.00
978.50
979.00
979.50
980.00E
lev
atio
n (
feet
)
2 YEAR STORM WATER SURFACE
100 YEAR STORM WATER SURFACE
MAXIMUM CAPACITY
Ground Surface Elevation
Asphalt Concrete
Cross Section AAMount Rubidoux - Uproad
Hydrology and Drainage StudyRiverside, California
Project No.: IR131164470
30Date: 04/21/14By: dls
Figure
975.00
975.50
976.00
0.00 5.00 10.00 15.00 20.00 25.00 30.00Station (feet)
DRAFT
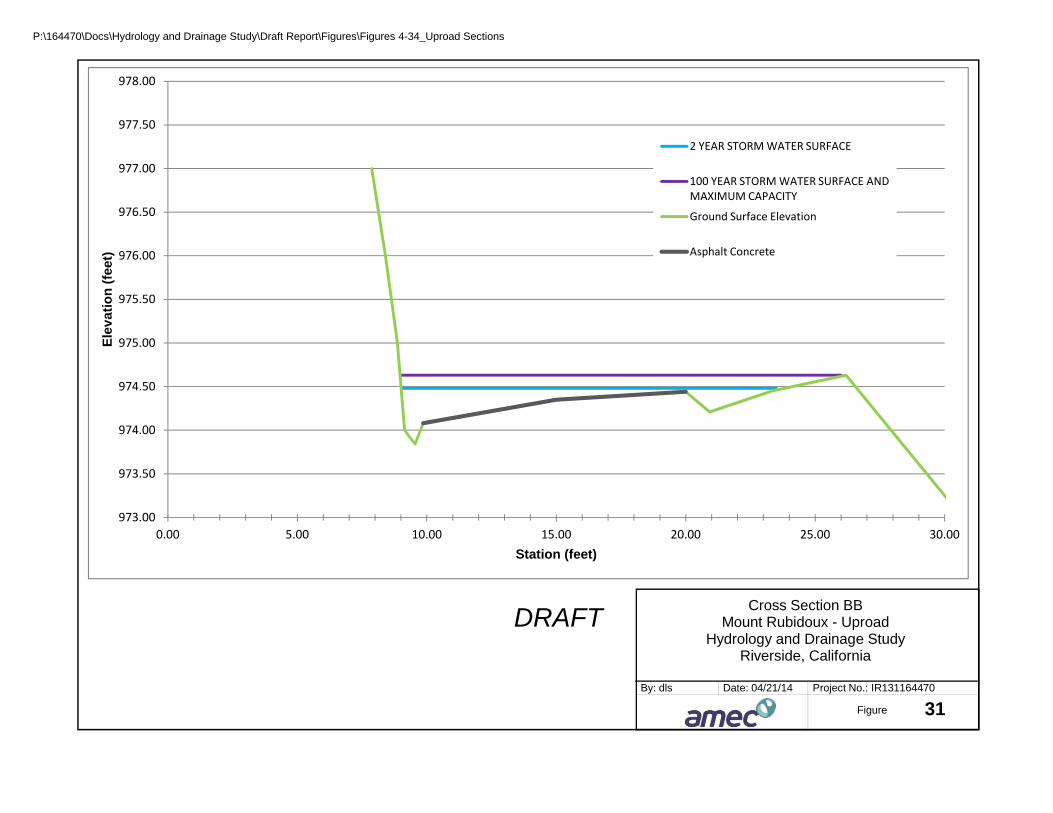
P:\164470\Docs\Hydrology and Drainage Study\Draft Report\Figures\Figures 4-34_Uproad Sections
974 00
974.50
975.00
975.50
976.00
976.50
977.00
977.50
978.00
Ele
vat
ion
(fe
et)
2 YEAR STORM WATER SURFACE
100 YEAR STORM WATER SURFACE AND MAXIMUM CAPACITY
Ground Surface Elevation
Asphalt Concrete
Cross Section BBMount Rubidoux - Uproad
Hydrology and Drainage StudyRiverside, California
Project No.: IR131164470
31Date: 04/21/14By: dls
Figure
973.00
973.50
974.00
0.00 5.00 10.00 15.00 20.00 25.00 30.00Station (feet)
DRAFT

P:\164470\Docs\Hydrology and Drainage Study\Draft Report\Figures\Figures 4-34_Uproad Sections
958 00
958.50
959.00
959.50
960.00
960.50
961.00
961.50
962.00
Ele
vat
ion
(fe
et)
2 YEAR STORM WATER SURFACE
100 YEAR STORM WATER SURFACE
MAXIMUM CAPACITY
Ground Surface Elevation
Asphalt Concrete
Cross Section CCMount Rubidoux - Uproad
Hydrology and Drainage StudyRiverside, California
Project No.: IR131164470
32Date: 04/21/14By: dls
Figure
957.00
957.50
958.00
0.00 5.00 10.00 15.00 20.00 25.00 30.00Station (feet)
DRAFT

P:\164470\Docs\Hydrology and Drainage Study\Draft Report\Figures\Figures 4-34_Uproad Sections
957 00
957.50
958.00
958.50
959.00
959.50
960.00
960.50
961.00
Ele
vat
ion
(fe
et)
2 YEAR STORM WATER SURFACE
100 YEAR STORM WATER SURFACE
MAXIMUM CAPACITY
Ground Surface Elevation
Asphalt Concrete
Cross Section DDMount Rubidoux - Uproad
Hydrology and Drainage StudyRiverside, California
Project No.: IR131164470
33Date: 04/21/14By: dls
Figure
956.00
956.50
957.00
0.00 5.00 10.00 15.00 20.00 25.00 30.00Station (feet)
DRAFT

P:\164470\Docs\Hydrology and Drainage Study\Draft Report\Figures\Figures 4-34_Uproad Sections
954 00
954.50
955.00
955.50
956.00
956.50
957.00
957.50
958.00E
lev
atio
n (
feet
)
2 YEAR STORM WATER SURFACE
100 YEAR STORM WATER SURFACE
MAXIMUM CAPACITY
Ground Surface Elevation
Asphalt Concrete
Cross Section EEMount Rubidoux - Uproad
Hydrology and Drainage StudyRiverside, California
Project No.: IR131164470
34Date: 04/21/14By: dls
Figure
953.00
953.50
954.00
0.00 5.00 10.00 15.00 20.00 25.00 30.00Station (feet)
DRAFT
Top Related