


Languages
Pages
Legal


Hydraulic FanDrive Systems
Design Guidelines

2 520L0926 • Rev AD • June 2010
© 2010 Sauer-Danfoss. All rights reserved.
Sauer-Danfoss accepts no responsibility for possible errors in catalogs, brochures and other printed material. Sauer-Danfoss reserves the right to alter its products without prior notice. This also applies to products already ordered provided that such alterations aren’t in conflict with agreed specifications. All trademarks in this material are properties of their respective owners. Sauer-Danfoss and the Sauer-Danfoss logotype are
trademarks of the Sauer-Danfoss Group. Detroit Diesel®, Cummins®, and Caterpillar® trademarks are properties
of their respective owners.
Front cover illustrations: F101 399, F101 394, F101 401, F101 400, P104 370
Table of RevisionsDate Page Changed Rev.
June 2010 46-56 Add Appendix G and Appendix H AD
February 2010 last Fix Osaka address AC
March 2007 minor edits - pages 43 and 44 BA
July 2006 - First edition A-0
HistoRy of Revisions
Hydraulic Fan Drive SystemsDesign GuidelinesRevisions

3520L0926 • Rev AD • June 2010
Hydraulic Fan Drive SystemsDesign GuidelinesContents
system Design PaRameteRs
fan DRive ComPonents
fan DRive Design
intRoDuCtion Abstract ..............................................................................................................................................................5Overview ...........................................................................................................................................................5Principles of operation .................................................................................................................................5Power savings .................................................................................................................................................6Modulation preferred over on/off fan speed control ........................................................................6
Design considerations ..................................................................................................................................7
Fan drive element selection .......................................................................................................................8Estimate of maximum input torque to the pump ..............................................................................9
Sizing ............................................................................................................................................................... 10Sizing equations .......................................................................................................................................... 12
Pumps ........................................................................................................................................................ 12Motors ........................................................................................................................................................ 12Variables .................................................................................................................................................... 12
Axial flow fan power formula .................................................................................................................. 13Power to system parameter relationships .................................................................................... 13
Engine details ............................................................................................................................................... 14Power steering.............................................................................................................................................. 14Fan information ............................................................................................................................................ 14Control preference ...................................................................................................................................... 15Reservoir ......................................................................................................................................................... 15Fluid .................................................................................................................................................................. 15Filtration.......................................................................................................................................................... 15Pump drive .................................................................................................................................................... 16
Pump drive data form .......................................................................................................................... 16Technical features ....................................................................................................................................... 17Maximum pump speed ............................................................................................................................. 17Minimum pump and motor speed ....................................................................................................... 17Motor starting pressure ............................................................................................................................ 17Motor free run pressure ............................................................................................................................ 18Input torque ratings ................................................................................................................................... 18Pump drive conditions .............................................................................................................................. 18Tapered shaft and hub connections ..................................................................................................... 19Pump suction ................................................................................................................................................ 19Case drain pressure .................................................................................................................................... 19Filtration.......................................................................................................................................................... 20Operating temperatures ........................................................................................................................... 20Fluids ................................................................................................................................................................ 20Mounting ........................................................................................................................................................ 20Axial thrust motors ..................................................................................................................................... 21Piping ............................................................................................................................................................... 21Reservoir ......................................................................................................................................................... 22Cavitation and aeration damage ........................................................................................................... 23Cooling ............................................................................................................................................................ 23Pressure protection and ratings ............................................................................................................. 23Bearing life expectancy ............................................................................................................................. 23

4 520L0926 • Rev AD • June 2010
Hydraulic Fan Drive SystemsDesign GuidelinesContents
gLossaRy
aPPenDix a-fan PeRfoRmanCe
aPPenDix B-fan DRive sizing equations
aPPenDix C-fan DRive sizing equations, using vaRiaBLe DisPLaCement motoRs
aPPenDix D-PRessuRe CHange Due to tRansient fLow in a Passage
aPPenDix e-infLuenCe of ByPass vaLve PRessuRe DRoP
aPPenDix f1-infLuenCe of temPeRatuRe, PRessuRe anD ReLative HumiDity on sPeCifiC weigHt of aiR
aPPenDix f2-infLuenCe of aLtituDe on atmosPHeRiC PRessuRe
Terminology .................................................................................................................................................. 24
Fans .................................................................................................................................................................. 25Fan performance ......................................................................................................................................... 25Axial thrust ..................................................................................................................................................... 26Fan laws........................................................................................................................................................... 27
Fan drive sizing equations and derivations ....................................................................................... 32Hydraulic system comparisons ............................................................................................................... 34
Hydraulic systems with 2 position, variable displacement motors, equations and derivations ..................................................................................................................................................... 36Spreadsheet to calculate optimum minimum displacement for two position variable motor ............................................................................................................................................................... 38
Pressure change due to transient flow in a passage, equations and derivations ................ 39
Influence of bypass valve pressure drop on fan trim speed, in applications using fixed displacement pumps, equations and derivations ........................................................................... 41
Influence of temperature, pressure and relative humidity on specific weight of air .......... 45
Influence of altitude on atmospheric pressure ............................................................................... 46
Influence of generic altitude on atmospheric pressure ................................................................ 47
Influence of reversed fan rotation on system performance ........................................................ 48
aPPenDix g-infLuenCe of ReveRseD fan PeRfoRmanCe on system PeRfoRmanCe
aPPenDix H-system ConsiDeRations foR H1 fan DRives witH ReveRseD fan Rotation

5520L0926 • Rev AD • June 2010
Hydraulic Fan Drive SystemsDesign GuidelinesIntroduction
Fan drive system sizing relies heavily on the input received from the customer. All system sizing calculations are based on the required fan power @ trim speed data given to the hydraulic system design engineer. This data is a statement of the fan drive motor shaft power that is required to turn a fan at the required speed to push, or pull, a required volume of air across coolers/radiators. The usual sequence of events is:
• The engine manufacturer advises the customer, or cooling system designer, of the heat dissipation required from the cooling system, charge air cooler etc. This information is combined with the heat rejection data for any accessories and work functions on the machine (such as : transmission cooler, hydraulic cooler, and A/C condenser) to determine the maximum heat rejection profile for the system.
• The customer’s cooling pack manufacturer uses this data to size the cooling package and generally recommends a fan to suit this need, providing the rated fan power, rated fan speed, and the fan speed required to satisfy the cooling needs of the system.
• With this information, knowing the minimum engine speed at which maximum fan speed needs to occur, the hydraulic system designer can size the hydraulic fan drive system.
aBstRaCt
For a detailed definition of terms in this document,
refer to Terminology on page 24.
oveRview One goal of this document is to provide the reader with the equations and formulae needed to size a hydraulic fan drive, given that they are provided with the following information:
• Rated fan power. • Rated fan speed. • Fan speed required to meet the maximum cooling needs of the cooling system.• Engine speed at which maximum system cooling is required.
This document also provides an explanation of the terms and factors used in the derivation of the sizing equations. In addition, the reader is provided with recommendations of simple system design solutions that will help provide a viable system with satisfactory performance.
2050
200
400
600
800
1000
1200
1400
1600
1800
2000
170(F) 175 180 185 190 195 200
Fan
sp
eed
(rp
m)
Engine temperature9580(C) 85 90
P101
276
E
Fan speed vs engine temperaturePRinCiPLes of oPeRation
The vehicle’s cooling fan is driven by a hydraulic motor, which in turn, is driven by a hydraulic pump. The hydraulic pump can be driven directly off of the engine supplied PTO (Power Take Off ), or with a belt drive. A thermostatically, or electrically, controlled proportional pressure control valve modulates the fan speed depending on a temperature reading. In a cold condition, the fan idles with very low power consumption. During the hot condition, the maximum fan speed is controlled by a pressure control valve, which adjusts the fan speed to meet the cooling needs of the total system. Every system has a temperature, which allows for the most efficient performance. The thermovalve, or an electronic control system, attempts to maintain the system at the optimum design temperature, which the system integrator selects during the design phase of the project.

6 520L0926 • Rev AD • June 2010
Hydraulic Fan Drive SystemsDesign GuidelinesIntroduction
To optimize the cooling system operation in various environmental conditions and to minimize parasitic losses, the Sauer-Danfoss modulating fan drive system enables the fan cycle to be designed to specific heat rejection requirements for a wide range of environmental conditions. Vehicle manufacturers have complete control of the fan cycle by choosing the appropriate temperature limit.
The Sauer-Danfoss modulating fan drive system remains at idle speed until conditions require increased fan speeds. By regulating the pressure drop across the hydraulic motor, modulation of fan speed occurs above this point and over-cooling is prevented.
moDuLation PRefeRReD oveR on/off fan sPeeD ContRoL
PoweR savings In the fan off condition, the fan may idle at approximately 30% of rated speed, but it will only consume about 3% of rated power. The Sauer-Danfoss modulating fan drive system allows the system designer to size the fan for the engine speed at which maximum heat rejection occurs. The fan speed will remain essentially constant at all higher engine speeds. Consequently, the fan will not require excessive parasitic losses as engine speed increases. In systems where the engine speed at maximum heat rejection is 80% of the governed speed, the reduction in parasitic power loss due to over-speeding a mechanically driven fan can be as high as 95%.
Fan speed modulation occurs over a temperature range chosen by the system’s designer. This eliminates the sudden changes in speed that cause dramatic changes in noise levels. Similarly, large accelerations of components, which may limit the reliability for long-term operation, are eliminated. Modulation also allows intermediate levels of cooling without unnecessary cycling of the fan between minimum and maximum speed. The calibration temperature, operating range, and ramp times can be varied independently by the system designer to achieve the desired level of temperature control.
PRinCiPLes of oPeRation (continued)

7520L0926 • Rev AD • June 2010
Hydraulic Fan Drive SystemsDesign Guidelines
Design ConsiDeRations
• Parasitic losses from excessive fan speed are high. Power consumed by a fan is proportional to fan speed cubed (speed3).
• Heat rejection to the atmosphere does not increase linearly with engine speed.
• Overheating and/or over cooling the system will result in loss of efficiency and productivity.
• Overheating, and/or over cooling the engine can result in increased emissions to the environment.
• The proportion of operating time during which full fan speed (maximum fan power) is needed is typically about 20% and can be as low as 5%.
• Mounting the fan directly to the engine requires large fan blade tip clearances due to normal engine vibration and movement. This leads to loss of fan performance. Mounting the fan directly to a hydraulic motor can minimize tip clearance and boost fan performance significantly.
Hydraulic fan drive system designers select components for unique combinations of engine, fan, and application parameters. Do not exchange/change fan system components indiscriminately. Design factors which determine the selection of the fan drive system for a particular engine, or vehicle, include: • Engine set point and maximum heat rejection • Pump rotation • Pump input torque limitations • Maximum applied pressure and speed limits for the individual components • Fit-up and available installation space • Pump support structure requirements for individual engine/compressor combinations • Specific engine and accessory temperature control limits
Fan drive design
Fan drive element selectionfan drive element Design parameter Design flexibility Design champion
Engine & accessories Power, speed, total heat rejection and duty cycle Yes OEM
PTO & Gearing Engine to pump gear ratio Sometimes OEM’s choice of engine supplier
Pump(s) Displacement, pressure, speed, fixed pump or variable pump, mounting & drive line
Yes S-D technical representative, & OEM
Fan drive control Sensor input(s), control output, number of control elements Yes S-D technical representative, & OEM
Motor(s) Displacement, pressure, speed, fixed motor or variable motor, mounting & coupling
Yes S-D technical representative, & OEM
Fan(s) Fan rated power @ rated speed, fan diameter, number of blades, blade pitch, proximity of blades to heat exchanger, direction of air flow
Yes OEM & cooling specialists
Shroud(s) Type of shroud (flat plate, short duct, venturi), blade axial position in shroud, tip clearance
Yes OEM & cooling specialists
Air flow stream(s) Air flow rate & static pressure across heat exchanger(s), maximum ambient air temperature, minimum atmospheric pressure, hot air recirculation, baffles, louvres & obstructions
Sometimes OEM & cooling specialists
Heat exchangers Physical size, height & width, number of heat exchangers in air flow stream, side-by-side, axial stack, materials selected, construction, number and types of tubes, tube configuration, fin density
Yes OEM & cooling specialists

8 520L0926 • Rev AD • June 2010
Engine speed (rpm)
Fan
Spee
d(r
pm
)
Engine set point
800
1000
1200
1400
1600
1800
2000
2200
600 800 1000 1200 1400 1600 1800 2000 2200
Fa1
d
nspee
Fa1 spe d
n
e , hot oil
Max.en
gin
eh
e at r e je c t i on
spe e d
P106 107E
(Engine Trim Speed)
Hydraulic Fan Drive SystemsDesign Guidelines
Fan speed vs engine speed
Optimizing the size of fan drive elements depends on selecting the correct components and gear ratios. By matching these components to the fan power requirements, the required unit sizes can be quickly determined. The pump and motor displacements, input gear ratios, engine set point, and pressure limits can be adjusted to provide some optimization of component size. Along with the sizing equations presented in this article, a Sauer-Danfoss fan drive sizing computer tool is available to assist with sizing the hydraulic components.
Many modulating hydraulic fan drives rely on dedicated pumps to provide flow to the fan circuit for optimum sizing. Other circuits are available that provide additional flow for power assisted steering and other accessory systems. In these, and many other circuits, the sizing equations and fan drive sizing tool may still be used to select the required components. Note that the design limits for associated design elements are not identified in this article. They may be reviewed by referring to the Sauer-Danfoss technical information for the components being considered. Machine designers should verify that all design parameters are met for all drive line components.
While the methods described in this article may be useful, they do not represent the only approach to sizing hydraulic components. Contact your Sauer-Danfoss representative if questions of interpretation exist.
Collect the application sizing parameters as identified on pages 14, 15, and 16 of this document. Pay particular attention to the minimum engine speed at which maximum heat rejection to the atmosphere is required. When sizing the pump for the application, the system designer should ensure that the engine set point under hot oil condition is less than the engine speed at which maximum heat rejection occurs. Failure to do this can result in a condition where the cooling system may not provide adequate cooling when maximum work loading and maximum ambient conditions occur simultaneously.
sample graph, performance prediction will vary depending on choice of input parameters.
Fan drive components
fan DRive eLement seLeCtion

9520L0926 • Rev AD • June 2010
Hydraulic Fan Drive SystemsDesign GuidelinesFan drive components
estimate of maximum inPut toRque to tHe PumP
English system
SI system
One of the first things that the systems designer should consider is whether the maximum pump torque needed will exceed the input torque limitation of the pump drive. One way to calculate this is to divide the fan power requirement by an estimate of the hydraulic system’s overall efficiency and then determine the input torque requirement at the pump speed that is equivalent to the maximum heat rejection speed of the engine.
fan DRive eLement seLeCtion (continued)
Pump torque, Tp(lbf•in) ≈ (lbf • in)
Pfhp 0.7 •
(Ne • R)
(63025)( ) ] [
Pump torque, Tp(N•m) ≈ (N•m)
PfkW 0.7 •
(Ne • R)
(9549.0)( ) ] [
Compare the estimated maximum input torque to the maximum available input torque at the pump drive; this will determine the design margin that is available to the designer. The hydraulic system designer should consult with the vehicle system’s designer, and/or the prime mover’s technical support staff for assistance, if required.
Where: PfkW
(Ne • R) R
= Max power, kW [hp]= Pump speed, rpm= Pump/Engine ratio
Tp(lbf•in)
8.8507
( ) Pump torque, Tp(N•m) = (N•m)
Tp(lbf•in)
12.0
( ) Pump torque, Tp(lbf•ft)= (lbf•ft)
Tp(N•m) 0.7376 •Pump torque, Tp(lbf•ft) = (lbf•ft)
Tp(N•m) 8.8507 •Pump torque, Tp(lbf•in) = (lbf•in)
Converting terms

10 520L0926 • Rev AD • June 2010
Hydraulic Fan Drive SystemsDesign Guidelines
sizing Fan drive system sizing relies heavily on the input received from the customer. All system sizing calculations are based on the required fan power @ trim speed data given to the hydraulic system design engineer. This data is a statement of the fan drive motor shaft power that is required to turn a fan at the required speed to push, or pull, a required volume of air across coolers/radiators. The usual sequence of events is:
• The engine manufacturer advises the customer, or cooling system designer, of the heat dissipation required from the cooling system, charge air cooler etc. This information is combined with the heat rejection data for any accessories and work functions on the machine (such as : transmission cooler, hydraulic cooler, and A/C condenser) to determine the maximum heat rejection profile for the system.
• The customer’s cooling pack manufacturer will then use this data to size the cooling package and will generally recommend a fan to suit this need, providing the rated fan power, rated fan speed, and the fan speed required to satisfy the cooling needs of the system.
• With this information, knowing the minimum engine speed at which maximum fan speed needs to occur, the hydraulic system designer can size the hydraulic fan drive system.
To completely understand any fan drive system is to understand the fan load characteristics. Fans are unique in that the power to drive the fan changes with the cube of the fan speed, as follows:
N1 ( )
Pf=k•(Nf)3
Pf1 Pf2
= N2
3
Where: Pf = fan power (kW, hp) N = fan speed (rpm) 1,2 = subscripts for two different conditions k = Fan power coefficient
fan power is defined as the power required to drive the shaft connected to the fan and is equal to the output power of the motor. When a given fan speed is doubled; the required power to drive the fan increases by a factor of 8.
P106 108E
Fan
po
wer
(kW
)
Fan speed (RPM)
40
35
30
25
20
15
10
5
00 500 1000 1500 2000 2500
Fan power requirements (Example)Fan rating = 22 kW @ 2000 rpm
System design parameters

11520L0926 • Rev AD • June 2010
Hydraulic Fan Drive SystemsDesign GuidelinesSystem design parameters
Since fan horsepower is a function of both pressure and flow (fan speed), it follows that the relationship between fan speed and system pressure is
sizing (continued)
N1 ( ) = N2
2 ∆P1
∆P2
Where: ∆P = delta pressure across the hydraulic motor (bar, psid)
An accurate value of the fan rating is critical to the correct selection of components and their settings.
Although the cubic relationship between fan power and fan speed has been consistently verified experimentally, it is still an approximation of the fan behavior. Therefore, to avoid significant errors in predicting power requirements, the fan power rating should be taken at a speed representative of typical fan operation.
For example, for a system in which the fan usually operates in a speed range of 1800-2200 rpm, a fan rating specified at 2000 rpm will yield more accurate results than a rating specified at, say, 1500 or 2500 rpm.
Fan curves provided by the fan manufacturer are often developed under ideal conditions. It is unlikely that a fan will exhibit exactly the same performance in an actual application (because of: shrouding, heat exchange airflow characteristics, and air density). Only through test data taken on the actual vehicle can a fan’s performance characteristics be accurately determined. The curve below illustrates the differences between predicted performance and actual performance of a fan installed in a vehicle. The system designer/integrator is encouraged to confirm their performance predictions via test over the entire operating speed range of the engine, and to refine their prediction model with a revised fan power coefficient when they rerun the sizing calculations.
P106 109E
25002000150010005000
0
500
1000
1500
2000
2500
Syst
em p
ress
ure
(psi
)
Syst
em p
ress
ure
(bar
)
Fan speed min-1(rpm)
160 bar2300 psi
Theor
s
etical sy
tem
press
ure
Experimental sy
stem
press
uer
30
60
90
120
150
Fan power requirements (example)Fan rating = 22 kW @ 2000 rpm

12 520L0926 • Rev AD • June 2010
Hydraulic Fan Drive SystemsDesign GuidelinesSystem design parameters
Based on SI units
Output flow Q = (l/min)
Input torque M = (N•m)
Input power P = (kW)
motors
Based on SI units
Output torque M = (N•m)
Output power P = (kW)
Based on English units
Output flow Q = (US gal/min)
Input torque M = (lbf•in)
Input power P = (hp)
Based on English units
Output torque M = (lbf•in)
Output power P = (hp)
SI units [English units]
Vg = Displacement per revolution cm3/rev [in3/rev]pO = Outlet pressure bar [psi]pi = Inlet pressure bar [psi]∆p = pO - pi (system pressure) bar [psi]n = Speed min-1 (rpm)ηv = Volumetric efficiencyηm = Mechanical efficiencyηt = Overall efficiency (ηv • ηm)
sizing equations
variables
Vg • n • ηv
1000
Vg • ∆p
20 • π • ηm
Vg• n• ∆p600 000 • ηm
Vg • n • ηv
231
Vg • ∆p
2 • π • ηm
Vg • ∆p • ηm
20 • π
Q • ∆p • ηt 600
Vg • ∆p • ηm
2 • π
Q • ∆p • ηt
1714
Pumps
SI unit formulas are based on cm, bar, N, N•m, W. English formulas are based on in, psi, lbf•in, hp.
Vg• n• ∆p396 000 • ηm

13520L0926 • Rev AD • June 2010
Hydraulic Fan Drive SystemsDesign GuidelinesSystem design parameters
axiaL fLow fan PoweR foRmuLa
Power to system parameter relationships
(N2)3 • (D2)5 • ν2=
(N1)3 • (D1)5 • ν1
Pf2
Pf1
Pf1 = Power of fan at known condition #1Pf2 = Power of fan at condition #2N1 = Fan speed at condition #1N2 = Fan speed at condition #2D1 = Fan diameter at condition #1D2 = Fan diameter at condition #2ν1 = Specific weight of air at condition #1ν2 = Specific weight of air at condition #2r 1 = Density of air at condition #1r 2 = Density of air at condition #2∆P1 = Hydraulic and/or Static Pressure at condition #1∆P2 = Hydraulic and/or Static Pressure at condition #2V1 = Flow rate of air at condition #1V2 = Flow rate of air at condition #2
= Pf2
Pf1
r 2
r 1 • (
N2
N1
)
3
• (
D2
D1
)
5ν2
ν1
= • (
N2
N1
)
3
• (
D2
D1
)
5
V 2 (
D2
D1
)
3
• (
N2
N1
)
= ∆P2
∆P1
r 2
r 1 • (
D2
D1
)
2
• (
N2
N1
)
2ν2
ν1
= • (
D2
D1
)
2
• (
N2
N1
)
2
=
•
V 1
•
•
•

14 520L0926 • Rev AD • June 2010
Hydraulic Fan Drive SystemsDesign GuidelinesSystem design parameters
engine DetaiLs
PoweR steeRing
fan infoRmation
CLOCKWISE
COUNTERCLOCK WIS
E
P106 110E
Model or Series
Belt Drive (engine to pump)
Clockwise, Right handCounterclockwise, Anti-clockwise, Left hand
Manufacturer
Pump Drive
Pump Rotation
Speeds
Engine PTO Ratio :1
Low IdleGovernedHigh Idle
RPM (rated)RPM (rated)RPM (max speed)
Input torquelimit:
P104 376E
US gal/min
bar(maximum)
Controlled Flow Requirement
Steering Pressure psi
l/min
(if applicable)
Clockwise
Counterclockwise
P101 344E
Model or Series
mm
Manufacturer
Fan Diameter in
At speedkWFan Input Power HP rpm
Fan Rotation
(viewed on motor shaft, see illustration)ClockwiseCounterclockwise
Fan Trim Speed
(viewed on motor shaft, see illustration)rpm
Set Point at Fan Trim Speed
(engine speed where max heat load occurs)rpm
Coolant Temperature at Fan Trim Speed
(coolant temp where max fan speed is required)°F °C
Note: To properly size and specify a fan drive system, fan power requirements must be stated as accurately as possible. Fan power requirementscan be determined from fan curves supplied by the manufacturer. Radiator and cooler manufacturers will supply air flow requirements based on heat loads. Air flow information must include accurate air flow and static pressure to determine correct fan power requirements.

15520L0926 • Rev AD • June 2010
Hydraulic Fan Drive SystemsDesign GuidelinesSystem design parameters
P104 377E
Single Input
Wax Capsule Electro-Hydraulic Modulating Electro-Hydraulic ON/OFF
Multiple Inputs
ThermoValve
P104 378E
US galReservoir Capacity liter
P104 379E
at 40° C [104°F]
Hydraulic Fluid Type
Viscosity cSt
Maximum Fluid Temperature °F°C
SUS
at 100° C [212°F]
P104 380E
Inlet LineFilter Position
Pressure Line
(recommended)
Return Line
Filter Rating
Full FlowFilter Flow
Partial Flow
micron x ratio
Note: Do not locate the filter cartridge inside the reservoir. This reduces the reservoir capacity and reduces the dwell time (the time the oil spends in the resrevoir). It also increases the potential for damage to the hydraulic components due to aeration of the oil.
ContRoL PRefeRenCe
ReseRvoiR
fLuiD
fiLtRation

16 520L0926 • Rev AD • June 2010
Hydraulic Fan Drive SystemsDesign GuidelinesSystem design parameters
PumP DRive 90°
180° 0°
270°
InletPo rt
90°
180° 0°
270°
InletPort
P
dw
a
dw
a
Required angle α
Required angle α
P106 111E
Photo copy this page and send the completed form to your Sauer-Danfoss representative for assistance in applying pumps with belt or gear drive.
Pump displacement cc/rev
Rated system pressure bar ٱ psi ٱ
Relief valve setting bar ٱpsi ٱ
Pump shaft rotation left ٱ right ٱ
Pump minimum speed min-1
(rpm)
Pump maximum speed min-1
(rpm)
Drive gear pressure angle
degrees
Drive gear helix angle(gear drive only)
degrees
Belt type(belt drive only)
V ٱ Notch/Cog ٱ
Belt tension (belt drive only) P
N ٱ lbf ٱ
angular orientation ofgear or belt to inlet port
a degrees
Pitch diameter of gear or pulley dw
mm ٱ in ٱ
Distance from flange to center of gear or pulley
amm ٱ in ٱ
Application data
Pump drive data form

17520L0926 • Rev AD • June 2010
Hydraulic Fan Drive SystemsDesign GuidelinesSystem design parameters
minimum PumP anD motoR sPeeD
In this document, we introduce the equations that are used to size the components of a modulating fan drive system. In addition to these principles, there are several other factors to consider to ensure that the hydraulic system performs to expectations. Following are some considerations you are encouraged to address during the design phase.
Gear tooth surface speeds and centrifugal filling of the pumping chamber limit maximum pump speed. Unless otherwise specified, maximum rated pump speeds are based on operation at sea level with hydraulic fluids having a specific gravity of 0.9 and a viscosity of 120 SUS (25 cSt) at 122° F (50° C). Speed limits for a particular application depend on the absolute pressure and oil viscosity. Speed limits for individual products may be found in their respective technical information bulletins. Consult a Sauer-Danfoss representative for operation outside of these published limits. For pumps, the minimum recommended operating speed at 2500 Psi (170 bar) is 600 min-1(rpm). Volumetric efficiency limits minimum pump speed. If lower than recommended starting or operating speeds are required, contact a Sauer-Danfoss representative for assistance.
For motors, the minimum speeds listed in the technical bulletins are for continuous operation at rated pressure. Motors may be started from zero speed on fan drives, where torque will increase with speed. Repeated starts under highly loaded conditions are not recommended.
No-load motor start-up pressures may range from 220 to 725 psi (15 to 50 bar), depending on displacement. This property of the motor is dependent on motor design parameters, the CSF (Coefficient of Static Friction), and it is inversely proportional to motor displacement. For example: The starting torque for any given motor is largely dependent on the diameter of the gears and the CSF. Within any given frame size (Group 1, Group 2, or Group 3) the gear diameter is the same and the displacement is determined by changing the width (thickness) of the gears. Since torque is dependent on the product of pressure and displacement, and starting torque is essentially constant for any given frame size; starting pressure will be dependent on displacement, in an inverse relationship. To minimize starting pressure, select the smallest frame size for the required motor displacement.
Besides displacement, there are several factors which also effect motor starting pressure. They include: pressure rise rate (pressure gradient), temperature, fluid viscosity, motor return pressure (back pressure), fan inertia, pump flow rate, and piece-to-piece variation between motors.
teCHniCaL featuRes
maximum PumP sPeeD
motoR staRting PRessuRe

18 520L0926 • Rev AD • June 2010
Hydraulic Fan Drive SystemsDesign GuidelinesSystem design parameters
inPut toRque Ratings When applying pumps in multiple configurations, ensure the input torque limitations are met for each section and for cumulative sections. Refer to individual product technical information bulletins for specific product torque limits. Always ensure that any individual pump in a multiple unit does not exceed its respective torque rating.
CCautionTorques in excess of recommended values may cause premature input shaft, or unit, failure.
PumP DRive ConDitions
Most Sauer-Danfoss products are available with SAE and metric, standard spline, tapered key, or cylindrical keyed drive shafts for direct or indirect drive applications. An intermediate coupling is the preferred method for direct drives, thereby eliminating radial and axial loading. Direct Drive (or plug-in or rigid) spline drives can impose severe radial loads on the pump shaft when the mating spline is rigidly supported. Increased spline clearance does not alleviate this condition. The use of direct drive (plug-in, or rigid) spline drives is permissible providing that the concentricity between the mating spline and its pilot diameter are within 0.004 in (0.10 mm) TIR (Total Indicator Reading). Both concentricity and angular alignment of shafts are important to pump life. Misalignment can induce excessive side loads on bearings and seals, causing premature failure.
Overhung load drives (chain, belt, or gear) are permissible. Contact Sauer-Danfoss for assistance, especially for applications using tandem pumps. The allowable radial shaft loads are a function of the load magnitude, the load position, the load orientation, and the operating pressure of the hydraulic pump. All external shaft loads will have an effect on bearing life and may affect pump performance. In applications where external shaft loads cannot be avoided; optimizing the position, orientation, and magnitude of the radial load can minimize their influence on the pump. A tapered input shaft is recommended for applications where radial shaft loads are present. (Spline shafts are not recommended for belt or gear drive applications, the clearance between the mating splines will prevent accurate alignment of the drive elements and will contribute to excessive wear of the spline.) For belt drive applications, a spring loaded belt-tensioning device is recommended to avoid excessive radial loads on the input shaft.
free run pressure is the minimum delta pressure across the motor that is required to keep the motor turning when there is no cooling demand. Free run pressure is dependent on motor displacement and shaft speed.
If the delta pressure across the motor is allowed to fall below the free run pressure; the motor will stop, and it will be necessary for the motor to go through the starting condition (start-up procedure) when cooling is needed again. In most applications, it is desirable to initiate fan rotation when the engine starts and prevent the motor from stopping, while the engine is running.
motoR fRee Run PRessuRe

19520L0926 • Rev AD • June 2010
Hydraulic Fan Drive SystemsDesign GuidelinesSystem design parameters
PumP suCtion For maximum pump life, the inlet pressure should not drop below 0.8 bar absolute [6 in. Hg vac.] at the pump inlet port.
For cold start conditions, inlet pressure down to 0.6 bar absolute [12 in. Hg vac.] is acceptable for short durations. The possibility of damage due to fluid cavitation and aeration is proportional to decreases in inlet pressure. In addition, oil film lubrication may be disrupted by low inlet pressure. These factors, either singularly or combined, may contribute to a decrease in pump life. Multiple changes in either diameter or direction can have a significant effect on the resistance to flow in inlet passages and can result in a substantial increase in the effective length of the inlet line. For this reason, Sauer-Danfoss recommends that the inlet line contain a minimum number of adaptor fittings, tees, and elbows; as each are a source of additional restriction and, potentially, a source of leakage.
CCautionContinuous operation with inlet pressures below 0.8 bar absolute [6 in. Hg vac.] can cause premature unit failure. Ensure adequate flow/pressure head at the pump inlet at all times.
Case DRain PRessuRe Maximum pressure limitations for both case drain and inlet passages are available by consulting the appropriate technical information bulletin for the products being applied. Both line length and diameter influence the pressure drop of the fluid in these passages as it flows to/from the reservoir. In addition, both steady state flow velocity and transient conditions, which can accelerate the fluid in these passages, must be considered when determining their correct size. Of the two design parameters: line length and diameter, diameter has the most influence on the success of the design. Increasing line diameter can decrease both the steady state and the transient pressure drops exponentially. For additional information on steady state pressure drops in hydraulic passages, the reader is encouraged to consult any good text on basic hydraulic design. For additional information on transient pressure drops, refer to Appendix D, page 39.
Introducing additional flow from external sources into these return lines can also result in transient pressure pulses that may exceed the drain, or case pressure limits of these products. Sauer-Danfoss recommends that the bearing drain and case drain lines return directly to the reservoir and remain dedicated to their intended function without connecting them to additional flow sources.
taPeReD sHaft anD HuB ConneCtions
Tapered shaft/hub connections provide excellent control of both axial and radial position of the drive coupling or fan assembly. When using the tapered connection, additional effort should be used to insure that there is adequate axial clamping load between the hub and the shaft. The designer is encouraged to establish that there is:
• Adequate clearance under the bolt/nut to insure full axial load may be applied to the taper without bottoming out.
• Adequate clearance between the top of the key and the bottom of the keyway in the hub. Interference between the top of the key and the bottom of the keyway will prevent the hub from seating onto the taper of the shaft. This will compromise the ability of the shaft to transmit its full torque capacity, and may result in failure of the shaft.

20 520L0926 • Rev AD • June 2010
Hydraulic Fan Drive SystemsDesign GuidelinesSystem design parameters
fiLtRation To prevent premature wear, it is imperative that only clean fluid enters the pump and hydraulic circuit. A filter capable of controlling the fluid cleanliness to class 22/18/13 (per ISO 4406-1999) or better, under normal operating conditions, is recommended. Since the filter must be changed at regular intervals, the filter housing should be located in an accessible area. Appropriate filter change intervals may be determined by test or by gages indicating excessive pressure drop across the filter element. For additional technical information on hydraulic fluids and filtration refer to 520L0463 Hydraulic Fluids and Lubricants, Technical Information Bulletin.
oPeRating temPeRatuRes
With Buna seals and normal operating conditions, the system temperature should not exceed 82 °C [180 °F] except for short periods to 93 °C [200 °F]. With optional Viton elastomer, the system may be operated at continuous temperatures up to 107°C [225°F] without damage to the pump.
CCaution Operation in excess of 107 °C [225 °F] may cause external leakage or premature unit failure.
fLuiDs A mineral based fluid is recommended that includes additives to resist corrosion, oxidation and foaming. The oil should have a maximum viscosity commensurate with system pressure drop and pump suction pressures. Since the fluid serves as a system lubricant, as well as transmitting power, careful selection of the fluid is important for proper operation and satisfactory life of the hydraulic components. Hydraulic fluids should be changed at appropriate intervals determined by test, supplier, or by change in color, or odor, of the fluid. For additional technical information on hydraulic fluids refer to 520L0463, Hydraulic Fluids and Lubricants, Technical Information Bulletin and specific product technical bulletins.
Every 10°C [18°F] rise in continuous reservoir temperature over 80°C [176 °F] decreases the life of the oil by ½.
mounting The pump mount/drive should be designed to minimize axial and radial loads on the shaft. When using an indirect (chain, belt, or gear) drive, contact Sauer-Danfoss to determine permissible load limits and orientation of the installation.
The motor mount should be designed to position the motor/fan assembly within the shroud for optimum fan performance and to locate the leading edge of the fan blades relative to the adjacent surface of the heat exchanger. The support structure should be constructed so that it will be robust against forces and deflections due to shock and vibration as well as the loads applied to it by the fan and the hydraulic plumbing that will be connected to the motor.

21520L0926 • Rev AD • June 2010
Hydraulic Fan Drive SystemsDesign GuidelinesSystem design parameters
axiaL tHRust motoRs When a fan is directly mounted onto the drive shaft of a hydraulic motor, it imparts both a radial and an axial thrust load onto the shaft. In general, the weight of the fan is insignificant when compared to the radial load capacity of the bearings in the motor. But, the axial thrust load must be considered carefully. Under normal operating conditions, Sauer-Danfoss gear motors have adequate axial thrust capacity for most fans that are applied in the industry, but they do have limitations. It is recommended that the system designer determine the axial thrust force that will be produced by the fan and compare it to the values listed below:
Refer to page 26 and 27 for equations that will assist in calculating the axial thrust loads from the fan, but these loads should be confirmed by test.
PiPing The choice of piping size and installation should always be consistent with minimizing maximum fluid velocity. This will reduce system noise, pressure drops and overheating, thereby adding to cost savings for the operation of the system. Inlet piping should be designed to prevent continuous pump inlet pressures below 0.8 bar abs. [6 in. Hg vac.] or 0.6 bar abs. [12 in. Hg vac.] during start-up. When selecting pipe sizing, recognize pressure drops are related to flow velocity. Sauer-Danfoss recommends limiting the maximum average mean flow velocity to 5 m/sec [15 ft/sec.] in pressure lines, and 2.5 m/sec [7 ft/sec.] in suction lines.
In addition to limiting maximum flow velocity, it is recommended that the designer select the hoses, fittings and integral valve elements to be compatible with the desired working pressure of the hydraulic system. The following documents may be used to determine the working pressure ratings for the respective system elements:
• SAE J514: for working pressure ratings and fitting installation torques for - O-ring boss fittings/ports and JIC 37º flared tubing connections
• SAE J518: for working pressure ratings and bolt installation torques for SAE code 61 4-Bolt flange fittings/ports,
• SAE J517: for working pressure ratings for SAE hydraulic hose
• SAE J1453: for working pressure ratings for flat face O-ring fittings.
group motor product family thrust load capacity
Group 1 (SNM1) 230N [52 lbf ]
Group 2 (SNM2, SNM2Y, SGM2Y) 500N [112 lbf ]
Group 3 (SNM3, SNM3Y, SGM3Y) 1050N [236 lbf ]
Axial thrust load capacities

22 520L0926 • Rev AD • June 2010
Hydraulic Fan Drive SystemsDesign GuidelinesSystem design parameters
ReseRvoiR The reservoir should be designed to accommodate expected maximum volume exchange during all system operating modes and to prevent aeration of the fluid as it passes through the reservoir. Return and inlet lines should be positioned below the reservoir low oil level and be located as far as possible from each other. A diffuser and a baffle plate located between the pump inlet and return line is desirable to reduce turbulence and to allow the oil to de-aerate before it re-enters the pump. Reservoirs must be sized to ensure de-aeration of the oil before it re-enters the pump. For dwell times of less than 90 seconds, the system designer is encouraged to verify that entrained air (bubbles) are not included in the oil that is being transmitted from the reservoir to the pump. This may be accomplished by placing a sight gage into the inlet line between the reservoir and the pump. Placing a variable frequency strobe light source behind the sight gage will improve the observer’s ability to see air bubbles present in the fluid as it passes through the inlet line.
Sauer-Danfoss encourages system designers to locate the reservoir so that the oil level in the reservoir will remain above the level of the inlet port of the pump under all conditions. By doing this, a positive head is produced that can offset the effects of line losses and altitude on the inlet pressure available at the pump.
Sauer-Danfoss also encourages system designers to consider the potential for air to be introduced into the inlet line within the reservoir via the introduction of a vortex or whirlpool, between the surface of the oil and the inlet port. One way to discourage a vortex is to locate a baffle between the inlet passage, or suction strainer, and the surface of the oil. The system designer should consider the design parameters of size and position for the baffle to ensure that a vortex cannot form if the reservoir attitude is at its extremes, the oil level is at or below the minimum recommended capacity, or if sloshing occurs due to operation of the machine.

23520L0926 • Rev AD • June 2010
Hydraulic Fan Drive SystemsDesign GuidelinesSystem design parameters
Cavitation anD aeRation Damage
Hydraulic oil used in the majority of systems contains about 10% dissolved air by volume. This air, under certain conditions of vacuum within the system, is released from the oil causing air bubbles. These entrained air bubbles collapse if subjected to pressure, and this collapse creates erosion of the adjacent metal and degradation of the oil. Because of this, it becomes obvious that the greater the air content within the oil, or the greater the vacuum in the inlet line, the more severe will be the resultant damage. The main causes of over-aeration of the oil are air leaks, particularly on the inlet side of the pump, and flow line restrictions such as inadequate pipe sizes, elbow fittings and sudden changes in flow passage cross-sectional area. Provided that defects in plumbing and construction are avoided, pump inlet pressure and rated speed requirements are maintained, and reservoir size and location are adequate: no cavitation problems should occur with Sauer-Danfoss pumps and motors.
When entrained air entering the pump is pressurized at the pump outlet, it is forced into solution in the oil as the bubbles collapse. This super-saturated solution of dissolved air and oil will release its air when the pressure is released. Symptoms of this condition can be observed by oil / foam escaping from the fill port of the reservoir when the system is shut down.
PRessuRe PRoteCtion anD Ratings
The pump, as well as other system components, has pressure limitations. Thus a relief valve, or pressure limiting device, must be installed in the system, and its setting must be consistent with the product ratings. Refer to the relevant Sauer-Danfoss technical bulletins for this information.
CCautionFailure to install a relief valve or over-pressure protection may result in premature unit failure.
BeaRing Life exPeCtanCy
All Sauer-Danfoss piston pumps and motors utilize anti-friction, rolling element bearings. All Sauer-Danfoss gear pumps and motors utilize pressure-balanced journal bearings, which have an oil film maintained at all times between the gear/shaft and bearing surfaces. If this oil film is sufficiently sustained through proper system maintenance and the product’s operating limits are adhered to, a long bearing life can be expected.
A B-10 type life expectancy number is generally associated with rolling element bearings and does not exist for journal bearings. Journal bearing life is a function of speed, system pressure, and other system parameters such as oil viscosity and oil cleanliness.
Depending on duty cycle and reservoir/line construction, an oil-cooler may be required. The oil-cooler size is based on typical power losses in the hydraulic circuit. The oil cooler is usually placed in the return line.
CooLing

24 520L0926 • Rev AD • June 2010
Hydraulic Fan Drive SystemsDesign Guidelines
trim speed is the maximum fan speed required at the full-on condition. This is equal to, or greater than, the fan speed required to meet the maximum cooling needs of the cooling system.
engine set point is the engine speed at which trim speed should occur, and is provided by the cooling system designer. This is equal to, or less than, the engine speed at which maximum system cooling is required.
fan power at trim is the power that needs to be generated at the motor shaft to drive the fan at trim speed.
fan rating is the value by which different types of fans can be compared. Usually designated as X power @ Y rpm and equates back to an air volume (mass flow rate) that can be moved per minute at the Y rpm.
To assist with the sizing exercise, Sauer-Danfoss has developed a sizing tool to perform the necessary calculations. Within the sizing tool, worksheets are provided for both fixed displacement pump/fixed displacement motor, and variable displacement pump/fixed displacement motor hydraulic systems. The sizing tool has been provided to your Sauer-Danfoss representative.
Refer to the data sheets on pages 14, 15 and 16. When the data on these sheets is complete, calculations can be made to determine the most suitable pump/motor/controller combination for the application based on:
• Pump drive available (torque, shaft, mounting flange, overall space envelope)• System pressure required• Additional flow/pressure required from the pump, (for example: steering flow)• Control type requested by the customer• Limiting operating parameters of the fan drive family products• Fit (space envelope)
Contact your Sauer-Danfoss representative for a report of the performance prediction generated by the fan drive sizing tool.
teRminoLogy
Glossary

25520L0926 • Rev AD • June 2010
Hydraulic Fan Drive SystemsDesign Guidelines
fans
fan PeRfoRmanCe
Fans are generally divided into two classifications: • Centrifugal or radial flow - in which the air flows radially thru the impeller within a
scroll type of housing• Axial flow - in which the air flows axially thru the impeller within a cylinder or ring.
The typical axial flow fan is commonly referred to as a propeller fan, and is customarily used for free delivery, or against low resistance. They are usually mounted within a circular ring or shroud with a circular opening.
Fan performance is a measure of volume, total pressure, static pressure, speed, power input, mechanical efficiency, and static efficiency, at a stated density. Some useful definitions are:
• volume delivered by a fan is the number of cubic feet of air per minute (or, cubic meters per second), expressed at fan inlet conditions.
• total pressure is the rise of pressure from fan inlet to fan outlet.• velocity pressure is the pressure corresponding to the average velocity, determined
from the volume of airflow at the fan outlet area.• static pressure is the total pressure diminished by the fan’s velocity pressure.
Static pressure is a measure of the fan’s performance and is reported by the fan manufacturer in their technical literature. Static pressure is also a measure of the resistance to the flow of air thru the heat exchanger.
• Power output is expressed in horsepower (or, kilowatts) and is based on fan volume and fan total pressure.
• Power input is expressed in horsepower (or, kilowatts) and is the measured power delivered to the fan shaft.
• mechanical efficiency of a fan is the ratio of power output to power input.• static efficiency of a fan is the mechanical efficiency multiplied by the ratio of static
pressure to the total pressure.
The theoretical power required to move a quantity of air may be determined by the following formula:
English system
Theoretical hp = [hp]
ft3 min ( ) • (Total pressure, [in H20])
(6356)
Theoretical power = [watts]
m3 sec ( ) • (Total pressure, [Pa],
(1.0)
N [ ] m2 )
SI system
Pressure and power both vary with air density.
Appendix A-Fan performance

26 520L0926 • Rev AD • June 2010
Hydraulic Fan Drive SystemsDesign GuidelinesAppendix A-Fan performance
fan PeRfoRmanCe (continued)
Fan efficiencies may be determined by the following formulae:
English system
Mechanical (total) efficiency =
ft3 min
• (Total pressure, [in H20])
(6356.0)
Mechanical (total) efficiency =
m3 sec
• (Total pressure, [Pa],
(Power input, [watts])
N m2
)
SI system
(Horsepower input)
Mechanical efficiency, based on total pressure is applicable for fans operating with high outlet velocity pressure relative to the static pressure, typical of centrifugal fans.
English system
Static efficiency =
ft3 min
• (Static pressure, [in H20])
(6356.0)
Static efficiency =
m3 sec
• (Static pressure, [Pa],
(Power input, [watts])
N m2
)
SI system
(Horsepower input)
Static efficiency, based on static pressure is applicable to fans with high static pressure relative to the velocity pressure. Static pressure and static efficiency are used more often than mechanical efficiency and total pressure. When a fan operates against no resistance, the static efficiency becomes zero and is meaningless.
axiaL tHRust Total pressure = static pressure + velocity pressureVelocity pressure is proportional to air velocity.
Air velocity, V =
Average flow rate
Cross sectional area
Velocity pressure = Pa, N (V2 • r)
SI system
m2
V =m
sec
2 ,
r = Density of air, Kgm3
( ) [ ]
( ) [ ]
[ ]
[ ]
[ ]
( ) [ ]
[ ] ( )

27520L0926 • Rev AD • June 2010
Hydraulic Fan Drive SystemsDesign GuidelinesAppendix A-Fan performance
The performance characteristics of fans of all types follow certain laws, which are useful in predicting the effect upon performance of certain changes in the conditions of operation, or the size of the equipment due to limitations of space, power, and/or speed. In the following categories, Q = air flow, and Pres. = static, velocity, or total pressure. The categories pertaining to fan size apply only to fans, which are geometrically similar, i.e., those in which all of the dimensions are proportional to some linear dimension identified as size.
1) Variation in fan speed:: Constant air density – Constant system (a) Q: Varies as fan speed (b) Pres: Varies as square of fan speed (c) Power: Varies as cube of fan speed
2) Variation in fan size: Constant tip speed – Constant air density Constant fan proportions – Fixed point of rating (a) Q: Varies as square of fan diameter (b) Pres: Remains constant (c) rpm: Varies inversely as fan diameter (d) Power: Varies as square of fan diameter
axiaL tHRust (continued)
English system
Velocity pressure =V
V =ft
min
4005 ), ( [in H20]
English system
Axial thrust = , [N]
π • Total pressure • (Fan diameter)2
SI system
Total pressure,
4
Pa, N m2
Fan diameter, [m]
Axial thrust = , [lbf ] π • 5.193 • Total pressure • (Fan diameter)2
Total pressure,
4
Fan diameter, [ft]
[in H20]
fan Laws
[ ]
[ ]
[ ]
[ ]

28 520L0926 • Rev AD • June 2010
Hydraulic Fan Drive SystemsDesign GuidelinesAppendix A-Fan performance
3) Variation in fan size: At constant rpm – Constant air density Constant fan proportions – fixed Point of rating (a) Q: Varies as cube of fan diameter (b) Pres: Varies as square of fan diameter (c) Tip speed: Varies as fan diameter (d) Power Varies as fifth power of diameter
4) Variation in air density: (Refer to Appendix F page 45) Constant volume – Constant system Fixed fan size – Constant fan speed (a) Q: Constant (b) Pres: Varies as density (SI), specific weight (English) (c) Power: Varies as density (SI), specific weight (English)
5) Variation in air density: (Refer to Appendix F page 45) Constant pressure – Constant system Fixed fan size – Variable fan speed (a) Q: Varies inversely as square root of density (SI), specific weight (English) (b) Pres: Constant (c) rpm: Varies inversely as square root of density (SI), specific weight (English) (d) Power: Varies inversely as square root of density (SI), specific weight (English)
6) Variation in air density: (Refer to Appendix F page 45) Constant weight of air – Constant system Fixed fan size – Variable fan speed (a) Q: Varies inversely as density (SI), specific weight (English) (b) Pres: Varies inversely as density (SI), specific weight (English) (c) rpm: Varies inversely as density (SI), specific weight (English) (d) Power: Varies inversely as square of density (SI), specific weight (English)
fan Laws (continued)

29520L0926 • Rev AD • June 2010
Hydraulic Fan Drive SystemsDesign GuidelinesAppendix A-Fan performance
Example 1A fan delivers 12,000 cfm at a static pressure of 1 in. H2O when operating at a speed of 400 rpm and requires an input of 4 hp. If in the same installation, 15,000 cfm are required, what will be the speed, static pressure, and power?Using fan law 1:Speed = 400 * {15,000/12,000} = 500 rpmStatic pressure = 1 * {500/400}2 = 4.56 in. H2OPower = 4 * {500/400}3 = 7.81 hp
fan Laws (continued)
Fan laws at a glancevariation in fan speed variation in fan size variation in air density
fan laws fan law #1 fan law #2 fan law #3 fan law #4 fan law #5 fan law #6
Parameters
Constant air density & constant system
Constant tip speed & constant air density
Constant rpm & constant air density
Constant volume & constant system
Constant pressure & constant system
Constant weight of air & constant system
Constant tip proportions & fixed point of rating
Constant fan proportions & fixed point of rating
Fixed fan size & constant fan speed
Fixed fan size & variable fan speed
Fixed fan size & variable fan speed
q, air volume, (flow rate) Varies as fan speed Varies as square of fan diameter
Varies as cube of fan diameter
Constant Varies inversely as square root of density or specific weight
Varies inversely as density or specific weight
Pressure Varies as square of fan speed
Remains constant Varies as square of fan diameter
Varies as density or specific weight
Constant Varies inversely as density or specific weight
rpm Constant Varies inversely as fan diameter
Constant Constant Varies inversely as square root of density or specific weight
Varies inversely as density or specific weight
Power Varies as cube of fan speed
Varies square of fan diameter
Varies as 5th power of diameter
Varies as density or specific weight
Varies as inversely as square root of density or specific weight
Varies as inversely as square of density or specific weight
tip speed N/A N/A Varies as fan diameter
N/A

30 520L0926 • Rev AD • June 2010
Hydraulic Fan Drive SystemsDesign GuidelinesAppendix A-Fan performance
Example 2A fan delivers 12,000 cfm at 70 °F and normal barometric pressure (density = 0.075 lb per cubic foot) at a static pressure of 1 in. H2O when operating at 400 rpm, and requires 4 hp. If the air temperature is increased to 200 °F (density = 0.0602 lb per cubic foot) and the speed of the fan remains the same, what will be the static pressure and power?
Using fan law 4:Static pressure = 1 * {0.0602/0.075} = 0.80 in. H2O
Power = 4 * {0.0602/0.075} = 3.20 hp
Example 3If the speed of the fan in example 2 is increased to produce a static pressure of 1 in. H2O at 200 °F, as at 70 °F, what will be the speed, capacity, and static power?
Using fan law 5:Speed = 400 * SQRT {0.0705/0.0602} = 446 rpm
Capacity = 12,000 * SQRT {0.075/0.0602} = 13,392 cfm (measured at 200°F)
Power = 4 * SQRT {0.075/0.0602} = 4.46 hp
Example 4If the speed of the fan in the previous examples is increased to deliver the same weight of air (same cooling capacity) at 200°F as at 70°F, what will be the speed, capacity, static pressure, and power?
Heat transfer is determined by the mass, or weight, of the air presented to the heat exchanger, or radiator.
Using fan law 6:Speed = 400 * {0.075/0.0602} = 498 rpm
Capacity = 12,000 * {0.075/0.0602} = 14,945 cfm (measured at 200 F)
Static Pressure = 1 * {0.075/0.0602} = 1.25 in. H2O
Power = 4 * {0.075/0.0602}2 = 6.20 hp
The fan laws may be combined to give other overall values. One useful combination is the product of Laws 1 and 3, which gives the following relationships:
• Capacity (flow rate of air) varies as the ratio of size cubed, times the ratio of the rpm.• Pressure varies as the ratio of size squared, times the ratio of the rpm squared.• Power varies as the ratio of the size to the fifth power, times the ratio of the rpm
cubed.
fan Laws (continued)

31520L0926 • Rev AD • June 2010
Hydraulic Fan Drive SystemsDesign GuidelinesAppendix A-Fan performance
fan Laws (continued) Centrifugal fans produce pressure from two independent sources: from the centrifugal force created by rotating the enclosed air column, and from the kinetic energy imparted to the air by virtue of its velocity leaving the impeller. The energy imparted to the air depends on the velocities and is dependent on the curvature of the fan blades. Therefore, for fans with forward curved blades, the energy per pound of air rises rapidly with an increase of air delivery. For fans with backward curved blades, the energy per pound of air may decrease with air delivery (flow rate). For fans with straight blades, the energy per pound of air is roughly constant, regardless of air delivery (flow rate). A unique characteristic of centrifugal fans is that the maximum power required by the fan is found at maximum delivery. Or, otherwise stated, the minimum power required by the fan is found at zero delivery, or under stall conditions.
Axial-flow fans develop none of their static pressure by centrifugal force; all of the static pressure is derived from the change in velocity in passing thru the impeller and its conversion into static pressure. They are inherently high velocity fans and are very dependent on the shape of the blade. Since any particular shape of blade can only be correct for a narrow range of capacity at constant speed, the performance curves for individual fan blade shapes are unique and vary significantly from manufacturer, to manufacturer. To absorb energy, the air must be given a tangential motion in passing thru the impeller; as with the centrifugal fan, the pressure rises generally from free delivery to no delivery, but may drop significantly when the capacity decreases below a certain volume. The drop in pressure is indicative that a stall condition occurs and the blades cease to function in the normal manner.
Fan manufacturers generally agree that the tip clearance around the fan’s blades is significant and will contribute to the performance, delivery, and operating efficiency of the fan. Likewise, the type of shroud that surrounds the fan, the axial position of the fan within the shroud, and the clearance between the leading edge of the fan and the cooler can contribute significantly to the performance, operating efficiency, and noise of operation of the fan. The system designer is advised to consult with both the fan and cooler manufacturer for these specific design elements for the system under consideration.

32 520L0926 • Rev AD • June 2010
Hydraulic Fan Drive SystemsDesign Guidelines
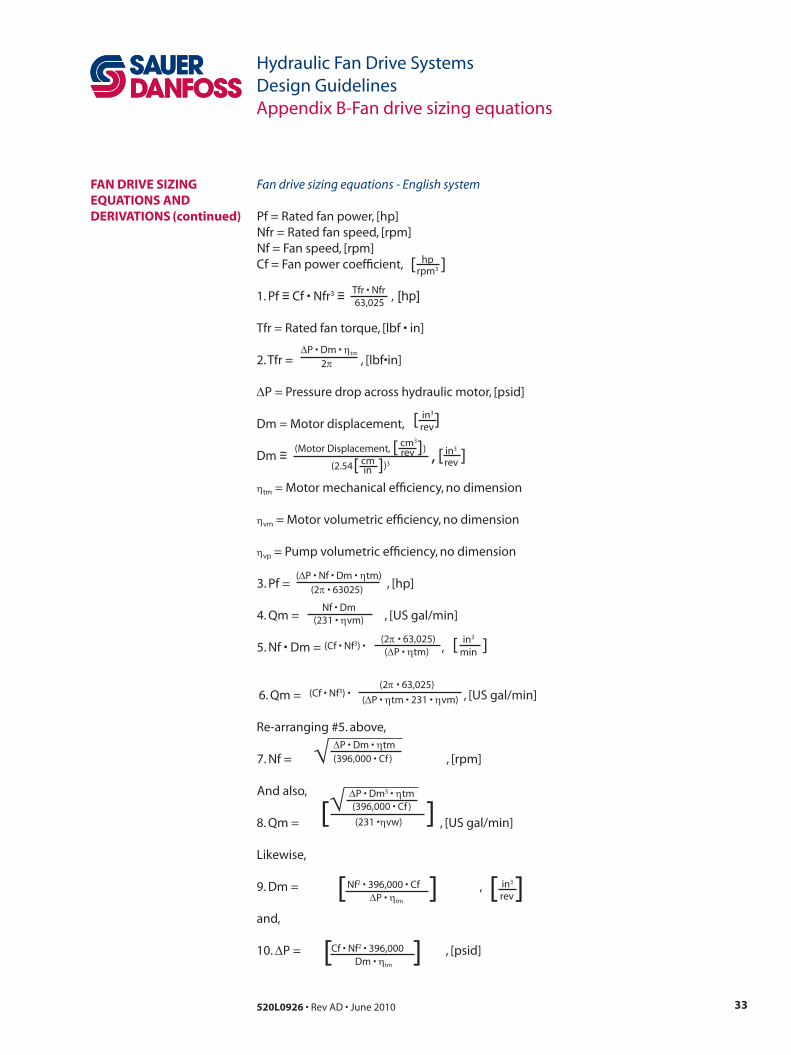
fan DRive sizing equations anD DeRivations
Fan drive sizing equations - SI system
Pf = Rated fan power, [kW]Nr = Rated fan speed, [rpm]Nfr = Fan speed, [rpm]
1. Pf ≡ Cf • Nfr3 ≡ , [kW]Tfr • Nfr9549
2. Tfr = , [N•m]
∆P = Pressure drop across hydraulic motor, [bar]
∆P • Dm • ntm 20π
Tfr = Rated fan torque, [N•m]
Dm ≡ Motor displacement, cm3 rev
Dm = (Motor displacement, in3 rev
• (2.54 cm in )3 cm3
rev
ntm = Motor mechanical efficiency, no dimension
kWrpm3
nvm = Motor volumetric efficiency, no dimension
nvp = Pump volumetric Efficiency, no dimension
Cf = Fan power coefficient,
3. Pf = , [kW](∆P • Nf • Dm • ηtm) (20π •9549)
4. Qm =Nf • Dm
(1000.0 • ηvm)L
min
5. Nf • Dm = (20π • 9549.0)
(∆P • ηtm)cm3
min(Cf • Nf3) •
6. Qm = (20π •9549.0)
(∆P • ηtm • 1000 • ηvm)(Cf • Nf3) •
Lmin
Re-arranging #5. above,
7. Nf = , [rpm](600,000 • Cf )∆P • Dm • ηtm√
And also,
8. Qm =(600,000 • Cf )∆P • Dm3 • ηtm√
(1,000 • ηvm)L
min
Likewise,
9. Dm =Nf2 • 600,000 • Cf
∆P • ntm
cm3 rev
[ ]
[ ] [ ]
[ ]
[ ]
[ ]
[ ]
[ ]
[ ]
[ ]
[ ]
( ),
,
,
,
,
,
10. ∆P =Cf • Nf2 • 600,000
Dm • ηtm[ ]
and,
, [bar]
Appendix B-Fan drive sizing equations
33520L0926 • Rev AD • June 2010
Hydraulic Fan Drive SystemsDesign GuidelinesAppendix B-Fan drive sizing equations
fan DRive sizing equations anD DeRivations (continued)
Fan drive sizing equations - English system
Pf = Rated fan power, [hp]Nfr = Rated fan speed, [rpm]Nf = Fan speed, [rpm]
1. Pf ≡ Cf • Nfr3 ≡ Tfr • Nfr63,025
2. Tfr = , [lbf•in]
∆P = Pressure drop across hydraulic motor, [psid]
∆P • Dm • ηtm 2π
Tfr = Rated fan torque, [lbf • in]
Dm = Motor displacement,in3 rev
Dm ≡ in3 rev
ηtm = Motor mechanical efficiency, no dimension
hprpm3
ηvm = Motor volumetric efficiency, no dimension
ηvp = Pump volumetric efficiency, no dimension
Cf = Fan power coefficient,
3. Pf = , [hp](∆P • Nf • Dm • ηtm)
(2π • 63025)
4. Qm = , [US gal/min] Nf • Dm
(231 • ηvm)
5. Nf • Dm =(2π • 63,025)(∆P • ηtm)
in3
min(Cf • Nf3) •
6. Qm =(2π • 63,025)
(∆P • ηtm • 231 • ηvm)(Cf • Nf3) •
Re-arranging #5. above,
7. Nf = , [rpm](396,000 • Cf )∆P • Dm • ηtm√
And also,
8. Qm = , [US gal/min](396,000 • Cf )
∆P • Dm3 • ηtm√(231 •ηvw)
[ ]
, [ ]
[ ]
[ ]
[ ]
(Motor Displacement,
(2.54
cm3 rev[ ] )
cm in[ ] )3
, [hp]
, [US gal/min]
,
Likewise,
9. Dm = ,Nf2 • 396,000 • Cf∆P • ηtm
in3 [ ] rev[ ]
10. ∆P = , [psid]Cf • Nf2 • 396,000Dm • ηtm
[ ] and,

34 520L0926 • Rev AD • June 2010
Hydraulic Fan Drive SystemsDesign GuidelinesAppendix B-Fan drive sizing equations
fan DRive sizing equations anD DeRivations (continued)
SI system
HyDRauLiC system ComPaRisons
Therefore, comparing equations 7 thru 10 on the previous pages, for any given combination of fan configuration and motor displacement, there is a unique relationship between system pressure, motor flow, and motor speed.
One application of the sizing equations is to use them to relate the fan speed/pressure relationship from one condition to another.
From equation 7,
Nf2 =(600,000 • Cf )∆P • Dm • ηtm
Therefore at condition 1:
Nf2 =(600,000 • Cf )∆P1 • Dm • ηtm
1
and at condition 2:
Nf2 =(600,000 • Cf )∆P2 • Dm • ηtm
2
Then,
Nf1
Nf2
2
2
=∆P1
∆P2
Nf2 = Nf1 • √ ∆P2
∆P1
English system
From equation 7,
Nf2 =(396,000 • Cf )∆P • Dm • ηtm
Therefore at condition 1:
Nf2 =(396,000 • Cf )∆P1 • Dm • ηtm
1
and at condition 2:
Nf2 =(396,000 • Cf )∆P2 • Dm • ηtm
2
Then,
Nf1
Nf2
2
2
=∆P1
∆P2
Nf2 = Nf1 • √ ∆P2
∆P1
[ ]
[ ]
[ ]
[ ]
[ ]
[ ]
35520L0926 • Rev AD • June 2010
Hydraulic Fan Drive SystemsDesign GuidelinesAppendix B-Fan drive sizing equations
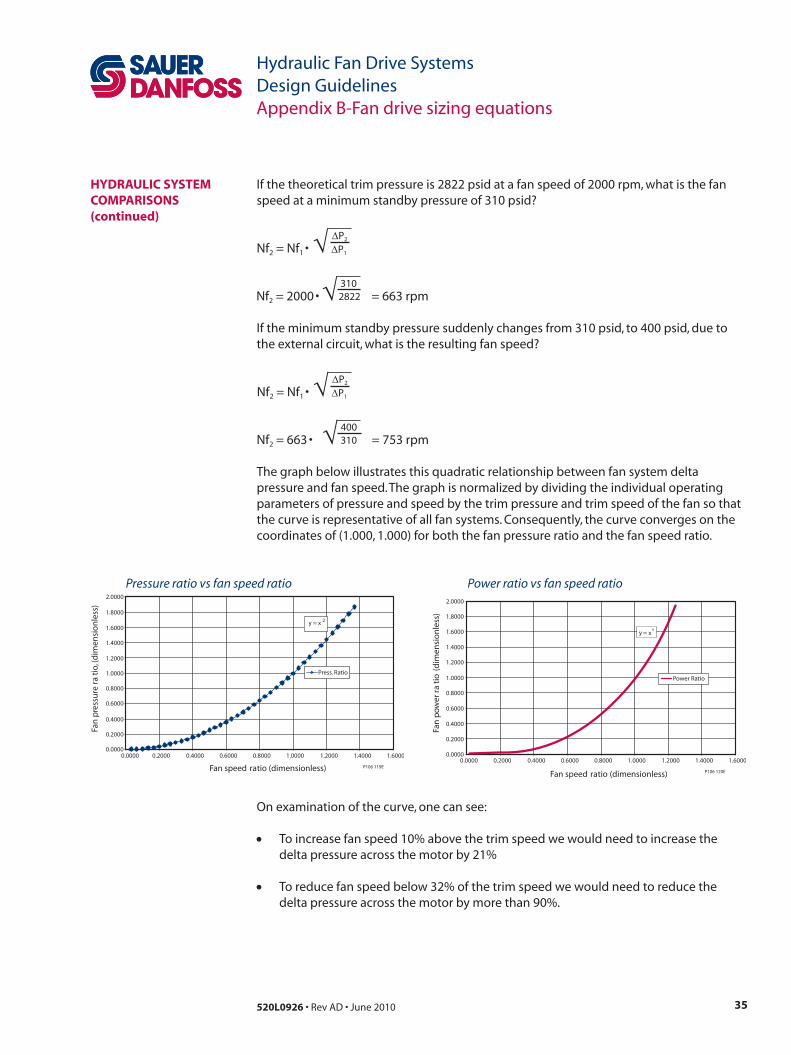
If the theoretical trim pressure is 2822 psid at a fan speed of 2000 rpm, what is the fan speed at a minimum standby pressure of 310 psid?
Nf2 = Nf1 • √ ∆P2
∆P1
Nf2 = 2000 • = 663 rpm √ 3102822
If the minimum standby pressure suddenly changes from 310 psid, to 400 psid, due to the external circuit, what is the resulting fan speed?
Nf2 = Nf1 • √ ∆P2
∆P1
Nf2 = 663 • = 753 rpm √ 400310
The graph below illustrates this quadratic relationship between fan system delta pressure and fan speed. The graph is normalized by dividing the individual operating parameters of pressure and speed by the trim pressure and trim speed of the fan so that the curve is representative of all fan systems. Consequently, the curve converges on the coordinates of (1.000, 1.000) for both the fan pressure ratio and the fan speed ratio.
On examination of the curve, one can see:
• To increase fan speed 10% above the trim speed we would need to increase the delta pressure across the motor by 21%
• To reduce fan speed below 32% of the trim speed we would need to reduce the delta pressure across the motor by more than 90%.
HyDRauLiC system ComPaRisons (continued)
0.0000
0.2000
0.4000
0.6000
0.8000
1.0000
1.2000
1.4000
1.6000
1.8000
2.0000
0.0000 0.2000 0.4000 0.6000 0.8000 1.0000 1.2000 1.4000 1.6000
Fan speed ratio (dimensionless)
Press. Ratio
y = x 2
Fan
pre
ssu
re r
ati
o,(d
imen
sio
nle
ss)
P106 119E
0.0000
0.2000
0.4000
0.6000
0.8000
1.0000
1.2000
1.4000
1.6000
1.8000
2.0000
0.0000 0.2000 0.4000 0.6000 0.8000 1.0000 1.2000 1.4000 1.6000
F an speed ratio (dimensionless)
Po wer Ratio
y 3
= x
Fan
pow
er r
ati
o (
dim
ensi
on
less
)
P106 120E
Pressure ratio vs fan speed ratio Power ratio vs fan speed ratio

36 520L0926 • Rev AD • June 2010
Hydraulic Fan Drive SystemsDesign Guidelines
HyDRauLiC systems witH 2 Position, vaRiaBLe DisPLaCement motoRs, equations anD DeRivations
SI system
Some systems may require additional cooling when the engine is at the low idle speed. A system with a fixed displacement motor may require additional pump flow to accomplish this. If the pump flow is limited, there is the possibility of providing additional cooling by utilizing a variable displacement motor in the hydraulic circuit. For normal operation, the variable displacement motor is held in the maximum displacement position in order to minimize the operating pressure for any given cooling requirement. But, when the engine is at the low idle speed, the control system can command the motor to its minimum displacement position to take full advantage of the flow that is available from the pump. In both conditions, the fan speed is modulated in response to the temperature of the coolant to satisfy the cooling needs of the system.
If you would like to determine the optimum minimum displacement for a variable motor, which would provide the maximum fan speed when, the engine speed is at low idle and the system pressure is at the trim pressure setting:
The following analysis assumes that the bypass flow around the motor is zero.
Assume Qm = Qp,
Nf • Dmηvm
= Np • Dp • ηvp
Therefore:
11. Nf = Np • Dp • ηvp • ηvm
Dm=
(Ne • R) • Dp • ηvp • ηvm
Dm
Ne = Engine speed, rpm (In this case, Ne = engine low idle speed.)R = Engine-pump gear ratio, no dimension.Combining eq. 1. and eq. 11.,
12. Pf = Cf • Nf3 = ∆P • Dm • ηtm
600,000•
Ne • R • Dp • ηvp • ηvm
Dm, [kW]
13. Nf = ∆P • Ne • R • Dp • ηtm • ηvp • ηvm
600,000 • Cf, [rpm]
1/3
14. Ne • R • Dp • ηvp • ηvm
Dm
Combining eq. 11. and eq. 13.,
3 ∆P • Ne • R • Dp • ηtm • ηvp • ηvm
600,000 • Cf=
Solving for Dm,
15. Dm = • (Ne • R • Dp • ηvp • ηvm)2 , ∆P •ηtm
600,000 • Cf1/3
cm3 rev
[ ]
[ ] [ ]
[ ]
[ ] [ ]
Appendix C-Fan drive sizing equations, using variable displacement motors

37520L0926 • Rev AD • June 2010
Hydraulic Fan Drive SystemsDesign GuidelinesAppendix C-Fan drive sizing equations, using variable displacement motors
English system
Assume Qm = Qp,
Nf • Dmηvm
= Np • Dp • ηvp
Therefore:
11. Nf = Nf • Dp • ηvp • ηvm
Dm=
(Ne • R) • Dp • ηvp • ηvm
Dm
Ne = Engine speed, rpm (In this case, Ne = engine low idle speed.)R = Engine/pump gear ratio, no dimension.Combining eq. 1. and eq. 11.,
12. Pf = Cf • Nf3 = ∆P • Dm • ηtm
396,000•
Ne • R • Dp • ηvp • ηvm
Dm, [hp]
13. Nf = ∆P • Ne • R • Dp • ηtm • ηvp • ηvm
396,000 • Cf, [rpm]
1/3
14. Ne • R • Dp • ηvp • ηvm
Dm
Combining eq. 11. and eq. 13.,
3 ∆P • Ne • R • Dp • ηtm • ηvp • ηvm
396,000 • Cf=
Solving for Dm,
15. Dm = • (Ne • R • Dp • ηvp • ηvm)2 , ∆P •ηtm
396,000 • Cf1/3 cm3
rev
HyDRauLiC systems witH 2 Position, vaRiaBLe DisPLaCement motoRs, equations anD DeRivations (continued)
This is the optimum minimum motor displacement at which the fan speed will be maximum for the given pump flow at engine idle and at the system’s trim pressure. An ExcelTM spreadsheet has been developed to calculate the optimum minimum displacement for the variable displacement motor. Consult your Sauer-Danfoss representative for assistance.
[ ]
[ ]
[ ] [ ]
[ ] [ ]
[ ]

38 520L0926 • Rev AD • June 2010
Hydraulic Fan Drive SystemsDesign GuidelinesAppendix C-Fan drive sizing equations, using variable displacement motors
Spreadsheet calculator tool (example)
This relationship is illustrated in the graph below.
• The curve described by the square data points represents the speed of the motor shaft as a function of motor displacement when the pump’s displacement is constant, and the pump’s input speed is at the engine idle speed.
• The curve described by the triangular data points represents the speed of the motor shaft as a function of the fan power coefficient, the trim pressure and the motor’s displacement.
• For the system parameters that have been chosen, the optimum minimum motor displacement for the variable motor will be found at the intersection of these two curves.
sPReaDsHeet to CaLCuLate oPtimum minimum DisPLaCement foR two Position vaRiaBLe motoR
Rated fan power, hp 40 Input data only in cells with blue font:
Rated fan speed, rpm 2400Optimum displ.
Dm =In^3/rev
1.230cc/rev20.15
Desired fan trim speed, rpm
2600
trim pressure, Psig 3205
motor displ., cc/rev 44
motor torque eff 90%
Cf = hp_fan/nf^3 2.89E-09
engine idle speed, rpm 700
engine: pump ratio, _:1 1
Pump displ, cc/rev 55
Pump displ, in^3/rev 3.36
motor vol eff 96%
Pump vol eff 96%
Fan rated power = 40 hpRan rated speed = 2400 rpm
0
500
1000
1500
2000
2500
3000
3500
4000
4500
5000
44 42 40 38 36 34 32 30 28 26 24 22 20 18 16 14 12 10 8
Motor displacement, cm³/rev
Mot
or s
haft
spe
ed,(
rpm
)
Free shaft speed at eng. idle, RPM
Fan trim speed at max trim press, RPM
Optimum minimum displacementfor variable motor is defined at theintersection of the two curves.
Fan speed for fan motor operating at maximumdisplacement with the pump speed at engine idle.
Fan speed for fan motor operatingat optimum displacement with thepump speed at engine idle.
P106 121E
Variable motor shaft speed vs. displacement

39520L0926 • Rev AD • June 2010
Hydraulic Fan Drive SystemsDesign Guidelines
PRessuRe CHange Due to tRansient fLow in a Passage, equations anD DeRivations
∆P = (P1 – P2), psid Required pressure to achieve fluid acceleration, a
a , in/sec2 Fluid acceleration in L length of conduit
L = 1 ft Length of conduit
a, in2 Area of conduit
m, lbf-sec2/in4 Fluid mass within the L length of conduit
s.g. = 0.861 Specific gravity of the fluid
Q = V • A Flow rate
v, ft/sec Velocity of fluid in conduit
D, in Diameter of the conduit
f, lbf Force
r Mass density of the fluid
g Acceleration of gravity
γ Weight density of the fluid
γ/g = r Weight density of fluid/acceleration of gravity = mass density of the fluid
t Time interval, seconds
D Pump displacement
Definitions
P1 P2
d
A
L
P106 118E
F = ∆P • A, lbf = m • a = rf • Q • V,
∆P • A = rf • Q • V = r • L • At • V
∆P • A = rf • L • A
t • QA
∆P = rf • L • Qt • A
and, rf = S.G. • rH20
( )
( )
( )
Flow passage
Appendix D-Pressure change due to transient flow in a passage

40 520L0926 • Rev AD • June 2010
Hydraulic Fan Drive SystemsDesign GuidelinesAppendix D-Pressure change due to transient flow in a passage
therefore:
SI system
PRessuRe CHange Due to tRansient fLow in a Passage, equations anD DeRivations (continued) ∆P
L, = (2.122E - 7) • S.G. • Q
t • d2
barmeter
Q = flow, L
min
L = length, [m]
d = diameter, [m]
and,
∆PL
, = (0.2122) • S.G. • Qt • d2
barmeter
when:
d = diameter, [mm]
also,
∆PL
, = (2.122E - 4) • S.G. • N • Dt • d2
barmeter
when:
d = diameter, [mm]
D = displacement, cm3
Rev
∆Nt
, average accelerationa =rpmsec,
English system
∆PL
, = (5.4996E - 3) • S.G. • Qt • d2
psidft
Q = flow, [GPM]
L = length, [ft]
d = diameter, [in]
∆PL
, = (3.7189E - 3) • Qt
psidft
when:
S.G. = 0.861
∆Nt
, a = rpmsec
when:
D = displacement, in3
rev
A = 1 in2
∆PL
• a, = (2.3808E - 3) • S.G. • Dd2
psidmeter
= average acceleration
( )
[ ]
[ ]
( )
[ ]
( ) [ ]
[ ]
[ ]
[ ]
[ ]
[ ] ( )
[ ] ( )
[ ] ( )
N = speed, [rpm]
and,
∆PL
, = (2.122E - 4) • S.G. • D • ad2
barmeter( ) [ ]
when:
d = diameter, [mm]
D = displacement, cm3
Rev[ ]

41520L0926 • Rev AD • June 2010
Hydraulic Fan Drive SystemsDesign Guidelines
In applications where the system is sized close to the maximum limits of fan speed, motor speed, or component pressure ratings, it may be necessary to determine the influence of the bypass valve’s pressure-flow characteristics on the system. In a typical circuit, there will be a rise in pressure across a component with an increase in flow. This is normal, and the system’s designer is encouraged to check whether this characteristic will have an adverse effect on the system and its components.
In this section, we will determine the effect of the pressure rise with flow characteristic of the bypass valve on the change in trim speed of the fan and the trim pressure across the hydraulic motor. In most pressure regulating valves there is a range of flows where the pressure rise is either linear, or nearly linear, with increases in flow. This is illustrated below for the electro-hydraulic proportional pressure control that is integrated into the rear covers of the S-D SNM2Y, SNM3Y, SGM2Y and SGM3Y fan drive motors. Adjacent to each of the characteristic curves is a coefficient, which is the nominal slope of each curve. With this coefficient and other system parameters that is described below: the system designer can determine the change in trim speed and trim pressure with increases in engine speed above the engine set point that we have selected.
For the purposes of this derivation, the basic modulating fan drive circuit may be simplified as shown below:
As can be seen in the simplified schematic, all of the pump flow, QS goes thru either the bypass valve, QV, or the fan motor, QM. At the initial condition for our derivation, the flow thru the bypass valve is zero and all of the pump flow is passing thru the motor. This is the trim point, when the engine is at the engine set point. Above this point, a portion of the flow will pass thru the motor and the remaining flow will pass thru the bypass valve. The proportion of the flow going thru each will be determined by the pressure-flow characteristics of the valve and the pressure-flow relationship of the motor-fan that is determined by the fan laws.
infLuenCe of ByPass vaLve PRessuRe DRoP on fan tRim sPeeD, in aPPLiCations using fixeD DisPLaCement PumPs, equations anD DeRivations
Basic modulating fan drive circuit
PilotSupply
MotorInlet
TankReturn
MotorOutlet
MotorDrain
P103 122E
PV = + δPV
QV +δV
QM +δM
PM = +δPM
Q Σ+ δΣ
PΣ+ δΣ
P106 123E
PV0
PM0
Appendix E-Influence of bypass valve pressure drop

42 520L0926 • Rev AD • June 2010
Hydraulic Fan Drive SystemsDesign GuidelinesAppendix E-Influence of bypass valve pressure drop
infLuenCe of ByPass vaLve PRessuRe DRoP, equations anD DeRivations (continued)
QS0 = QV0 + QM0
@t = 0, QV0 = 0.0
\QS0 = QM0
\dQS = dQV + dQM
QS0 + dQS = QV0 + dQV + QM0 + dQM
From the graph of ∆Pv vs ∆Qv,
PV = P0 + Kp • dQV
Kp ≡
From the fan laws,
∆Pv∆Qv ,
Q2
Q1,
P2
P1=
2
Therefore, dPm = , 2
P0QM0 + dQM
QM0- P0
dPm ≡ dPV, therefore:
dPV = P0 • , 2QM0 + dQM
QM0- 1
dPV
P0= ,
2QM0 + dQM
QM0- 1
Expanding the right side of the equation,
, 2
1 + 2dQM
QM0- 1
dPV
P0= +
dQM
QM0
,2
2dQM
QM0If «
dQM
QM0
Then, dPV
P0
= , 2 dQM
QM0
Since, dPV =Kp • dQV = Kp • (dQS - dQM),
Therefore,
KpP0
(dQS - dQM) = 2 dQM
QMO
,
Expanding,
Kp • dQS = P0 • + Kp • dQM, 2 dQM
QM0
Kp • dQS = • {2P0 + Kp • QM0},dQM
QM0
Then, dQM =Kp • dQS • QM0
(2P0 + Kp • QM0) ,
Therefore, dNM =dQM
DM,
Likewise;
(dQV) = (dQS - dQM),
dQV = dQS • Kp • QM0
(2P0 + Kp • QM0) , 1-
Then,
dPV = Kp • dQS • Kp • QM0
(2P0 + Kp • QM0)1-
Summarizing then:If we know the increase in pump flow, dQS above the engine set point, the flow thru the motor at the engine set point, QM0, the motor displacement, DM, the initial trim pressure, P0, and the bypass valve’s flow-pressure coefficient, Kp; then we can determine the increase in fan speed, dNM, above the theoretical trim speed, NM0.
dNM = Kp • dQS • QM0
DM • (2P0 + Kp • QM0)
Likewise, we can determine the change in pressure across the fan motor, dPV, as shown.
This is described in the derivation, below:
This is valid for dQM ≤ 0.5 • dQM0
( )
( )
( ) ( )
[ ]
( ) [
[ ] ( )
( ) ( ) ( ) [ ]
[ ] ( ) ( )
( )
[ ]
[ ]
( )
( )
{ }
{ }
{ }
{ }
[ ]
dPV = Kp • dQS • Kp • QM0
(2P0 + Kp • QM0)1- [ ] { }
P106 139EN = R • NeP
δQΣ
δQM
δQV
QM0
QP
E ng
ine
t ri m
s pe e
d
Bypass valve and fan motor flow vs. pump flow

43520L0926 • Rev AD • June 2010
Hydraulic Fan Drive SystemsDesign GuidelinesAppendix E-Influence of bypass valve pressure drop
40
50
60
70
80
90
100
110
120
130
140
150
160
170
180
190
200
210
220
230
240
250
260
270
0 1 0 2 0 3 0 4 0 5 0 6 0 7 0
Bypass Flow (l/min)
K P Y = 1 . 0 0
K 0
P W = 1 . 0
K P U = 0 . 9 3
K = 0 . 8 1 P S
7
K 7
P Q = 0 . 6
K = 0 . 5 8 P O
K P M = 0 . 5 3
K = P I 0 . 5 2
K P F = 0 . 3 8
P106 124E
∆ Pr
essu
re (b
ar)
Pressure vs. flow diagram Group 2 motors for valve identification infLuenCe of ByPass vaLve PRessuRe DRoP, equations anD DeRivations (continued)
y, w, u, etc. - Refer to electro-hydraulic proportional valve nomenclature code in 520L0824 Hydraulic Fan Drive Systems Technical Information.

44 520L0926 • Rev AD • June 2010
Hydraulic Fan Drive SystemsDesign GuidelinesAppendix E-Influence of bypass valve pressure drop
infLuenCe of ByPass vaLve PRessuRe DRoP, equations anD DeRivations (continued)
Pressure vs. flow diagram Group 3 motors for valve identification
40
50
60
70
80
90
100
110
120
130
140
150
160
170
180
190
200
210
220
230
240
250
260
270
0 10 20 30 40 50 60 70 80 90 100
Bypass Flow (l/min)P106 125E
K = 0.475PW
K = 0.213PM
K = 0.213PO
Pres
sure
(bar
)
K = 0.400PU
K = 0.375PS
K = 0.250PQ
K = 0.200PI
K = 0.125PF
y, w, u, etc. - Refer to electro-hydraulic proportional valve nomenclature code in 520L0824 Hydraulic Fan Drive Systems Technical Information.

45520L0926 • Rev AD • June 2010
Hydraulic Fan Drive SystemsDesign Guidelines
ν=0.0749 •
Where: ν = Specific Weight of Air, lbf/ft3
P = Standard Barometric Pressure, in Hg RH = Relative Humidity, (%/100) Pvs = Saturation Water-Vapor Pressure, in Hg T = Temperature, °F H = Altitude, ft.
P-0.3786 • RH • Pvs29.92
530460 + T[ ]• [ ]
Standard barometric pressure varies with altitude
P = (1.34955E-8)H2 - (1.07145E-9)H + 29.92, In. Hg
Accurate within +/- 0.01 In. Hg from - 1000 to 15000 ft
infLuenCe of temPeRatuRe, PRessuRe anD ReLative HumiDity on sPeCifiC weigHt of aiR
0
1
2
3
4
5
0 50 100 150Ambient temperature, ºF
Satu
rate
dva
po
r p
ress
ure
, In
.Hg
P106 155E
Saturated water vapor pressure vs ambient temperature, ºF
y = 4E-06x3 - 0.0005x2 + 0.0343x - 0.5782
R2 = 1
temp., ºf Pvs, in. Hg
60 0.5214
62 0.5597
64 0.6004
66 0.6438
68 0.6898
70 0.7387
72 0.7906
74 0.8456
76 0.904
78 0.9657
temp., ºf Pvs, in. Hg
80 1.032
82 1.101
84 1.175
86 1.253
88 1.335
90 1.421
92 1.513
94 1.609
96 1.711
98 1.818
temp., ºf Pvs, in. Hg
100 1.932
102 2.0528
104 2.1786
106 2.3109
108 2.4502
110 2.5966
112 2.7505
114 2.9123
116 3.0821
118 3.3606
temp., ºf Pvs, in. Hg
120 3.4474
122 3.6436
124 3.8492
126 4.0649
128 4.2907
130 4.5272
temp., ºf Pvs, in. Hg
40 0.2478
42 0.2671
44 0.2891
46 .03119
48 0.3363
50 0.3624
52 0.3905
54 0.42
56 0.4518
58 0.4854
Temperature, vs pressure (in. Hg)
Appendix F1-Influence of temperature, pressure and relative humidity on specific weight of air

46 520L0926 • Rev AD • June 2010
Hydraulic Fan Drive SystemsDesign Guidelines
altitude atmosphericpressure, Psia
@ 32 deg f
absolute pressureinches mercury
absolute pressuremillimeters mercury
meters feet
0 0 14.696 29.92 760
30 98 14.64 29.80 757
60 197 14.58 29.69 754
90 295 14.52 29.57 751
120 394 14.47 28.45 748
150 492 14.41 29.34 745
180 591 14.35 29.22 742
210 689 14.30 29.11 739
240 787 14.24 28.99 736
270 886 14.18 28.88 734
300 984 14.13 28.76 731
330 1083 14.07 28.65 728
360 1181 14.02 28.54 725
390 1280 13.96 28.43 722
420 1378 13.91 28.32 719
450 1476 13.85 28.20 716
480 1575 13.80 28.09 714
510 1673 13.74 27.98 711
540 1772 13.69 27.87 708
570 1870 13.64 27.76 705
600 1969 13.58 27.65 702
900 2953 13.06 26.59 675
1200 3937 12.55 25.56 649
1500 4921 12.07 24.57 624
1800 5906 11.60 23.63 600
2100 6890 11.16 22.71 577
2400 7874 10.73 21.84 555
2700 8858 10.31 20.99 533
3000 9843 9.91 20.18 513
3300 10827 9.53 19.40 493
3600 11811 9.16 18.65 474
3900 12795 8.81 17.93 456
4200 13780 8.47 17.24 438
4500 14764 8.14 16.58 421
6000 19685 6.69 13.61 346
Atmospheric Properties:infLuenCe of aLtituDe on atmosPHeRiC PRessuRe
Appendix F2-Influence of Altitude on Atmospheric Pressure
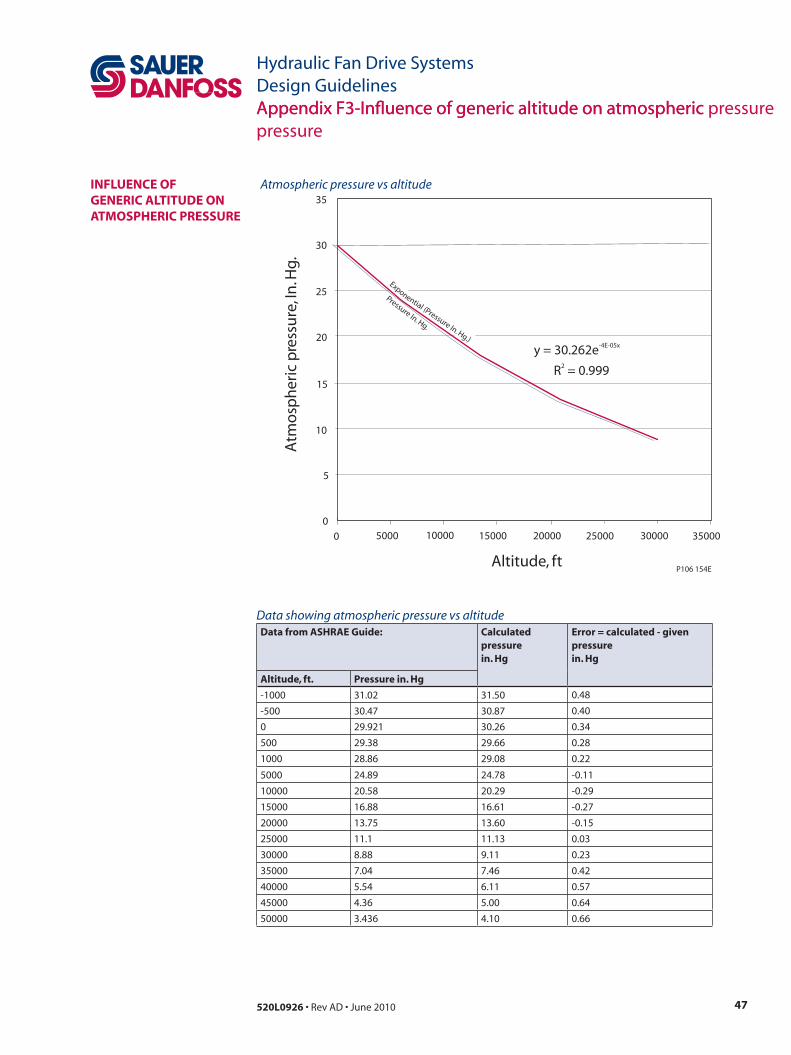
47520L0926 • Rev AD • June 2010
Hydraulic Fan Drive SystemsDesign GuidelinesAppendix F3-Influence of generic altitude on atmospheric pressure
Data from asHRae guide: Calculatedpressure in. Hg
error = calculated - given pressure in. Hg
altitude, ft. Pressure in. Hg
-1000 31.02 31.50 0.48
-500 30.47 30.87 0.40
0 29.921 30.26 0.34
500 29.38 29.66 0.28
1000 28.86 29.08 0.22
5000 24.89 24.78 -0.11
10000 20.58 20.29 -0.29
15000 16.88 16.61 -0.27
20000 13.75 13.60 -0.15
25000 11.1 11.13 0.03
30000 8.88 9.11 0.23
35000 7.04 7.46 0.42
40000 5.54 6.11 0.57
45000 4.36 5.00 0.64
50000 3.436 4.10 0.66
Atm
osp
her
ic p
ress
ure
, In
.Hg.
Altitude, ft
35
30
25
20
15
10
5
0
0 5000 10000 15000 20000 25000 30000 35000
y = 30.262e-4E-05x
R = 0.9992
Pressu en
rI . Hg.
Exponet al P e su e
g.)
n i( r s
rIn. H
P106 154E
Atmospheric pressure vs altitude
Data showing atmospheric pressure vs altitude
infLuenCe of geneRiC aLtituDe on atmosPHeRiC PRessuRe
Appendix F3-Influence of generic altitude on atmospheric pressure

48 520L0926 • Rev AD • June 2010
Hydraulic Fan Drive SystemsDesign GuidelinesAppendix G-Influence of reversed fan rotation on system performance
In applications where it is necessary to change the direction of fan rotation, most fans will have reduced performance. Some fans are designed for equal, or similar, performance in the reverse direction, but this is not typical of many axial flow fans that are installed in vehicles today. Some fan blade designs have significantly different efficiencies depending on their direction of rotation and pitch angle (angle of attack). In this instance, we’re using the term “efficiency” to indicate that the fan does not produce the same amount of air flow at the same speed; and/or it requires more power to produce the same amount of air flow as in the forward direction of rotation.
The cooling system designer is encouraged to consult with their fan supplier for performance characteristics specific to their fan; based on the speed of operation, static pressure drop, and direction of rotation. Using this information, it is possible to validate whether the fan will meet the specific needs of the cooling system. Given this information, the system designer can investigate the effect of these changes and determine if corrective actions need to be introduced.
The following is a guide to some of the characteristics that one could encounter when reversing the direction of a fan. For these purposes, the fan is assumed to be operating at its design “trim” speed and at the desired maximum “static” operating pressure across the cooler when in the forward direction.
infLuenCe of ReveRseD fan Rotation on system PeRfoRmanCe
Do you need areversing fan? No
Yes
No
Yes
AcceptableAcceptable Acceptable
Not Acceptable
Not Acceptable
Input fan & engine datainto Fan Drive Sizing Tool
Output pump andmotor displacementand pressure setting
Will completereverse cycle last
longer than 30seconds?
Determine fanperformance data in bothforward and reversedirections of operation
Fans operating in reverse mayproduce significantly differentresults than those operating inthe forward direction
If the fan speed in reverse is equalto the forward speed, the fan flowrate through the cooler will be reduced
* Use the original output from theFan Sizing Tool
* Calculate “New” max. ambienttemperature for max. heat rejectionin reverse fan direction
If the desired fan power in reverse is equal tothe power in the forward direction; the fanspeed will increase, the air flow rate will increase,but the heat rejection will be less than theforward direction of rotation
If the desired heat rejection and max. ambienttemperature for reverse rotation is equal to the forward direction, the air flow will be thesame. The fan speed will increase and thepower required to rotate the fan may increasesignificantly.
* Determine the new fan performance data forreverse rotation and input into the Fan Drive Sizing Tool.* Determine new pump and motor displacement and/or pump drive ratio, and pressure settings for both forward and reversedirections of rotation.* Use new pump and motor displacements inthe Fan Drive Sizing Tool, recalculate fan drive system performance in the forward direction.
* Determine the new fan performance data forreverse rotation and input into the Fan Drive Sizing Tool.* Determine new pump and motor displacement and/or pump drive ratio.*Use new pump and motor displacements inthe Fan Drive Sizing Tool, recalculate fan drive system performance in the forward direction.* Calculate “New” max. ambient temperature for max. heat rejection in reverse fan direction. P108 352E

49520L0926 • Rev AD • June 2010
Hydraulic Fan Drive SystemsDesign GuidelinesAppendix G-Influence of reversed fan rotation on system performance
Baseline: Fan operating in Forward Direction at 2600 RPM
P108 353E
Power [Kw]Static Pressure [Pa]
Air�ow [m3/s]
2
0 10 2015 25
4000
3500
3000
2500
2000
1500
1000
500
0
80
40
20
0
5
60
35°35°
35°35°
1. The Flow Rate for a given fan speed is determined by the intersection of the Fan’s Flow/Static-Pressure Curve for that speed and the Cooler’s Resistance Pressure vs Airflow characteristic curve.
2. The power required to turn the fan at that speed (airflow & static pressure) is located directly above this intersection point on the Fan Flow Rate vs Fan Power Curve at constant RPM. The magnitude of the fan power is determined by the secondary Y-Axis in the upper right hand corner of the graph.

50 520L0926 • Rev AD • June 2010
Hydraulic Fan Drive SystemsDesign GuidelinesAppendix G-Influence of reversed fan rotation on system performance
3. The Flow Rate for 2600 RPM in the reverse direction is less than that produced by the fan at 2600 RPM in the forward direction of rotation. Since the air flow rate is less, the static pressure across the cooler is also reduced.
4. The power required to turn the fan at the same speed, but in reverse direction, is less than that required in the forward direction of rotation. The fan is producing less flow at a lower static pressure; thus a lower power requirement.
Condition 1: Fan operating in Reverse Direction at 2600 RPM
P108 354E
Power [Kw]Static Pressure [Pa]
Airflow [m3/s]
4
3
4000
3500
3000
2500
2000
1500
1000
500
0
80
40
20
0
60
0 10 2015 255
35°35°
35°35°
35°35°
35°35°
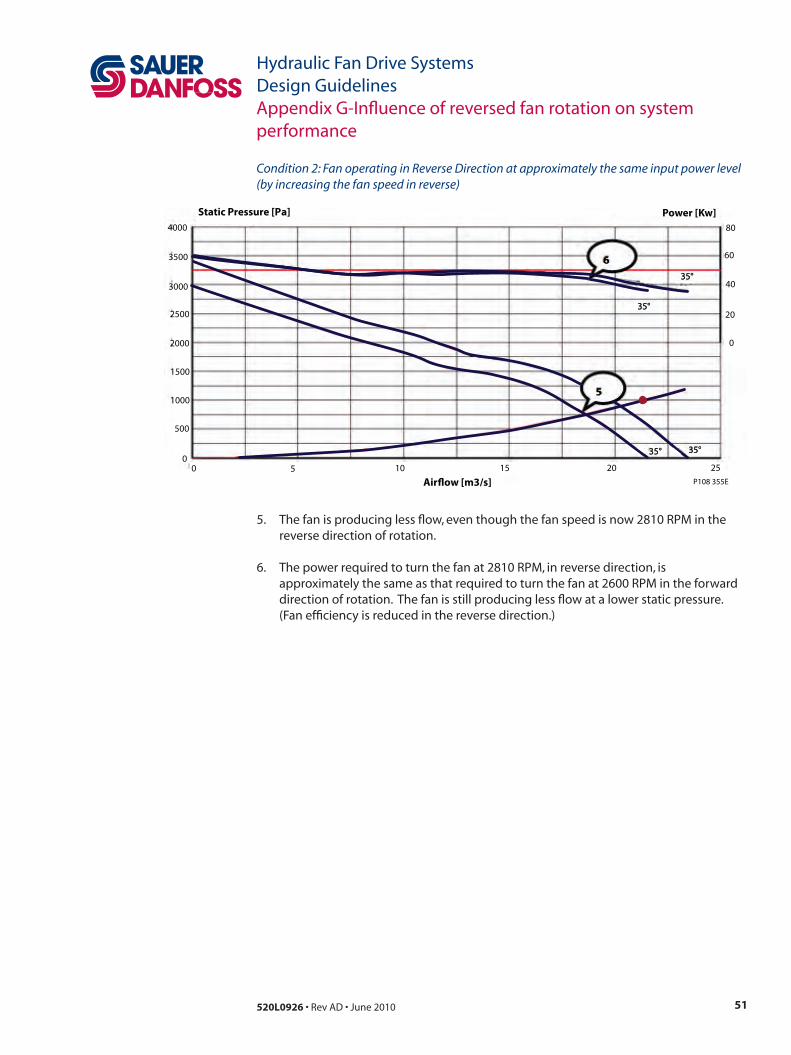
51520L0926 • Rev AD • June 2010
Hydraulic Fan Drive SystemsDesign GuidelinesAppendix G-Influence of reversed fan rotation on system performance
Condition 2: Fan operating in Reverse Direction at approximately the same input power level (by increasing the fan speed in reverse)
P108 355E
Power [Kw]Static Pressure [Pa]
Air�ow [m3/s]
6
5
4000
3500
3000
2500
2000
1500
1000
500
0
80
40
20
0
60
0 10 2015 255
35°35°35°35°
35°35°
35°35°
5. The fan is producing less flow, even though the fan speed is now 2810 RPM in the reverse direction of rotation.
6. The power required to turn the fan at 2810 RPM, in reverse direction, is approximately the same as that required to turn the fan at 2600 RPM in the forward direction of rotation. The fan is still producing less flow at a lower static pressure. (Fan efficiency is reduced in the reverse direction.)
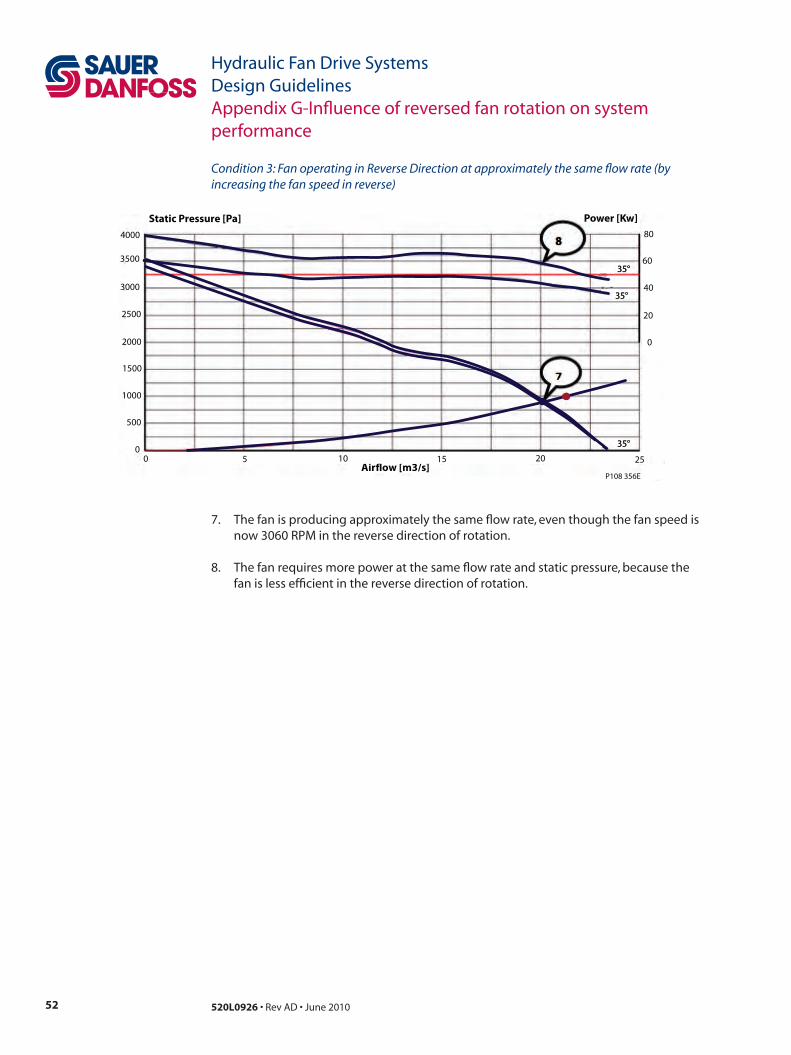
52 520L0926 • Rev AD • June 2010
Hydraulic Fan Drive SystemsDesign GuidelinesAppendix G-Influence of reversed fan rotation on system performance
Condition 3: Fan operating in Reverse Direction at approximately the same flow rate (by increasing the fan speed in reverse)
P108 356E
Power [Kw]Static Pressure [Pa]
Airflow [m3/s]
8
7
0 10 2015 25
4000
3500
3000
2500
2000
1500
1000
500
0
80
40
20
0
5
60
35°35°
35°35°
35°35°
7. The fan is producing approximately the same flow rate, even though the fan speed is now 3060 RPM in the reverse direction of rotation.
8. The fan requires more power at the same flow rate and static pressure, because the fan is less efficient in the reverse direction of rotation.

53520L0926 • Rev AD • June 2010
Hydraulic Fan Drive SystemsDesign GuidelinesAppendix G-Influence of reversed fan rotation on system performance
System Response to Reversed Fan Rotation:
P108 357E
Fan Power as a Function of Ambient Temperature
-20 -10 0 10 20 30 40 50
100%
90%
80%
70%
60%
50%
40%
30%
20%
10%
0%
-5 5 15 25 35 45 55 65 75 85 95 105 115 125
• “Cooling Effectiveness” is proportional to the cooling capacity of the cooler; i.e., the ratio is greater than one when the actual Ambient Temperature is less than the original design Maximum Ambient Temperature (System Design Temperature). When the ratio is greater than 1.0, the cooler will not require as much air flow to satisfy the cooling needs of the system. Therefore, the Fan Power requirement will be less than at the “design” maximum ambient temperature.
• At the “design” Maximum Ambient Temperature, reducing the air flow rate thru the cooler has an equivalent effect of reducing the “Cooling Effectiveness” of the cooler; as such, the two concepts may be equated.
• Therefore, as the air flow rate thru the cooler is reduced (Cooling Effectiveness ≤ 1.0); a new “t actual amb” can be calculated, which will define a new upper limit of ambient temperature where the cooler will still satisfy the maximum heat load.
The new “t actual amb” temperature will be lower than the original Design Maximum Ambient Temperature.

54 520L0926 • Rev AD • June 2010
Hydraulic Fan Drive SystemsDesign GuidelinesAppendix G-Influence of reversed fan rotation on system performance
Derivation:
( )
( )( )
( )
( ) ( )
( ) CCCCT
TTQ
QTT
Therefore
CTCT
Let
TTTTT
andQQ
then
IFTTQ
TTQ
TTCmand
TTCm
CoolantMaximum
Coolant
MaxAmbient
Coolant
A
Maximum
MaxAmbientMaxAmbientCoolant
ActualAmbCoolant
Maximum
MaximumA
CoolantMaximum
CoolantA
Coolantp
CoolantpA
º65.40º50º10018424.01º100*
8424.01
*
,
º50º100
,0.1tionHeat RejectionHeat Rejec
: LetAndrd RPM Forwa2600at Flow se RPM Rever2600at Flow 8424.0
:
bemust Tnew the therefore1.0,bemust
,0.1
and ,0.1tionHeat RejectionHeat Rejec
**
tionHeat RejectionHeat Rejec
**tionHeat Rejec
**tionHeat Rejec
Revin Amb ActualNew
Revin Amb ActualNew Actual
Ambient Actual Maximum
Maximum
ctual
Actual
Revin ActualAmb
Actual
ActualMaximum
ctual
Ambient Actual Maximum
Amb ActualActual
Maximum
ctual
Ambient Actual MaximumMaximumMaximum
Amb ActualActualctual
=−
−−
=
−=
−
==
≡
==
≤≥
−−
≤
≤≡
−
−=
−=
−=
&
&
P108 358E

55520L0926 • Rev AD • June 2010
Hydraulic Fan Drive SystemsDesign GuidelinesAppendix G-Influence of reversed fan rotation on system performance
Suggested Guidelines for Reversing Fan Drive Systems:
IF the desire is to keep the fan speed in the reverse direction the same as in the forward direction:
This will occur automatically, IF the fan drive system is flow limited by pump speed, or displacement; but not IF the system is pressure limited.
• The heat rejected by the cooling system will be less than in the forward direction of rotation,
• The power to drive the fan in reverse will be less than in the forward direction,• The Torque to turn the fan, and therefore the delta pressure across the hydraulic
motor, will be proportional to the power ratio, since the fan speed is the same.
IF the desire is to keep the fan power in the reverse direction the same as in the forward direction:• The Heat Rejection by the system will still be less than in the forward direction, but
better than when maintaining constant fan speed, (HR α Speed Ratio)• The fan speed in reverse will be greater than in the forward direction. The Torque to
turn the fan (and hydraulic delta pressure) will be less than in the forward direction, (Power to turn the fan is the same, but the speed is greater.)
• This condition may define the maximum pump displacement or speed required to satisfy the flow requirements of the fan system, since the flow required to rotate the fan will be larger in the reverse direction than in the forward direction.
• Be sure to validate these conditions with the fan supplier. The new speed requirement may exceed the maximum speed limit.
Tip speed is proportional to the fan rotational speed and internal stresses in the fan are proportional to the square of the fan speed.
IF the desire is to keep the fan flow rate in the reverse direction the same as in the forward direction:• The Heat Rejection by the system will be the same as in the forward direction, • The Power required to rotate the fan in the reverse direction will be greater than
in the forward direction of rotation, because the fan is less efficient in the reverse direction of rotation,
• The fan speed in reverse will be greater than in the forward direction. The Torque to turn the fan (and hydraulic delta pressure) may be greater than in the forward direction, (Power to turn the fan is greater, and the speed is greater.)
• This condition may define the maximum pump displacement required to satisfy the flow requirements of the fan system, since the flow required to rotate the fan will be larger in the reverse direction than in the forward direction.
• Be sure to validate these conditions with the fan supplier. The new speed requirement may exceed the maximum speed limit.
Tip speed is proportional to the fan rotational speed and internal stresses in the fan are proportional to the square of the fan speed.

56 520L0926 • Rev AD • June 2010
Hydraulic Fan Drive SystemsDesign GuidelinesAppendix G-Influence of reversed fan rotation on system performance
Performance Summary: (For Reference Only)
P108 359E
Refer to performance curves in previous graphs

57520L0926 • Rev AD • June 2010
Hydraulic Fan Drive SystemsDesign GuidelinesAppendix H-System considerations for H1 Fan Drives with reversed fan rotation
As was said in Appendix G, in applications where it is necessary to change the direction of fan rotation, most fans will have reduced performance. For fan systems using H1 pumps with the H1 Fan Drive Control Valve, the control valve receives a command from the PLUS+1 Controller to regulate fan speed by changing pump displacement. When the pump speed is at the design “set point”, fan speed required for the desired cooling capacity is determined by the pump’s displacement.
In many systems, the fan’s speed at this condition may be close to its maximum design speed. If the pump speed increases beyond the “set point” and the pump is commanded to maximum displacement; then the fan speed will increase in proportion to the pump speed ratio and the delta pressure across the fan motor will increase in proportion to the square of the pump speed ratio.
To prevent this from happening, the system designer is encouraged to limit the maximum fan speed in each direction of rotation by adjusting the set pressure of the Pressure Limiters for both directions of rotation.
For the forward direction of rotation, determine the delta pressure across the fan motor when it’s at maximum desired fan speed and power. Adjust the pressure limiter setting to be equal to “the forward design pressure + 20 bar” for the forward direction of rotation.
For the reverse direction of rotation, determine the delta pressure across the fan motor when it’s at maximum desired fan speed and power (consult with the fan and cooler manufacturer to determine the desired fan speed and power for the fan when rotating in the reverse direction, reference Appendix G). Adjust the pressure limiter setting to be equal to “the reverse design pressure + 20 bar” for the reverse direction of rotation.
Verify that the pressure limiter settings will not cause the fan speed to exceed the manufacturer’s maximum speed limitation. Make adjustments accordingly.

58 520L0926 • Rev AD • June 2010
Hydraulic Fan Drive SystemsDesign GuidelinesNotes

59520L0926 • Rev AD • June 2010
Hydraulic Fan Drive SystemsDesign GuidelinesNotes

520L0926 • Rev AD • June 2010
sauer-Danfoss mobile Power and Control systems– market Leaders worldwide
Sauer-Danfoss is a comprehensive supplier providing complete systems to the global mobile market.
Sauer-Danfoss serves markets such as agriculture, construction, road building, material handling, municipal, forestry, turf care, and many others.
We offer our customers optimum solutions for their needs and develop new products and systems in close cooperation and partner ship with them.
Sauer-Danfoss specializes in integrating a full range of system components to provide vehicle designers with the most advanced total system design.
Sauer-Danfoss provides comprehensive worldwide service for its products through an extensive network of Global Service Partners strategically located in all parts of the world.
ouR PRoDuCts
Hydrostatic transmissions
Hydraulic power steering
Electric power steering
Electrohydraulic power steering
Closed and open circuit axial piston pumps and motors
Gear pumps and motors
Bent axis motors
Orbital motors
Transit mixer drives
Planetary compact gears
Proportional valves
Directional spool valves
Cartridge valves
Hydraulic integrated circuits
Hydrostatic transaxles
Integrated systems
Fan drive systems
Electrohydraulics
Microcontrollers and software
Electric motors and inverters
Joysticks and control handles
Displays
Sensors
Local address:
Sauer-Danfoss (US) Company2800 East 13th StreetAmes, IA 50010, USAPhone: +1 515 239-6000Fax: +1 515 239-6618
Sauer-Danfoss GmbH & Co. OHGPostfach 2460, D-24531 NeumünsterKrokamp 35, D-24539 Neumünster, GermanyPhone: +49 4321 871-0Fax: +49 4321 871 122
www.sauer-danfoss.com
Sauer-Danfoss ApSDK-6430 Nordborg, DenmarkPhone: +45 7488 4444Fax: +45 7488 4400
Sauer-Danfoss-Daikin LTDShin-Osaka TERASAKI 3rd Bldg.6F1-5-28 Nishimiyahara, Yodogawa-ku,Osaka 532-0004, JapanPhone: +81 6 6395 6066Fax: +81 6 6395 8585
Top Related