


Languages
Pages
Legal

Hox clusters of the bichir (Actinopterygii, Polypterus senegalus) highlight unique patterns of sequence evolution in gnathostome phylogeny
Jeremy D. Raincrow1, Ken Dewar2, Li-Zhi Gao1, Claudia Stocsits3, Sonja J. Prohaska3,4, Ken Dewar5, Chris T. Amemiya6,7, Peter F. Stadler3,4,5,8, Chi-hua Chiu1*
1Department of Genetics, Rutgers University, 145 Bevier Road, Piscataway, NJ 08854, USA
2McGill University and Genome Quebec Innovation Centre, 740 Avenue Doctor-Penfield, Montreal, Quebec HCA 1A4, Canada
3Department of Theoretical Chemistry, University of Vienna, Wahringerstrasse 17, A-1090 Wien, Austria
4Bioinformatics Group, Department of Computer Science, Interdisciplinary Center for Bioinformatics, University of Leipzig, Hartelstrasse 16-18, D-04107 Leipzig, Germany
5McGill University and Genome Quebec Innovation Centre, 740 Avenue Doctor-Penfield, Montreal, Quebec H3A 1A4, Canada
6Benaroya Research Institute at Virginia Mason, 1201 Ninth Avenue, Seattle, WA 98101, USA
7Department of Biology, University of Washington, 106 Kincaid Hall, Seattle, WA 98185, USA
8Santa Fe Institute, 1399 Hyde Park Road, Santa Fe, NJ 87501, USA
*Corresponding author
Chi-hua ChiuDepartment of Genetics, LSB Rm. 222Rutgers University145 Bevier RoadPiscataway, NJ 08854732-445-2563 (office); 5-1147 (fax)[email protected]
1

ABSTRACT
The Hox gene complex of gnathostomes represents a highly constrained genetic system.
The nature of this constraint, however, remains poorly understood. Evidence from shark,
coelacanth, and tetrapods supports that two rounds of whole genome duplications lead to four
clusters (HoxA, HoxB, HoxC, HoxD) in the jawed vertebrate ancestor. They exhibit a striking
degree of conservation in cluster architecture and intergenic noncoding sequences. A third
duplication occurred in the crown group of teleosts producing up to eight Hox clusters. The
duplicated Hox clusters of teleosts show dynamic changes in architecture and accelerated rates of
evolution in both protein-coding and noncoding sequences, rendering comparisons to outgroup
taxa such as human or shark challenging. Using independent strategies including BAC library
screening, homeobox PCR surveys, phylogenetic analyses, and examination of patterns of
conservation of noncoding sequences we provide conclusive evidence that the bichir (Polypterus
senegalus) has four Hox clusters that are orthologous to those of the ancestral gnathostome.
Detailed analyses of patterns of conservation of Hox noncoding sequences and invasions of
repetitive and mobile DNA sequence elements into Hox clusters of bichir and teleosts highlights
a trend towards relaxation of selective constraints acting on actinopterygian Hox clusters that ---
surprisingly --- predates the fish specific genome duplication.
Keywords: Hox, Polypterus senegalus, phylogenetic footprinting
2

INTRODUCTION
Hox genes encode a distinct class of transcription factors that play an essential role in
embryonic patterning (Lewis, 1978; McGinnis and Krumlauf, 1992) and are components of the
strikingly conserved genetic toolkit responsible for the diversity of body plans (Gehring, 1998).
Present evidence suggests that Hox genes originated after the divergence of sponge and
eumetazoan lineages, coinciding with a major evolutionary transition in animal body-plan
complexity (Larroux et al., 2007). With a few notable exceptions such as nematode
(Caenorhabditis elegans, Aboobaker and Blaxter, 2003), tunicate (Oikopleura dioica, Seo et al.,
2004), and platyhelminth (Schistosoma mansoni, Pierce et al., 2005), Hox genes tend to occur in
tightly linked clusters. These display the phenomenon of colinearity, in which the position of a
gene in the cluster is related to its spatiotemporal pattern of expression along the
anteriorposterior (A-P) axis (McGinnis and Krumlauf, 1992; Lufkin, 1996). It is important to
note, however, that the emergence of Hox spatial and temporal colinearity during evolution
remains poorly understood (Galliot, 2005; Monteiro and Ferrier, 2006). Additionally, a proper
spatial expression is observed in several species where Hox clustering is absent (Kmita and
Duboule, 2003).
Protostome taxa possess at most a single Hox cluster. As illustrated in Figure 1, the
vertebrate Hox gene family expanded via whole cluster duplications (Meyer and Schartl, 1999;
Ruddle et al. 1999). Present knowledge suggests that jawless vertebrates (agnathans) such as
hagfish (Stadler et al., 2004) and lamprey (Force et al., 2002; Irvine et al., 2002; Fried et al.,
2003; Prohaska et al., 2006) have at least three Hox clusters, some or all of which may have
originated from lineage specific duplications. Among the jawed vertebrates (gnathostomes,
Figure 1), cartilaginous fishes such as the elephant shark (Callorhinchus milii, Venkatesh et al.,
3
2007), and horn shark (Heterodontus franciscii, Kim et al., 2000; Prohaska et al., 2004) possess
four Hox clusters orthologous to the A,B,C,D clusters shared by the lobe-finned fishes, i.e.
tetrapods (Ruddle et al., 1994) and coelacanth (Latimera menadoensis, Koh et al., 2003), and
lungfish (Neoceratodus forsteri, Longhurst and Joss, 1999). Remarkably, Hox cis-regulatory
sequences are conserved between horn shark and human (Chiu et al., 2002; 2004; Prohaska et al.,
2004), suggesting strong selective constraints acting on gnathostome Hox cluster architecture and
regulation throughout their evolution. In stark contrast, however, investigations on Hox sequence
evolution in the ray-finned fishes, the third major gnathostome clade, demonstrate a unique
plasticity (Chiu et al., 2004; Brunet et al., 2006).
There are more than 23,000 extant actinopterygian species (Nelson, 1994) and, judging
by the degree of anatomical diversity, this lineage may be considered to be the most successful
of all vertebrates (Carroll, 1988). As illustrated in Figure 1, the ray-finned fish lineage
experienced a third round of whole genome duplication (Taylor et al., 2003; Jaillon et al., 2004;
Woods et al., 2005; Brunet et al., 2006; Kasahara et al., 2007) in the crown group of teleosts
circa 350 million years ago (Taylor et al., 2001; Christoffels et al., 2004; Vandepoele et al.,
2004). As a result of this Fish Specific Genome Duplication (FSGD), teleost fishes are the
pinnacle of Hox cluster evolution, with linkage evidence for eight Hox clusters in zebrafish
(Danio rerio, Amores et al., 1998; Woltering and Duston, 2006), and seven in pufferfishes
(Takifugu rubripes, Aparicio et al., 2002; Amores et al,. 2004 and Tetraodon nigrividis, Jaillon et
al., 2004), medaka (Oryzias latipes, Naruse et al., 2000; Kurosawa et al., 2006; Kasahara et al.,
2007), and African cichlid (Astatotilapia burtoni, Hoegg et al., 2007).
Chiu et al., (2004) sequenced the single HoxA cluster of bichir and showed it is mosaic in
its patterns of conservation of noncoding sequences, effectively bridging outgroup taxa (e.g.
4
shark, coelacanth, human) and teleosts that possess duplicate Hox clusters as a result of the
FSGD. In this study we show that bichir has single HoxA, B, C, and D clusters using a
combination of methods. Similarly to the bichir HoxA cluster (Chiu et al., 2004), the HoxB, C,
and D noncoding sequences also show a mosaic pattern, bridging outgroups and teleost fishes.
We show here that the Hox clusters of bichir have been invaded by repetitive and mobile DNA
elements in a pattern that continued to expand in teleosts. This suggests that active DNA
transposition into Hox clusters may serve an important, presently unrecognized, role in
actinopterygian Hox cluster evolution. Taken together, our findings suggest an evolutionary
trend towards relaxation of selective constraints acting on actinopterygians Hox clusters occurred
in the stem lineages prior to the fish specific duplication. This study provides important insights
into the genomic contributions of actinopterygian phenotypic diversity.
5
MATERIALS AND METHODS
Isolation and assembly of bichir (Polypterus senegalus) Hox clusters
Details of the bichir (Polyterus senegalus) BAC genomic library as well as the isolation
and sequencing of the HoxA cluster are provided in Chiu et al., (2004). In general, we screened
the library by either (1) hybridization of the 5 x 5 high density filters (Chiu et al., 2004) and/or
(2) a combination of PCR screening of DNA pools (1 pool = 384 clones; 216 total pools) of the
BAC library and hybridization of a small ‘pool specific’ filter (384 spots). Hybridization using
non-radioactive DIG-labeled probes was done following methods described in (Chiu et al.,
2000). The first screen of this library was carried out using a pool of homeobox sequences
isolated in genome-wide PCR surveys from bichir (Ledje et al., 2002) and coelacanth. This
screen identified four BAC clones of P. senegalus. A PCR survey of each BAC clone was done
using a degenerate homebox primer pair [334, 5’-GAR YTI GAR AAR GAR TTY-3’; 335,
5’-ICK ICK RTT YTG RAA CAA-3’]. One clone contained a portion of the HoxA cluster
(Chiu et al. 2004); one contained the related ParaHox cluster (Mulley et al., 2006); one contained
part of the HoxB cluster (HoxB9 and HoxB10), and the last clone contained part of the HoxD
cluster (HoxD2 and HoxD3).
To find an overlapping HoxB clone, we designed PCR primers specific to bichir HoxB10
exon 1 […..] and PCR screened the library; this identified clone (181G24), which spans
HoxB13-HoxB4 (Figure 2). Using degenerate primers [….], we amplified HoxB2 from bichir
whole genomic DNA, designed bichir HoxB2 specific primers [….], and then PCR screened the
BAC library pools. This yielded clone (192O14), which contains HoxB1 and HoxB2 (Figure 2).
To find overlapping HoxD clones, we amplified evx2 from bichir whole genomic DNA using
6

degenerate primers […], designed bichir specific evx2 primers […], and subsequently PCR
screened the BAC library. This yielded one clone (20M19), which contains evx2 and HoxD12.
Using degenerate HoxD9 primers […], we isolated the bichir HoxD9 gene proper region (Figures
2, 3). PCR screening of the BAC library pools with bichir specific HoxD9 primers and
hybridization of the high density filters failed to find a BAC clone. Using primers specific for
bichir HoxD3 […], we PCR screened the library pools and isolated a second clone (184C8) that
spans HoxD3-HoxD1. BAC clone sequences have been deposited into Genbank with accession
nos. (X).
Hox Cluster Sequences
Hox cluster sequences from a variety of sources were used in this study.
Polypterus senegalus: HoxA= AC126321 and AC132195 as in (Chiu et al., 2004). The
partial HoxB cluster is constructed from the draft sequence of clone L28995 (accession number
AC138147): HoxB13 is located on segment L28995.23, HoxB10 on L28995.7, HoxB8 and
HoxB7 on L28995.17, HoxB5 and HoxB4 are on segment L28995.1. The finished sequence of
clone CLN84 contains HoxD3, HoxD2, and HoxD1. The finished sequence of M19 contains
HoxD12 and evx2.
Homo sapiens: HoxA was combined from clones with Genbank accession numbers
AC004079, AC004080, and AC010990 as described in (Chiu et al., 2002). The other three
clusters were excised from the May 2004, Build 35, of the human genome, downloaded from the
UCSC genome browser (http://genome.ucsc.edu): HoxB = Chr.17: 43,961,813-44,161,040;
HoxC = Chr.12: 52,618,296-52,735,253; HoxD = Chr.2: 176,772,385-176,881,142.
Xenopus tropicalis: Assembly JGI3 release obtained from ENSEMBL
(http://www.ensembl.org) release 36.1b: HoxA = scaff.29: 1,777,789-2,133,531; HoxB =
7

scaff.329: 415,000-1,016,000; HoxC = scaff.280: 199,492-581,365; HoxD = scaff.353: 474,676-
800,000.
Heterodontus francisci: HoxA is a composite of AF479755 and AF224262, HoxD =
AF224263 (Kim et al., 2000).
Danio rerio: HoxAa = AC107364 with several modifications including trimming the first
26,896 and the last 4,176 nucleotides and inserting a C at position 76,071. HoxAb = AC107365
with nucleotide 79,324 changed from T to C to avoid a premature stop codon. HoxBa =
BX297395 and AL645782, which overlap in the HoxB4a locus. HoxBb = AL645798. HoxCa =
BX465864 and BX005254. HoxCb is extracted from the assembly Zv5, ENSEMBL release
31.4d.
HoxDa = BX322661.
Oreochromis niloticus: HoxA = AF533976.
Morone saxatilis: HoxA= AF089743.
Oryzias latipes: AB232918-Ab232924
Tetraodon nigroviridis: sequences were retrieved from the Tetraodon Genome Browser (
http://www.genoscope.cns.fr/externe/tetranew/entry_ggb.html), Aug 2005. HoxAa = Chr.21:
2,878,001-3,153,406; HoxAb = Chr.8: 6,506,471-6,727,504; HoxBa = Un: 37,928,410-
38,293,032; HoxBb = Chr.2: 1,321,876-1,537,033; HoxCa = Chr.9: 4,083,941-4,353,227;
HoxDa = Chr.2: 10,975,763-11,218,409, with deleting a T at position 11,134,740 to stay in
frame; HoxDb = Chr.17: 9,471,355-9,694,740.
Takifugu rubripes}: sequences were downloaded from the Ensembl genome browser
(assembly FUGU 2.0). The HoxAa cluster isconstructed from the entire scaffold 47, the HoxAb}
cluster is constructed from scaffold 330 (Chiu et al., 2002).
8
Latimeria menadoensis Hox clusters will be described in detail in Powers et al (2009). Genbank Accession numbers xxxx.
The sequences will become available in Genbank in the next weeks, I will submit them next week as part of preparing the following paper. Characterization of the HOX cluster sequences in the basal sarcopterygian Latimeria menadoensis, Thomas P. Powers, Jane Grimwood, Jeremy Schmutz, Mark Dickson, TsutomuMiyake, Sonja Prohaska, Gunter P. Wagner, Richard M. Myers, Francis H.Ruddle, Peter Stadler, and Chris T. Amemiya, 2009, in preparation)
Phylogenetic analysis supports bichir has four Hox clusters
Alignments of Hox gene predicted amino acid sequences were done using the clustalW
algorithm in the software package MacVector version 8.1.1 using default settings. Amino acid
alignments were corrected by eye and trimmed so each sequence was of equal length.
Maximum Parsimony trees were created using PAUP* v4.0b10 (Swofford 2003) under
the parsimony optimality criterion. Heuristic searches were performed under default settings.
Node confidence was scored using the bootstrap resampling method with 2000 replicates and
50% cutoff. Neighbor-Joining trees were created using PAUP* v4.0b10 under the distance
optimality criterion using default settings. Node confidence was scored using the bootstrap
resampling method with 2000 replicates and 50% cutoff. Maximum Likelihood trees were
obtained using GARLI v0.951 (Zwick 2006), which can be downloaded from
http://www.bio.utexas.edu/faculty/antisense/garli/Garli.html. Default settings were used unless
otherwise stated below. Starting trees were obtained using heuristic search under the likelihood
optimality criterion in PAUP* v4.0b10, default settings were used. The substitution model was
set to the 2 rate model which corresponds to the HKY85 model. Under the Run Termination
criteria “Bootstrap repetitions” was set to 2,000 and “Generations without improving topology”
was set to 5,000 as suggested in the GARLI manual when using bootstrap repetitions. Node
9

confidence was scored using the bootstrap resampling method and 50% cutoff. Bayesian trees
were obtained using MrBayes v3.1.2 (Ronquist and Huelsenbeck 2003) and the parallel version
of MrBayes v3.1.2 (Altekar et al. 2004). MrBayes settings were as follows: 2 rate substitution
model, relative rate distribution = gamma, number of generations = 1,000,000, sample freq =
1,000, number of chains = 4, and temperature = 0.2. “Burnin” was assessed using the sump
command. Normally the first 1 or 2 trees were discarded as “burnin” before creating the final
consensus tree. Node confidence was scored using the Bayesian posterior probability provided
by the program.
Independent homeobox PCR survey supports bichir has 4 Hox clusters
Whole genomic DNA of was extracted from 80 milligrams of ethanol preserved tissue of
Polypterus senegalus using the Dneasy kit (Qiagen) following the manufacturers’ protocols. This
individual is unrelated to that used for the construction of the BAC genomic library.
PCR amplification of an 81 base pair (bp) fragment of the highly conserved homeobox of
PG1-8 was performed using a degenerate homebox primer pair [334, 5’-GAR YTI GAR AAR
GAR TTY-3’; 335, 5’-ICK ICK RTT YTG RAA CAA-3’]. PCR amplification of an 114
bp fragment of the highly conserved homeobox of PG9–13 was performed using the degenerate
primers [HB913Forward, 5’AAA GGA TCC TGC AGA ARM GNT GYC CNT AYA SNA
A3’; HB113Reverse, 5’ ACA AGC TTG AAT TCA TNC KNC KRT TYT GRA ACC
A3’]. PCR amplifications were performed with AmpliTaq Gold DNA polymerase (Applied
Biosystems) using the following cycling parameters: initial denaturation at 95 °C for 5 min, 30
cycles of 95 °C for 1 min, 50 °C for 1 min, and 72 °C for 1 min, and final extension at 72 °C for
10 min. Final concentration of MgCl2 was 3.5 millimolar. Amplified fragments were purified by
agarose gel extraction (Qiagen) and cloned into a pGEM-T Easy vector (Promega) following the
10
manufacturer’s protocol. Clones containing inserts of the correct size were identified using
colony PCR and sequenced (UMDNJ DNA Sequencing and Synthesis Core Facility). For each
clone, both strands were sequenced using T7 and SP6 sequencing primers. Sequences have/will
be deposited in GenBank (Acc. nos. XX).
The 81 bp and 114 bp long sequences of PG1-8 and PG9-13 homeoboxes, respectively,
were compared with the corresponding sequence fragments from a range of chordates (see
above). The membership of each PCR fragment to one of the paralog groups Hox1-Hox13 was
initially determined based on nucleotide and amino acid sequence similarity to published Hox
sequences using BLAST (Altschul et al., 1997). The second layer of analysis used neighbor-
joining (Saitou and Nei, 1987) trees with deduced amino acid sequences and assigned bichir
PCR fragments based on the subtree in which they are located. With the exception of the
‘middle-group paralogs’ Hox4-Hox7, we find that the paralog-groups are reconstructed as
monophyletic clades.
Quartett mapping (Nieselt-Struwe and von Haeseler, 2001) has been shown previously to
be able to resolve paralog-group membership of chordate Hox gene fragments produced by PCR
surveys (Stadler et al., 2004; Chambers et al., 2008). We use quartm, our own C
implementation of the method. In order to assign the middle group genes, we use the homeobox
fragments from the clusters described above as well as teleost homeobix fragments compiled by
Prohaska and Stadler (2004). For each of the middle group sequences, we first determine QM
support for membership in paralog groups PG4, PG5, and the combination of PG6 and PG7. For
those sequences that are not assigned to PG4, we repeat the analysis, this time testing for relative
support of membership in PG5, PG6, and PG7.
11

The latest version of quartm implements an extension to quintuples. For each query
sequence x, we check for membership in four groups R, U, V, and W, by computing QM support
for each of the six tree topologies
(({x},R)|(U,(V,W))), (({x},R)|(V,(U,W))), (({x},R)|(W,(U,V))),
(({x},(R,U))|(V,W)), (({x},(R,V))|(U,W)), and (({x},(R,W))|(U,V)),
i.e., we determine which assignment of the four paralog groups to R, U, V, W yields the maximal
support for the tree. Ideally, x isplaced together with the same paralog group, say R, three times
andplaced together with the combination of R and one other paralog group in the remaining three
quartets. We first cross-checked the assignment of the middlegroup genes using this technique.
For each paralog group, we then used QM to determine membership to one of the clusters HoxA,
HoxB, HoxC, HoxD. We used the simple QM procedure when known sequences from three
paralog groups are available, and the quintuple version if homeboxes of all four paralog groups
are known. Finally, we used QM to determine whether the bichir sequences associate with one
the duplicated teleost sequences or with the unduplicated tetrapod or shark sequences.
The QM analysis was complemented by the construction of neighbor joining (Saitou and
Nei, 1987} and maximum parsimony (Swofford, 2003) trees from the same datasets.
Phylogenetic footprinting analysis of chordate Hox clusters
Phylogenetic Footprint Clusters (PFCs) were obtained by searching pairwise alignments
of orthologous intergenic regions using criteria outlined in (Chiu et al., 2002). PFCs in this
study were further restricted to an overall 60% identity or the presence of five (5) or more
individual phylogenetic footprints (PFs) (Tagle et al., 1988; Chiu et al., 2002). PFCs that
corresponded to repeat- masked elements were excluded (see below,
http://repeatmasker.genome.washington.edu/).
12

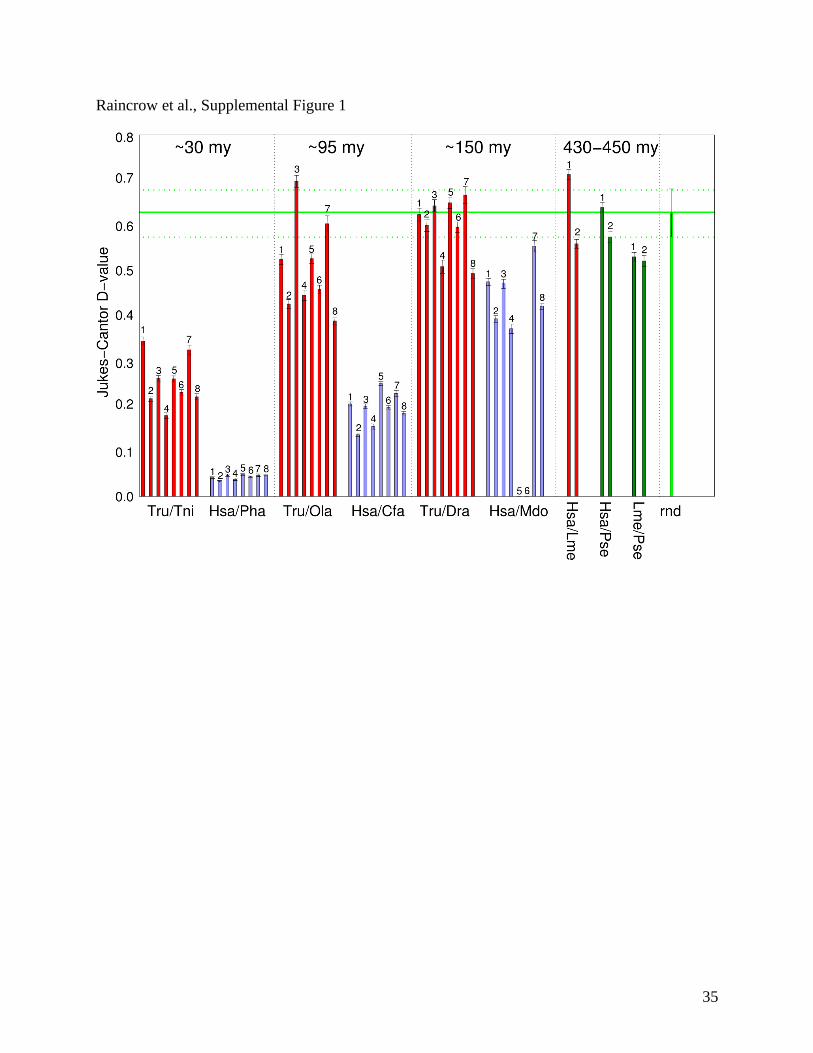
The phylogenetic footprinting method requires sufficient contrast between the foreground
of functional elements and the unconstrained genomic background. Ideally, the background
should be randomized. An additive divergence time of at least 250 million years is suggested for
mammalian taxa (Tagle et al., 1998). To address this, we calculated Hox intergenic distances
between different teleost fishes [Takifugu rubripes, Japanese pufferfish, Tru; Tetraodon
nigroviridis, spotted-green pufferfish, Tni; Oryzias latipes, medaka, Ola; Danio rerio, zebrafish,
Dre] and mammalian proxies with approximately similar divergence dates [Homo sapiens,
human Has; Papio hamadryas, baboon, Pha; Canis familiaris, Dog, Cfa; ), Monodelphis
domesticus, opossum, Mdo] (Suppl. Figure 1). Hox intergenic regions (HoxA13-A11, HoxA5-
A4, HoxB9-B8, HoxB3-B2, HoxC12-C11, HoxC8-C6, HoxD12-D11, and HoxD4-D3 were
aligned for all species using clustalW algorithm in MacVector 9.0. Jukes-Cantor D-values were
calculated from these alignments using Mega version 3.1. The saturation level of the D measure
was determined by aligning randomly selected non-homologous intergenic regions (Suppl.
Figure 1).
To obtain PFCs, pair wise alignments were made between orthologous intergenic regions
of Hox clusters of horn shark, coelacanth, human and tetrapods, bichir, and teleosts using
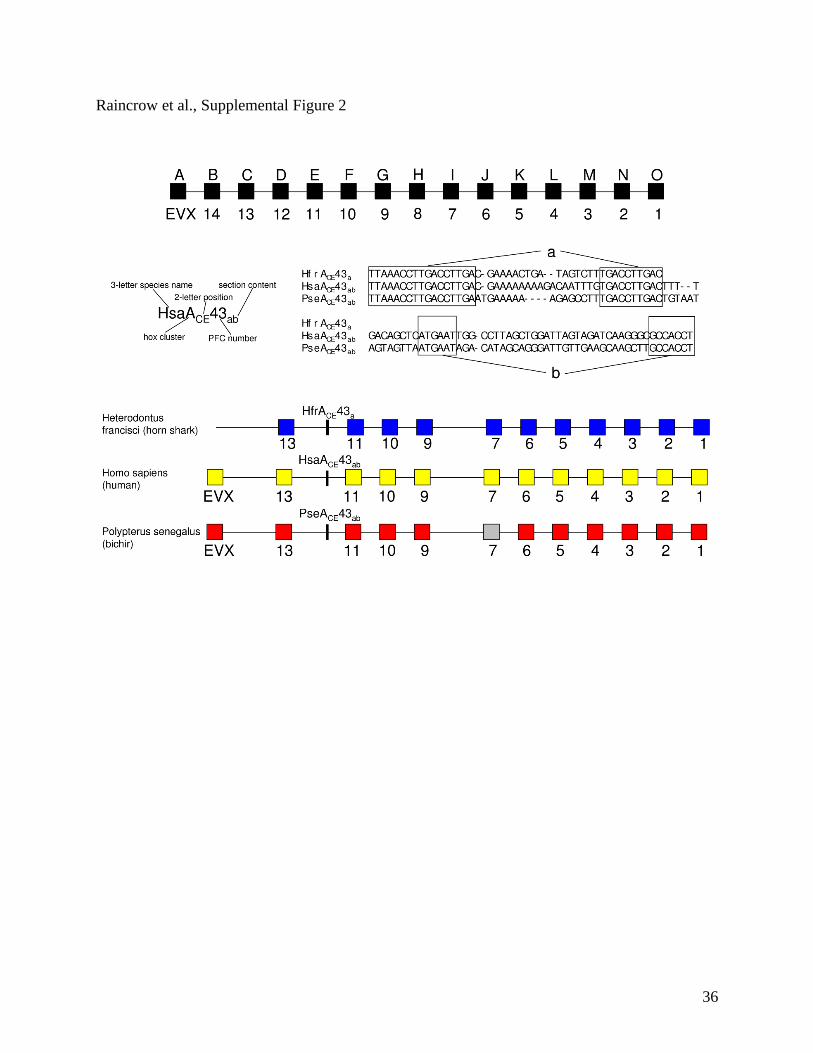
clustalW in MacVector 8.0. As illustrated in Suppl. Figure 2, we propose a nomenclature system
for Hox PFCs that can accommodate the discovery of additional PFCs using the formula:
AdistAB
distAPX +=
Let X = number of new PFCLet P = new PFCLet A = PFC 5’ to PLet B = PFC 3’ to P
13

The PFCs reported here, together with any available annotation, are compiled in a
Database of Gnathostome Hox PFCs, which is accessible from \TODO{\url{***}.
Cloning of PFC fragments of the Bichir and Small Linkages of the HoxC cluster
The PCR survey indicates that bichir has HoxC genes in its genome. Using degenerate
HoxC4 primers, we amplified, cloned, and sequenced the HoxC4 ortholog in bichir (Chambers et
al., 2008). The homeobox sequence of this clone is an exact match to the homebox fragment
assigned as HoxC4 found in the PCR survey (see above). Unfortunately, PCR screening of the
library pools with bichir specific HoxC4 primers […] and hybridization of the high density filters
with the bichir HoxC4 probe did not yield any HoxC cluster containing clones.
We took advantage of our extensive Hox database of conserved non-coding sequences to
build linkages of the HoxC cluster, starting with the bichir HoxC4 gene proper and HoxC13
homeobox sequences isolated in our PCR homeobox survey. We amplified and sequenced two
highly conserved blocks of noncoding sequences in the bichir and then, using long PCR, made
linkages to the HoxC4 and HoxC13 loci. [NOTE: more details need here- get primers, length
of PCR products, etc].
Analysis of repetitive and mobile DNA elements in chordate Hox Clusters
Repeat Masker (RM) analysis of human, zebrafish, and pufferfish Hox clusters was
carried out using human (H. sapiens), zebrafish (D. rerio), and pufferfish (T. rubripes) databases,
respectively. RM analysis of frog and chick Hox clusters was carried out using the human
database (results not shown). RM analysis of shark, coelacanth, and bichir Hox clusters was
carried out using the human, zebrafish, and pufferfish databases. RM analysis of medaka and nile
14
tilapia Hox clusters was carried out using the zebrafish and pufferfish databases.
(http://repeatmasker.genome.washington.edu/).
Excluding simple repeats, we mapped all mobile element (3 classes: DNA transposons,
LTR retrotransposons, and non-LTR retrotransposons (autonomous and non-autonomous)
insertions into and flanking the jawed-vertebrate Hox clusters. The total length in base pairs (bp)
for each class of element (e.g. DNA transposons) was divided by the intergenic length (e.g.
HoxA13-HoxA11) in bp to determine the relative % length. The full dataset is available at our
FTP server (ftp://lifesci.rutgers.edu/chiu-review).
RESULTS
Bichir Hox Clusters
Figures 2, 3 summarize the information on the bichir Hox complement. In line with Chiu
et al., 2004 we find that Polypterus has four Hox clusters that are orthologous to the four
canonical gnathostome clusters (HoxA, B, C, D). We have identified BAC clones that contain
parts of Hox clusters of the bichir. These cover the HoxA cluster, almost the complete HoxB
cluster and two fragments of the HoxD cluster. The sequences are deposited in Genbank under
accession numbers [].
A detailed phylogenetic analysis of full-length gene sequences was performed to confirm
their identity and orthology to known Hox sequences. Figure 4 shows the results for HoxB5,
HoxD1, and the independently cloned HoxC4 sequences. Interestingly, the bichir is the first
actinopterygian reported to have a HoxD1 locus.
A PCR survey for bichir homeoboxes resulted in more than 300 clones of 27 distinct
homeoboxes (Genbank accession numbers …) (Figure 3). To test the reliability of our combined
Quartett-Mapping and phylogenetic analyses, we analyzed homeobox fragments independently
15

from the sequences identified in the BAC library screen, when available (Figure 3). In each ease,
the assigned homeobox identity was identical using independent methods. The same is true for
gene proper sequences of HoxB13, HoxD9, and HoxC4, acquired by PCR amplication of bichir
whole genomic DNA (Figure 3). This lends further credibility to the identity of the remaining
PCR fragments, in particular those predicted to belong to the HoxC cluster (for which no BAC
clones were detected in this study).
Although we do not quite have a complete picture, the Hox gene complement of the
bichir overall matches well with the inferred actinopterygian ancestor (Hoegg and Meyer, 2005;
Prohaska et al., 2006). Not surprisingly, we also observe some lineage-specific gene losses:
besides the HoxA7 pseudogene (Chiu et al., 2004) there is no evidence for a HoxD13 in the BAC
clone of the HoxD cluster that contains evx2 and HoxD12 (Figure 2). We also do not find a
HoxD14 locus, as has been reported in coelacanth (Powers and Amemiya reference) and
amphioxus (reference). So far, only two microRNAs have been identified: the mir-196 paralog
on the HoxA cluster, and the mir-10 paralog on the HoxB cluster.
Analysis of Phylogenetic Footprint Clusters
We have created a comprehensive database of Hox PFCs (Appendix) with a novel
nomenclature system. To create this database HoxA, B, C, and D clusters of cartilaginous
(hornshark), lobe-finned (human, frog, chick, coelacanth), and basal ray-finned fish (bichir) and
their orthologous paralogs HoxAa, Ab, Ba, Bb, Ca, Cb, Da, and Db of teleosts (zebrafish, striped
bass, nile tilapia, medaka, pufferfishes) were pairwise aligned and screened for the presence of
PFCs.
16
We define a PFC as deeply conserved if it is shared between at least two of the following
groups: (1) horn shark, (2) more than two sarcopterygians (lobe-finned fishes), (3) bichir (4)
more than two teleosts. All PFCs were blasted against the expressed sequence tag (EST)
database (http://www.ncbi.nlm.nih.gov/BLAST/). If human or zebrafish contained the PFC then
their sequence was preferentially used to perform the \texttt{blast} search. All PFCs were also
blasted against the Genbank nr database to identify untranslated regions and microRNAs.
Figure 4 shows the deeply conserved PFCs for the four gnathostome consensus Hox
clusters. Consistent with the deuterostome posterior flexibility hypothesis (Ferrier et al., 2000),
there are considerably fewer PFCs in the 5’ (posterior) end of the Hox cluster than in the 3’
(anterior) portion. The sequences identified include several known Hox enhancers (references) as
well as microRNAs (references) associated with the Hox clusters (Figure 4, black bars). Several
of the deeply conserved PFCs fall in annotated UTRs (Figure 4, red bars) or in flanking
sequences within 500 bp of a Hox coding sequence (Figure 4, blue bars). A number of additional
PFCs show homology with ESTs (Figure 4, green bars) and hence are likely expressed. These
may either be part of hitherto unannotated alternative forms of Hox genes, (Hadrys et al., 2004;
Mainguy et al., 2007, Popovic et al., 2008), or belong to non-coding transcripts. Recent studies
have identified a plethora of novel non-protein-coding transcript throughout Hox clusters, some
of which have global regulatory functions within the Hox expression system (Kapranov et al.,
2007, Mainguy et al., 2007, Petruk et al., 2007, Rinn et al., 2007, Sasaki et al., 2007, Lempradl et
al., 2008, Dinger et al, 2008 [PMID:18562676]). We compared the PFCs identified here with
data from two computational surveys of non-coding RNAs using RNAz, a program that
identifies substitution patterns characteristic for evolutionary conserved secondary structure
17
(Washietl et al, 2005). Of the 236 PFCs annotated in Fugu rubripes (pufferfish), 19 (including 6
microRNAs) match ncRNA predictions for fugu (Rose et al., 2008). Of the 144 human PFCs, 28
(including 4 microRNAs) are ncRNA candidates according to (Washietl et al., 2005). 14 of the
135 bichir PFCs correspond to the candidates of at least one of these two screens, including two
microRNAs.
There is considerable interest in the evolution of cis-regulatory elements in ray-finned
fish Hox clusters (references). Due to their small size and modular nature, cis-regulatory
elements may be a frequent target of evolution (reference) and potentially can contribute to
phenotypic diversity (reference). About half of the deeply conserved PFCs found here are
located outside the known Hox transcripts and, based on present knowledge, are non-transcribed
(Figure 4, yellow bars). We consider these to be putative cis-regulatory sequences; these are
prime candidates for experimental approaches to test their possible regulatory functions. We note
that it is possible that PFCs which overlap ESTs may also have cis-regulatory functions. In fact,
several examples of this type are known (e.g. Dlx5/6; Feng:06a).
In order to assess how ``teleost-like'' the bichir Hox clusters are, we consider PFCs that
bichir shares exclusively with non-actinopterygians, Nb and those that it shares exclusively with
teleosts, Nt (Figure 5). Here we find Nb=17 (26%) and Nt =48 (74%). These numbers show a
greater similarity between bichir and teleosts than earlier reported (Chiu et al., 2004). The
discrepancy can be explained, however, by the much larger number of pair-wise comparisons
with teleosts, which effectively increases the sensitivity for detecting bichir-teleost PFCs relative
to sarcopterygians. Normalizing by the number of pairwise comparisons, the fractions of
exclusively shared PFCs become almost equal. Our data therefore confirm the mosaic pattern of
PFCs in the bichir HoxA cluster (Figure 5A).
18

In contrast Figure 5B illustrates that the bichir HoxB cluster is strikingly teleost-like:
even after normalization, 80% of the PFCs are shared exclusively between bichir and teleosts. In
order to check that this extreme bias is not a sampling artefact, we also counted the numbers of
PFCs exclusively shared between human and other non-actinopterygians and between human
and teleosts. After scaling, we find a human/non-actinopterygian association with 74% (HoxA)
and 82% (HoxB). This again emphasizes the conservative nature of outgroup (i.e. non-
actinoptyergian) Hox clusters and the plasticity of actinopterygian Hox clusters.
PFCs exclusive to teleosts are determined as those that are identified between zebrafish
and any of the acanthomorphs, because the members of the latter clade are too closely related for
phylogenetic footprinting. Again using scaled numbers, the fraction of PFCs that are teleost
inventions are 49% in HoxAa, 29% in HoxAb, 71% in HoxBa, and 44% in HoxBb (Figure 5).
Ignoring the ‘b’ paralog clusters (which due to their small number of PFCs contribute little to the
overall statistics), the PFC pattern in zebrafish mirrors that of the bichir, i.e. the HoxAa cluster is
a mosaic of ancestral PFCs and teleost innovations, while the HoxBb cluster dominated by
innovations.
The origin and loss of deeply conserved PFCs can be investigated in straightforward way
using parsimony to infer the edges in a simplified phylogenetic tree. Origination events are
inferred at the edge leading to the last common ancestor of all taxa in which the PFC is observed;
loss events map to the (edge leading to) the root of a maximal subtree in which all taxa have lost
the PFC. Figure 6 summarizes the gain and loss of all HoxA PFCs that are represented in at least
three species. For the other three clusters, PFC data for the bichir are too incomplete for a
meaningful analysis.
19
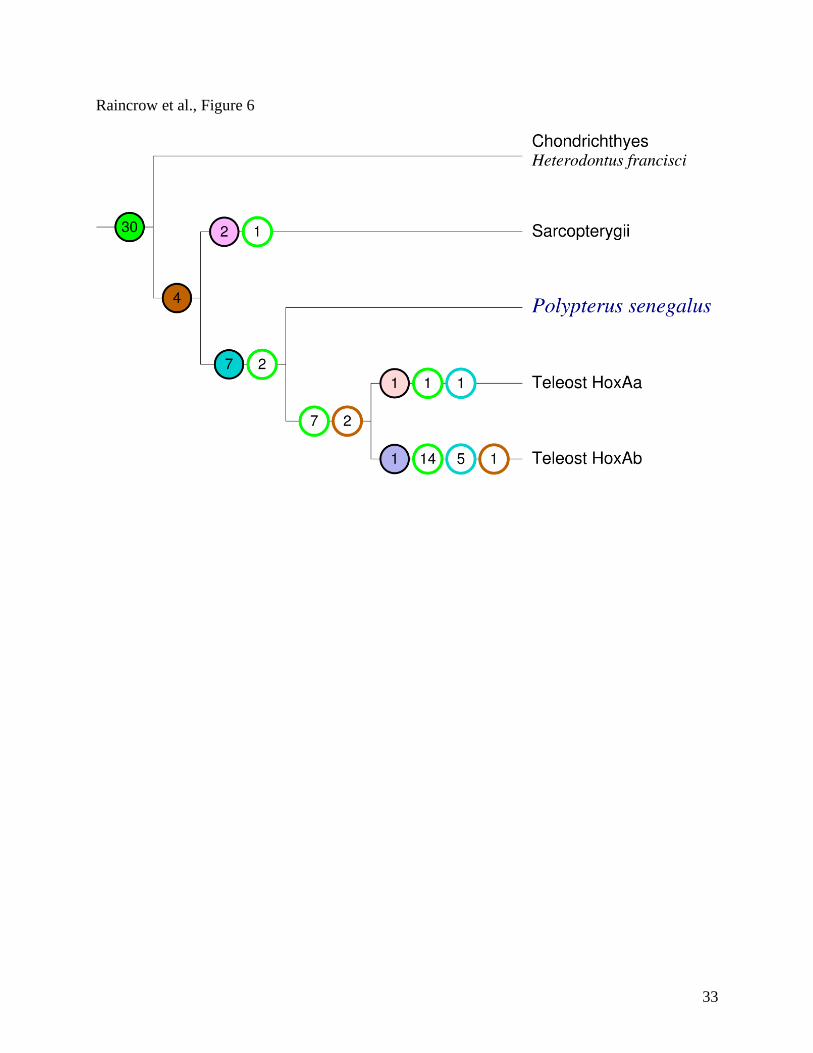
As shown in Figure 6, there are at least 30 PFCs whose origin pre-dates the divergence of
the HoxA clusters in the three major gnathostome lineages. Significant differential loss is
observed, with most of these PFCs absent in the teleost HoxAb cluster. Bichir does not appear to
have lost any of the gnathostome or bony-fish PFCs. The teleosts, on the other hand, have lost 7
of the gnathostome PFCs and 2 of the bony-fish PFCs before the FSGD. The HoxAa cluster is
much more conservative than the HoxAb cluster, which appears to be very degenerate in its PFC
content, having lost 14 gnathostome PFCs, 1 bony-fish PFC, and 5 ray-finned fish PFCs after the
FSGD. All seven actinopterygian-specific innovations pre-date the divergence of bichir and the
teleosts. In contrast, teleosts did not conserve any PFCs that were gained after the divergence of
bichir and teleosts. Finally, the zebrafish Hox clusters retain a larger number of PFCs with non-
teleosts than the acanthomorphs.
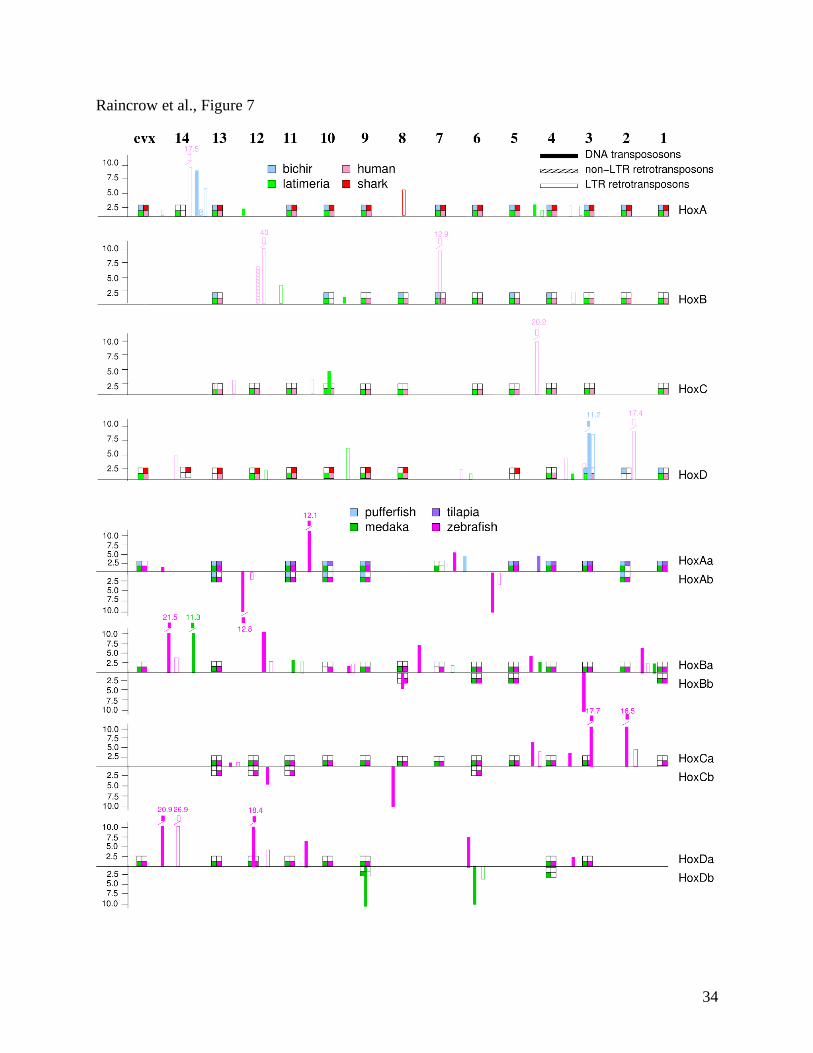
Repetitive Elements
Repetitive elements are known to be dramatically depleted in the core of vertebrate Hox
clusters compared to the regions the regions up-stream and down-stream of the cluster (Wagner
et al. 2006; Stadler paper). Our results show that DNA transposons have not invaded the Hox
clusters of shark and tetrapods (human, chick, frog) (Figure 5A) and, in general, the Hox clusters
of these taxa have been minimally invaded by LTR and non-LTR retrotransposons. Interestingly,
the human Hox clusters have been invaded by several Alu and SINE elements (pink bars, Figure
5A) and these contribute significantly to intergenic distances (e.g. between HoxB13 and HoxB9,
Figure 5A). In contrast, Fig. 5A shows the Hox clusters of coelacanth (green bars) and especially
bichir (blue bars) have been invaded by mobile elements of all three classes, the majority of
which are DNA transposons. The most striking finding of this study is the dramatic expansion of
the pattern already emerging in bichir of invasion of DNA transposons into duplicated Hox
20
clusters of derived teleosts (Figure 4B). Non-LTR retrotransposons also have invaded the Hox
clusters of teleost lineages. Insertions of mobile elements show cluster and lineage specific
patterns; of the latter, zebrafish and medaka have a large number of insertions while pufferfishes,
with secondarily compacted genomes, do not.
DISCUSSION [***needs to be expanded upon]
Using independent strategies including BAC library screening, homeobox PCR Surveys
phylogenetic analyses of full length genes, and the examination of patterns of conservation of
noncoding sequences we have demonstrated that the bichir (Polypterus senegalus) has four Hox
clusters that are orthologous to those of the ancestral gnathostome. Our results thus confirm the
conclusion of previous work, which was based solely on a comparative analysis of the HoxA
cluster (Chiu et al., 2004). Our data further reveal that the Hox gene complement of the bichir
matches the expectations for a basal lineage, e.g., retention of the HoxD1 gene, which has been
lost in all sequenced teleosts. On the other hand, there are a few lineage-specific gene losses.
Gnathostome Hox clusters contain a substantial number of deeply conserved noncoding
sequence elements (Chiu et al., 2002, 2004; Santini et al., 2003; Prohaska et al., 2004) which we
have investigated here by means of phylogenetic footprinting. This system of putative regulatory
control elements shows surprisingly little variation between sharks, coelacanth, and tetrapods,
while it has been heavily restructured in teleost genomes. Indeed, functional cis-regulatory
elements have continually originated in teleosts, as shown for the HoxA2 enhancers in
acanthomorph fishes (Tumpel et al., 2006). Teleosts have lost many of the deeply conserved
ancestral PFCs, and acquired a large number of lineage-specific novel PFCs.
21

Our analysis shows that this process has started well before the FSGD. In fact, many of
the innovations are specific to actinopterygians, and few if any PFCs originated between the
divergence of the bichir for the other actinopterygians and the radiation of the crown teleosts in
the wake of the FSGD. This is consistent with a previous analysis of the bichir HoxA cluster that
attested a trend of mosaicism in the retention of PFCs compared to non-ray finned fish and
teleosts (Chiu et al., 2004).
Taken together, the increased rate of intergenic sequence evolution, the elevated level of
mobile element insertions, the loss of ancestral PFCs, and the innovation of a large number of
novel PFCs implies a relaxation of evolutionary constraints in actinopterygian Hox clusters. This
trend started already before the divergence of bichir and teleosts and has continued in linage-
specific way in teleosts. It therefore appears that the FSGD is not the cause for the relaxation of
constraints, on the contrary its success, eventually spawning the most diverse group of
vertebrates, may well be the consequence the less rigid selection of Hox cluster organization at
the base of the ray-finned fish clade.
Acknowledgments
This work was funded, in part, through grants from National Science Foundation (Grant MCB
0447478 to C.-h.C.), and the Bioinformatics Initiative of the Deutsche Forschungsgemeinschaft.
22
FIGURE LEGENDS
Figure 1. General framework of actinopterygian phylogenetic relationships as supported in
recent hypotheses based on molecular data (Venkatesh et al., 2001; Inoue et al., 2003; Le et al.,
2003; Kikugawa et al., 2004).
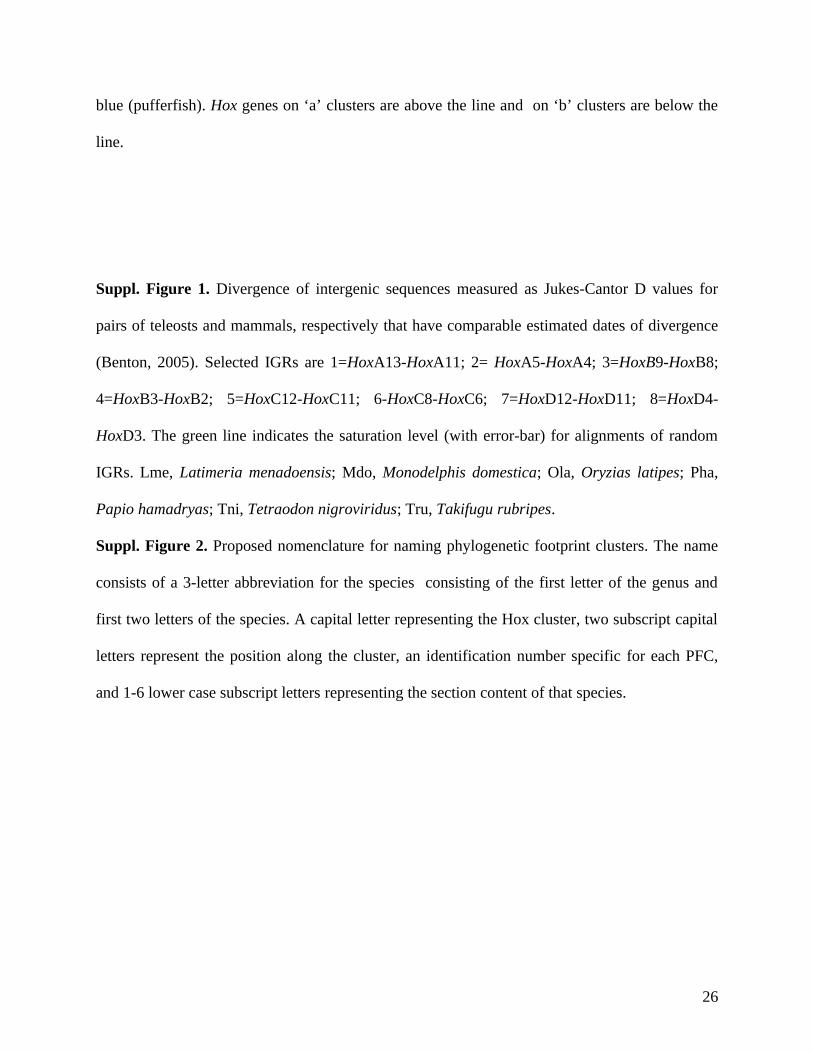
Figure 2. Hox clusters of the bichir (Polypterus senegalus).. Gene symbols indicate the evidence
for its presence. Dotted outlines indicate (Hox) genes that are present in (some) teleosts but have
not been identified in the bichir so far. Lines indicate linkage. The dotted line in HoxB and HoxD
clusters indicates that the BAC clone sequences are not finished, full lines indicates linkage on a
contig. A bullet indicates PCR clones whose assignment is corroborated by additional genomic
DNA. Genes for which only PCR clones are available are shown only when their identity is
strongly supported by quarttet mapping and phylogenetic analysis.
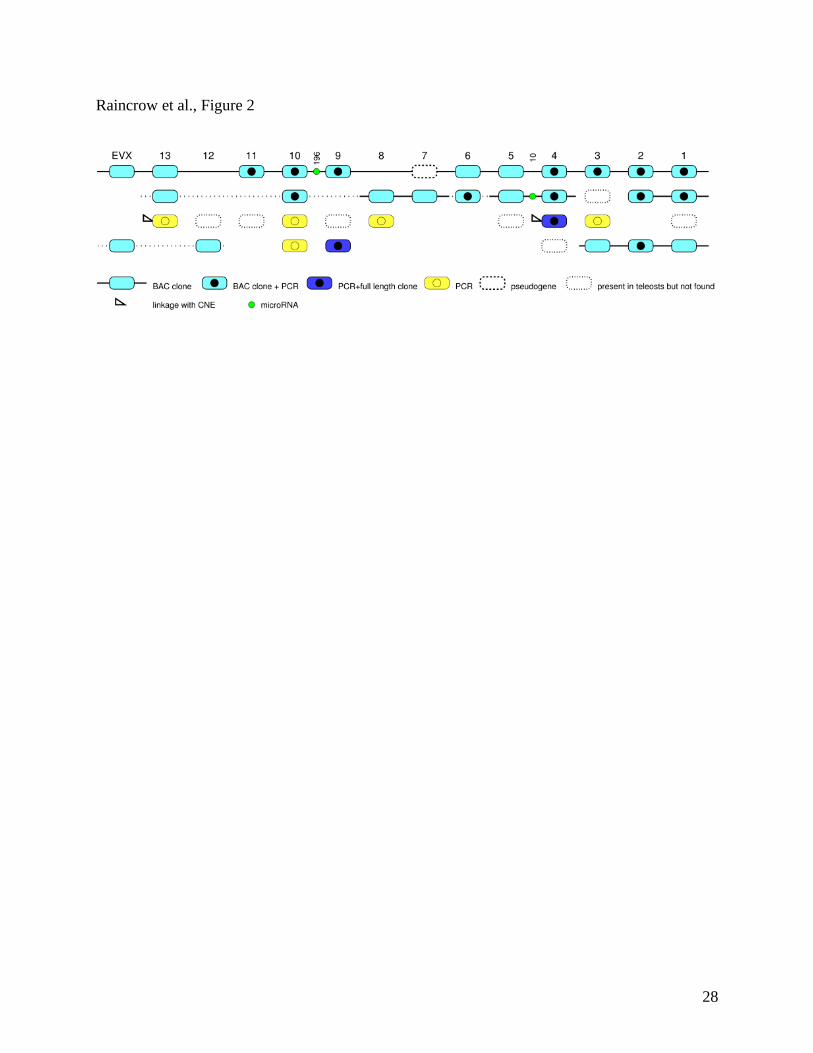
Figure 3. Gene trees of HoxB5 (A), HoxC4 (B), and HoxD1 (C) orthologous sequences. For
each figure, the blue arrow indicates the ortholog of bichir (Polypterus senegalus, Pse). In Figure
2A and 2B, bichir has a single ortholog that branches prior to the duplication event that produced
‘a’ and ‘b’ paralogs in teleost fishes such as zebrafish (Dre) and fugu (Tni). In Figure 2C, bichir
has a HoxD1 ortholog, the first HoxD1 ortholog discovered in the ray-finned fish clade. HoxD1
is absent in all teleost fishes examined to date and was originally hypothesized to have been lost
in the actinopterygian ancestor. Tree constructed from nucleotide sequences using Bayesian
methods (1000000 generations). Species abbreviations: Aca, (Amia calva, bowfin); Aro,
(Anguilla rostrata, eel); Dce, (Dorosoma cepedianum, shad); Dre, (Danio rerio, zebrafish); Hal,
23

(Hiodon alosoides, goldeye); Hfr, (Heterodontus franscisci, horn shark); Hsa, (Homo sapiens,
human); Lme, (Latimeria menadoensis, coelacanth); Mat, (Megalops atlanticus, tarpon); Ola,
(Oryzia latipes, medaka); Omy, (Onkorhynchus mykiss, trout); Oni, (Oreochromis niloticus,
tilapia); Psp, (Polyodon spathula, paddlefish); Sal, (Scaphirhynchus albus, sturgeon); Ssa,
(Salmo salar, salmon), Tni, (Tetraodon nigroviridis, Spotted green pufferfish}, Tru, (Takifugu
rubripes, Japanese pufferfish); Xla, (Xenopus laevis, African clawed frog); Xtr, (Xenopus
tropicalis, pipid frog).
Figure 4. A map of the locations of deeply conserved phylogenetic footprint clusters (PFCs) on
reconstructed gnathostome ancestor HoxA, B, C, D clusters. Black boxes denote Hox genes;
open boxes denote Hox genes that are found in only a single extant gnathostome to date.
Annotated elements: HoxC8 early enhancer (Shashikant et al., 1995), HoxA5 MES enhancer
(Larochelle et al., 1999) , HoxD4 RARE (Morrison et al., 1996), HoxA4 RARE (Doerksen et al.,
1996), HoxA2 enhancer (Nonchev et al., 1996), mir-196b (Yekta et al., 2004), mir-196-2
(Berezikov et al., 2005).
Figure 5. A schematic Hox cluster with gene content and PFC distribution. Figure 5A shows the
HoxA clusters of human and bichir and the HoxAa and HoxAb clusters of zebrafish. The large
pie diagram to the right of each name displays the PFC content. The numbers of PFCs were
scaled based on the number of pairwise alignments performed for each category. The individual
pie diagrams along the cluster describe the PFC content for each particular intergenic region.
Figure 5B shows the HoxB cluster of human, the partial HoxB cluster of bichir, and the HoxBa
and HoxBb clusters of zebrafish.
24

Figure 6. Gain and loss of PFCs in the gnathostome HoxA cluster. Solid circles denote
acquisition of a new PFC in that lineage, open circles indicate losses, shown separately for
acquisitions on different edges (coded by matching colors). Here we count only PFCs that are
conserved between at least three species. In particular, there is no apparent gain of any PFCs at
the base of the teleos clade but there is evidence of 7 new PFCs gained before the divergence of
bichir at the base of the ray-finned fish clade.
Figure 7. Map of mobile element insertions into jawed vertebrate Hox clusters. The single Hox
cluster of amphioxus is shown at the top with paralog groups indicated. The corresponding
paralog groups are shown for Hox clusters of jawed vertebrates. Each jawed-vertebrate species
is color coded: horn shark (red); human (pink); coelacanth (green); bichir (blue). Retention of the
paralog group is indicated by presence of color corresponding to species. Rel % length (see
Methods) of mobile elements detected using Repeat Masker are depicted as solid bars (DNA
transposons), cross-hatched bars (LTR retrotransposons), and open bars non-LTR
retrotransposons). Bars are color coded according to species.
(A). Map of mobile elements (shown in rel % length) invading Hox clusters of jawed vertebrates
that retain the ancestral four clusters (A, B, C, D). Bars are color coded: red (shark), pink
(human), green (coelacanth), blue (bichir).
(B). Map of mobile elements (shown in rel % length) invading composite duplicated Hox
clusters of teleosts. Bars are color coded: magenta (zebrafish), green (medaka), purple (tilapia),
25
blue (pufferfish). Hox genes on ‘a’ clusters are above the line and on ‘b’ clusters are below the
line.
Suppl. Figure 1. Divergence of intergenic sequences measured as Jukes-Cantor D values for
pairs of teleosts and mammals, respectively that have comparable estimated dates of divergence
(Benton, 2005). Selected IGRs are 1=HoxA13-HoxA11; 2= HoxA5-HoxA4; 3=HoxB9-HoxB8;
4=HoxB3-HoxB2; 5=HoxC12-HoxC11; 6-HoxC8-HoxC6; 7=HoxD12-HoxD11; 8=HoxD4-
HoxD3. The green line indicates the saturation level (with error-bar) for alignments of random
IGRs. Lme, Latimeria menadoensis; Mdo, Monodelphis domestica; Ola, Oryzias latipes; Pha,
Papio hamadryas; Tni, Tetraodon nigroviridus; Tru, Takifugu rubripes.
Suppl. Figure 2. Proposed nomenclature for naming phylogenetic footprint clusters. The name
consists of a 3-letter abbreviation for the species consisting of the first letter of the genus and
first two letters of the species. A capital letter representing the Hox cluster, two subscript capital
letters represent the position along the cluster, an identification number specific for each PFC,
and 1-6 lower case subscript letters representing the section content of that species.
26

Raincrow et al., Figure 1
27
Raincrow et al., Figure 2
28
Raincrow et al., Figure 3
29

Raincrow et al., Figure 4
30

Raincrow et al., Figure 5a
31

Raincrow et al., Figure 5b
32
Raincrow et al., Figure 6
33
Raincrow et al., Figure 7
34
Raincrow et al., Supplemental Figure 1
35
Raincrow et al., Supplemental Figure 2
36
Top Related