


Languages
Pages
Legal

How To Write a Lab Report
Updated: 2012 with facts from
www.rapiniscience.com/.../labreportreferenceguide.ppt

The Parts
• Cover Sheet• Abstract- not included in ours• Introduction (Objective/Purpose/ Hypothesis)
• Materials• Methods• Results (data, tables graphs)• Discussion/Analysis• Conclusion

Cover Sheet
• This is the first page of your lab.
• It should contain – lab title– your name, and lab partner’s name– the date due, – your class period– Teacher name– Picture relevant to lab

Example
All About Me LabAll About Me Lab
Ms. Gumina
Lab Partner: Name
Biology 1-2 Period 11
October 3, 2008

Introduction (Objective/Purpose)
• Intro: Brief summary of experiment (purpose, what you found, conclusion)– Objective:
• Usually given to you..
• What are you doing in this lab… why are you doing it?
ExampleExample: The purpose of the “All About Me” lab was to
demonstrate understanding of the parts of the microscope by observing/illustrating human tissue samples.
What are you doing…
How are you doing it…
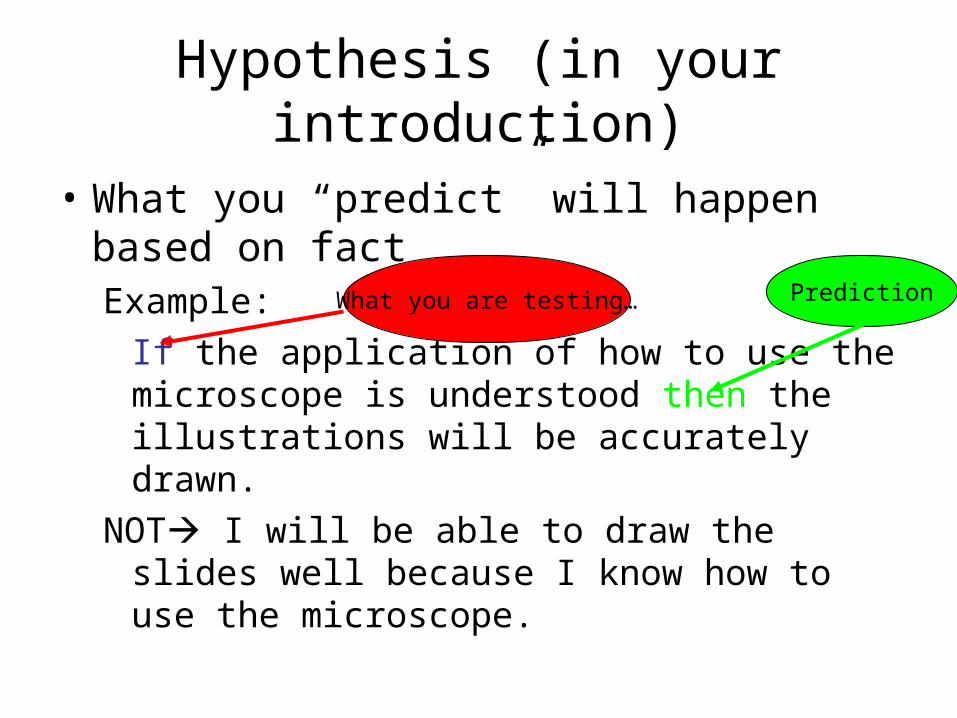
Hypothesis (in your introduction)
• What you “predict” will happen based on factExample:
If the application of how to use the microscope is understood then the illustrations will be accurately drawn.
NOT I will be able to draw the slides well because I know how to use the microscope.
What you are testing… Prediction

Intro
• Also contains research about the topics… use citations to support what you are saying
• This is textbook information not narrative!
• What was the experiment about?
• Why was it done and what did you find?

Format of Intro• Paragraph 1- purpose and objectives• Next few paragraphs: background info on sensory
information and how the body transmits and processes it
• Next paragraph: briefly what you did in part A and hypothesis
• Next para: briefly what you did in part B and hypothesis
• Next Para: briefly what you did in part C and hypothesis
• Second to last para: tell me the what you found for each part (meaning which was most sensitive for each part)
• Last para: restate purpose and objective.

Materials
• Usually given to you on lab sheet– What you needed for the lab– In list formation
Example:Materials: Human tissue slides (bone, skin, squamous,
muscle, blood, hair) Compound microscope Lab sheet Colored Pencils

MATERIALS)
• Make sure that materials are very specific• Poor Example : Roses, soil, water, fertilizer• Good Example:
1. 150 red rose plants (same species) each 2 feet tall2. 150 identical 5 gal buckets with 3 holes in the bottom3. 10 bags of Home Depot brand potting soil (20 lbs.)
4. Miracle Grow fertilizer5. VitaGrow fertilizer6. Water7. Graduated cylinder to measure water8. Grow lights or green house9. Yard stick

Methods (procedure)
• Step by step, numeric • Exactly what you did
– Be able to copy your design with same results
• No analysis or results, just what you did• You can list them, but in numeric order
– What YOU did– Should be able to copy experiment with same results
Procedure
• STEP by STEP
• Someone can do your lab using YOUR steps and get the same results!

• GoodExample:
1. Fill 150 buckets with potting soil to within one inch of the top.
2. Plant one plant in each bucket so that all of its roots are covered with potting soil.
3. Water each plant with 1 liter of tap water.
4. Divide the plants into 3 equal groups of 50 plants each, groups A, B and C
• Poor Example:
1.Plant roses, some with fertilizer, some without
2.Water roses3.Set plants under
grow light4.Count number of
flowers

Results
• This is your raw material– Do not say Do not say whywhy you think something happened you think something happened
• Tables, charts (refer to them and describe them)• Calculations
Example: The bone tissue was found to have a purple tint and have a circular pattern with various striations.

How to do Sample Calculations
• Your data is in a table
• Under each table you have a section titles “Sample Calculations” where you give the formulas used AND show the work for one of the times you used it…
• Ex:Calculating the percent saturation of dissolved oxygen
For Lake Surprise: (7.8ppm * 1) = Corrected D.O.

DETERMINE the VARIABLES:
• Variables (in general)– the parts of an experiment that could vary or CHANGE.
1. Independent Variable (the cause)
2. Dependent Variable (the effect)
3. Controlled Variables or Constants (stay the same)

Graphing Data
• Each graph should have a title that describes what the graph is about
• When graphing data, the independent variable always goes on the X axis, and the dependent variable always goes on the Y axis. .
• Each axis of the graph should be marked off in equal units and properly labeled.
• In general, use a line graph when both axes are the set of real numbers. Ex. Time, temperature, height, weight.
• In general, use a bar graph when one or both of the axes are not the set of real numbers. Ex. Different kinds of roach spray, people.
Discussion
• InterpretInterpret your results
• ReflectReflect back to hypothesis– Supported or rejected?
• Any mistakes?
• How could you have improved what you did

Conclusion
• First Paragraph– Contains your purpose for lab– Hypothesis– Results– Short and sweet
• Second Paragraph +– Thorough analysisanalysis of your collected data should be
made. – Any comparisons should be analyzed here. – Discuss findings and describe any observations.– Answer the pre-post lab questions in paragraph form
• Do so when explaining your results… not just answering them in sentences

Conclusion
– What went wrong?• Why? Mechanical? Human error?
• Do NOT restate procedures but EXPLAIN what you observed/data.

Conclusion
SOURCES OF ERROR: Every time that you do an experiment, errors may occur. It is more important that you identify errors that you think could have affected the conclusion that you drew.
Poor Example: I didn’t always measure accurately. Some plants may have gotten a little more water that the others. We had a lot of cloudy days which meant less light.
Good Example: It was discovered that in the green house, some of
the plants were shaded for part of the day while others got full sun. Those that got full sun produced more flowers.
Some of the plants became infested with tiny insects. These plants did not produce as many flowers as the others. Spraying with an insecticide could prevent this issue from occuring.

Conclusion
The purpose of this experiment was to demonstrate understanding of the parts of the microscope by observing/illustrating human tissue samples. It was found that accurately drawing images found in the F.O.V. was possible using proper microscope techniques.
In the analysis of the human bone tissue it was found that the sample was purple with long striations. This may be due to the coloring the manufacture used when staining. The striations may be evidence of areas of growth.
The hair sample was not accurately drawn because the fine adjuster was sticking and it was not possible to adjust it any better.

Citation Page
• APA format

Important Facts
• No we, he she, they!! (pronouns)– Passive voice (objective tone), past tense!
• Number your pages (not cover page)
• Reference your data if needed
• DO NOT plagiarize
Top Related