


Languages
Pages
Legal


How to Size VSD Air Compressors
Sponsored by
For your free subscription, please visit www.airbestpractices.com/magazine/subscription.
Tim Dugan, P.E., Compression Engineering CorporationKeynote Speaker

For your free subscription, please visit www.airbestpractices.com/magazine/subscription.
The recording and slides of this webinar will be made available to attendees via email later today.
PDH Certificates will be e-mailed to Attendees within two days.
Sponsored by
Tim Dugan, P.E., Compression Engineering CorporationKeynote Speaker
How to Size VSD Air Compressors
Handouts
Engineering Services 2017
▪ Energy analysis services:
For industrial compressed air, process vacuum, pneumatic
conveying, process pumping, industrial process cooling and other
similar electric motor-driven rotating machinery systems:
o Walk-through and development of potential opportunities and
solutions
o Energy efficiency measure selection
o Data-logging
o Data-reduction
o Analysis and simulation
o Project budgeting
o Report writing
o Peer review
o Commissioning
o Inspection
o Re-tuning/re-commissioning
o Energy management
▪ Project technical services:
o Control system specification
o P&ID development
o Equipment layout and piping design
o Ventilation design
o Submittal review
o Commissioning
▪ Miscellaneous services:
o Performance testing
o Tuning and re-tuning
o Leak assessments
o Remote monitoring of key performance indicators
o Project management
o System start-up assistance and trouble-shooting
o Standards and procedures development
o Training

All rights are reserved. The contents of this publication may not be reproduced in whole or in part without consent of Smith Onandia Communications LLC. Smith
Onandia Communications LLC does not assume and hereby disclaims any liability to any person for any loss or damage caused by errors or omissions in the material contained herein, regardless of whether such errors result from
negligence, accident, or any other cause whatsoever.
All materials presented are educational. Each system is unique and must be evaluated on its own merits.

For your free subscription, please visit www.airbestpractices.com/magazine/subscription.
Tim Dugan, P.E.Compression Engineering Corp.
• President and Principal Engineer of Compression Engineering Corporation
• Over 25 years of experience in the industry
About the Speaker
Sponsored by
How to Size VSD Air
Compressors
Tim DuganCompression Engineering Corp.
For Compressed Air Best Practices® Magazine
1-25-18
Presentation is property of Compressed Air Best Practices® Magazine
Do not copy or distribute without permission

Outline
• Why Install a Single VSD Compressor
• Data-Logging Flow
• Analyzing Flow Data, 2 Examples
• Matching Compressor to Data
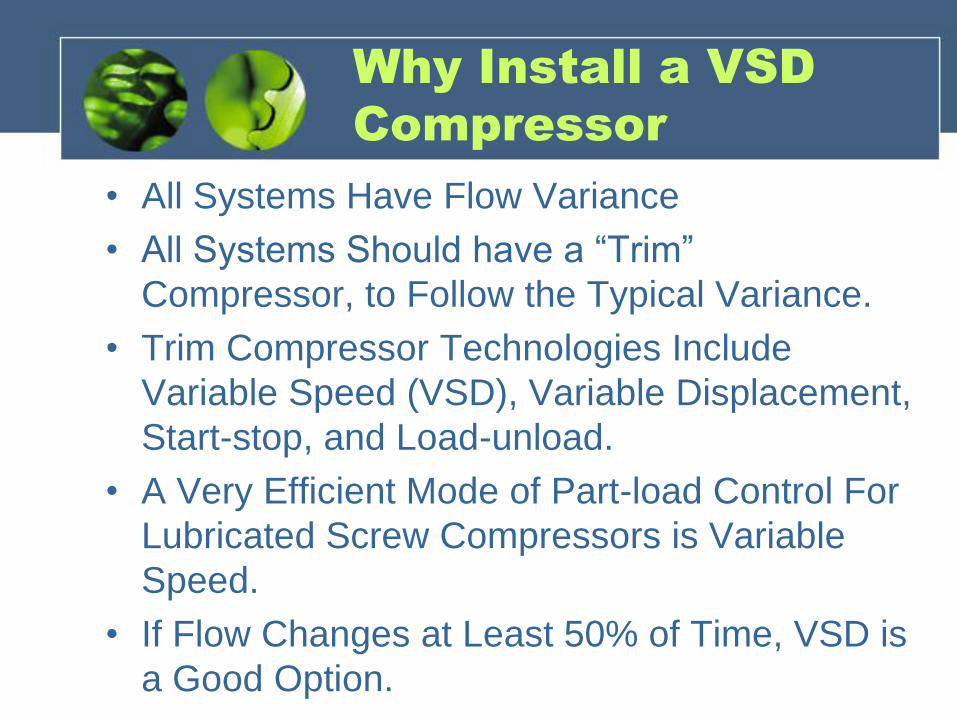
Why Install a VSD
Compressor
• All Systems Have Flow Variance
• All Systems Should have a “Trim”
Compressor, to Follow the Typical Variance.
• Trim Compressor Technologies Include
Variable Speed (VSD), Variable Displacement,
Start-stop, and Load-unload.
• A Very Efficient Mode of Part-load Control For
Lubricated Screw Compressors is Variable
Speed.
• If Flow Changes at Least 50% of Time, VSD is
a Good Option.

Data-logging Flow
• Method 1: Flow Metering
• Method 2: Amp-logging and Calculate
Flow
• Flow Metering is More Accurate, Less
Complicated Analysis, & Fewer Arguments
• Amp-logging is Less Intrusive, no Shut-
down or Hot-tap Required

Data-logging Flow
• If You Flow Meter, Put One Meter After Your
Dryer, Thermal Mass Recommended
• If You Amp log, Measure All Compressors
Concurrently, with Pressure
• Amp to Flow Correlation - Depends on
Compressor Controls
• Amp / Pressure Scatter Plots to Confirm Controls
• Flow Calculation Column
• Log for at Least a Week, 1-minute Sample Rate
or Finer (1/4 of Cycle Rate)

Metering Equipment
• Flow Metering:
• 1-2” Pipe: In-Line
• >2” Pipe: Insertion
• Thermal mass (cheaper), After Dryer(s)
• DP, Vortex, and Other Types for Before
Dryers
• Clamp-on Meter, Thermal Mass

Metering Equipment
• Current Metering:
• Clamp-on CTs for All Compressors
• Discharge Pressure Transducer
• Data Logging:
• 4-20mA Loops
• Data Logger
• Some Flow Meters Data-log Internally

Simplified Analysis –
Example 1, Low Flow
• Open the “.csv” File in
Excel
• Click on Date/time
Header.
• Shift-Arrow to Right to
Highlight Top of Flow
Column.
• Shift-Ctrl-Arrow Down to
Highlight All Time/Date &
Data

Example 1 - Ctd
• Insert Chart – Scatter With Smooth Lines

Example 1 - Ctd
• Insert Trendline – Moving Average (Make it
Black)

Conclusions,
Example 1
• Original (& Anecdotal) Data Seemed to Indicate
High Flow.
• Average Logged Data Shows Low, Flat Flow.
• Low Demand Scenarios Often Have an
Unpredictable Peak.
• In This Case, Peak was Real, Infrequent, &
Unknown Magnitude.
• Oversizing for Estimated Peak Would Put VFD
Compressor at Min Load 99% of Time.
• Not the Best Application for a Single VFD
Compressor.
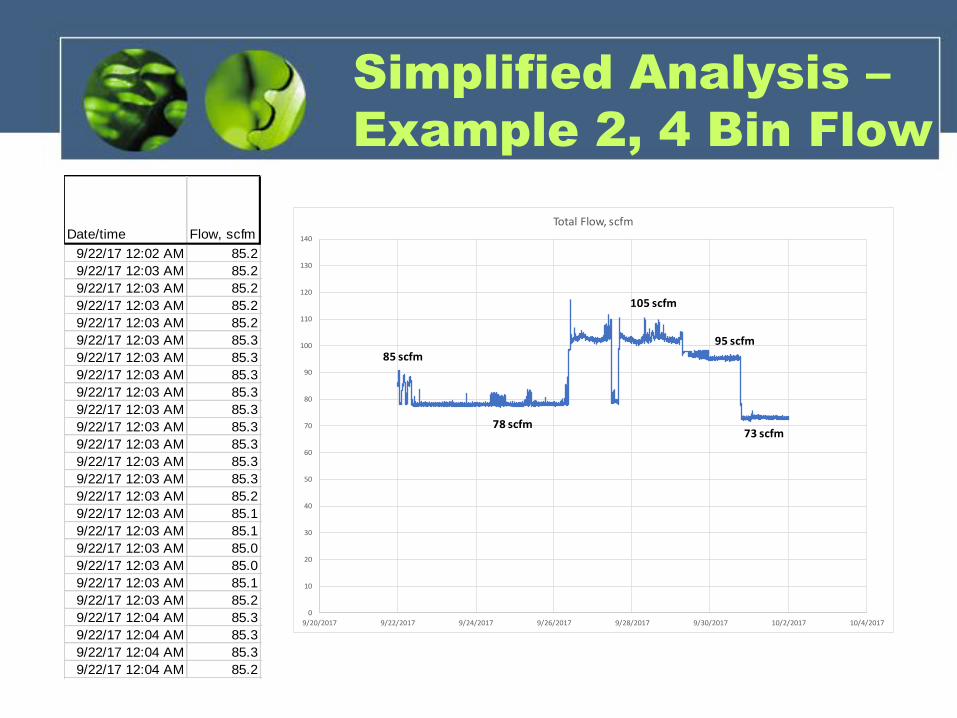
Simplified Analysis –
Example 2, 4 Bin Flow
Date/time Flow, scfm
9/22/17 12:02 AM 85.2
9/22/17 12:03 AM 85.2
9/22/17 12:03 AM 85.2
9/22/17 12:03 AM 85.2
9/22/17 12:03 AM 85.2
9/22/17 12:03 AM 85.3
9/22/17 12:03 AM 85.3
9/22/17 12:03 AM 85.3
9/22/17 12:03 AM 85.3
9/22/17 12:03 AM 85.3
9/22/17 12:03 AM 85.3
9/22/17 12:03 AM 85.3
9/22/17 12:03 AM 85.3
9/22/17 12:03 AM 85.3
9/22/17 12:03 AM 85.2
9/22/17 12:03 AM 85.1
9/22/17 12:03 AM 85.1
9/22/17 12:03 AM 85.0
9/22/17 12:03 AM 85.0
9/22/17 12:03 AM 85.1
9/22/17 12:03 AM 85.2
9/22/17 12:04 AM 85.3
9/22/17 12:04 AM 85.3
9/22/17 12:04 AM 85.3
9/22/17 12:04 AM 85.2
0
10
20
30
40
50
60
70
80
90
100
110
120
130
140
9/20/2017 9/22/2017 9/24/2017 9/26/2017 9/28/2017 9/30/2017 10/2/2017 10/4/2017
Total Flow, scfm
78 scfm
85 scfm
73 scfm
95 scfm
105 scfm

Example 2, Ctd
0%
10%
20%
30%
40%
50%
60%
Per
cen
tage
of
Tim
e
Flow Rate
Flow Rate Frequency
Bin Frequency % of Time
0-10 0 0%
10-20 0 0%
20-30 0 0%
30-40 0 0%
40-50 0 0%
50-60 2 0%
60-70 1352 0%
70-80 142453 49%
80-90 21998 8%
90-100 45889 16%
100-110 75746 26%
110-120 544 0%
120-130 3 0%
130-140 2 0%
140-150 2 0%
More 9
• Perform “Bin Analysis”
• Get Excel Data Analysis ToolPak
• Create “Histogram” with “Bins”

Matching Compressor
to Data
• Try Larger One First, Then Reduce, Then Back Up
• In This Case, Start With 50hp, 250acfm
• Get Curve for VFD & Alternatives, or Use
AirMasterTM
https://energy.gov/eere/amo/articles/airmaster
• Place Predominant Flows on Curve
• Look at Relative Efficiencies at Predominant Flows
• Keep Headroom for Growth (at Least 20%)
• Try to be in “Sweet Spot” (30-80%)
• Avoid Prolonged Time at Min Speed Flow (or Below)

Matching Compressor
to Data
• 50hp?
• Fairly
Efficient
• Too
Large
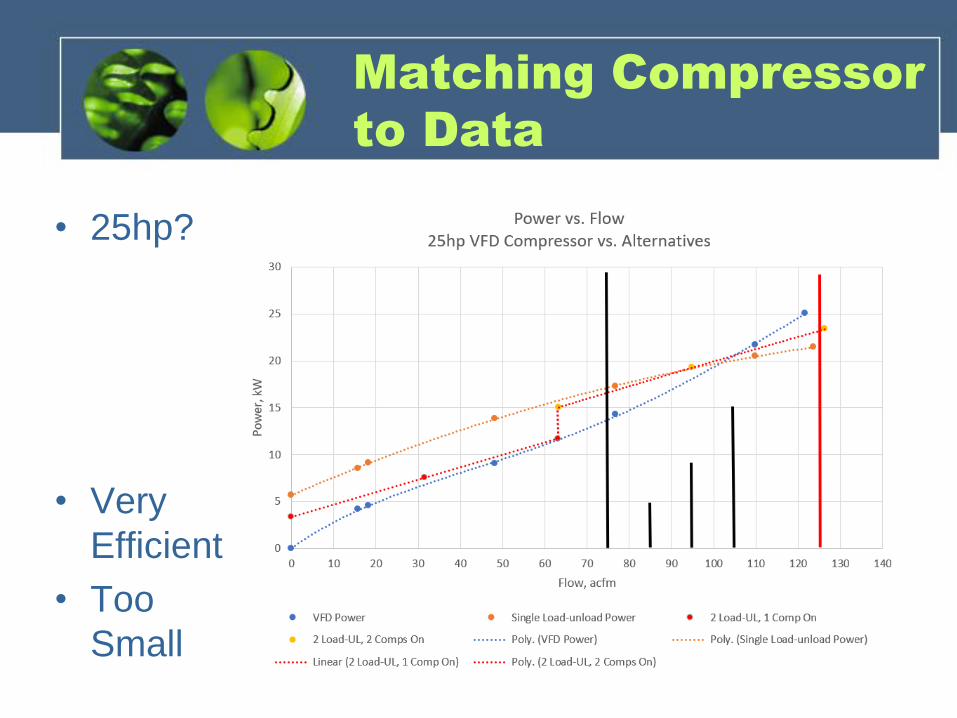
Matching Compressor
to Data
• 25hp?
• Very
Efficient
• Too
Small

Matching Compressor
to Data
• 30hp?
• Very
Efficient
• Just
Right

Conclusions
• Use a Flow Meter or CTs & PTs and Log Your Flow
• Use Excel to Evaluate Flows:
• Smooth Out Data if Noisy
• Create Bins
• Decide if a Single VFD is Even a Good Fit
• Get Performance Curves for High, Low, and Mid-
sized VFD Units & Alternative or Use Generic
• Plot Main Bin Flows On Curves
• Keep Headroom for Growth (at Least 20%)
• Avoid Prolonged Time at Min Speed Flow (or Below)
• Try to be in “Sweet Spot” (30-80%)

For your free subscription, please visit www.airbestpractices.com/magazine/subscription.
Steve BrunoAtlas Copco Compressors
• Product Marketing Manager for Oil Injected Screw Compressors 30kW – 90 kw and Controls for Atlas Copco Compressors
About the Speaker

Steve Bruno
Product Marketing Manager
Atlas Copco Compressors
January 25, 201826
VSDs in Multiple Compressor Systems
▪ Determining flow curve
▪ Utilizing a VSD and fixed speed compressors
▪ Potential Issues
Agenda
27
Determining Flow Curve
28
▪ For existing installations its always best to perform an audit
▪ For new installations, find out how the customer plans to run their equipment.
▪ Do not guess
▪ Incorrect sizing results in poor performance
▪ Ask questions and educate customers
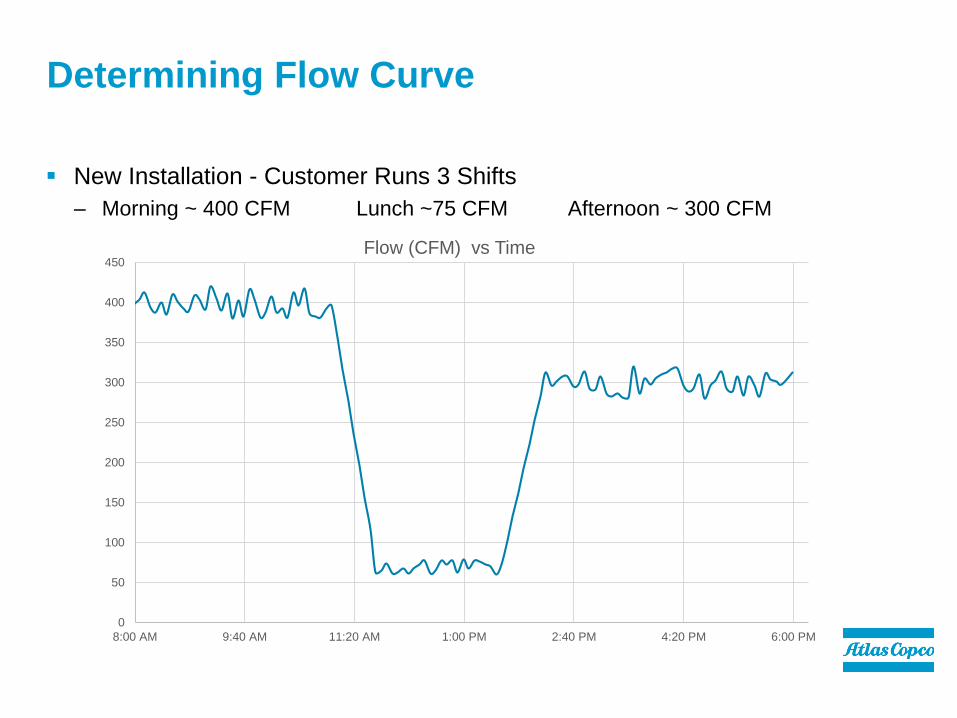
Determining Flow Curve
29
▪ New Installation - Customer Runs 3 Shifts
– Morning ~ 400 CFM Lunch ~75 CFM Afternoon ~ 300 CFM
0
50
100
150
200
250
300
350
400
450
8:00 AM 9:40 AM 11:20 AM 1:00 PM 2:40 PM 4:20 PM 6:00 PM
Flow (CFM) vs Time

Efficient Range of VSD
30
450 CFM
120 CFM
▪ Entire possible flow typically 40-100%
▪ Most efficient 50-90%

Trying to use a single VSD
31
▪ Need to size for max cfm
▪ Use 450 CFM compressor
0
50
100
150
200
250
300
350
400
450
8:00 AM 9:40 AM 11:20 AM 1:00 PM 2:40 PM 4:20 PM 6:00 PM
Flow (CFM) vs Time

Trying to use a single VSD
32
▪ Still inside optimal range
0
50
100
150
200
250
300
350
400
450
8:00 AM 9:40 AM 11:20 AM 1:00 PM 2:40 PM 4:20 PM 6:00 PM
Flow (CFM) vs Time

Trying to use a single VSD
33
▪ Oversized for lunch shift – VSD reliability issues could occur
0
50
100
150
200
250
300
350
400
450
8:00 AM 9:40 AM 11:20 AM 1:00 PM 2:40 PM 4:20 PM 6:00 PM
Flow (CFM) vs Time

Sizing VSD
34
▪ Look at the smaller variance in flow
0
50
100
150
200
250
300
350
400
450
8:00 AM 9:40 AM 11:20 AM 1:00 PM 2:40 PM 4:20 PM 6:00 PM
Flow (CFM) vs Time

Sizing VSD
35
▪ Look at the smaller variance in flow
0
50
100
150
200
250
300
350
400
450
8:00 AM 9:40 AM 11:20 AM 1:00 PM 2:40 PM 4:20 PM 6:00 PM
Flow (CFM) vs Time

Sizing VSD
36
▪ Look at the smaller variance in flow
0
50
100
150
200
250
300
350
400
450
8:00 AM 9:40 AM 11:20 AM 1:00 PM 2:40 PM 4:20 PM 6:00 PM
Flow (CFM) vs Time
50 CFM
50 CFM
30 CFM

Sizing VSD
37
▪ Look at the smaller variance in flow
▪ Size your VSD Compressor to be able to match the smaller changes
▪ Use additional compressors to account for large changes

Sizing VSD
38
▪ Look at the smaller variance in flow
▪ Size your VSD Compressor to be able to match the smaller changes
▪ Use additional compressors to account for large changes
▪ Small Changes = 50 CFM
– Choose VSD who’s most efficient flow bandwidth (50-90%) is ~50 CFM
– A 120 CFM compressor’s entire flow range (40-100%) is 50-120 CFM

Multiple compressors with a single VSD
39
▪ Placing our 120 CFM VSD
0
50
100
150
200
250
300
350
400
450
8:00 AM 9:40 AM 11:20 AM 1:00 PM 2:40 PM 4:20 PM 6:00 PM
Flow (CFM) vs Time
0
50
100
150
200
250
300
350
400
450
8:00 AM 9:40 AM 11:20 AM 1:00 PM 2:40 PM 4:20 PM 6:00 PM
Flow (CFM) vs Time
240 CFM
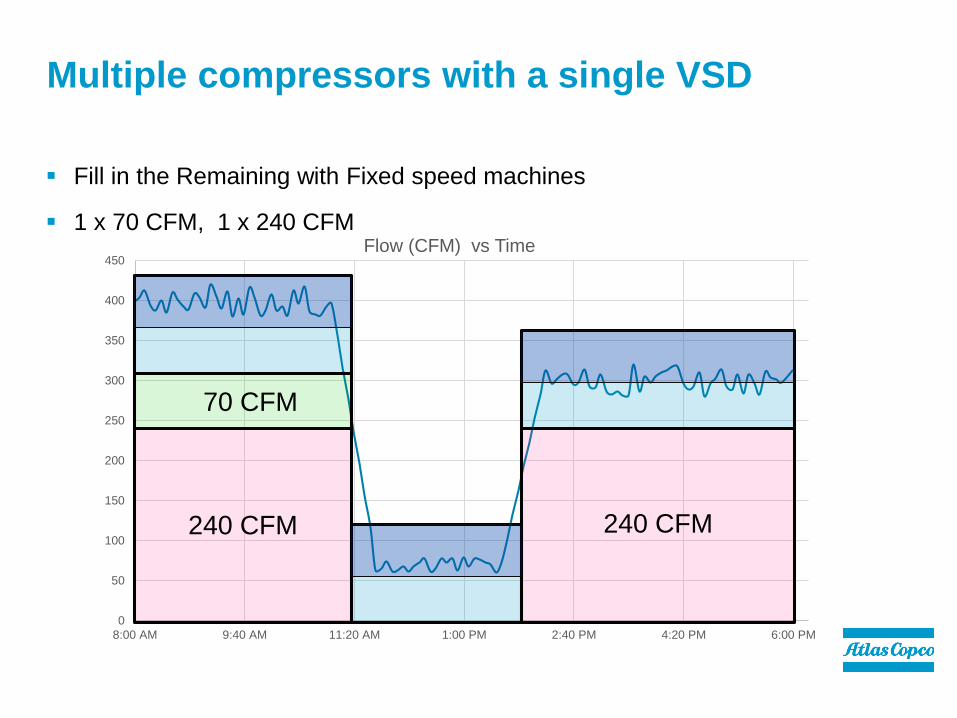
Multiple compressors with a single VSD
40
▪ Fill in the Remaining with Fixed speed machines
▪ 1 x 70 CFM, 1 x 240 CFM
240 CFM
70 CFM

Control Gap
41
▪ A flow value where the VSD is not able to match the flow required
▪ Example:
– Our 120 CFM VSD can turn down to 40%
– Able to produce 50 to 120 CFM.

Control Gap
42
▪ A flow value where the VSD is not able to match the flow required
▪ Example:
– Our 120 CFM VSD can turn down to 40%
– Able to produce 50 to 120 CFM.
– If the demand is below 50, the VSD will have reliability issues
▪ Water in the oil
▪ Overheating drive
▪ Lack of airflow through motor
– Never run system in the control gap.

Control Gap
43
▪ Example:
– Our 120 CFM VSD can turn down to 40%
– Able to produce between 50 to 120 CFM
– The variable capacity band is 70 CFM
– To eliminate control gap one fixed speed compressor must be 70 CFM or smaller

Control Gap – Multiple Compressors
44
▪ Example:
– 120 CFM VSD, 70 CFM Fixed Speed (A) , 240 CFM Fixed Speed (B)
– Our compressor options are:
▪ VSD
▪ VSD + A
▪ VSD + B
▪ VSD + A + B

Control Gap – Multiple Compressors
45
▪ Example:
– 120 CFM VSD, 70 CFM Fixed Speed (A) , 240 CFM Fixed Speed (B)
– Our compressor options are:
▪ VSD = 50 to 120 CFM
▪ VSD + A = 120 to 190 CFM
▪ VSD + B = 290 to 360 CFM
▪ VSD + A + B = 360 to 430 CFM

0
50
100
150
200
250
300
350
400
450
8:00 AM 9:40 AM 11:20 AM 1:00 PM 2:40 PM 4:20 PM 6:00 PM
Flow (CFM) vs Time
Control Gap – Multiple Compressors
46
▪ VSD Only = 50 to 120 CFM
VSD

0
50
100
150
200
250
300
350
400
450
8:00 AM 9:40 AM 11:20 AM 1:00 PM 2:40 PM 4:20 PM 6:00 PM
Flow (CFM) vs Time
Control Gap – Multiple Compressors
47
▪ VSD and Fixed Speed A = 120 to 190 CFM
VSD
VSD + A

0
50
100
150
200
250
300
350
400
450
8:00 AM 9:40 AM 11:20 AM 1:00 PM 2:40 PM 4:20 PM 6:00 PM
Flow (CFM) vs Time
Control Gap – Multiple Compressors
48
▪ VSD and Fixed Speed B = 290 to 360 CFM
VSD
VSD + A
VSD + B

0
50
100
150
200
250
300
350
400
450
8:00 AM 9:40 AM 11:20 AM 1:00 PM 2:40 PM 4:20 PM 6:00 PM
Flow (CFM) vs Time
Control Gap – Multiple Compressors
49
▪ VSD and Fixed Speed A = 120 to 190 CFM
VSD
VSD + A
VSD + B
VSD + A+B

0
50
100
150
200
250
300
350
400
450
8:00 AM 9:40 AM 11:20 AM 1:00 PM 2:40 PM 4:20 PM 6:00 PM
Flow (CFM) vs Time
CONTROL GAP
Control Gap – Multiple Compressors
50
▪ VSD and Fixed Speed A = 360 to 430 CFM
VSD
VSD + A
VSD + B
VSD + A+B

▪ Sample CAGI sheet
Comparing VSD Compressor Efficiencies
51
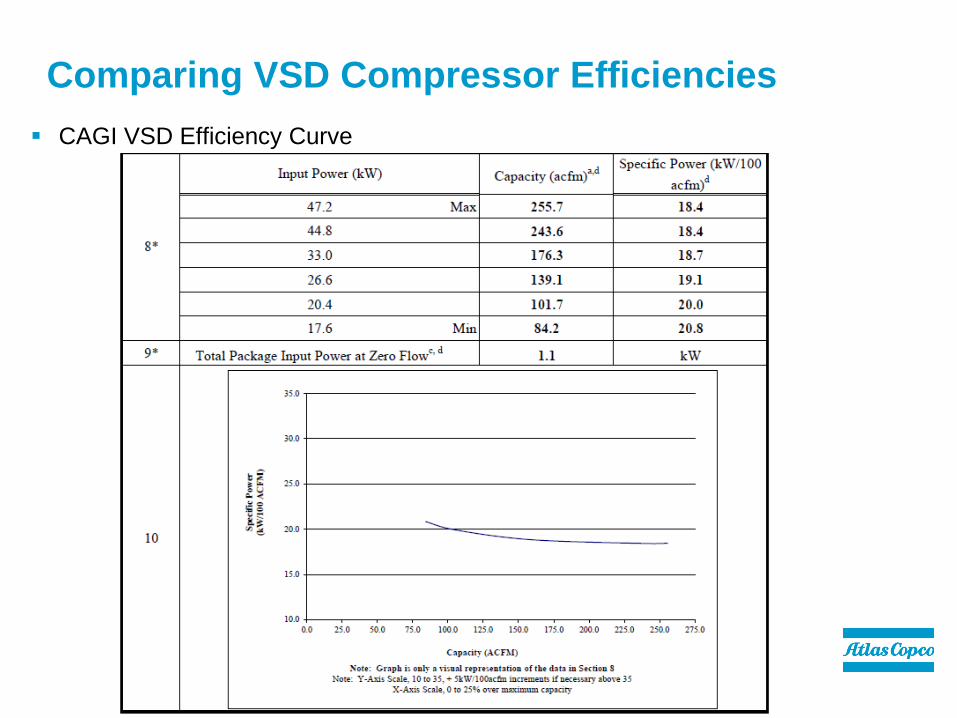
▪ CAGI VSD Efficiency Curve
Comparing VSD Compressor Efficiencies
52
Which compressors to choose?
53
▪ Most efficient
▪ Widest turndown
▪ Flattest efficiency curve
▪ Will allow your system to run the most efficiently in the widest range of different
flow demands and avoid falling into the control gap
0
50
100
150
200
250
300
350
400
450
8:00 AM 9:40 AM 11:20 AM 1:00 PM 2:40 PM 4:20 PM 6:00 PM
Flow (CFM) vs Time
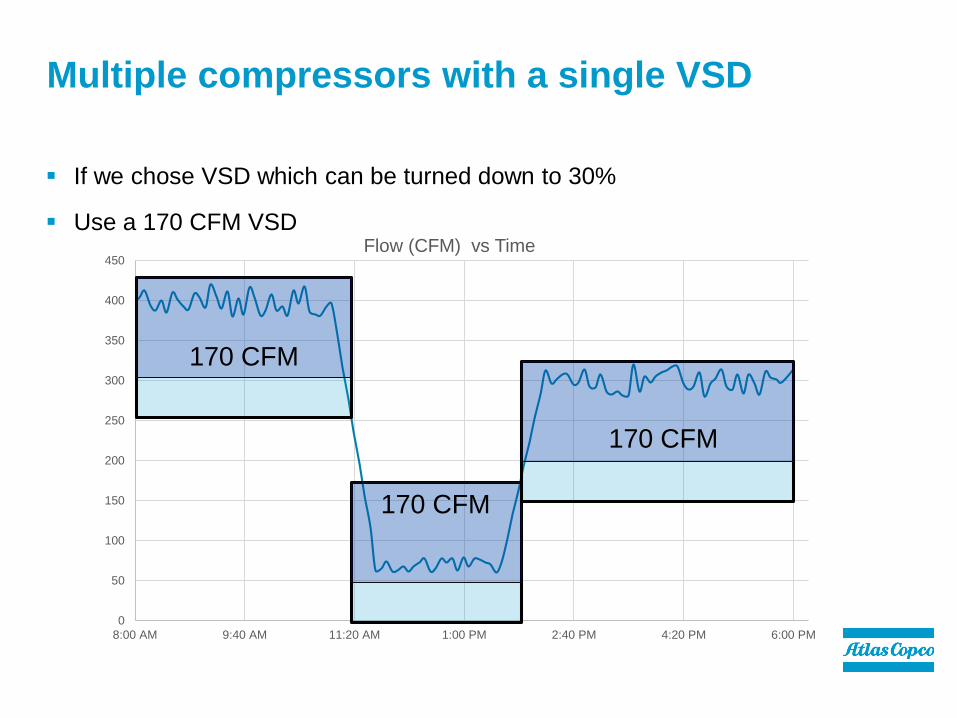
Multiple compressors with a single VSD
54
▪ If we chose VSD which can be turned down to 30%
▪ Use a 170 CFM VSD
170 CFM
170 CFM
170 CFM

0
50
100
150
200
250
300
350
400
450
8:00 AM 9:40 AM 11:20 AM 1:00 PM 2:40 PM 4:20 PM 6:00 PM
Flow (CFM) vs Time
150 CFM150 CFM
100 CFM
Multiple compressors with a single VSD
55
▪ 170 CFM VSD, 150 CFM Fixed Speed , 100 CFM Fixed Speed
170 CFM
170 CFM
170 CFM

0
50
100
150
200
250
300
350
400
450
8:00 AM 9:40 AM 11:20 AM 1:00 PM 2:40 PM 4:20 PM 6:00 PM
Flow (CFM) vs Time
CONTROL GAP
Control Gap – Multiple Compressors
56
▪ Previous example with 40% Minimum speed
VSD
VSD + A
VSD + B
VSD + A+B

0
50
100
150
200
250
300
350
400
450
8:00 AM 9:40 AM 11:20 AM 1:00 PM 2:40 PM 4:20 PM 6:00 PM
Flow (CFM) vs Time
Control Gap – Multiple Compressors
57
▪ New VSD with 30% Minimum speed
▪ No Control Gap
VSD
VSD + A
VSD + B
VSD + A+ B
Thank you!
Steve Bruno
Product Marketing Manager
Oil Injected Screw Compressors 30kW – 90 kw and Controls
Atlas Copco Compressors LLC
803-817-7223
www.atlascopco.us
COMMITTED TO SUSTAINABLE PRODUCTIVITY
58

Q&A
For your free subscription, please visit www.airbestpractices.com/magazine/subscription.
Please submit any questions through the Question Window on your GoToWebinar interface, directing them to Compressed Air Best Practices Magazine. Our panelists will do their best to address your questions, and will follow up with you on anything that goes unanswered during this session. Thank you for attending!
How to Size VSD Air Compressors
Sponsored by

For your free subscription, please visit www.airbestpractices.com/magazine/subscription.
The recording and slides of this webinar will be made available to attendees via email
later today.
PDH Certificates will be e-mailed to Attendees within two days.
Thank you for attending!
Sponsored by

THE INAUGURAL 3-DAY CONFERENCE & EXPO!
IMPROVING PLANT PROFITABILITY THROUGH INDUSTRIAL UTILITY OPTIMIZATION
Industry self-provides the key industrial utilities of compressed air, vacuum, blower and cooling. BEST PRACTICES 2018 EXPO focuses on the significant opportunities presented by these inter-
related utilities, to reduce kW and water intensity – per unit of production.
For more information and registration, please visit www.cabpexpo.com.
DateSeptember 17-19, 2018
LocationChicago O’Hare Crowne Plaza Hotel
Thursday, February 22, 2017 – 2:00 PM ESTRegister for free at
www.airbestpractices.com/magazine/webinars
Tim Dugan, P.E. Compression Engineering Corporation
Keynote Speaker
February 2018 Webinar:
5 Installation Tips for Flow and kW Meters
Sponsored by
Top Related