


Languages
Pages
Legal


1
HOW TO MEASURE STRESS IN HUMANS
Sonia J. Lupien, Ph.D.
Scientific Director
Centre for Studies on Human Stress
Fernand Seguin Research Centre of
Louis-H. Lafontaine Hospital
Quebec, Canada
Please do not distribute.
First Edition; Centre for Studies on Human Stress 2007
Second Edition; Centre for Studies on Human Stress 2013
2
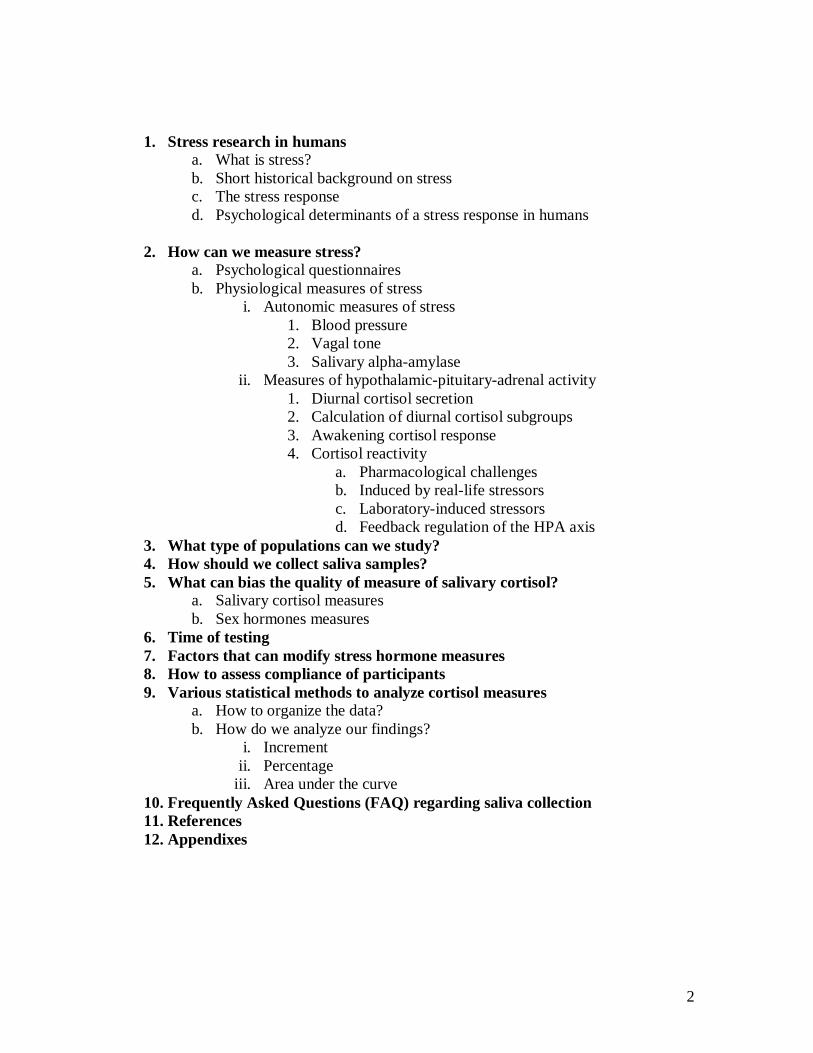
1. Stress research in humans
a. What is stress?
b. Short historical background on stress
c. The stress response
d. Psychological determinants of a stress response in humans
2. How can we measure stress?
a. Psychological questionnaires
b. Physiological measures of stress
i. Autonomic measures of stress
1. Blood pressure
2. Vagal tone
3. Salivary alpha-amylase
ii. Measures of hypothalamic-pituitary-adrenal activity
1. Diurnal cortisol secretion
2. Calculation of diurnal cortisol subgroups
3. Awakening cortisol response
4. Cortisol reactivity
a. Pharmacological challenges
b. Induced by real-life stressors
c. Laboratory-induced stressors
d. Feedback regulation of the HPA axis
3. What type of populations can we study?
4. How should we collect saliva samples?
5. What can bias the quality of measure of salivary cortisol?
a. Salivary cortisol measures
b. Sex hormones measures
6. Time of testing
7. Factors that can modify stress hormone measures
8. How to assess compliance of participants
9. Various statistical methods to analyze cortisol measures
a. How to organize the data?
b. How do we analyze our findings?
i. Increment
ii. Percentage
iii. Area under the curve
10. Frequently Asked Questions (FAQ) regarding saliva collection
11. References
12. Appendixes

3
1. STRESS RESEARCH IN HUMANS?
a. What is stress?
Stress is a popular topic these days. There is rarely a week that passes without hearing or
reading about stress and its deleterious effects on health. Given the negative impact of
stress on human health, many types of stress management therapies have been put
forward in order to decrease stress and to promote wellbeing. However, there is a great
paradox in the field of stress research, and it relates to the fact that the popular definition
of stress is very different from the scientific definition of stress. This inconsistency has
left a multitude of people and experts talking about, and working on very different
aspects of the stress system.
In popular terms, stress is mainly defined as time pressure. We feel stressed when we do
not have the time to perform the tasks that we want to perform within a given period. The
perception of time pressure usually triggers a set of physiological reactions that indicate
that we are stressed. Although this popular definition of stress may trigger a stress
response, it is important to acknowledge that in scientific terms stress is not equivalent to
time pressure. Indeed, if this were true, every individual would feel stressed when
pressured by time. However, many of us know that while there are some people who are
extremely stressed by time pressure, there are others who thrive under time pressure. This
shows that stress is a highly individualistic experience that does not depend on a
particular event such as time pressure, but rather depends on specific psychological
determinants that trigger a stress response.
b. Short historical background on stress
Prior to becoming part of our day-to-day conversations, the term “stress” was used by
engineers to explain forces that can put strain on a structure. For example, one could
place strain on a piece of metal in such a way that it would break like glass when it
reached its stress threshold. In 1936, Hans Selye (reproduced in Selye, 1998) borrowed
the term stress from the field of engineering and talked about stress as being a nonspecific
phenomenon representing the intersection of symptoms produced by a wide variety of
noxious agents. For many years, Selye tested various conditions (e.g., fasting, extreme
cold, operative injuries, and drug administration) that would produce physical changes in
the body that were representative of a stress response, such as enlargement of the adrenal
gland, atrophy of the thymus, and gastric ulceration. Selye’s view of the concept of stress
was that the determinants of the stress response are non-specific. Thus, many unspecific
conditions can put strain on the organism and lead to disease outcome, the same way that
many unspecific conditions can put strain on a piece of metal and break it like glass.
Not all researchers agreed with Selye’s model, particularly with the notion that the
determinants of the stress response are non-specific. The reason for this was simple;
While Selye spent his entire career working on physical stressors (e.g., heat, cold, and
pain), we all know that some of the worst stressors we encounter in life are psychological
in nature, and are induced by our interpretation of events. For this reason, a psychologist

4
named John Mason (see Mason, 1968) spent many years measuring stress hormone levels
in people subjected to various conditions that he thought would be stressful. These
experiments enabled Dr. Mason to describe the psychological characteristics that would
make any condition stressful, to any individual exposed to it. This work was made
possible in the early 1960’s due to the development of new technology that allowed
scientists to measure levels of hormones that are released during reactivity to a stressor.
The release of stress hormones is made possible through activation of a neuroendocrine
axis named the hypothalamic-pituitary-adrenal (HPA) axis.
c. The stress response
When a situation is interpreted as being stressful, it triggers the activation of the
hypothalamic-pituitary-adrenal (HPA) axis whereby neurons in the hypothalamus, a brain
structure often termed the “master gland”, releases a hormone called corticotropin-
releasing hormone (CRH). The release of CRH triggers the subsequent secretion and
release of another hormone called adrenocorticotropin (ACTH) from the pituitary gland,
also located in the brain. When ACTH is secreted by the pituitary gland, it travels in the
blood and reaches the adrenal glands, which are located above the kidneys, and triggers
secretion of the so-called stress hormones.
There are two main stress hormones, the glucocorticoids (called corticosterone in
animals, and cortisol in humans), and the catecholamines (epinephrine and
norepinephrine).
Under normal (non-stressed) conditions, cortisol secretion shows pronounced circadian
rhythmycity, where concentrations are at their highest in the morning (the circadian
peak), progressively decline from late afternoon to early nocturnal periods (the circadian
trough), and show abrupt elevations after the first few hours of sleep.
Figure. Example of the circadian rhythm of serum cortisol levels.

5
The acute secretion of glucocorticoids and catecholamines constitutes the primary
mediators in the chain of hormonal events triggered in response to stress. When these two
hormones are secreted in response to stress, they act on the body to give rise to the fight-
or-flight response whereby one would, for instance, experience an increase in heart rate
and blood pressure.
d. Psychological determinants of a stress response in humans
By summarizing the results of studies that measured the circulating levels of stress
hormones before and after individuals were exposed to various situations that were
deemed to be stressful (e.g., air-traffic controllers or parachute jumping), Mason (1968)
was able to describe four main psychological determinants that would induce a stress
response in any individual exposed to them. Using this methodology, he showed that in
order for a situation to induce a stress response, it has to be interpreted as being novel,
and/or unpredictable, it must be threatening to one’s ego and/or the individual must have
the feeling that he/she does not have control over the situation. Although this work led to
a general debate between Selye and Mason (Selye, 1975), further studies confirmed that
the determinants of the stress response are highly specific, and therefore, potentially
predictable and measurable.
2. HOW CAN WE MEASURE STRESS?
a. Psychological Questionnaires
The field of psychology concentrates on the measurement of abstract concepts, such as
language, cognition, personality and emotions, to name a few. Given that the
determinants of a stress response as defined by Mason were psychological in nature, the
concept of stress became part of the group of psychological concepts that can be
measured. Once developed in the field of psychology, stress became measurable by the
use of questionnaires. To this end, psychologists developed questionnaires that cover a
wide range of psychological symptoms that can be induced by exposure to chronic stress.
There are a wide variety of questionnaires that have been developed to assess the
psychological factors that are associated with stress in humans. The Centre for Studies
on Human Stress presents a large database containing the majority of stress
questionnaires available in the scientific literature.
b. Physiological Measures of Stress
The interpretation of a situation as being stressful leads to the activation of the
hypothalamic-pituitary-adrenal (HPA) axis, and to the ultimate secretion of cortisol and
catecholamines in humans. The end products of HPA activation (cortisol and
catecholamines) are easily measurable in blood, urine and saliva.
6
This is not the case for other markers of HPA activation such as ACTH and CRF levels.
ACTH can only be measured in blood and CRF can only be measured in cerebrospinal
fluid. Given the ease with which one can assess the end products of HPA activation,
several studies are now using cortisol and proxy measures of sympathetic activation
(catecholamine, alpha-amylase) as validated physiological measures of stress in humans.
Cortisol and catecholamines can be measured in blood. Catecholamines cannot be easily
measured in saliva, so researchers have developed proxy measures of sympathetic
activation that can be assessed using non-invasive methods.
Studies now show that cortisol can also be sampled in saliva, a technique that has been
preferred by researchers for its non-invasive advantage. In addition, as opposed to blood
sampling, saliva collection does not require the collaboration of skilled personnel for the
installation of a catheter, allowing for an uncomplicated and trouble-free sample
collection.
Moreover, new biospecimens for assessment of stress hormones are now being developed
in humans. One biospecimen that is very interesting is hair samples. Hairs grow 1 cm per
month, and new methodology are now being developed in order to measure cortisol
levels in hair, using enzyme immunoassays. The interesting aspect of this new
biospecimen is that cortisol levels are accumulating in hair samples, providing a measure
of the accumulation of stress hormones over time in humans. By analyzing samples of 3
cm of hair, one is potentially able to assess exposure to stress in humans within the last 3
months. In this way, hair becomes a retrospective calendar of stress hormone production.
Below, we briefly describe the various methods used to assess biomarkers of stress in
humans.
i. Autonomic measures as biomarkers of stress
Blood pressure : Blood pressure is a measure of the force that blood exerts on the walls
of blood vessels. When blood pressure (a sympathetic parameter) is measured, two
numbers appear, e.g. 120/80 mmHg. The first number, 120, represents the systolic
pressure, which occurs when the heart pushes blood out of the arteries. The second
number, 80, represents the diastolic pressure, which is the pressure of the heart at rest.
Blood pressure can be easily measured using a simple vital signs monitor.
Vagal tone : Vagal tone represents the parasympathetic impulse that would apply a brake
to decrease heart rate during both resting and reactive conditions. This measure requires
the use of more advanced electronic devices and the installation of leads.

7
Salivary alpha-amylase: Recently, alpha-amylase has been described as a potential
indicator of noradrenergic activity (Chatterton et al. 1996; Nater et al., 2005; Rohleder et
al. 2004). Alpha-amylase is an enzyme that is produced under sympathetic innervations
and can be collected in saliva. There is growing body of evidence suggesting that the
level of salivary alpha-amylase (sAA) increases with physiological stress, such as
exercise (Li & Gleeson, 2004; Walsh et al., 1999). Recent studies also indicate that the
Trier Social Stress Test (TSST), a validated psychosocial stressor (Kirschbaum et al.,
1993) can also elicit an increase in sAA following stress exposure (Nater et al., 2006;
Nater et al., 2005; Rohleder et al., 2004). Given earlier observations that sAA
concentration increases with sympathetic stimulation and salivary flow rate increases
with parasympathetic stimulation (Garrett, 1999), as well as the fact that significant
correlations have been shown between sAA and catecholamine levels (Chatterton et al.,
1996), it has been proposed that sAA may be a potential biomarker for gauging the level
of activity of the sympathetic nervous system (Nater et al., 2006; Nater et al., 2005;
Rohleder et al., 2004). Further support for this hypothesis came from van Stegeren and
collaborators (van Stegeren et al., 2006) who demonstrated that participants who were
given beta-blockers prior to an fMRI psychosocial stress paradigm exhibited a
significantly lower level of sAA, heart rate and blood pressure throughout the entire
paradigm, when compared to placebo subjects.
ii. Measures of hypothalamic-pituitary-adrenal activity
1. Diurnal cortisol secretion
Under natural unstimulated conditions, the secretion of cortisol follows a circadian
rhythm characterized by a peak in the early morning hours, followed by declining cortisol
concentrations throughout the day, reaching the lowest levels during the late evening.
This rhythm is influenced by altered sleep patterns and exposure to daily life stressors
(Smyth et al., 1998; van Eck, Berkhof, Nicolson, & Sulon, 1996). While this pattern of
diurnal cortisol secretion has been widely published, it has been shown that individuals
may deviate from this “typical pattern”. Indeed, both inter-individual differences and
intra-individual differences in the diurnal pattern of cortisol secretion have been reported.
2. Calculation of diurnal cortisol subgroups
Smyth and colleagues (1997) have developed a method to assess individual differences in
the diurnal pattern of cortisol secretion. These calculations allow one to assess stability
and characteristic of the diurnal cortisol slope over a 2-day period. Specifically, based on
a 2-day sampling period, individuals may be categorized into one of three possible
subgroups: the Typical diurnal subgroup, in which the individual displays the typical
cortisol peak and decline throughout the day (as described above); the Flat diurnal
subgroup, in which evening cortisol levels fail to decline to the common nadir phase and
remain relatively elevated; finally, the Inconsistent subgroup, in which individuals
display both the Typical and Flat pattern on alternate days (e.g. flat on day one and
8
typical on day two). Using this method, Smyth et al (1997) reported that 51% of the
population present a “Typical” and consistent decline in cortisol levels on both days,
while 17% of the population displayed a “Flat” cortisol cycle on both days, and 31%
exhibited an “Inconsistent” cycle.
In order to obtain these three subgroups within a given population, 3 calculation steps are
followed:
STEP 1: Determine the cortisol slope of Day 1 and Day 2: First, one must log-transform
all cortisol values for both sampling days. Once values are transformed, the slope for
Day 1 and Day 2 must be calculated.
STEP 2: Determine which individuals display a consistent profile (flat or typical) and
which individuals display an inconsistent profile: In order to do this, one must take the
difference score between the slopes of Day 1 and Day 2 (i.e. slope Day 2 – slope Day 1).
From this difference score, calculate the standard deviation (SD). If the absolute
difference score is greater than 1 SD, the diurnal cycle for that individual is characterized
as Inconsistent. Why? Because there is a significant difference (greater than 1 SD)
between their Day 1 and Day 2 slope.
STEP 3: For the remaining individuals (i.e. those who have not been categorized as
Inconsistent), determine which individuals display a Typical cycle and which individuals
display a Flat cycle: In order to do this, one must obtain the average of the two slopes.
From the average score, those who display a slope that is more positive than the (-)SD are
labelled as Flat (i.e. less of a decline in cortisol over time) and those who display a slope
that is more negative than the (-)SD are labelled Typical (i.e. more of a decline in cortisol
over time).
Below is an example of calculations:
We have collected 4 saliva samples in 10 participants on Day 1 and Day 2. On both days,
samples were collected at 9:00, 12:00, 15:00, 18:00. Table 1, shows the log-transformed
concentrations on each day for 10 participants.
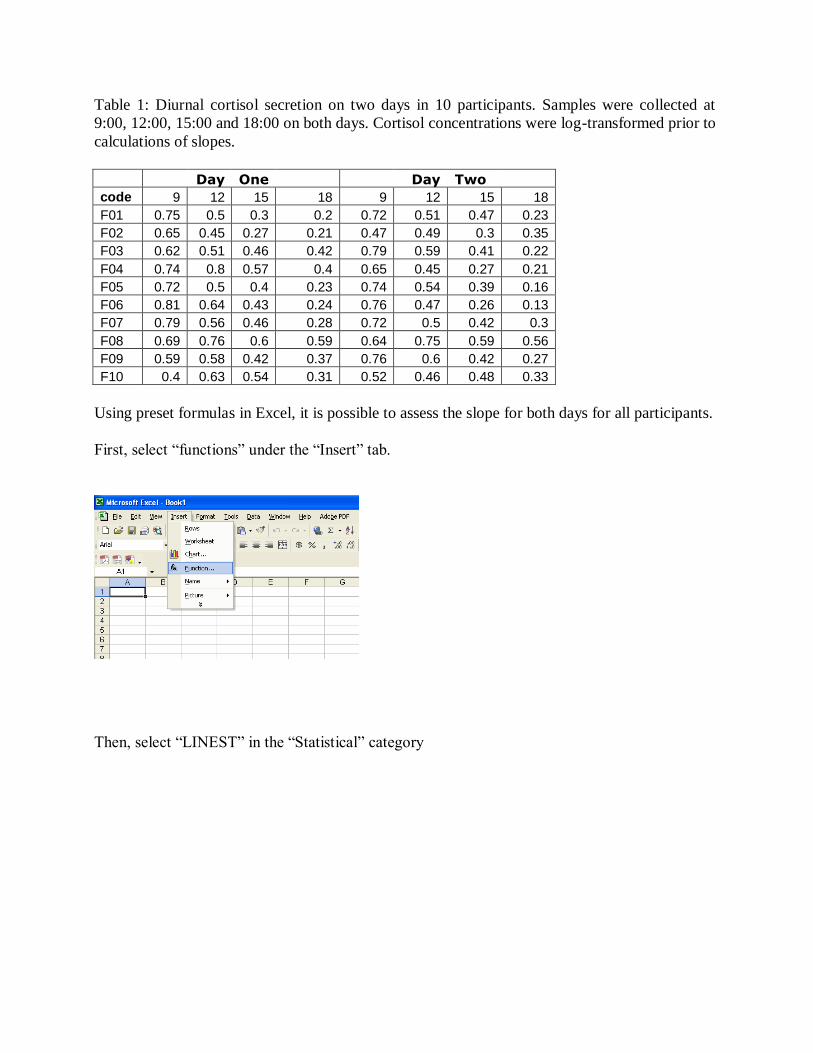
Table 1: Diurnal cortisol secretion on two days in 10 participants. Samples were collected at
9:00, 12:00, 15:00 and 18:00 on both days. Cortisol concentrations were log-transformed prior to
calculations of slopes.
Day One Day Two
code 9 12 15 18 9 12 15 18
F01 0.75 0.5 0.3 0.2 0.72 0.51 0.47 0.23
F02 0.65 0.45 0.27 0.21 0.47 0.49 0.3 0.35
F03 0.62 0.51 0.46 0.42 0.79 0.59 0.41 0.22
F04 0.74 0.8 0.57 0.4 0.65 0.45 0.27 0.21
F05 0.72 0.5 0.4 0.23 0.74 0.54 0.39 0.16
F06 0.81 0.64 0.43 0.24 0.76 0.47 0.26 0.13
F07 0.79 0.56 0.46 0.28 0.72 0.5 0.42 0.3
F08 0.69 0.76 0.6 0.59 0.64 0.75 0.59 0.56
F09 0.59 0.58 0.42 0.37 0.76 0.6 0.42 0.27
F10 0.4 0.63 0.54 0.31 0.52 0.46 0.48 0.33
Using preset formulas in Excel, it is possible to assess the slope for both days for all participants.
First, select “functions” under the “Insert” tab.
Then, select “LINEST” in the “Statistical” category

10
Then, under “Known Y’s” label, select the Y values. Those are the log-transformed cortisol
concentrations measured at each time point.
Under the “Known X’s” label, select the time of each sampling (9, 12, 15 and 18). This will
ensure that the intervals between sampling are taken into account in the calculation of the slope.
Clicking OK will provide you with value of the slope of the linear regression model fitting your
data.

11
:
Thus, we now have the cortisol slopes for Day 1 and Day 2 (Table 2)

12
Table 2: Calculation of slope. Calculation of Difference between slope 1 and slope
Day 1
Slope
Day 2
Slope Difference
Inconsistent /
Consistent?
Average
Slope Typical/Flat? Subgroup
-0.0617 -0.0503 -0.0113 Consistent -0.056 Typical Typical
-0.05 -0.0183 -0.0317 Inconsistent
-
0.03415 Inconsistent
-0.0217 -0.063 0.0413 Inconsistent
-0.04235 Inconsistent
-0.0417 -0.05 0.0083 Consistent
-0.04585 Typical Typical
-0.0523 -0.063 0.0107 Consistent
-0.05765 Typical Typical
-0.064 -0.07 0.006 Consistent -0.067 Typical Typical
-0.0543 -0.0447 -0.0097 Consistent -0.0495 Typical Typical
-0.0153 -0.0133 -0.002 Consistent -0.0143 Flat Flat
-0.0273 -0.055 0.0277 Inconsistent
-0.04115 Inconsistent
-0.012 -0.0183 0.0063 Consistent
-0.01515 Flat Flat
SD= 0.020
Once you have the slopes for Day 1 and Day 2, calculate the difference score (3rd
column Table
2). Then, calculate the SD of the difference scores (=0.020). If the absolute value of the
difference score is greater than the SD, then the person is labeled as Inconsistent (4th column
Table 2).
Now that you know who is Inconsistent, you want to find those who are Flat or Typical.
Therefore, calculate the average of the Day 1 and Day 2 slopes (5th column Table 2). Individuals
who have a more negative (average) slope are labeled Typical and those who have a more
positive (average) slope are labeled Flat (6th column Table 2)
Note: Slope calculation is a function of the interval between each time point. For the sake of
better comparison within and between participants, it is recommended to maintain comparable
intervals between each saliva collection, on both days, in all participants. For example, one
cannot compare the diurnal slope of salivary cortisol secretion in Participant A, who collected
saliva samples at 9:00, 10:00, 11:00 and 19:00, to that of Participant B, who collected saliva
samples at 9:00, 12:00, 15:00 and 18:00. Even though both participants collect their morning and
evening samples at comparable hours (9:00 for both and 18:00 vs. 19:00 in the evening), and
both participants collected 4 samples during the day, the researcher clearly lacks information
regarding the course of saliva cortisol between 11:00 and 19:00 in Participant A. Therefore, it is
not only recommended to collect several saliva samples to provide more accurate slope
calculations, but also, sample distribution throughout the day should be as evenly spread out as
possible. We believe that collecting less than four samples would not yield accurate results of the
diurnal cortisol pattern.

13
3. Awakening cortisol response
In the past few years, an increasing number of authors have shown interest in the awakening
cortisol response (ACR), a distinct feature of the HPA axis that responds to the endogenous
stimulation of waking up by a peak occurring at 30-45 minutes after awakening (for a review,
see Clow, Thorn, Evans, & Hucklebridge, 2004). ACR, which is believed to reflect
psychological and physical wellness, is known to be relatively stable across days and is blunted
under situations of high emotion and stress (Pruessner et al., 1997; Pruessner, Hellhammer, &
Kirschbaum, 1999; Clow et al., 2004).
4. Cortisol Reactivity
Reactivity of the HPA axis can mainly be assessed either pharmacologically, through exposure
to real-life stressful events, or using laboratory-induced stressors.
a. Pharmacological challenges:
Pharmacological challenges are often used in stress studies to test the ability of the HPA axis to
trigger a feed-forward response. Depending on the level of reactivity that one wishes to assess,
CRF (anterior pituitary level) or ACTH (adrenal level) challenges are used. These tests require
the help of careful monitoring and highly skilled personnel for the administration of the
triggering agents (CRF and ACTH).
b. Induced by real-life stressors:
In the current literature, many authors have studied responses to real-life stressful events such as
bereavement, academic examinations, everyday work and parachute jumping. These stressors
have been reviewed by Biondi and Picardi (1999). Although these real-life events reflect
naturally occurring daily life challenges, the context surrounding the experimental conditions
might be difficult to control for.
c. Laboratory-induced stressors
A recent meta–analytical review was performed using 208 stress studies in children, adults and
older participants from different laboratories. This review concluded that a stressor that involves
social-evaluative threat (e.g. when performance can be evaluated by others) is the most powerful
way to induce stress in laboratory facilities (Dickerson & Kemeny, 2002; Kirschbaum et al.,
1993). The Trier Social Stress Test (TSST) is one of the best standardized tools to evoke a
cortisol stress responses in a laboratory setting. Salivary cortisol levels after the TSST reliably
show a 2 to 4-fold elevation in cortisol above baseline within 30 minutes. The TSST consists of
delivering a public speech in front of a 'team of experts', following a period of five minutes of
preparation. At the end of the speech, participants are asked to serially subtract numbers as fast
and as accurately as possible. If a mistake occurs, the participant is stopped and asked to start
over from the initial number. Altogether, the TSST lasts approximately 10 minutes. Saliva
samples are usually collected prior to the TSST (baseline, 0 min), after the speech preparation,

14
immediately after the speech and arithmetic performance, and several times afterwards. Cortisol
should show a peak in concentrations within 10-30 minutes after the end of the TSST.
d. Feedback regulation of the HPA axis
It is also possible to evaluate the negative feedback of the HPA axis using the Dexamethasone
Suppression Test (DST). Dexamethasone is a very powerful synthetic glucocorticoid that acts
centrally to inhibit secretion of CRH, ACTH and subsequently, cortisol. Therefore, within hours,
cortisol secretion should be interrupted, leading to very low levels of circulating cortisol levels.
Typically, dexamethasone is given orally (usually 1 mg), at bedtime (normally set at 23:00) and
the HPA hormones are measured the following morning, e.g. at 8:00, 9:00, 10:00, 11:00 and
12:00. Individuals who have poor HPA regulation fail to blunt HPA hormone secretion after
dexamethasone intake.
3. What types of population can we study?
You can study just about any type of population you wish to. Salivary cortisol has been
measured in various age groups, from infants, to the elderly population, and has been measured
in both healthy and clinical populations (e.g. (Cleare, 2003; Gunnar, Bruce, & Hickman, 2001;
Gunnar & Vazquez, 2001; Kajantie & Phillips, 2006; Kirschbaum & Hellhammer, 1994;
Kirschbaum, Kudielka, Gaab, Schommer, & Hellhammer, 1999; Lundberg, 2005; Lupien et al.,
2005; Pruessner et al., 1997; Tu, Lupien, & Walker, 2005; Yehuda, 2002).
4. How should we collect saliva samples?
The most common technique used to collect saliva samples for cortisol assay requires the
participant to pass saliva by spitting or drooling directly into a sterilized tube, for a few minutes
until sufficient volume (approximately 2 ml) has been collected. To reduce bacterial growth, it is
recommended to cool the sample in the refrigerator or the freezer, until the research team
retrieves it. Using this device, saliva samples can be collected at home, by the participant, and
then mailed back to the laboratory setting without significantly affecting the quality of its assay
(Clements & Parker, 1998). It is recommended, as much as possible, to avoid using agents to
stimulate saliva flow, such a Kool-Aid crystals, as these have been associated with aberrant
levels following cortisol assay.
5. What can bias the quality of measure of salivary cortisol?
a. Salivary cortisol measures
A broad range of events including concurrent stress, illnesses, and minor daily life activities
occurring prior to saliva collection can interfere with the concentrations of salivary cortisol. The
influence of some factors might occur without our control, such as sudden illnesses and stress.
Other factors, e.g. time of testing, intake of food and beverages, or minor psychological and
physical stressors (e.g. driving in traffic, performing academic or work-related stressful tasks,
recent physical exercise), can be moderated by carefully monitoring these events before saliva

15
collection.
b. Sex hormone measures
Saliva has become the medium of choice for some analyses of sex hormones as it is less
challenging to collect than blood. However, certain guidelines need to be imposed to ensure not
only a clean and clear sample, but one with its constituents intact, as these factors will affect the
reliability of the final results.
It has been shown that sex hormones in saliva are unstable if left at room temperature and
need to be handled in a more meticulous fashion than cortisol, during collection.
The most fragile hormones seem to be the estrogens (of which we generally use estradiol) and
progesterone, closely followed by DHEA and testosterone.
The company Salimetrics (1), that manufactures enzyme immune assay kits, released a
document illustrating the reaction of different molecules to 3 different temperatures over a
period of 96 hours. Below in fig.1. are the results for the progesterone and the estradiol from that
document (Salimetrics ‘The spit report’, Vol 5- Issue 2- march 2012-09-14).
Fig.1 : Temperature stability for 96 hours (Salimetrics)
Progesterone Pg/ml Control Estradiol Pg/ml
Sample Room temp
21 C Fridge
4C Freezer
60 C Sample Room temp
21 C Fridge
4C Freezer
60 C
1 15,55 20,43 29,95 1 9,37 10,51 13,10
2 43,49 86,09 165,78 2 0,00 0,00 10,37
3 15,13 26,95 42,75 3 0,00 4,87 11,33
4 277,52 364,47 438,26 4 7,48 12,43 18,44
5 51,03 124,19 153,03 5 9,12 22,65 25,98
6 18,67 36,52 56,95 6 0,00 6,67 13,19
7 41,52 44,04 41,99 7 11,36 12,29 10,91
8 27,94 38,67 49,41 8 6,27 9,94 17,69
9 45,78 57,63 108,75 9 9,33 11,54 18,21
10 12,94 36,1 84,23 10 3,63 10,82 17,71
Mean 54,957 83,509 117,11 Mean 5,66 10,17 15,69
Figure 1 shows that there is marked degradation over the 96 hours at room temperature and to a
lesser degree at 4C (refrigerated), though still consequential. This might seem to be irrelevant
when you consider that it is unlikely that a sample would be left out for four days.
Our goal was to test if the deterioration of samples would show in a shorter timeframe (ie. 24
hours). Using a 24-hour time frame would demonstrate a more realistic scenario whereby
samples became defrosted on the way to the research centre, or were kept in the participant’s bag
at work before being taken home in the evening and placed in a freezer. To demonstrate this, an
analysis using 10 samples of progesterone and estradiol was carried out
16
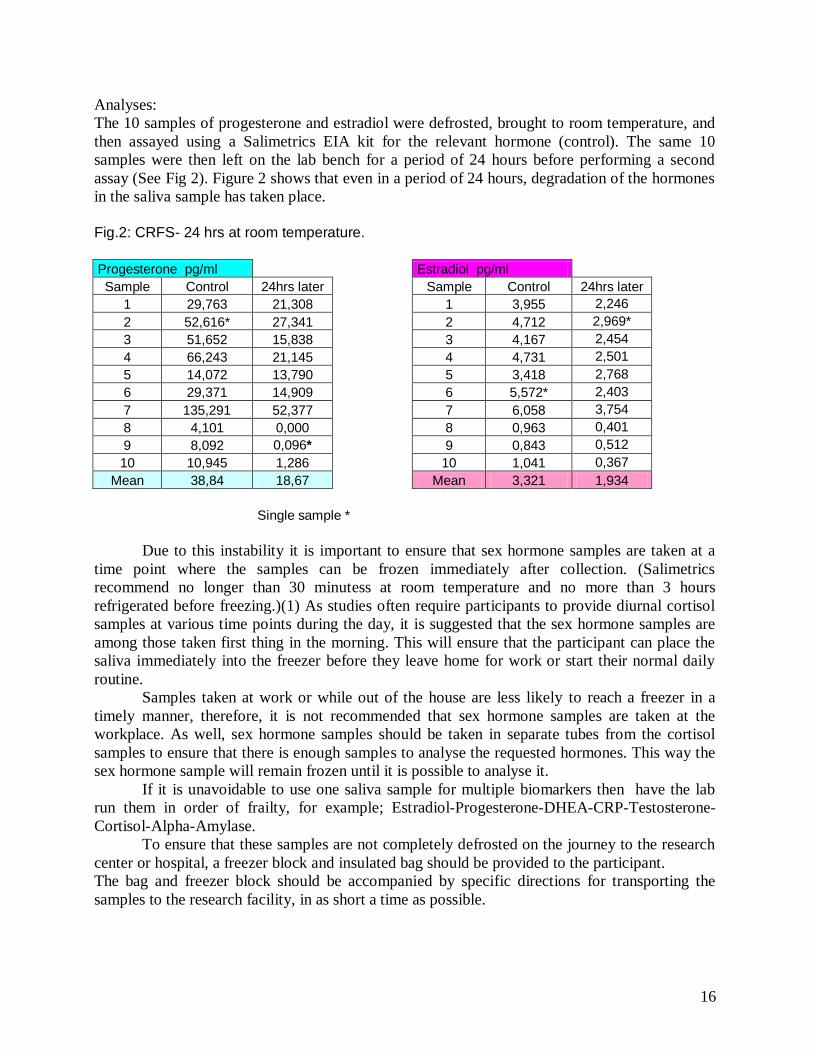
Analyses:
The 10 samples of progesterone and estradiol were defrosted, brought to room temperature, and
then assayed using a Salimetrics EIA kit for the relevant hormone (control). The same 10
samples were then left on the lab bench for a period of 24 hours before performing a second
assay (See Fig 2). Figure 2 shows that even in a period of 24 hours, degradation of the hormones
in the saliva sample has taken place.
Fig.2: CRFS- 24 hrs at room temperature.
Progesterone pg/ml Estradiol pg/ml
Sample Control 24hrs later Sample Control 24hrs later
1 29,763 21,308 1 3,955 2,246
2 52,616* 27,341 2 4,712 2,969*
3 51,652 15,838 3 4,167 2,454
4 66,243 21,145 4 4,731 2,501
5 14,072 13,790 5 3,418 2,768
6 29,371 14,909 6 5,572* 2,403
7 135,291 52,377 7 6,058 3,754
8 4,101 0,000 8 0,963 0,401
9 8,092 0,096* 9 0,843 0,512
10 10,945 1,286 10 1,041 0,367
Mean 38,84 18,67 Mean 3,321 1,934
Single sample *
Due to this instability it is important to ensure that sex hormone samples are taken at a
time point where the samples can be frozen immediately after collection. (Salimetrics
recommend no longer than 30 minutess at room temperature and no more than 3 hours
refrigerated before freezing.)(1) As studies often require participants to provide diurnal cortisol
samples at various time points during the day, it is suggested that the sex hormone samples are
among those taken first thing in the morning. This will ensure that the participant can place the
saliva immediately into the freezer before they leave home for work or start their normal daily
routine.
Samples taken at work or while out of the house are less likely to reach a freezer in a
timely manner, therefore, it is not recommended that sex hormone samples are taken at the
workplace. As well, sex hormone samples should be taken in separate tubes from the cortisol
samples to ensure that there is enough samples to analyse the requested hormones. This way the
sex hormone sample will remain frozen until it is possible to analyse it.
If it is unavoidable to use one saliva sample for multiple biomarkers then have the lab
run them in order of frailty, for example; Estradiol-Progesterone-DHEA-CRP-Testosterone-
Cortisol-Alpha-Amylase.
To ensure that these samples are not completely defrosted on the journey to the research
center or hospital, a freezer block and insulated bag should be provided to the participant.
The bag and freezer block should be accompanied by specific directions for transporting the
samples to the research facility, in as short a time as possible.

17
6. Time of testing
As we have mentioned before, basal cortisol secretion fluctuates throughout the day. Typically,
morning levels are higher than late afternoon levels. Therefore, one should use caution to avoid
large individual differences in baseline concentrations by combining cortisol measurements at
comparable times during the day. Recently, a few studies have reported that cortisol reactivity to
stressful situations can differ according to the time of the day (Kudielka, Schommer,
Hellhammer, & Kirschbaum, 2004; Maheu, Collicutt, Kornik, Moszkowski, & Lupien, 2005).
7. Factors that can modify stress hormone measures
Cortisol is reactive to stimulants of the nervous system such as caffeine and nicotine. These
agents have been reported to enhance basal and reactive secretion of salivary cortisol (Lane,
Pieper, Phillips-Bute, Bryant, & Kuhn, 2002; Lovallo, Farag, Vincent, Thomas, & Wilson, 2006;
Lovallo et al., 2005; Rohleder & Kirschbaum, 2006; Steptoe & Ussher, 2006).
Large intake of food in the hour prior to saliva collection can also lead to a sharp artefactual
increase in cortisol concentrations. Glucose intake affects the cortisol response to stress in a
more significant way compared to protein or fat intake (Gonzalez-Bono, Rohleder, Hellhammer,
Salvador, & Kirschbaum, 2002).
Finally, acidic or sweet food and beverage intake shortly prior to saliva collection can alter the
pH of saliva during collection. Given that salivary cortisol assay is performed in a constant pH
environment, for optimal bindings of reagents, it is recommended to avoid intake of such food
and beverages and to have the participant rinse his/her mouth prior to saliva collection. It is also
important to ensure that there is no remaining water in the participants mouth following rising, as
this may dilute the saliva.
8. How to assess compliance of participants?
In study designs when participants are instructed to collect saliva samples at home, it is
important to remind the participants to respect the prescribed timing and conditions of saliva
collection. As shown previously, the timing of sampling and the events leading to sampling are
crucial in the quality of data collection at the participant’s home. The importance of verifying
compliance has been reviewed recently (Kudielka, Broderick, & Kirschbaum, 2003). Although
monitoring techniques, such as palm-pilots that beep the participant to remind to take a saliva
sample, have been successfully used in some studies, this method does not ensure that at the time
of the beep, the participant actually takes the saliva sample (Kudielka et al., 2003). To this day,
the only validated method available to analyze and monitor participant’s compliance with saliva
sampling is the Medication Event Monitoring System (MEMS®). This is a tool that measures
and analyzes participant’s compliance to the prescribed time of saliva sampling (for analysis of
stress hormone levels in the natural environment). The MEMS® is the only device, to this day,
that can ensure a reliable analysis of participant’s compliance with saliva sampling in the home
environment. The MEMS® is an electronic monitoring system designed to compile the
participants’ dosing history. The system is comprised of two parts: a standard plastic vial with
18
threaded opening and a closure for the vial that contains a micro-electronic circuit that registers
times when the closure is opened and when it is closed. Once the sampling is done, the events
stored in the MEMS® can be transferred at any time through the MEMS® communicator to a
Windows-based computer. The software then analyzes and displays or prints the computed
parameters of the participant’s compliance. The results obtained with the MEMS® are now
widely regarded as the gold standard measure of patient compliance.
MEMS® supplies can be purchased from the AARDEX GROUP (www.aardexgroup.com).
The following products are necessary when using the MEMS® caps to measure patient
compliance:
MEMS® Power View software to analyze the data (US $473 per license per workstation)
MEMS® Reader/Communicator (US $122)
MEMS® Caps (number of caps to be determined according to the research study) ($115
per cap). The battery for each cap lasts for 36 months, at which time the entire cap has to
be discarded.
Vial for each MEMS® Cap – (US $ 4.70) Item: 250cc HDPE screw-top white vial 45-400.
(Prices quoted above are from 2012. Please contact AARDEX GROUP for prices as they are subject to change)
9. Various statistical methods to analyze cortisol
Many assay techniques are available to quantify free cortisol from saliva samples. The most
common assays are radioimmunoassay (RIA), time-resolved immunoassay with fluorometric
detection (DELFIA) and enzyme immunoassay (EIA). These techniques rely on the principle of
competitive binding between free cortisol and reagents. Correlations betweens concentrations
yielded from these techniques depend on the type of population tested (clinical vs. healthy) and
on the range in concentrations assayed (Addison vs. Cushing) (Raff, Homar, & Burns, 2002;
Raff, Homar, & Skoner, 2003). Therefore, one should use some caution and consider the type of
assay used when comparing values obtained from one study to another study. The choice of one
technique over another depends not only on the prices of the chemical kits, and availability at
laboratories, but also on the percentage of inter and intra-assay coefficient of variations. Briefly,
inter-assay variations refer to the variability related to the assay BETWEEN runs, while intra-
assay variations refer to the variability WITHIN runs. Further information regarding assay
techniques can be obtained from the Stress Hormones Analysis Laboratory.
a. How to organize the data?
To organize your data prior to statistical analysis, it is preferable to assign each participant with a
number or code, and to enter these data in one line per participant. Each column represents a
variable measure (e.g. age, sex, education, time of testing). For the sake of confidentiality, we
advice researchers to keep personal information separately from the corresponding code. Below
is an example of a spreadsheet organized in Excel.
19
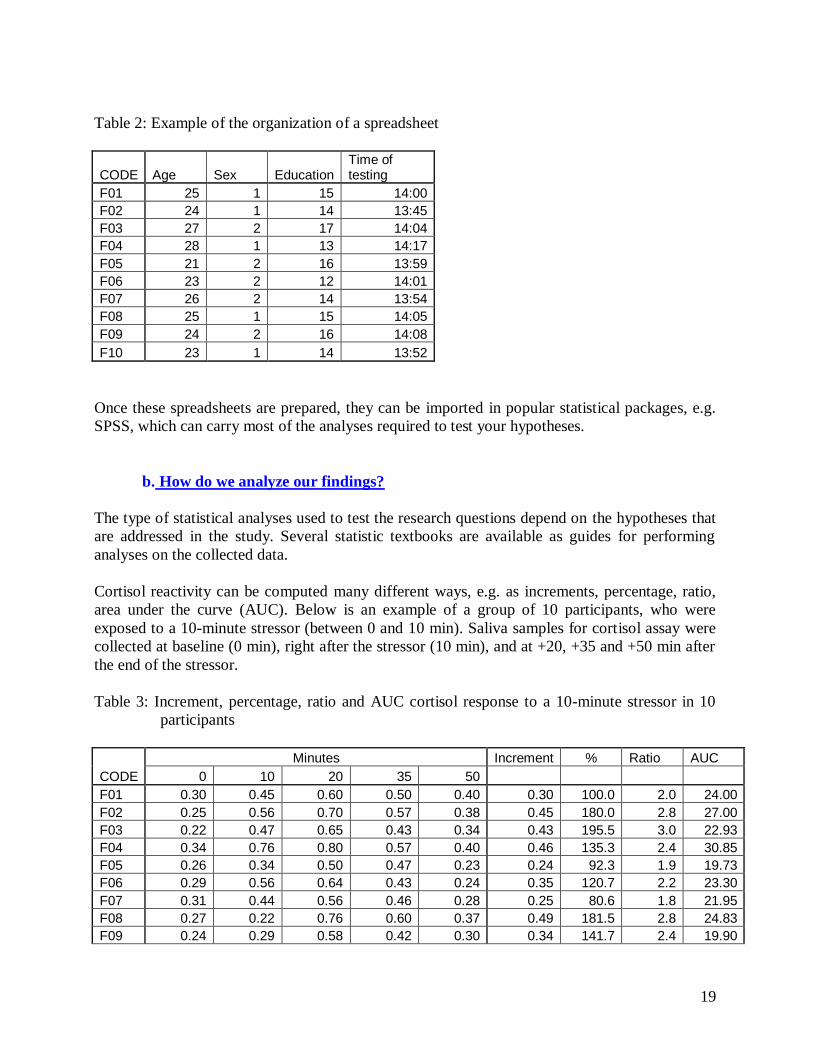
Table 2: Example of the organization of a spreadsheet
CODE Age Sex Education Time of testing
F01 25 1 15 14:00
F02 24 1 14 13:45
F03 27 2 17 14:04
F04 28 1 13 14:17
F05 21 2 16 13:59
F06 23 2 12 14:01
F07 26 2 14 13:54
F08 25 1 15 14:05
F09 24 2 16 14:08
F10 23 1 14 13:52
Once these spreadsheets are prepared, they can be imported in popular statistical packages, e.g.
SPSS, which can carry most of the analyses required to test your hypotheses.
b. How do we analyze our findings?
The type of statistical analyses used to test the research questions depend on the hypotheses that
are addressed in the study. Several statistic textbooks are available as guides for performing
analyses on the collected data.
Cortisol reactivity can be computed many different ways, e.g. as increments, percentage, ratio,
area under the curve (AUC). Below is an example of a group of 10 participants, who were
exposed to a 10-minute stressor (between 0 and 10 min). Saliva samples for cortisol assay were
collected at baseline (0 min), right after the stressor (10 min), and at +20, +35 and +50 min after
the end of the stressor.
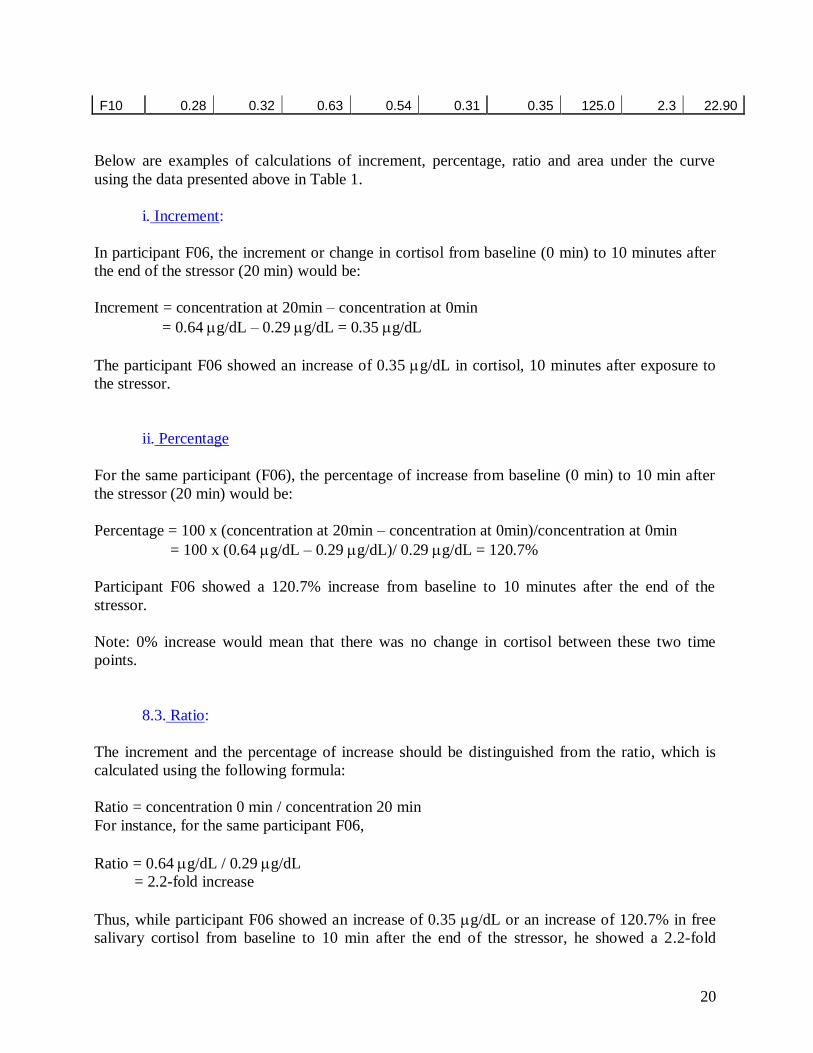
Table 3: Increment, percentage, ratio and AUC cortisol response to a 10-minute stressor in 10
participants
Minutes Increment % Ratio AUC
CODE 0 10 20 35 50
F01 0.30 0.45 0.60 0.50 0.40 0.30 100.0 2.0 24.00
F02 0.25 0.56 0.70 0.57 0.38 0.45 180.0 2.8 27.00
F03 0.22 0.47 0.65 0.43 0.34 0.43 195.5 3.0 22.93
F04 0.34 0.76 0.80 0.57 0.40 0.46 135.3 2.4 30.85
F05 0.26 0.34 0.50 0.47 0.23 0.24 92.3 1.9 19.73
F06 0.29 0.56 0.64 0.43 0.24 0.35 120.7 2.2 23.30
F07 0.31 0.44 0.56 0.46 0.28 0.25 80.6 1.8 21.95
F08 0.27 0.22 0.76 0.60 0.37 0.49 181.5 2.8 24.83
F09 0.24 0.29 0.58 0.42 0.30 0.34 141.7 2.4 19.90
20
F10 0.28 0.32 0.63 0.54 0.31 0.35 125.0 2.3 22.90
Below are examples of calculations of increment, percentage, ratio and area under the curve
using the data presented above in Table 1.
i. Increment:
In participant F06, the increment or change in cortisol from baseline (0 min) to 10 minutes after
the end of the stressor (20 min) would be:
Increment = concentration at 20min – concentration at 0min
= 0.64 g/dL – 0.29 g/dL = 0.35 g/dL
The participant F06 showed an increase of 0.35 g/dL in cortisol, 10 minutes after exposure to
the stressor.
ii. Percentage
For the same participant (F06), the percentage of increase from baseline (0 min) to 10 min after
the stressor (20 min) would be:
Percentage = 100 x (concentration at 20min – concentration at 0min)/concentration at 0min
= 100 x (0.64 g/dL – 0.29 g/dL)/ 0.29 g/dL = 120.7%
Participant F06 showed a 120.7% increase from baseline to 10 minutes after the end of the
stressor.
Note: 0% increase would mean that there was no change in cortisol between these two time
points.
8.3. Ratio:
The increment and the percentage of increase should be distinguished from the ratio, which is
calculated using the following formula:
Ratio = concentration 0 min / concentration 20 min
For instance, for the same participant F06,
Ratio = 0.64 g/dL / 0.29 g/dL
= 2.2-fold increase
Thus, while participant F06 showed an increase of 0.35 g/dL or an increase of 120.7% in free
salivary cortisol from baseline to 10 min after the end of the stressor, he showed a 2.2-fold

21
increase in cortisol during that period.
Note: a 1-fold increase would mean that there was no change in cortisol concentrations between
these two time points.
iii. Area under the curve:
We can also obtain a global measure of the cortisol response by calculating the area under the
curve (AUC) of the response. This technique has been well described by Pruessner et al. (2003)
(Pruessner, Kirschbaum, Meinlschmid, & Hellhammer, 2003). Briefly, the calculation of AUC is
based on breaking down the AUC in many trapezoids, then, calculating and adding the area of
each trapezoid to yield one overall value.
The area of a trapezoid is calculated as following:
Height x (average of length of parallel sides)
= interval between two samples x (cortisol concentration at time 1+ concentration at time 2)/2
AUC = area trapezoid 1 + area trapezoid 2 + area trapezoid 3 + area trapezoid 4
= 10 min x (0.29 g/dL + 0.56 g/dL)/2 + 10 min x (0.56 g/dL + 0.64 g/dL)/2 + 15
min x (0.64 g/dL + 0.43 g/dL)/2 + 15min x (0.43 g/dL + 0.24 g/dL)/2
= 23.30 g/dL over the course of 50 minutes
Over the course of the 50-minute experimentation, including baseline, cortisol reactivity and
cortisol recovery, Participant F06 secreted 23.30 g/dL of free salivary cortisol.
Tra
pez
oid
4
Tra
pez
oid
1
Tra
pez
oid
2
Tra
pez
oid
3

22
10. Frequently Asked Questions (FAQ) regarding saliva collection
Should I collect my sample if I am sick?
No, if you are sick or under unusual stress during this week, please contact the research
team so that we can set a different time for the saliva collection.
If I forgot and ate breakfast and/or brushed my teeth before collecting my saliva, what do I
do? Can I start over again?
Yes, call the research team so we can arrange for you to start on another day.
I’m having a difficult time collecting enough saliva.
If you are having difficulty collecting saliva we have a few recommendations. You can
try:
press the tip of your tongue against your teeth very gently.
think about your favorite dessert.
I forgot to rinse my mouth before I collected my saliva, what should I do?
A film develops in your mouth at night; this is why we ask that you rinse out your mouth
to remove that film before collection.) But if you’ve already completed the process of
spitting, that’s fine.
Can I eat or drink between the awakening and 30 minutes after awakening samples?
No, you should only drink water between the awakening and 30-minutes-after -wakening
samples (no coffee or other caffeinated drinks).
Can I take a shower between the awakening and 30 minutes after awakening samples?
Yes
What if I miss my collection time? How much time do I have to collect the sample?
If you accidentally miss your collection time, please complete the sample as soon as
possible (within an hour of the specified time).
What if I go to bed before 9 P.M.?
If your bedtime is before the last saliva collection, please collect the last sample
collection before you go to bed.
If I miss the awakening sample, can I complete the rest of the day and collect my
awakening sample the next day?
It is better to start over and complete all sampling on the same day.
11. References
References
Biondi, M., & Picardi, A. (1999). Psychological stress and neuroendocrine function in humans:
The last two decades of research. Psychother Psychosom, 68(3), 114-150.
23
Chatterton, R. T., Jr., Vogelsong, K. M., Lu, Y. C., Ellman, A. B., & Hudgens, G. A. (1996).
Salivary alpha-amylase as a measure of endogenous adrenergic activity. Clin Physiol,
16(4), 433-448.
Cleare, A. J. (2003). The neuroendocrinology of chronic fatigue syndrome. Endocr Rev, 24(2),
236-252.
Clements, A. D., & Parker, C. R. (1998). The relationship between salivary cortisol
concentrations in frozen versus mailed samples. Psychoneuroendocrinology, 23(6), 613-
616.
Dickerson, S. S., & Kemeny, M. E. (2002). Acute stressors and cortisol reactivity: A meta-
analytic review. Psychosomatic Medicine, 54, 105-123.
Garrett, J. R., Ekstrom, J., Anderson, L.C. (1999). Neural mechanisms of salivary gland
secretion. In F. O. biol (Ed.), (Vol. 11, pp. 59-79). Basel: Karger.
Gonzalez-Bono, E., Rohleder, N., Hellhammer, D. H., Salvador, A., & Kirschbaum, C. (2002).
Glucose but not protein or fat load amplifies the cortisol response to psychosocial stress.
Horm Behav, 41(3), 328-333.
Gunnar, M. R., Bruce, J., & Hickman, S. E. (2001). Salivary cortisol response to stress in
children. Adv Psychosom Med, 22, 52-60.
Gunnar, M. R., & Vazquez, D. M. (2001). Low cortisol and a flattening of expected daytime
rhythm: Potential indices of risk in human development. Dev Psychopathol, 13(3), 515-
538.
Kajantie, E., & Phillips, D. I. (2006). The effects of sex and hormonal status on the physiological
response to acute psychosocial stress. Psychoneuroendocrinology, 31(2), 151-178.
Kirschbaum, C., & Hellhammer, D. H. (1989). Salivary cortisol in psychobiological research:
An overview. Neuropsychobiology, 22(3), 150-169.
Kirschbaum, C., & Hellhammer, D. H. (1994). Salivary cortisol in psychoneuroendocrine
research: Recent developments and applications. Psychoneuroendocrinology, 19(4), 313-
333.
Kirschbaum, C., Kudielka, B. M., Gaab, J., Schommer, N. C., & Hellhammer, D. H. (1999).
Impact of gender, menstrual cycle phase, and oral contraceptives on the activity of the
hypothalamus-pituitary-adrenal axis. Psychosom Med, 61(2), 154-162.
Kirschbaum, C., Pirke, K. M., & Hellhammer, D. H. (1993). The 'trier social stress test'--a tool
for investigating psychobiological stress responses in a laboratory setting.
Neuropsychobiology, 28(1-2), 76-81.
Kudielka, B. M., Broderick, J. E., & Kirschbaum, C. (2003). Compliance with saliva sampling
protocols: Electronic monitoring reveals invalid cortisol daytime profiles in
noncompliant subjects. Psychosom Med, 65(2), 313-319.
Kudielka, B. M., Schommer, N. C., Hellhammer, D. H., & Kirschbaum, C. (2004). Acute hpa
axis responses, heart rate, and mood changes to psychosocial stress (tsst) in humans at
different times of day. Psychoneuroendocrinology, 29(8), 983-992.
Lane, J. D., Pieper, C. F., Phillips-Bute, B. G., Bryant, J. E., & Kuhn, C. M. (2002). Caffeine
affects cardiovascular and neuroendocrine activation at work and home. Psychosom Med,
64(4), 595-603.
Li, T. L., & Gleeson, M. (2004). The effect of single and repeated bouts of prolonged cycling
and circadian variation on saliva flow rate, immunoglobulin a and alpha-amylase
responses. J Sports Sci, 22(11-12), 1015-1024.

24
Lovallo, W. R., Farag, N. H., Vincent, A. S., Thomas, T. L., & Wilson, M. F. (2006). Cortisol
responses to mental stress, exercise, and meals following caffeine intake in men and
women. Pharmacol Biochem Behav.
Lovallo, W. R., Whitsett, T. L., al'Absi, M., Sung, B. H., Vincent, A. S., & Wilson, M. F. (2005).
Caffeine stimulation of cortisol secretion across the waking hours in relation to caffeine
intake levels. Psychosom Med, 67(5), 734-739.
Lundberg, U. (2005). Stress hormones in health and illness: The roles of work and gender.
Psychoneuroendocrinology, 30(10), 1017-1021.
Lupien, S. J., Fiocco, A., Wan, N., Maheu, F., Lord, C., Schramek, T., et al. (2005). Stress
hormones and human memory function across the lifespan. Psychoneuroendocrinology,
30(3), 225-242.
Maheu, F. S., Collicutt, P., Kornik, R., Moszkowski, R., & Lupien, S. J. (2005). The perfect time
to be stressed: A differential modulation of human memory by stress applied in the
morning or in the afternoon. Prog Neuropsychopharmacol Biol Psychiatry, 29(8), 1281-
1288.
Nater, U. M., La Marca, R., Florin, L., Moses, A., Langhans, W., Koller, M. M., et al. (2006).
Stress-induced changes in human salivary alpha-amylase activity -- associations with
adrenergic activity. Psychoneuroendocrinology, 31(1), 49-58.
Nater, U. M., Rohleder, N., Gaab, J., Berger, S., Jud, A., Kirschbaum, C., et al. (2005). Human
salivary alpha-amylase reactivity in a psychosocial stress paradigm. Int J Psychophysiol,
55(3), 333-342.
Pruessner, J. C., Kirschbaum, C., Meinlschmid, G., & Hellhammer, D. H. (2003). Two formulas
for computation of the area under the curve represent measures of total hormone
concentration versus time-dependent change. Psychoneuroendocrinology, 28(7), 916-
931.
Pruessner, J. C., Wolf, O. T., Hellhammer, D. H., Buske-Kirschbaum, A., von Auer, K., Jobst,
S., et al. (1997). Free cortisol levels after awakening: A reliable biological marker for the
assessment of adrenocortical activity. Life Sci, 61(26), 2539-2549.
Raff, H., Homar, P. J., & Burns, E. A. (2002). Comparison of two methods for measuring
salivary cortisol. Clin Chem, 48(1), 207-208.
Raff, H., Homar, P. J., & Skoner, D. P. (2003). New enzyme immunoassay for salivary cortisol.
Clin Chem, 49(1), 203-204.
Rohleder, N., & Kirschbaum, C. (2006). The hypothalamic-pituitary-adrenal (hpa) axis in
habitual smokers. Int J Psychophysiol, 59(3), 236-243.
Rohleder, N., Nater, U. M., Wolf, J. M., Ehlert, U., & Kirschbaum, C. (2004). Psychosocial
stress-induced activation of salivary alpha-amylase: An indicator of sympathetic activity?
Ann N Y Acad Sci, 1032, 258-263.
Smyth, J., Ockenfels, M. C., Porter, L., Kirschbaum, C., Hellhammer, D. H., & Stone, A. A.
(1998). Stressors and mood measured on a momentary basis are associated with salivary
cortisol secretion. Psychoneuroendocrinology, 23(4), 353-370.
Smyth, J. M., Ockenfels, M. C., Gorin, A. A., Catley, D., Porter, L. S., Kirschbaum, C., et al.
(1997). Individual differences in the diurnal cycle of cortisol.
Psychoneuroendocrinology, 22(2), 89-105.
Steptoe, A., & Ussher, M. (2006). Smoking, cortisol and nicotine. Int J Psychophysiol, 59(3),
228-235.
25
Tu, M. T., Lupien, S. J., & Walker, C. D. (2005). Measuring stress responses in postpartum
mothers: Perspectives from studies in human and animal populations. Stress, 8(1), 19-34.
van Eck, M., Berkhof, H., Nicolson, N., & Sulon, J. (1996). The effects of perceived stress,
traits, mood states, and stressful daily events on salivary cortisol. Psychosom Med, 58(5),
447-458.
van Stegeren, A., Rohleder, N., Everaerd, W., & Wolf, O. T. (2006). Salivary alpha amylase as
marker for adrenergic activity during stress: Effect of betablockade.
Psychoneuroendocrinology, 31(1), 137-141.
Walsh, N. P., Blannin, A. K., Clark, A. M., Cook, L., Robson, P. J., & Gleeson, M. (1999). The
effects of high-intensity intermittent exercise on saliva iga, total protein and alpha-
amylase. J Sports Sci, 17(2), 129-134.
Yehuda, R. (2002). Current status of cortisol findings in post-traumatic stress disorder. Psychiatr
Clin North Am, 25(2), 341-368, vii.

26
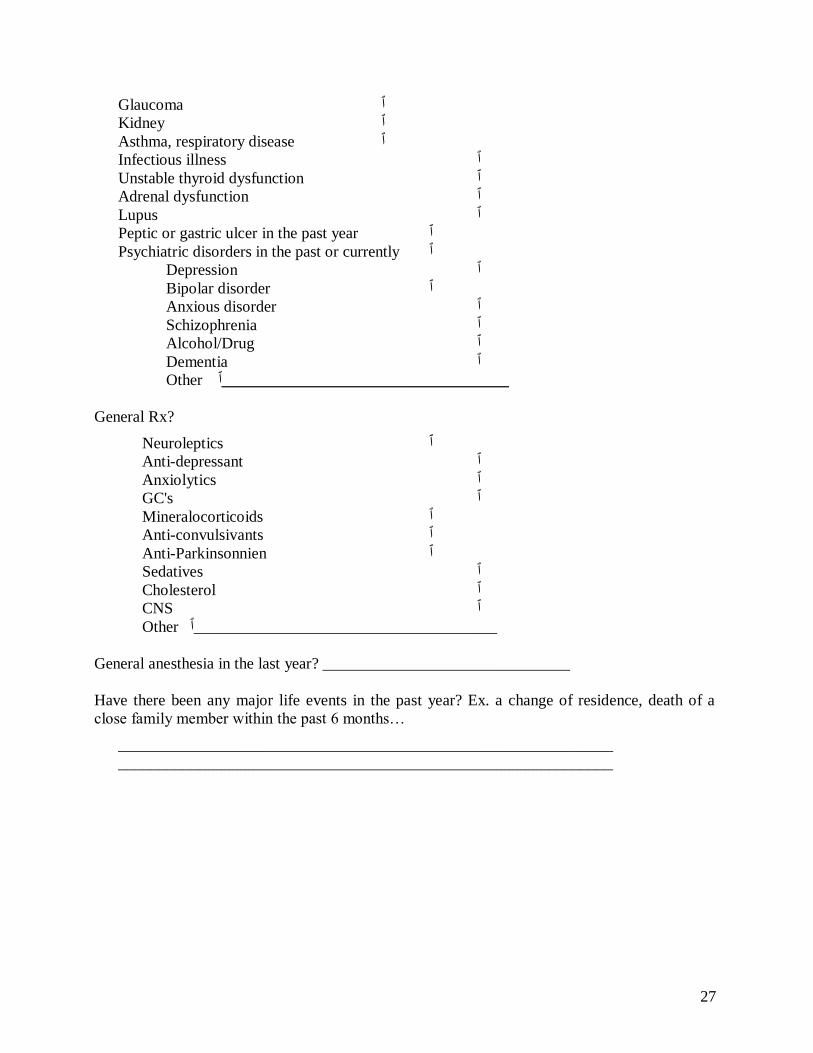
12. Appendices
Below are examples of a typical screening questionnaire and a log book that one can use
to control for some of the methodological issues.
Demographic Information
Name
Add
Phone
Date of birth
Height/Weight
Yrs schooling
Language
Medical Screening
Smokers or not? (Exclude if more than 10-15 per day cortisol/nicotine interaction)
____________________________________
General health?
Vision ٱ
Audition ٱ
Do you take any medication? _______________________________________
Medical history?
Cardio-vascular diseases ٱ
Myocardial infarction ٱ
Heart block ٱ
Slow cardiac conduction ٱ
Heart failure ٱ
Hypotension ٱ
Hypertension ٱ
Other ٱ ________________________________________
Neurological diseases ٱ
AVC ٱ
Parkinson ٱ
MS ٱ
Head trauma ٱ
Other ٱ __________________________________________
Diabetes ٱ
Cholesterol ٱ
27
Glaucoma ٱ
Kidney ٱ
Asthma, respiratory disease ٱ
Infectious illness ٱ
Unstable thyroid dysfunction ٱ
Adrenal dysfunction ٱ
Lupus ٱ
Peptic or gastric ulcer in the past year ٱ
Psychiatric disorders in the past or currently ٱ
Depression ٱ
Bipolar disorder ٱ
Anxious disorder ٱ
Schizophrenia ٱ
Alcohol/Drug ٱ
Dementia ٱ
Other ٱ____________________________________
General Rx?
Neuroleptics ٱ
Anti-depressant ٱ
Anxiolytics ٱ
GC's ٱ
Mineralocorticoids ٱ
Anti-convulsivants ٱ
Anti-Parkinsonnien ٱ
Sedatives ٱ
Cholesterol ٱ
CNS ٱ
Other ٱ______________________________________
General anesthesia in the last year? _______________________________
Have there been any major life events in the past year? Ex. a change of residence, death of a
close family member within the past 6 months…
______________________________________________________________
______________________________________________________________
28
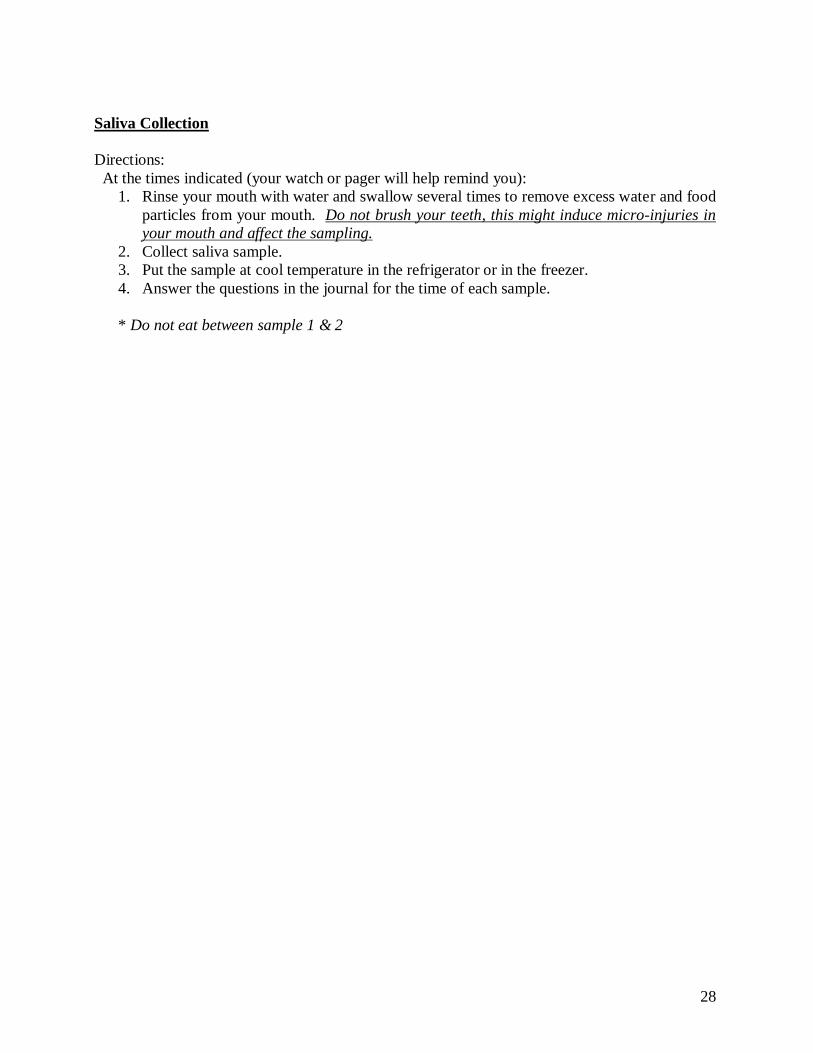
Saliva Collection
Directions:
At the times indicated (your watch or pager will help remind you):
1. Rinse your mouth with water and swallow several times to remove excess water and food
particles from your mouth. Do not brush your teeth, this might induce micro-injuries in
your mouth and affect the sampling.
2. Collect saliva sample.
3. Put the sample at cool temperature in the refrigerator or in the freezer.
4. Answer the questions in the journal for the time of each sample.
* Do not eat between sample 1 & 2
Top Related