


Languages
Pages
Legal

Ammar AlkhaldiReal Reliability
15 March 2016
PART 1: why you shall not use MTBF!!!
How to Measure Reliability
Measurement can help us to answer the followings question:
Are we doing good or bad ?
Is our performance increasing or decreasing ?
Which unit is performing better ? (Benchmarking)
What/How to improve ?
“You can’t improve what you can’t measure”
Why are we measuring things ?
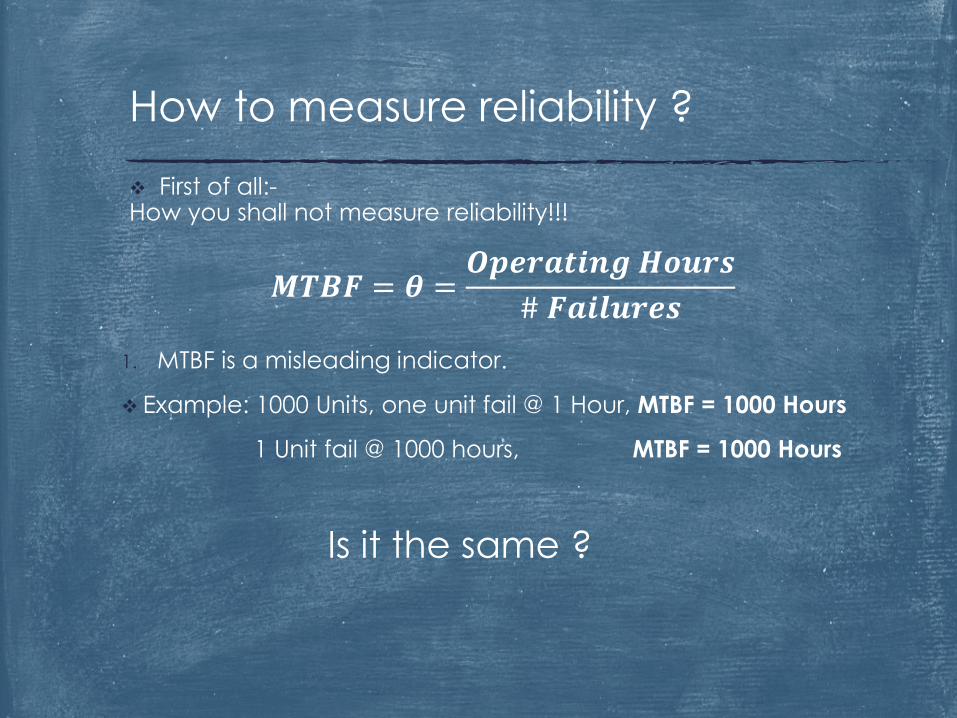
1. MTBF is a misleading indicator.
Example: 1000 Units, one unit fail @ 1 Hour, MTBF = 1000 Hours
1 Unit fail @ 1000 hours, MTBF = 1000 Hours
Is it the same ?
First of all:-How you shall not measure reliability!!!
𝑴𝑻𝑩𝑭 = 𝜽 =𝑶𝒑𝒆𝒓𝒂𝒕𝒊𝒏𝒈 𝑯𝒐𝒖𝒓𝒔
# 𝑭𝒂𝒊𝒍𝒖𝒓𝒆𝒔
How to measure reliability ?
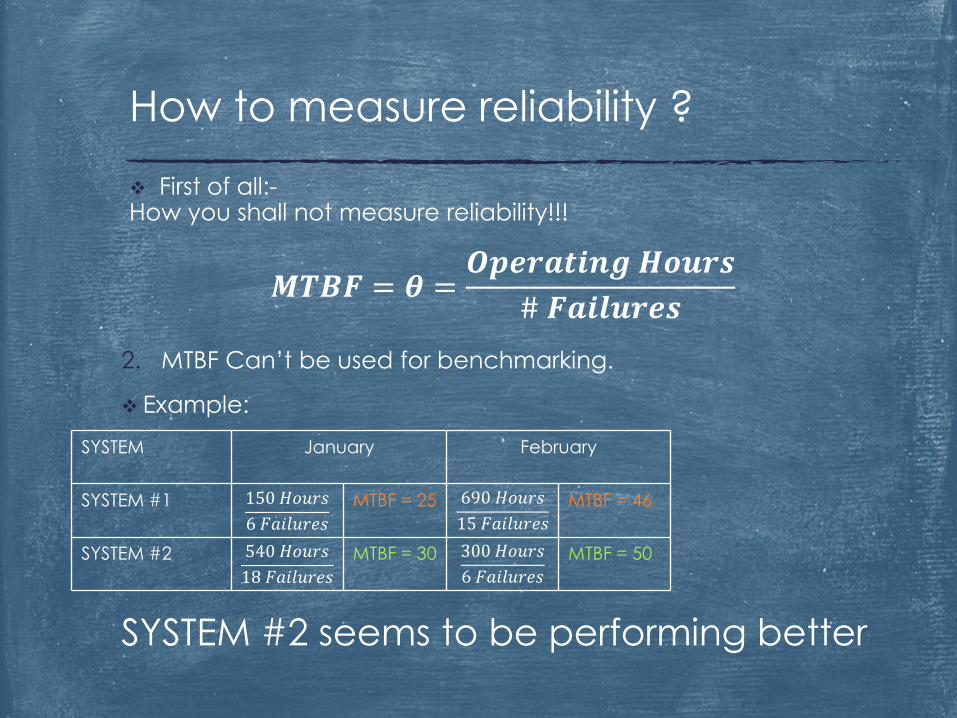
2. MTBF Can’t be used for benchmarking.
Example:
SYSTEM #2 seems to be performing better
First of all:-How you shall not measure reliability!!!
𝑴𝑻𝑩𝑭 = 𝜽 =𝑶𝒑𝒆𝒓𝒂𝒕𝒊𝒏𝒈 𝑯𝒐𝒖𝒓𝒔
# 𝑭𝒂𝒊𝒍𝒖𝒓𝒆𝒔
How to measure reliability ?
SYSTEM January February
SYSTEM #1 150 𝐻𝑜𝑢𝑟𝑠
6 𝐹𝑎𝑖𝑙𝑢𝑟𝑒𝑠
MTBF = 25 690 𝐻𝑜𝑢𝑟𝑠
15 𝐹𝑎𝑖𝑙𝑢𝑟𝑒𝑠
MTBF = 46
SYSTEM #2 540 𝐻𝑜𝑢𝑟𝑠
18 𝐹𝑎𝑖𝑙𝑢𝑟𝑒𝑠
MTBF = 30 300 𝐻𝑜𝑢𝑟𝑠
6 𝐹𝑎𝑖𝑙𝑢𝑟𝑒𝑠
MTBF = 50

2. MTBF Can’t be used for benchmarking.
Example:
But not really.
Any sense ?
First of all:-How you shall not measure reliability!!!
𝑴𝑻𝑩𝑭 = 𝜽 =𝑶𝒑𝒆𝒓𝒂𝒕𝒊𝒏𝒈 𝑯𝒐𝒖𝒓𝒔
# 𝑭𝒂𝒊𝒍𝒖𝒓𝒆𝒔
How to measure reliability ?
SYSTEM January February TOTAL
SYSTEM #1 150 𝐻𝑜𝑢𝑟𝑠
6 𝐹𝑎𝑖𝑙𝑢𝑟𝑒𝑠
MTBF = 25 690 𝐻𝑜𝑢𝑟𝑠
15 𝐹𝑎𝑖𝑙𝑢𝑟𝑒𝑠
MTBF = 46 840 𝐻𝑜𝑢𝑟𝑠
21 𝐹𝑎𝑖𝑙𝑢𝑟𝑒𝑠
MTBF = 40
SYSTEM #2 540 𝐻𝑜𝑢𝑟𝑠
18 𝐹𝑎𝑖𝑙𝑢𝑟𝑒𝑠
MTBF = 30 300 𝐻𝑜𝑢𝑟𝑠
6 𝐹𝑎𝑖𝑙𝑢𝑟𝑒𝑠
MTBF = 50 840 𝐻𝑜𝑢𝑟𝑠
24 𝐹𝑎𝑖𝑙𝑢𝑟𝑒𝑠
MTBF = 35
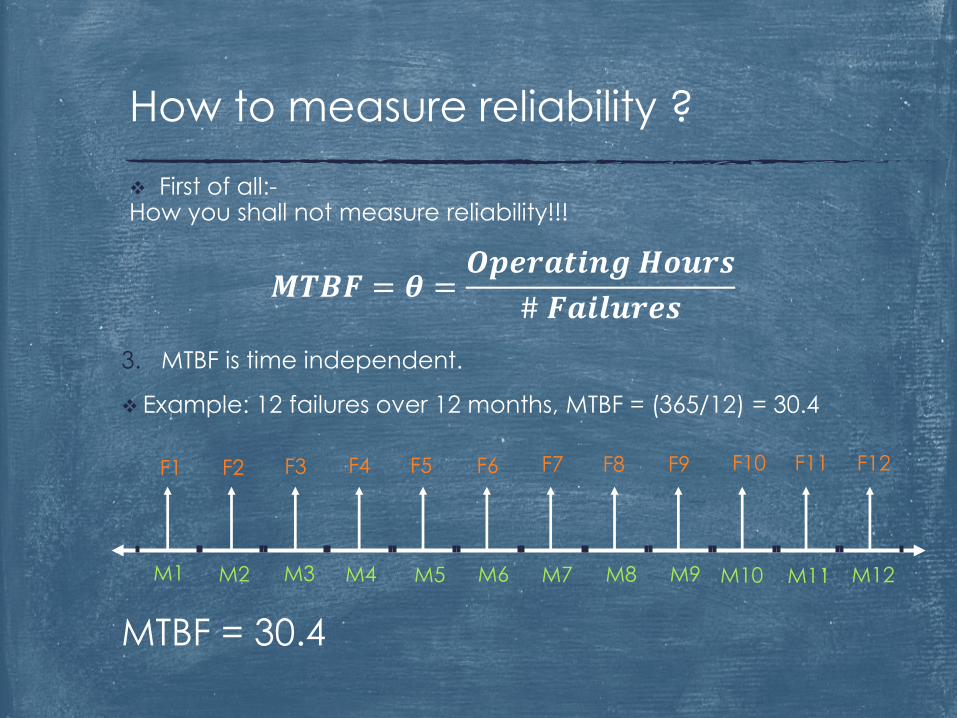
3. MTBF is time independent.
Example: 12 failures over 12 months, MTBF = (365/12) = 30.4
MTBF = 30.4
First of all:-How you shall not measure reliability!!!
𝑴𝑻𝑩𝑭 = 𝜽 =𝑶𝒑𝒆𝒓𝒂𝒕𝒊𝒏𝒈 𝑯𝒐𝒖𝒓𝒔
# 𝑭𝒂𝒊𝒍𝒖𝒓𝒆𝒔
How to measure reliability ?
M1 M2 M3 M4 M5 M6 M7 M8 M9 M10 M11 M12
F1 F2 F3 F4 F5 F7F6 F8 F9 F10 F11 F12
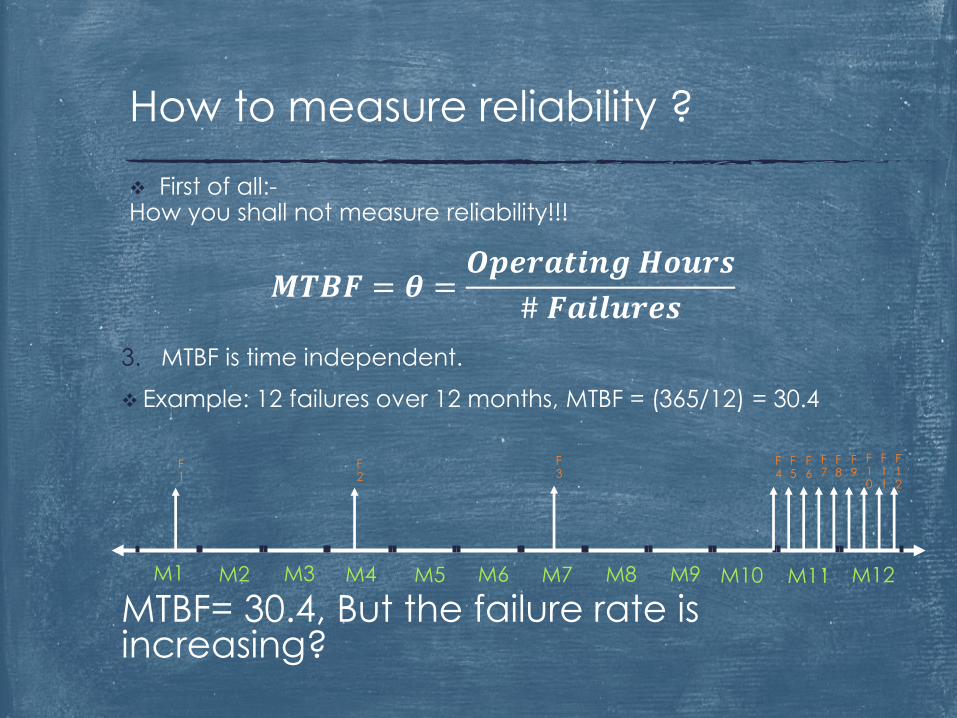
3. MTBF is time independent.
Example: 12 failures over 12 months, MTBF = (365/12) = 30.4
MTBF= 30.4, But the failure rate is increasing?
First of all:-How you shall not measure reliability!!!
𝑴𝑻𝑩𝑭 = 𝜽 =𝑶𝒑𝒆𝒓𝒂𝒕𝒊𝒏𝒈 𝑯𝒐𝒖𝒓𝒔
# 𝑭𝒂𝒊𝒍𝒖𝒓𝒆𝒔
How to measure reliability ?
M1 M2 M3 M4 M5 M6 M7 M8 M9 M10 M11 M12
F1
F2
F3
F4
F5
F7
F6
F8
F9
F10
F11
F12

3. MTBF is time independent.
Example: 12 failures over 12 months, MTBF = (365/12) = 30.4
MTBF= 30.4, But the failure rate is decreasing?
First of all:-How you shall not measure reliability!!!
𝑴𝑻𝑩𝑭 = 𝜽 =𝑶𝒑𝒆𝒓𝒂𝒕𝒊𝒏𝒈 𝑯𝒐𝒖𝒓𝒔
# 𝑭𝒂𝒊𝒍𝒖𝒓𝒆𝒔
How to measure reliability ?
M1 M2 M3 M4 M5 M6 M7 M8 M9 M10 M11 M12
F1
F2
F3
F4
F5
F7
F6
F8
F9
F10
F11
F12
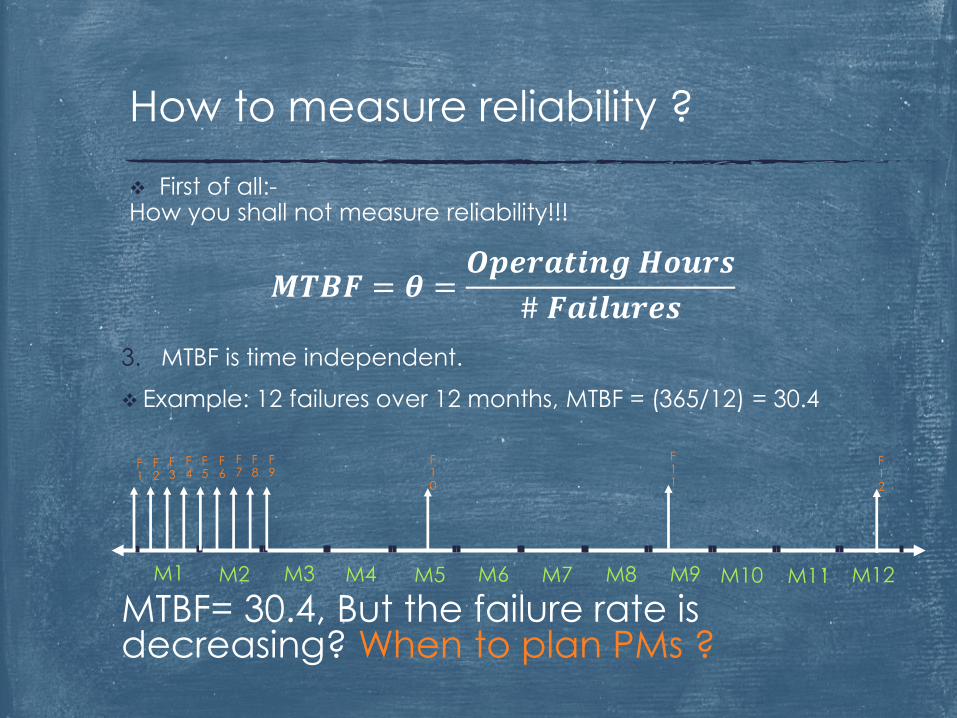
3. MTBF is time independent.
Example: 12 failures over 12 months, MTBF = (365/12) = 30.4
MTBF= 30.4, But the failure rate is decreasing? When to plan PMs ?
First of all:-How you shall not measure reliability!!!
𝑴𝑻𝑩𝑭 = 𝜽 =𝑶𝒑𝒆𝒓𝒂𝒕𝒊𝒏𝒈 𝑯𝒐𝒖𝒓𝒔
# 𝑭𝒂𝒊𝒍𝒖𝒓𝒆𝒔
How to measure reliability ?
M1 M2 M3 M4 M5 M6 M7 M8 M9 M10 M11 M12
F1
F2
F3
F4
F5
F7
F6
F8
F9
F10
F11
F12

4. MTBF considering normal distribution, is your data so ?
Example:
But first, how different distribution can make different result/decision ?
First of all:-How you shall not measure reliability!!!
𝑴𝑻𝑩𝑭 = 𝜽 =𝑶𝒑𝒆𝒓𝒂𝒕𝒊𝒏𝒈 𝑯𝒐𝒖𝒓𝒔
# 𝑭𝒂𝒊𝒍𝒖𝒓𝒆𝒔
How to measure reliability ?

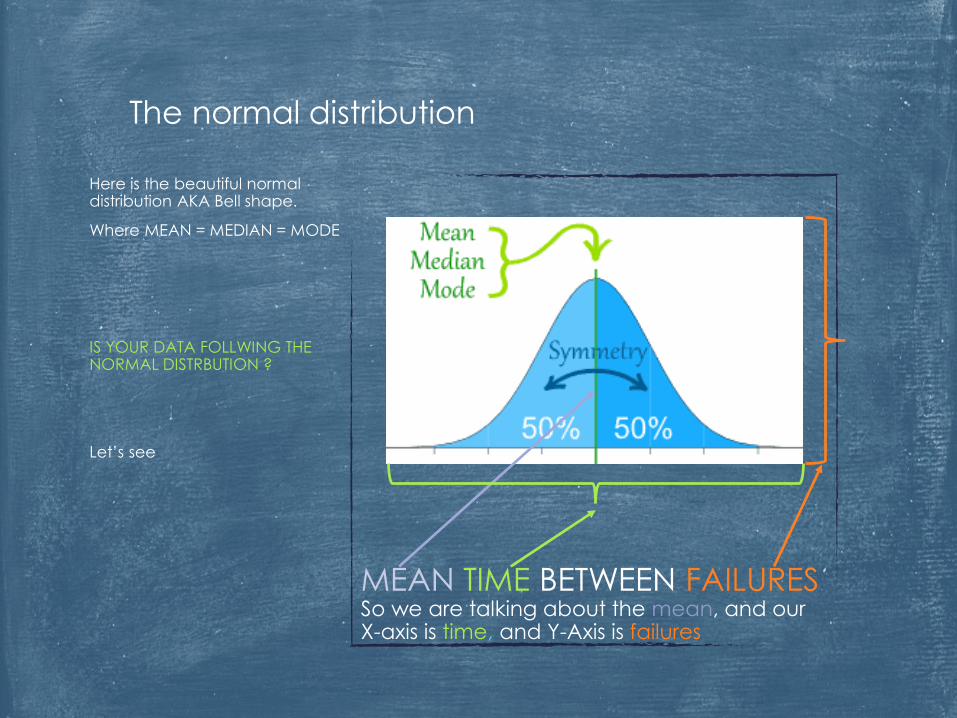
Here is the beautiful normal distribution AKA Bell shape.
Where MEAN = MEDIAN = MODE
The normal distribution
MEAN TIME BETWEEN FAILURESSo we are talking about the mean, and our X-axis is time, and Y-Axis is failures

Here is the beautiful normal distribution AKA Bell shape.
Where MEAN = MEDIAN = MODE
IS YOUR DATA FOLLWING THE NORMAL DISTRBUTION ?
The normal distribution
MEAN TIME BETWEEN FAILURESSo we are talking about the mean, and our X-axis is time, and Y-Axis is failures
Here is the beautiful normal distribution AKA Bell shape.
Where MEAN = MEDIAN = MODE
IS YOUR DATA FOLLWING THE NORMAL DISTRBUTION ?
Let’s see
The normal distribution
MEAN TIME BETWEEN FAILURESSo we are talking about the mean, and our X-axis is time, and Y-Axis is failures

Let’s say we are studding the failure of lightbulb, we have a group of 100 bulb, and we are running in the constant failure rate part of the bath curve (Phase 2)
The normal distribution
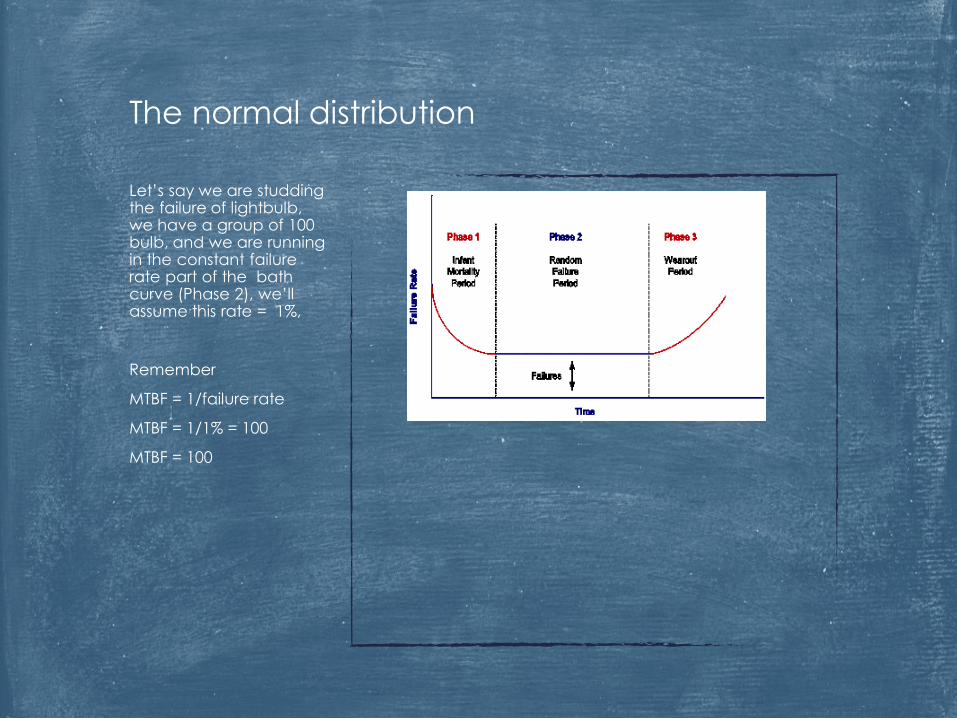
Let’s say we are studding the failure of lightbulb, we have a group of 100 bulb, and we are running in the constant failure rate part of the bath curve (Phase 2), we’ll assume this rate = 1%,
Remember
MTBF = 1/failure rate
MTBF = 1/1% = 100
MTBF = 100
The normal distribution
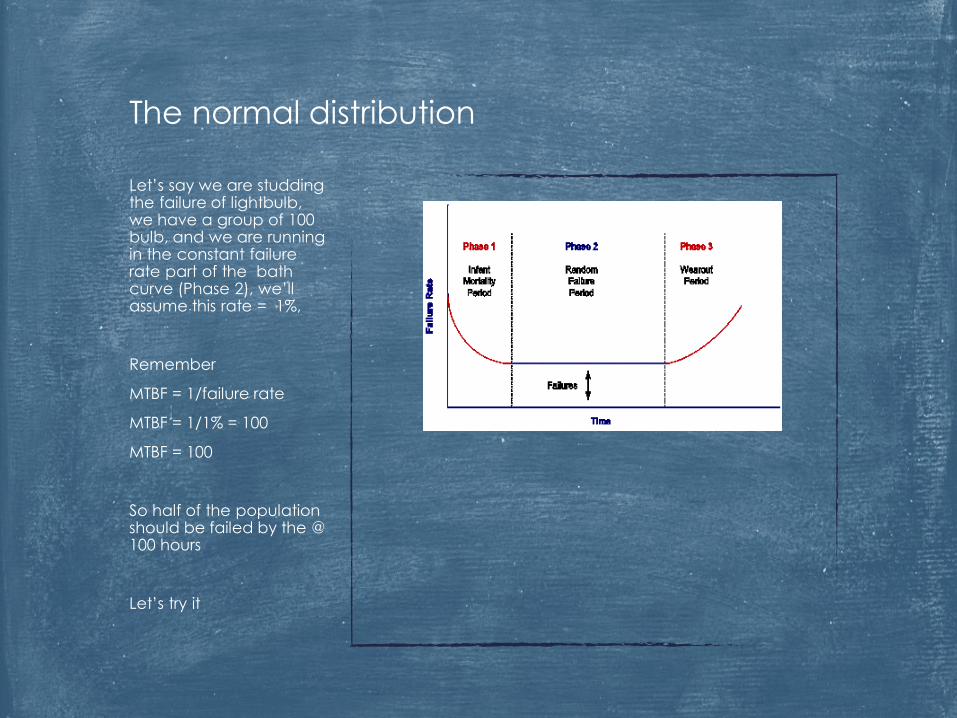
Let’s say we are studding the failure of lightbulb, we have a group of 100 bulb, and we are running in the constant failure rate part of the bath curve (Phase 2), we’ll assume this rate = 1%,
Remember
MTBF = 1/failure rate
MTBF = 1/1% = 100
MTBF = 100
So half of the population should be failed by the @ 100 hours
Let’s try it
The normal distribution
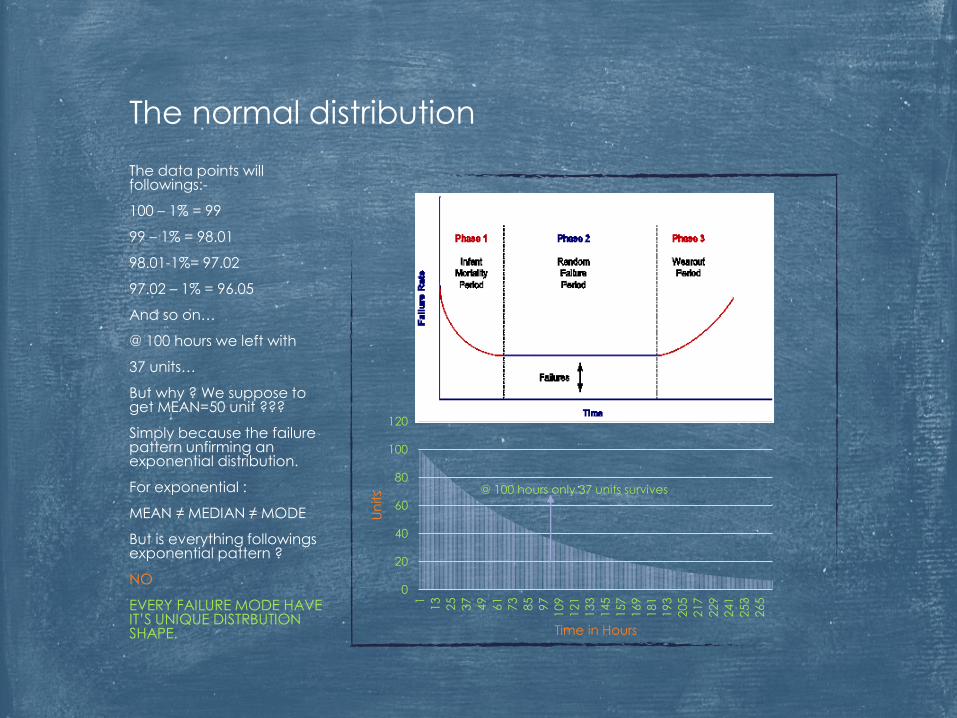
The data points will followings:-
100 – 1% = 99
99 – 1% = 98.01
98.01-1%= 97.02
97.02 – 1% = 96.05
And so on…
@ 100 hours we left with
37 units…
But why ? We suppose to get MEAN=50 unit ???
Simply because the failure pattern unfirming an exponential distribution.
For exponential :
MEAN ≠ MEDIAN ≠ MODE
But is everything followings exponential pattern ?
NO
EVERY FAILURE MODE HAVE IT’S UNIQUE DISTRBUTION SHAPE.
The normal distribution
0
20
40
60
80
100
1201
13
25
37
49
61
73
85
97
109
121
133
145
157
169
181
193
205
217
229
241
253
265
Un
its
Time in Hours
@ 100 hours only 37 units survives
If you think MTBF is not the wright way to measure reliability then stay toned for the upcoming post.
Salam
Ammar Alkhaldi, CSSBB
So how to measure reliability then ?
Top Related