


Languages
Pages
Legal

1THE URBAN INSTITUTE / Washington, D.C.
How Has Teacher Compensation Changed?
Report Prepared for the
National Conference on Teacher Compensation and Evaluation
Dan Goldhaber
The Urban [email protected]

2THE URBAN INSTITUTE / Washington, D.C.
Concern Over Teacher Salaries
• “We’re beginning to see a slight improvement in salaries, but it’s a drop in the bucket compared with what needs to be done to hire sufficient numbers of talented teachers. . . When engineering, law, accounting and computer firms need high-quality employees, they’re willing to pay good salaries to attract the best and brightest. It shouldn’t be any different when it comes to educating our children.”
– Sandra Feldman, AFT President
3THE URBAN INSTITUTE / Washington, D.C.
Policy Significance
• Teachers matter!– Unmeasured characteristics - Goldhaber et al. (1999),
Rivkin, Hanushek, and Kain (1998), Sanders (1997)
– Academic Skills - Ehrenberg and Brewer (1994), Strauss and Sawyer (1986), Wayne (2001)
– Ferguson (1991, 1998)• Increasing teacher test scores by 1 standard deviation raises
student scores by .17 standard deviations
4THE URBAN INSTITUTE / Washington, D.C.
Teachers’ Skills
• On average, teachers have– Lower standardized test scores– Require more remediation in college– Attend lower quality undergraduate institutions
• “College graduates with high test scores are less likely to take jobs, employed teachers are less likely to stay, and former teachers with high test scores are less likely to return” (Murnane, et al. 1991, p. 10)

5THE URBAN INSTITUTE / Washington, D.C.
943
968
999 10001003 999
800
850
900
950
1000
1050
Individual SAT Average SAT of IncomingFreshmen
Av
era
ge
Co
mb
ine
d S
AT
Sc
ore
Public School Teacher Private School Teacher Non-Teacher
** Denotes statistically significant differences (p=.05)Data Source: Baccalaureate and Beyond First (1994) and Second (1997) Follow-Ups.
=56** =60** =32** =31**
Average SAT Scores

6THE URBAN INSTITUTE / Washington, D.C.
Teacher Compensation andShortage Issues
• Rising enrollments• Class-size reduction policies• Tight labor market
Teacher shortage– May exacerbate teacher quality problems
• Assumption: compensation affects decisions– Compensation must be measured correctly to determine
the incentives
– Teachers should not be thought of generically

7THE URBAN INSTITUTE / Washington, D.C.
What Has Happened to Salaries?
• From 1980 to 1997 teachers’ salaries increased by 120 percent, but …– Only a 19 percent increase in real terms, while
salaries in other occupations increased by 29 percent
– Changes in teacher demographics– Tremendous changes in working conditions

8THE URBAN INSTITUTE / Washington, D.C.
Various Measures of Change in Compensation
• Average compensation (salary & benefits)– Over time– Relative to other occupations
• Starting salaries– Over time– Relative to other occupations
• Discussion of structure of teacher salaries relative to salaries in other occupations

9THE URBAN INSTITUTE / Washington, D.C.
Data
• Bureau of Labor Statistics’ National Compensation and Employee Benefits Surveys
• National Center for Education Statistics’ Baccalaureate and Beyond
• U.S. Department of Education’s Digest of Education Statistics
• American Federation of Teachers
10THE URBAN INSTITUTE / Washington, D.C.
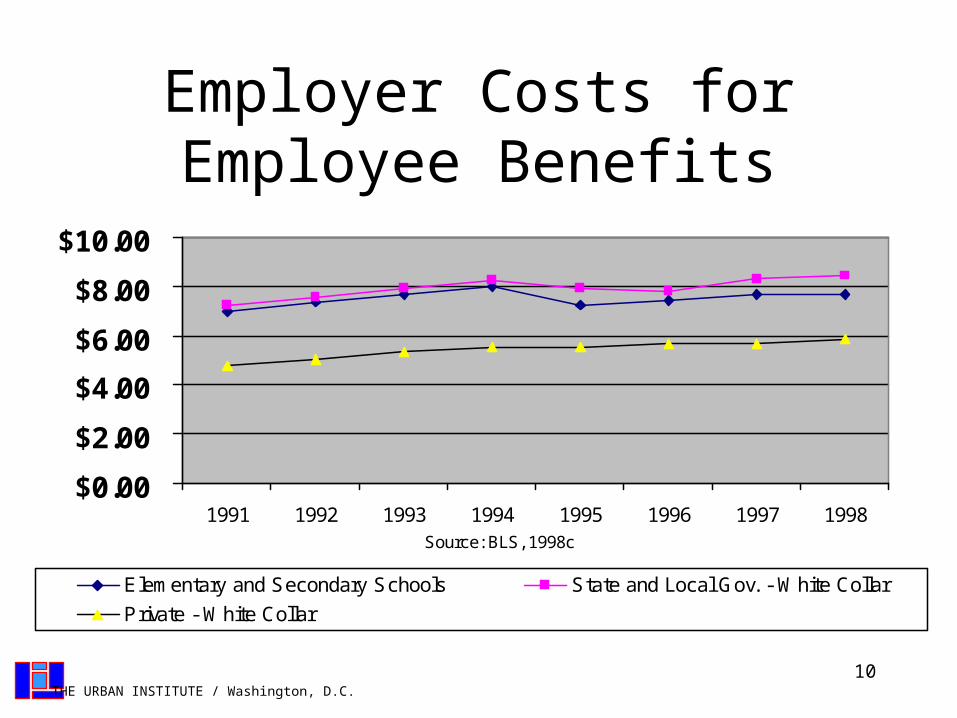
Employer Costs for Employee Benefits
$0.00
$2.00
$4.00
$6.00
$8.00
$10.00
1991 1992 1993 1994 1995 1996 1997 1998Source: BLS, 1998c
Elementary and Secondary Schools State and Local Gov. - White Collar
Private - White Collar
11THE URBAN INSTITUTE / Washington, D.C.
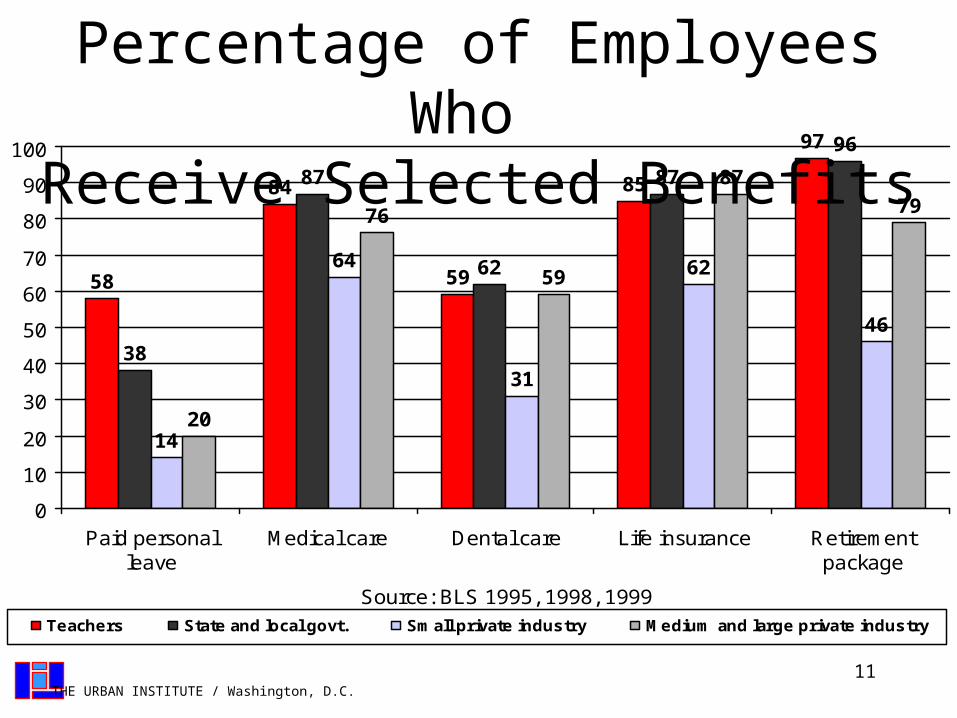
58
84
59
85
97
38
87
62
87
96
14
64
31
62
46
20
76
59
87
79
0
10
20
30
40
50
60
70
80
90
100
Paid personalleave
Medical care Dental care Life insurance Retirementpackage
Source: BLS 1995, 1998, 1999
Teachers State and local govt. Small private industry Medium and large private industry
Percentage of Employees Who Receive Selected Benefits
12THE URBAN INSTITUTE / Washington, D.C.
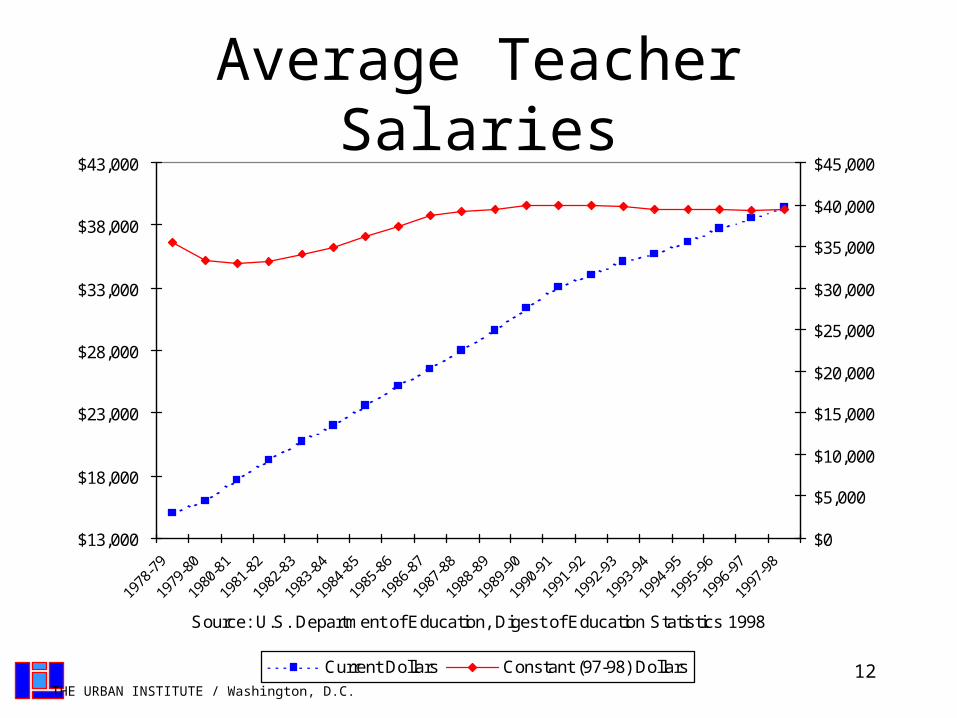
Average Teacher Salaries
$13,000
$18,000
$23,000
$28,000
$33,000
$38,000
$43,000
1978
-79
1979
-80
1980
-81
1981
-82
1982
-83
1983
-84
1984
-85
1985
-86
1986
-87
1987
-88
1988
-89
1989
-90
1990
-91
1991
-92
1992
-93
1993
-94
1994
-95
1995
-96
1996
-97
1997
-98
Source: U.S. Department of Education, Digest of Education Statistics 1998
$0
$5,000
$10,000
$15,000
$20,000
$25,000
$30,000
$35,000
$40,000
$45,000
Current Dollars Constant (97-98) Dollars

13THE URBAN INSTITUTE / Washington, D.C.
Growth Rate in Wages and Salaries
4.5%
3.3%
4.6%4.3%
8.9%
6.0%
2.8%
7.2%
6.6%
0.0%
1.0%
2.0%
3.0%
4.0%
5.0%
6.0%
7.0%
8.0%
9.0%
10.0%19
81
1982
1983
1984
1985
1986
1987
1988
1989
1990
1991
1992
1993
1994
1995
1996
1997
1998
Source: Goldhaber (2001)
Private - White Collar State and Local Gov. - While Collar Elementary and Secondary Schools

14THE URBAN INSTITUTE / Washington, D.C.
Summary: Changes in Average Salary and Benefits
• Benefit coverage:– Comparable to coverage offered to other state and
local employees– Exceeds that offered in the private sector as a whole
• Growth in teachers’ average salaries:– Lagged other sectors in the 1970s & early 1980s,
exceeded other sectors during 1980s & early1990s
15THE URBAN INSTITUTE / Washington, D.C.
Average vs Starting Salaries
• Average salaries are driven by degree and experience level only– Average salary can increase w/o increases in starting salary
• Shifts in degree and experience distribution can increase average salaries without making teaching a more attractive profession
– Shifts in the age distribution can increase average salaries
– Evidence of backloading (Lankford and Wyckoff, 1997)
• Starting salaries may be more relevant to individuals considering teaching as an occupation
16THE URBAN INSTITUTE / Washington, D.C.
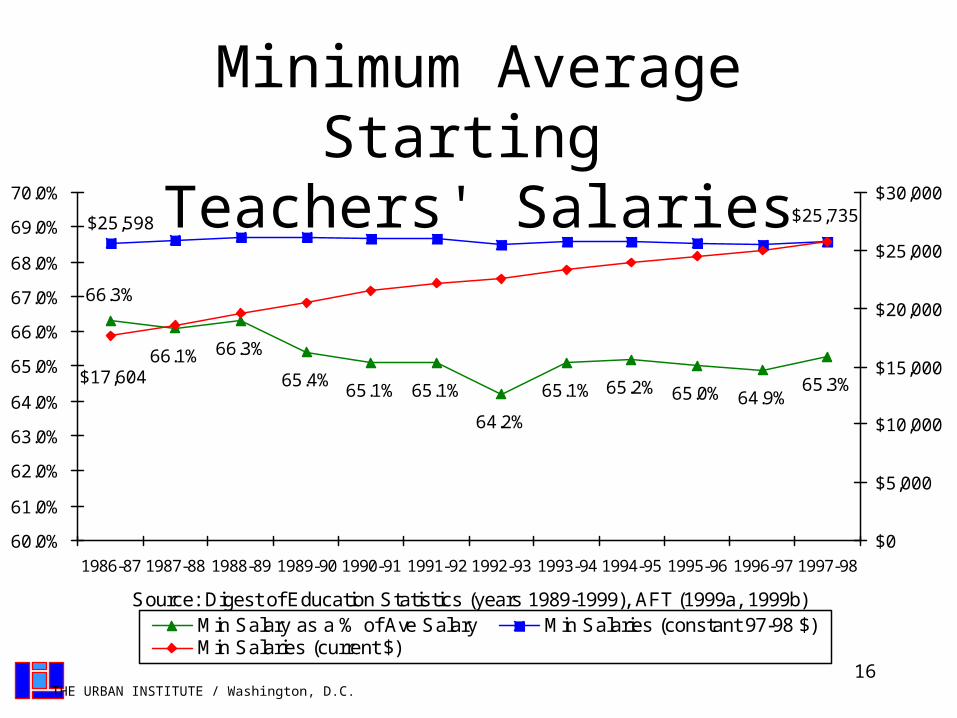
66.1% 66.3%
65.4%65.1% 65.1% 65.1% 65.2% 65.0% 64.9%
64.2%
65.3%
66.3%
$25,735$25,598
$17,604
60.0%
61.0%
62.0%
63.0%
64.0%
65.0%
66.0%
67.0%
68.0%
69.0%
70.0%
1986-87 1987-88 1988-89 1989-90 1990-91 1991-92 1992-93 1993-94 1994-95 1995-96 1996-97 1997-98
Source: Digest of Education Statistics (years 1989-1999), AFT (1999a, 1999b)
$0
$5,000
$10,000
$15,000
$20,000
$25,000
$30,000
Min Salary as a % of Ave Salary Min Salaries (constant 97-98 $)Min Salaries (current $)
Minimum Average Starting Teachers' Salaries

17THE URBAN INSTITUTE / Washington, D.C.
1
1.1
1.2
1.3
1.4
1.5
1.6
1.7
1.8
1.9
2
1972 1976 1978 1980 1982 1984 1986 1988 1990 1992 1994 1995 1996 1997Source: Schneider and Nelson (1998)
Engineering Accounting Sales/Marketing Business Admin. Liberal Arts
Chemistry Math or Statistics Economics/Finance Computer Science
Ratio of Starting Salaries in Select Occupations to Starting Salaries in Teaching

18THE URBAN INSTITUTE / Washington, D.C.
1
1.2
1.4
1.6
1.8
2
2.2
2.4
2.6
2.8
3
1978 1980 1982 1984 1986 1988 1990 1992 1994 1995 1996 1997
Source: Schneider and Nelson (1998)
Teaching* Engineering Accounting Sales/Marketing Business Admin.
Liberal Arts Chemistry Math or Statistics Economics/Finance Computer Science
Starting Salaries Indexed to 1978Teaching
19THE URBAN INSTITUTE / Washington, D.C.
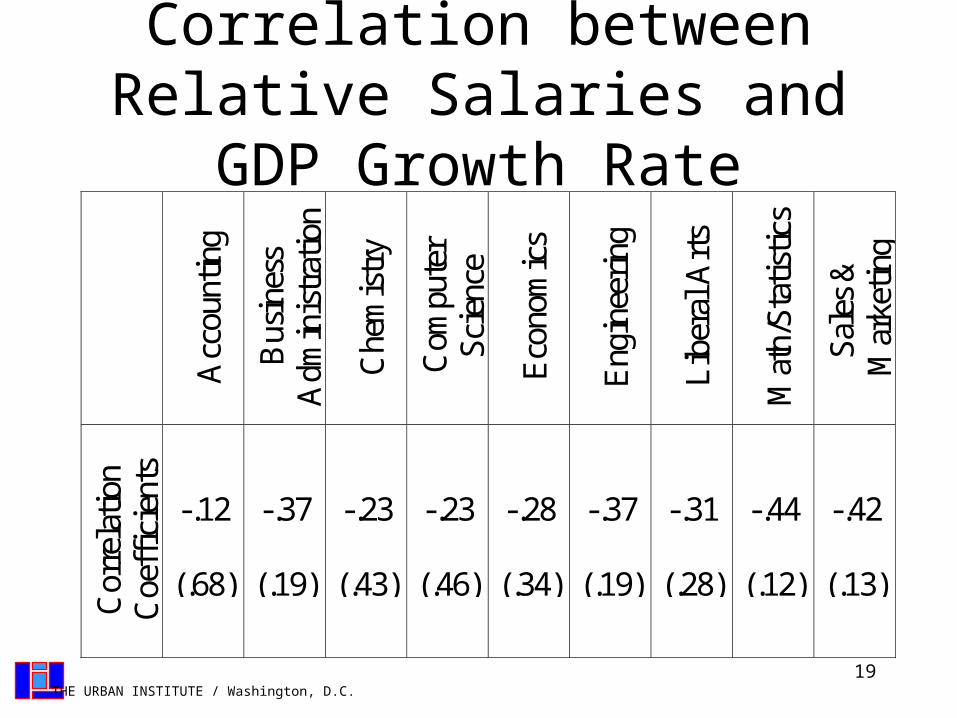
Correlation between Relative Salaries and GDP Growth Rate
Acc
ount
ing
Bus
ines
sA
dmin
istr
atio
n
Che
mis
try
Com
pute
rS
cien
ce
Eco
nom
ics
Eng
inee
ring
Lib
eral
Art
s
Mat
h/S
tatis
tics
Sal
es &
Mar
ketin
g
Cor
rela
tion
Coe
ffic
ient
s
-.12
(.68)
-.37
(.19)
-.23
(.43)
-.23
(.46)
-.28
(.34)
-.37
(.19)
-.31
(.28)
-.44
(.12)
-.42
(.13)
20THE URBAN INSTITUTE / Washington, D.C.
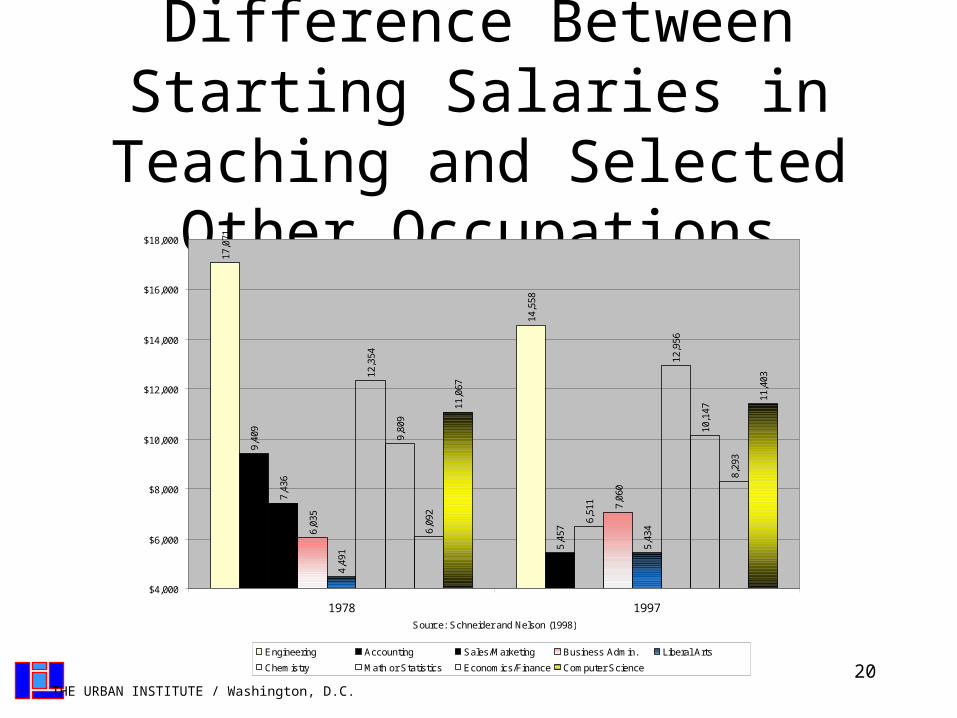
Difference Between Starting Salaries in Teaching and Selected
Other Occupations17
,071
14,5
58
9,40
9
5,45
7
7,43
6
6,51
1
6,03
5
7,06
0
4,49
1 5,43
4
12,3
54 12,9
56
9,80
9
10,1
47
6,09
2
8,29
3
11,0
67
11,4
03
$4,000
$6,000
$8,000
$10,000
$12,000
$14,000
$16,000
$18,000
1978 1997
Source: Schneider and Nelson (1998)
Engineering Accounting Sales/Marketing Business Admin. Liberal Arts
Chemistry Math or Statistics Economics/Finance Computer Science

21THE URBAN INSTITUTE / Washington, D.C.
Structure of Compensationin Education
• Single salary schedule– 1921 was adopted in Denver, CO & Des
Moines, IA– Places teachers on salary lanes based on degree
and experience levels only
• Today over 95 percent of school districts use this pay structure– Average salaries may not be a good indicator

22THE URBAN INSTITUTE / Washington, D.C.
You Can’t Escape the Labor Market
• Hedonic wage theory applies (Chambers, 1998)• Sorting occurs along non-pecuniary lines
– Graduates of more selective colleges are more likely to teach higher income, higher achieving students
– Shortages in particular subject areas
• Shortages vary by:– Region
– Subject area
– School system demographics
23THE URBAN INSTITUTE / Washington, D.C.
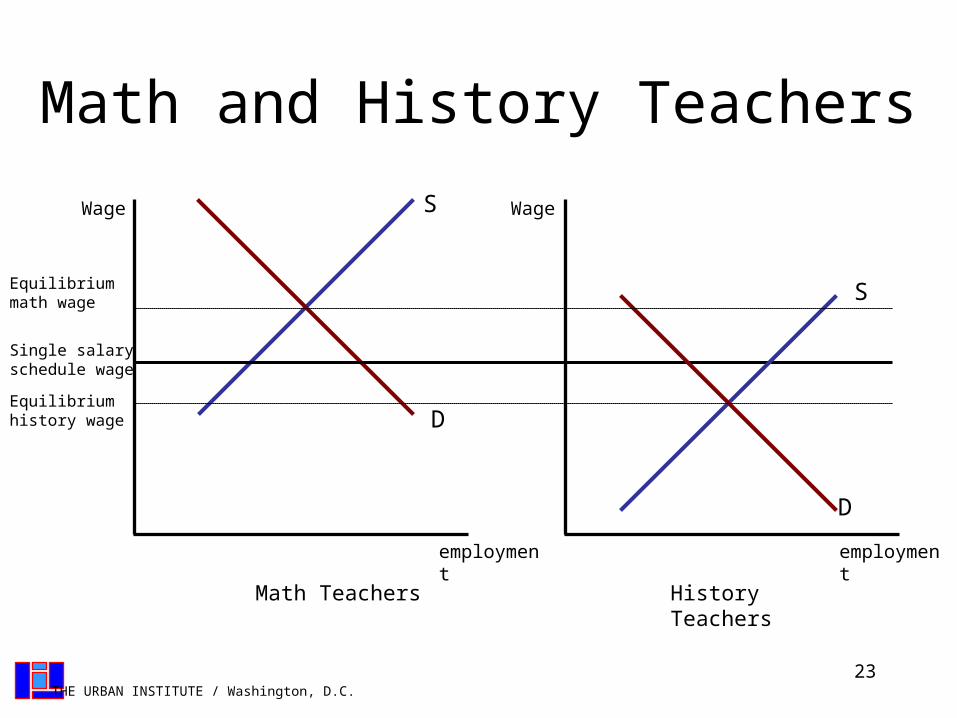
Math and History Teachers
Wage Wage
employment employment
Single salary schedule wage
Math Teachers History Teachers
D
D
S
SEquilibrium math wage
Equilibrium history wage

24THE URBAN INSTITUTE / Washington, D.C.
Important Changes Under the Surface
• Labor market differentially rewards skills• Important changes under the surface
– Returns to college quality and technical college skills (degree major) have increased
• There is an increasing return to graduating from a top college or university (Brewer et al., 1999)
• There is an increase in the gap (in entry level salaries) between education and technical majors (Grogger and Eide, 1995)
• Single salary schedule does not reflect these changes

25THE URBAN INSTITUTE / Washington, D.C.
SAT Score by Sector and Major
1011
938
1128
987
1081
985
0
200
400
600
800
1000
1200
Technical Major Non Technical Major
Co
mb
ine
d S
AT
Sc
ore
Public School Teacher Private School Teacher Non-Teacher
Data Source: Baccalaureate and Beyond First (1994) and Second (1997) Follow-Ups.
=117 =70
=49 =47

26THE URBAN INSTITUTE / Washington, D.C.
Average Salary as a Function of SAT (Bachelor’s Degree)
10000
15000
20000
25000
30000
35000
40000
45000
50000
400 600 800 1000 1200 1400 1600
Combined SAT Score
An
nu
al S
alar
y
Public School Teachers
Private School Teachers
Non-Teachers
Data Source: Baccalaureate and Beyond Second (1997) Follow-Up.Notes: Trendline estimates are based on the full sample of SAT scores and annual salaries.Data points represent average salaries for all individuals who obtained a given SAT score.

27THE URBAN INSTITUTE / Washington, D.C.
Starting Salary as a Function of SAT (Bachelor’s Degree)
10000
15000
20000
25000
30000
35000
40000
45000
50000
400 600 800 1000 1200 1400 1600
Combined SAT Score
Sta
rtin
g S
alar
y
Public School Teachers
Private School Teachers
Non-Teachers
Data Source: Baccalaureate and Beyond Second (1997) Follow-Up.Notes: Trendline estimates are based on the full sample of SAT scores and annual salaries.Data points represent average salaries for all individuals who obtained a given SAT score.

28THE URBAN INSTITUTE / Washington, D.C.
Average Salary as a Function of SAT (Masters Degree and Above)
10000
15000
20000
25000
30000
35000
40000
45000
50000
400 600 800 1000 1200 1400 1600
Combined SAT Score
An
nu
al S
alar
y
Public School Teachers
Private School Teachers
Non-Teachers
Data Source: Baccalaureate and Beyond Second (1997) Follow-Up.Notes: Trendline estimates are based on the full sample of SAT scores and annual salaries.Data points represent average salaries for all individuals who obtained a given SAT score.

29THE URBAN INSTITUTE / Washington, D.C.
Starting Salary as a Function of SAT (Masters Degree and Above)
10000
15000
20000
25000
30000
35000
40000
45000
50000
400 600 800 1000 1200 1400 1600
Combined SAT Score
Sta
rtin
g S
alar
y
Public School Teachers
Private School Teachers
Non-Teachers
Data Source: Baccalaureate and Beyond Second (1997) Follow-Up.Notes: Trendline estimates are based on the full sample of SAT scores and annual salaries.Data points represent average salaries for all individuals who obtained a given SAT score.

30THE URBAN INSTITUTE / Washington, D.C.
Preliminary Analyses
X represents a vector of background characteristics and pub is an indicator for a public school teacher
)*( xxY pubpub
Public School Teachers Non-Teachers
Age NS +
Experience + +
Sex NS +
College Quality NS +Masters Degree + NS
Technical Major NS +GPA NS +

31THE URBAN INSTITUTE / Washington, D.C.
Implications of Findings
• Public schools do reward master degrees but do not reward individual SAT, college quality, or technical majors.– e.g. individuals with technical majors estimated
to make $4470 more than non-technical majors outside of teaching, but about $2000 less in teaching
32THE URBAN INSTITUTE / Washington, D.C.
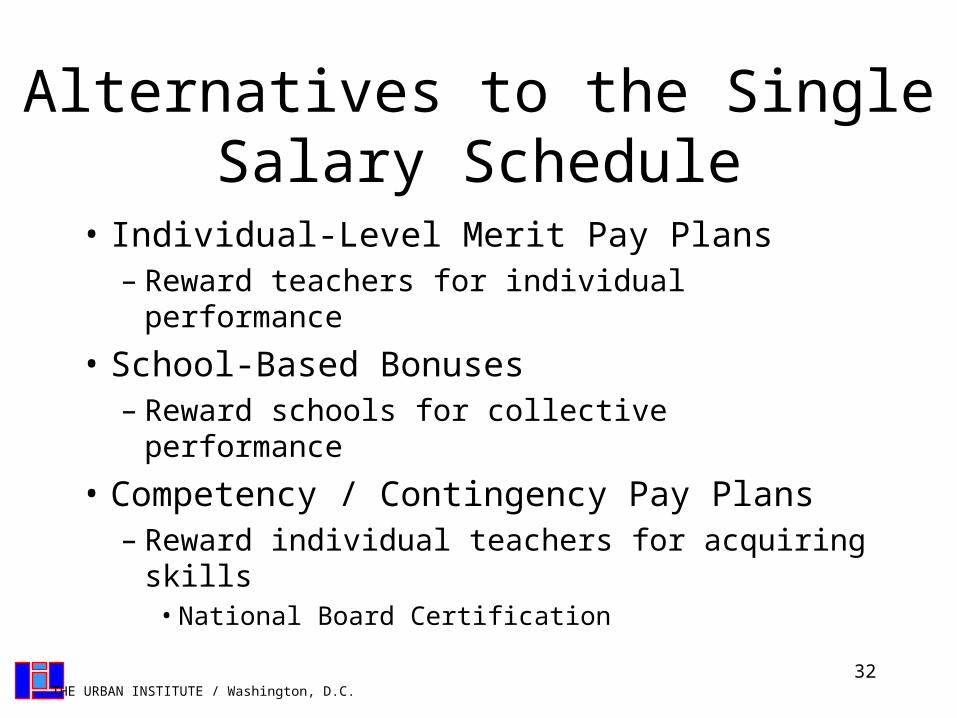
Alternatives to the SingleSalary Schedule
• Individual-Level Merit Pay Plans– Reward teachers for individual performance
• School-Based Bonuses– Reward schools for collective performance
• Competency / Contingency Pay Plans– Reward individual teachers for acquiring skills
• National Board Certification
33THE URBAN INSTITUTE / Washington, D.C.
Conclusion
• How has teacher compensation changed? It has and it hasn’t
– It’s the structure stupid!• Need for more research on the impact of
alternative compensation structures on the recruitment and retention of types of teachers
Top Related