


Languages
Pages
Legal


Written by Karl Behrendt (Charles Sturt University) and Peter Weeks (Weeks Consulting Services) Commissioned by Meat & Livestock Australia
January 2019
How are global and Australian beef feedlots performing? Global agri benchmark network results 2018

Market InformationMeat & Livestock AustraliaPh: 02 9463 9372Fax: 02 9463 9220Email: [email protected]
www.mla.com.au
Published by Meat & Livestock Australia Limited ABN 39 081 678 364January 2019© Meat & Livestock Australia Limited 2019
MLA Market Information Report – How are global and Australian beef feedlots performing?
Page i – Global agri benchmark network results 2018 – BEEF FEEDLOTS
MLA makes no representation as to the accuracy of any information or advice contained in this document and excludes all liability, whether in contract, tort (including negligence or breach of statutory duty) or otherwise as a result of reliance by any person on such information or advice. Reproduction in whole or part of this publication is prohibited without prior consent and acknowledgement of Meat & Livestock Australia.
All use of MLA publications, reports and information is subject to MLA’s Market Report and Information Terms of Use. Please read our terms of use carefully and ensure you are familiar with its content – click here for MLA’s terms of use.
ContentsHighlights ........................................................................1
Introduction .........................................................................1
What is agri benchmark?....................................................1
Global performance of beef feedlots ............................... 4Background ..................................................................................... 4Whole farm profit performance summary ................................... 4Live weight at start and weight at end of finishing phase ....... 5Daily weight gain ............................................................................ 5Comparison of feeder and beef prices from 2015 to 2017 ...... 6Trading margins .............................................................................. 7Contributors to the total costs of production ............................ 8Labour costs and productivity ...................................................... 9Costs, returns and profitability ..................................................... 9In comparison…Australian grain-based beef finishing systems have: .................................................................................10
Global agri benchmark network results 2018 – BEEF FEEDLOTS – Page 1
MLA Market Information Report – How are global and Australian beef feedlots performing?
How are global & Australian beef producers performing?
Global agri benchmark network results 2016
1 See https://www.mla.com.au/prices-markets/Trends-analysis/agribenchmark/ 2 See http://www.agribenchmark.org/home.html
HighlightsBeef feedlots
• Less than half of the grain-finished beef systems analysed through the international agri benchmark beef network continually achieve long-term profitability. The analysed typified Australian feedlot is one of the few systems that has achieved long-term profitability from 2015 to 2017.
• This 2015 to 2017 period was tumultuous, commencing with near-record cattle prices in the US beef industry but low cattle prices in Australia under severe drought. By 2016, US cattle prices had fallen sharply while Australian prices rose to record levels after the drought broke.
• The Australian system achieves, globally, the highest daily weight gains with days-on-feed shorter than most, but high entry and slaughter weights, which is comparable to North American systems.
• Even though the Australian system has received above average prices for beef and has paid below average prices for feeder cattle, the trading margin has fluctuated around US$550 per head, similar to that achieved in North America. This is half that achieved in China, and nearly double that achieved in South America and Africa.
• Both operational and total costs of production have continually increased from 2015 to 2017, with around 60% of the systems analysed achieving a lower cost of production than the Australian system.
• Total returns for the Australian grain-fed finishing system have increased from 2015 to 2017 and continually covered the long-run costs of production – out performing most beef finishing systems in the world.
IntroductionThis report uses physical and financial data on agri benchmark typical feedlots around the world to evaluate how competitive Australian beef feedlots are and how productivity differs from other countries?
It should be read in conjunction with the main MLA agri benchmark beef report entitled How are global and Australian beef producers performing 20181 – in order to obtain perspectives on global developments in beef finishing, the economics and drivers facing beef producers around the world, feedlot profitability relative to other beef finishing systems (globally and in network countries) and views on likely future developments and challenges.
The analysis and perspectives are as of mid-2018, though farm data is for the 2017 calendar year.
What is agri benchmark?2
agri benchmark is a global, non-profit and non-political network of agricultural economists, advisors, producers and specialists in key sectors of agricultural value chains. The cattle network has over 30 member countries, covering 75% of world beef production and has been producing the results of comparative analysis over the last 16 years.
The core competence of the network is in analysing production systems, their economics, drivers and perspectives.
agri benchmark aims to assist:
• producers and their organisations to better align future production through analysis of comparative performance and positioning;
• non-profit organisations (governments, NGOs, international organisations) to monitor global agricultural challenges; and
• agri-businesses to operate successfully through in-depth understanding of markets and customers.
agri benchmark has branches covering beef cattle, sheep, dairy, pigs, cash crops, horticulture, organic farming and fish. Within cattle, it covers both breeding and finishing enterprises (cow-calf and cattle finishing). It is also unique in being able to separately measure the performance of breeding and finishing operations even on joint breeding/finishing enterprises. Furthermore, it measures beef enterprise performance separately from (and together with) other outputs where the enterprise is diversified (in southern Australia typically with cropping and/or sheep).
Page 2 – Global agri benchmark network results 2018 – BEEF FEEDLOTS
MLA Market Information Report – How are global and Australian beef feedlots performing?
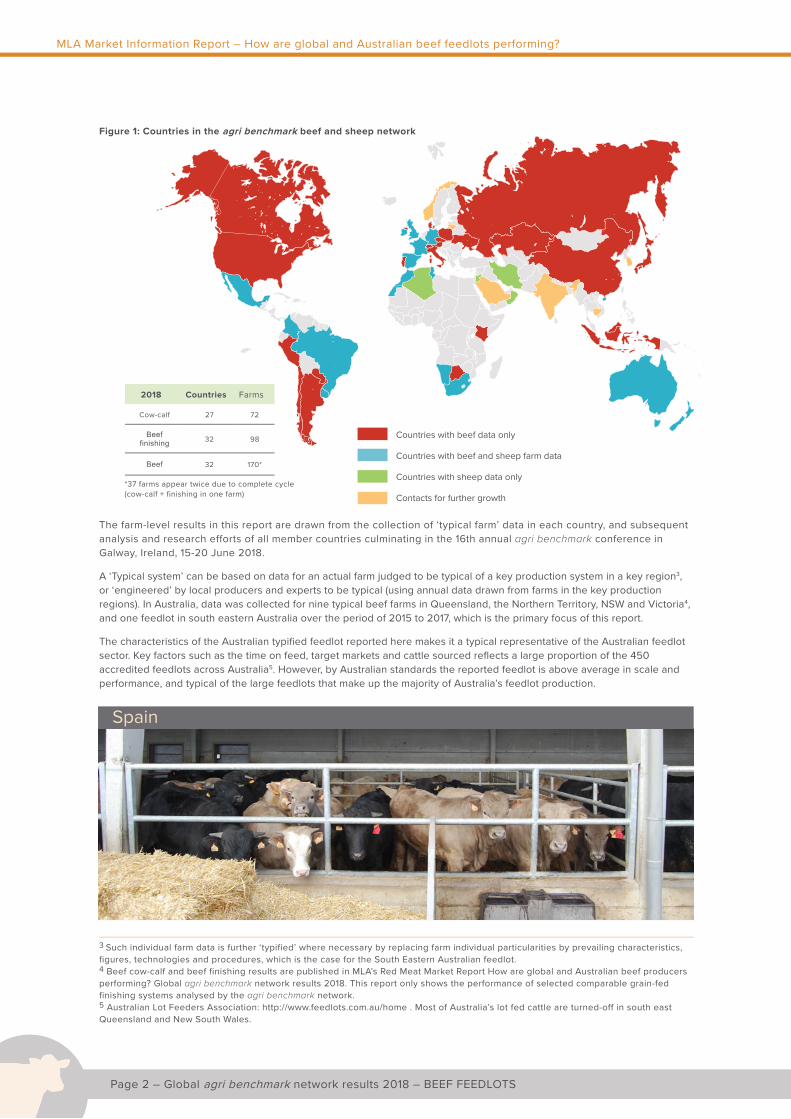
Figure 1: Countries in the agri benchmark beef and sheep network
Countries with beef data only
Countries with beef and sheep farm data
Countries with sheep data only
Contacts for further growth
2018 Countries Farms
Cow-calf 27 72
Beef finishing 32 98
Beef 32 170*
*37 farms appear twice due to complete cycle (cow-calf + finishing in one farm)
The farm-level results in this report are drawn from the collection of ‘typical farm’ data in each country, and subsequent analysis and research efforts of all member countries culminating in the 16th annual agri benchmark conference in Galway, Ireland, 15-20 June 2018.
A ‘Typical system’ can be based on data for an actual farm judged to be typical of a key production system in a key region3, or ‘engineered’ by local producers and experts to be typical (using annual data drawn from farms in the key production regions). In Australia, data was collected for nine typical beef farms in Queensland, the Northern Territory, NSW and Victoria4, and one feedlot in south eastern Australia over the period of 2015 to 2017, which is the primary focus of this report.
The characteristics of the Australian typified feedlot reported here makes it a typical representative of the Australian feedlot sector. Key factors such as the time on feed, target markets and cattle sourced reflects a large proportion of the 450 accredited feedlots across Australia5. However, by Australian standards the reported feedlot is above average in scale and performance, and typical of the large feedlots that make up the majority of Australia’s feedlot production.
3 Such individual farm data is further ‘typified’ where necessary by replacing farm individual particularities by prevailing characteristics, figures, technologies and procedures, which is the case for the South Eastern Australian feedlot. 4 Beef cow-calf and beef finishing results are published in MLA’s Red Meat Market Report How are global and Australian beef producers performing? Global agri benchmark network results 2018. This report only shows the performance of selected comparable grain-fed finishing systems analysed by the agri benchmark network. 5 Australian Lot Feeders Association: http://www.feedlots.com.au/home . Most of Australia’s lot fed cattle are turned-off in south east Queensland and New South Wales.
Spain
Global agri benchmark network results 2018 – BEEF FEEDLOTS – Page 3
MLA Market Information Report – How are global and Australian beef feedlots performing?
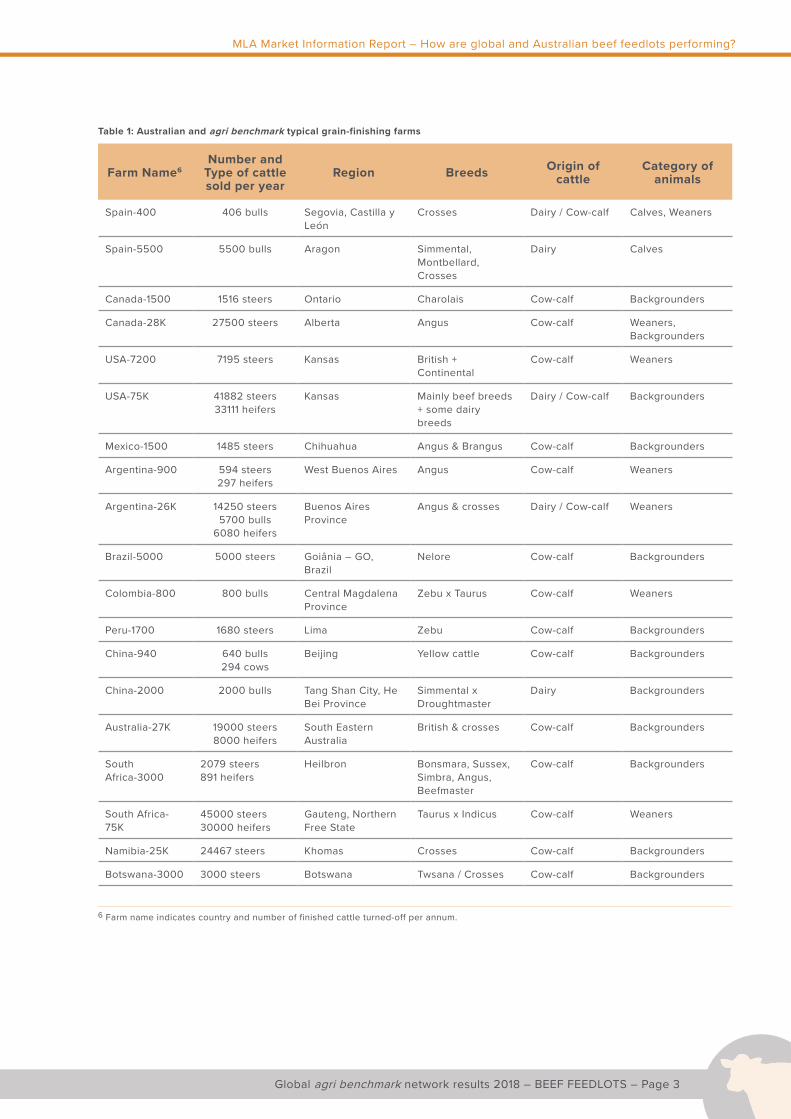
Table 1: Australian and agri benchmark typical grain-finishing farms
Farm Name6Number and
Type of cattle sold per year
Region Breeds Origin of cattle
Category of animals
Spain-400 406 bulls Segovia, Castilla y León
Crosses Dairy / Cow-calf Calves, Weaners
Spain-5500 5500 bulls Aragon Simmental, Montbellard, Crosses
Dairy Calves
Canada-1500 1516 steers Ontario Charolais Cow-calf Backgrounders
Canada-28K 27500 steers Alberta Angus Cow-calf Weaners, Backgrounders
USA-7200 7195 steers Kansas British + Continental
Cow-calf Weaners
USA-75K 41882 steers33111 heifers
Kansas Mainly beef breeds + some dairy breeds
Dairy / Cow-calf Backgrounders
Mexico-1500 1485 steers Chihuahua Angus & Brangus Cow-calf Backgrounders
Argentina-900 594 steers297 heifers
West Buenos Aires Angus Cow-calf Weaners
Argentina-26K 14250 steers5700 bulls
6080 heifers
Buenos Aires Province
Angus & crosses Dairy / Cow-calf Weaners
Brazil-5000 5000 steers Goiânia – GO, Brazil
Nelore Cow-calf Backgrounders
Colombia-800 800 bulls Central Magdalena Province
Zebu x Taurus Cow-calf Weaners
Peru-1700 1680 steers Lima Zebu Cow-calf Backgrounders
China-940 640 bulls294 cows
Beijing Yellow cattle Cow-calf Backgrounders
China-2000 2000 bulls Tang Shan City, He Bei Province
Simmental x Droughtmaster
Dairy Backgrounders
Australia-27K 19000 steers8000 heifers
South Eastern Australia
British & crosses Cow-calf Backgrounders
South Africa-3000
2079 steers891 heifers
Heilbron Bonsmara, Sussex, Simbra, Angus, Beefmaster
Cow-calf Backgrounders
South Africa-75K
45000 steers30000 heifers
Gauteng, Northern Free State
Taurus x Indicus Cow-calf Weaners
Namibia-25K 24467 steers Khomas Crosses Cow-calf Backgrounders
Botswana-3000 3000 steers Botswana Twsana / Crosses Cow-calf Backgrounders
6 Farm name indicates country and number of finished cattle turned-off per annum.
Page 4 – Global agri benchmark network results 2018 – BEEF FEEDLOTS
MLA Market Information Report – How are global and Australian beef feedlots performing?
Global performance of beef feedlots
BackgroundThe feedlot results presented below are for the 2015-2017 period, years for which we have agri benchmark results for a typical Australian feedlot.
This was a tumultuous period in global and Australian cattle markets and encompassed both relatively low and high Australia and US cattle prices.
US cattle prices were at record levels in 2014 and 2015, but then fell substantially in 2016, as supplies responded to high returns. In contrast, the Australian cattle industry was just emerging from a severe 3-year drought in 2015, beginning with relatively low cattle prices, but which rose rapidly to record levels by mid-2016. Hence, Australian cattle prices were lower-than-average relative to US prices in 2015, much higher-than-average by the mid-2016 price peak and close-to-average in 2017.
Other analyses, based on grainfed cattle, feeder cattle and grain costs, suggest that feedlot margins in Australia were average-to-high in 2015 and 2016, on the back of rising cattle sale prices and lower feed grain costs (despite rising feeder cattle costs7). By 2017, margins appeared to have declined at be average or a bit below average.
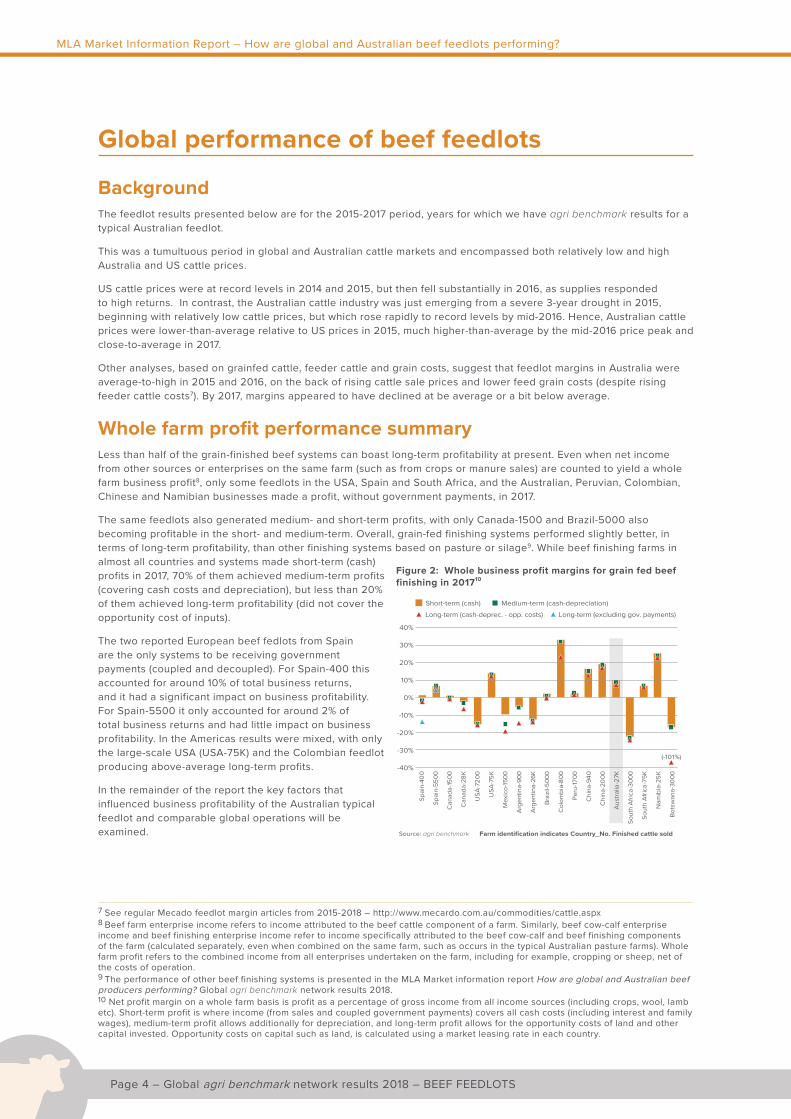
Whole farm profit performance summaryLess than half of the grain-finished beef systems can boast long-term profitability at present. Even when net income from other sources or enterprises on the same farm (such as from crops or manure sales) are counted to yield a whole farm business profit8, only some feedlots in the USA, Spain and South Africa, and the Australian, Peruvian, Colombian, Chinese and Namibian businesses made a profit, without government payments, in 2017.
The same feedlots also generated medium- and short-term profits, with only Canada-1500 and Brazil-5000 also becoming profitable in the short- and medium-term. Overall, grain-fed finishing systems performed slightly better, in terms of long-term profitability, than other finishing systems based on pasture or silage9. While beef finishing farms in almost all countries and systems made short-term (cash) profits in 2017, 70% of them achieved medium-term profits (covering cash costs and depreciation), but less than 20% of them achieved long-term profitability (did not cover the opportunity cost of inputs).
The two reported European beef fedlots from Spain are the only systems to be receiving government payments (coupled and decoupled). For Spain-400 this accounted for around 10% of total business returns, and it had a significant impact on business profitability. For Spain-5500 it only accounted for around 2% of total business returns and had little impact on business profitability. In the Americas results were mixed, with only the large-scale USA (USA-75K) and the Colombian feedlot producing above-average long-term profits.
In the remainder of the report the key factors that influenced business profitability of the Australian typical feedlot and comparable global operations will be examined.
7 See regular Mecado feedlot margin articles from 2015-2018 – http://www.mecardo.com.au/commodities/cattle.aspx 8 Beef farm enterprise income refers to income attributed to the beef cattle component of a farm. Similarly, beef cow-calf enterprise income and beef finishing enterprise income refer to income specifically attributed to the beef cow-calf and beef finishing components of the farm (calculated separately, even when combined on the same farm, such as occurs in the typical Australian pasture farms). Whole farm profit refers to the combined income from all enterprises undertaken on the farm, including for example, cropping or sheep, net of the costs of operation. 9 The performance of other beef finishing systems is presented in the MLA Market information report How are global and Australian beef producers performing? Global agri benchmark network results 2018. 10 Net profit margin on a whole farm basis is profit as a percentage of gross income from all income sources (including crops, wool, lamb etc). Short-term profit is where income (from sales and coupled government payments) covers all cash costs (including interest and family wages), medium-term profit allows additionally for depreciation, and long-term profit allows for the opportunity costs of land and other capital invested. Opportunity costs on capital such as land, is calculated using a market leasing rate in each country.
30%
40%
Source: agri benchmark
-40%
0%
-30%
Farm identification indicates Country_No. Finished cattle sold
Spai
n-40
0
Spai
n-55
00
Can
ada-
1500
Can
ada-
28K
USA
-720
0
USA
-75K
Mex
ico-
1500
Arg
entin
a-90
0
Arg
entin
a-26
K
Braz
il-50
00
Col
ombi
a-80
0
Peru
-1700
Chi
na-9
40
Chi
na-2
000
Aus
tralia
-27K
Sout
h A
frica
-300
0
Sout
h A
frica
-75K
Nam
ibia
-25K
Bots
wan
a-30
00
(-101%)
Short-term (cash) Medium-term (cash-depreciation)Long-term (cash-deprec. - opp. costs) Long-term (excluding gov. payments)
20%
10%
-10%
-20%
Figure 2: Whole business profit margins for grain fed beef finishing in 201710
Global agri benchmark network results 2018 – BEEF FEEDLOTS – Page 5
MLA Market Information Report – How are global and Australian beef feedlots performing?
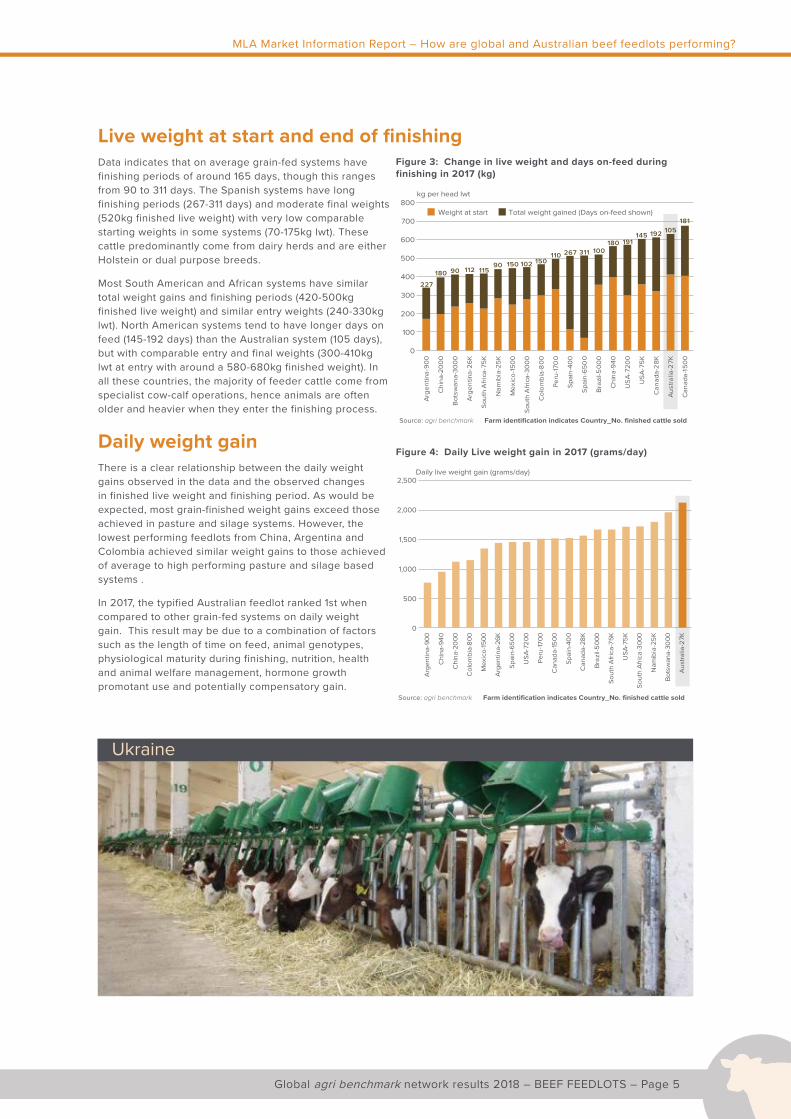
Live weight at start and end of finishingData indicates that on average grain-fed systems have finishing periods of around 165 days, though this ranges from 90 to 311 days. The Spanish systems have long finishing periods (267-311 days) and moderate final weights (520kg finished live weight) with very low comparable starting weights in some systems (70-175kg lwt). These cattle predominantly come from dairy herds and are either Holstein or dual purpose breeds.
Most South American and African systems have similar total weight gains and finishing periods (420-500kg finished live weight) and similar entry weights (240-330kg lwt). North American systems tend to have longer days on feed (145-192 days) than the Australian system (105 days), but with comparable entry and final weights (300-410kg lwt at entry with around a 580-680kg finished weight). In all these countries, the majority of feeder cattle come from specialist cow-calf operations, hence animals are often older and heavier when they enter the finishing process.
Daily weight gainThere is a clear relationship between the daily weight gains observed in the data and the observed changes in finished live weight and finishing period. As would be expected, most grain-finished weight gains exceed those achieved in pasture and silage systems. However, the lowest performing feedlots from China, Argentina and Colombia achieved similar weight gains to those achieved of average to high performing pasture and silage based systems .
In 2017, the typified Australian feedlot ranked 1st when compared to other grain-fed systems on daily weight gain. This result may be due to a combination of factors such as the length of time on feed, animal genotypes, physiological maturity during finishing, nutrition, health and animal welfare management, hormone growth promotant use and potentially compensatory gain.
700
800
Source: agri benchmark
0
400
100
Farm identification indicates Country_No. finished cattle sold
Weight at start Total weight gained (Days on-feed shown)
600
500
300
200
227180 90 112 115
90 150 102 150110 267 311 100
180 191145 192 105
181
Arge
ntin
a-90
0
Chi
na-2
000
Bot
swan
a-30
00
Arge
ntin
a-26
K
Sout
h A
frica
-75K
Nam
ibia
-25K
Mex
ico-
1500
Sout
h A
frica
-300
0
Col
ombi
a-8
00
Peru
-170
0
Spai
n-40
0
Spai
n-65
00
Bra
zil-5
000
Chi
na-9
40
USA
-720
0
USA
-75K
Can
ada-
28K
Aust
ralia
-27K
Can
ada-
1500
kg per head lwt
Figure 3: Change in live weight and days on-feed during finishing in 2017 (kg)
Source: agri benchmark
0
2,500
500
Farm identification indicates Country_No. finished cattle sold
2,000
1,500
Daily live weight gain (grams/day)
Arg
entin
a-90
0
Chi
na-9
40
Chi
na-2
000
Col
ombi
a-80
0
Mex
ico-
1500
Arg
entin
a-26
K
Spai
n-65
00
USA
-720
0
Peru
-1700
Can
ada-
1500
Spai
n-40
0
Can
ada-
28K
Braz
il-50
00
Sout
h A
frica
-75K
USA
-75K
Sout
h A
frica
-300
0
Nam
ibia
-25K
Bots
wan
a-30
00
Aus
tralia
-27K
1,000
Figure 4: Daily Live weight gain in 2017 (grams/day)
Ukraine
Page 6 – Global agri benchmark network results 2018 – BEEF FEEDLOTS
MLA Market Information Report – How are global and Australian beef feedlots performing?
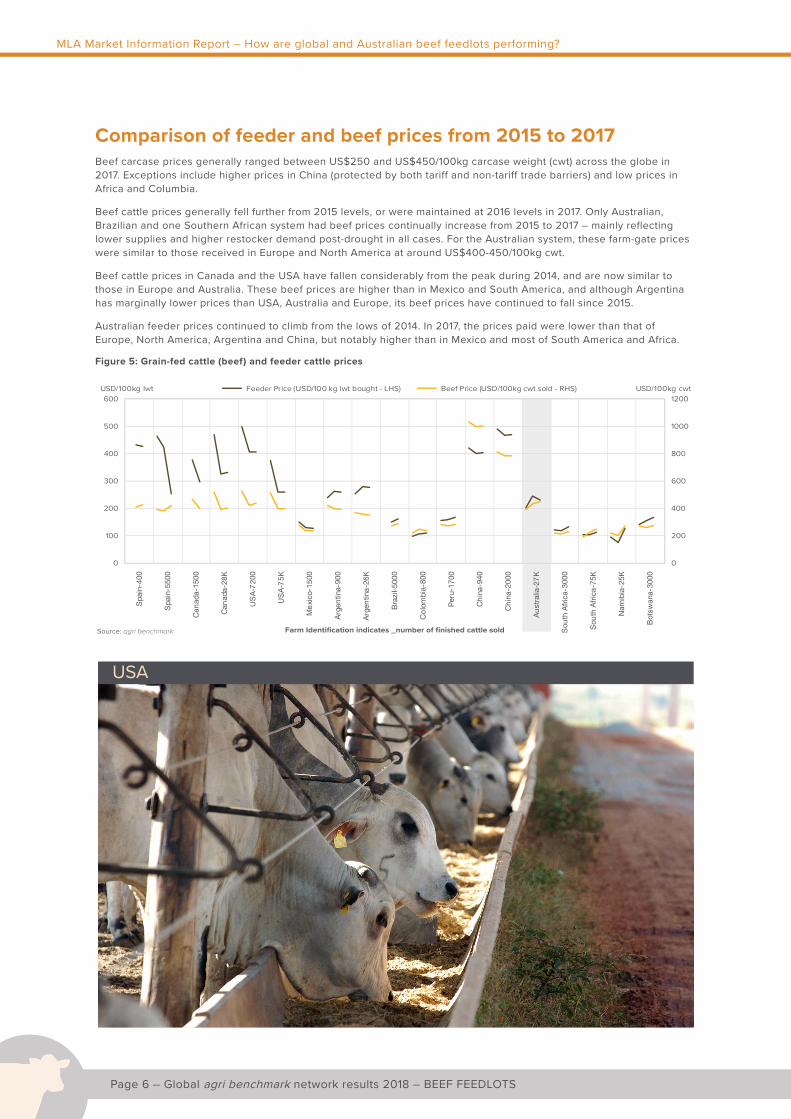
Comparison of feeder and beef prices from 2015 to 2017Beef carcase prices generally ranged between US$250 and US$450/100kg carcase weight (cwt) across the globe in 2017. Exceptions include higher prices in China (protected by both tariff and non-tariff trade barriers) and low prices in Africa and Columbia.
Beef cattle prices generally fell further from 2015 levels, or were maintained at 2016 levels in 2017. Only Australian, Brazilian and one Southern African system had beef prices continually increase from 2015 to 2017 – mainly reflecting lower supplies and higher restocker demand post-drought in all cases. For the Australian system, these farm-gate prices were similar to those received in Europe and North America at around US$400-450/100kg cwt.
Beef cattle prices in Canada and the USA have fallen considerably from the peak during 2014, and are now similar to those in Europe and Australia. These beef prices are higher than in Mexico and South America, and although Argentina has marginally lower prices than USA, Australia and Europe, its beef prices have continued to fall since 2015.
Australian feeder prices continued to climb from the lows of 2014. In 2017, the prices paid were lower than that of Europe, North America, Argentina and China, but notably higher than in Mexico and most of South America and Africa.
Figure 5: Grain-fed cattle (beef) and feeder cattle prices
0
200
400
600
800
1000
1200
0
100
200
300
400
500
600
Spa
in-4
00
Spa
in-5
500
Can
ada-
1500
Can
ada-
28K
US
A-7
200
US
A-7
5K
Me
xico
-150
0
Arg
entin
a-90
0
Arg
entin
a-26
K
Bra
zil-5
000
Co
lom
bia-
800
Per
u-17
00
Ch
ina-
940
Ch
ina-
2000
Au
stra
lia-2
7K
Sou
th A
fric
a-30
00
Sou
th A
fric
a-75
K
Nam
ibia
-25K
Bot
swan
a-30
00
USD/100kg lwt Feeder Price (USD/100 kg lwt bought - LHS) Beef Price (USD/100kg cwt sold - RHS) USD/100kg cwt
Source: agri benchmark Farm Identification indicates _number of finished cattle sold
USA
Global agri benchmark network results 2018 – BEEF FEEDLOTS – Page 7
MLA Market Information Report – How are global and Australian beef feedlots performing?
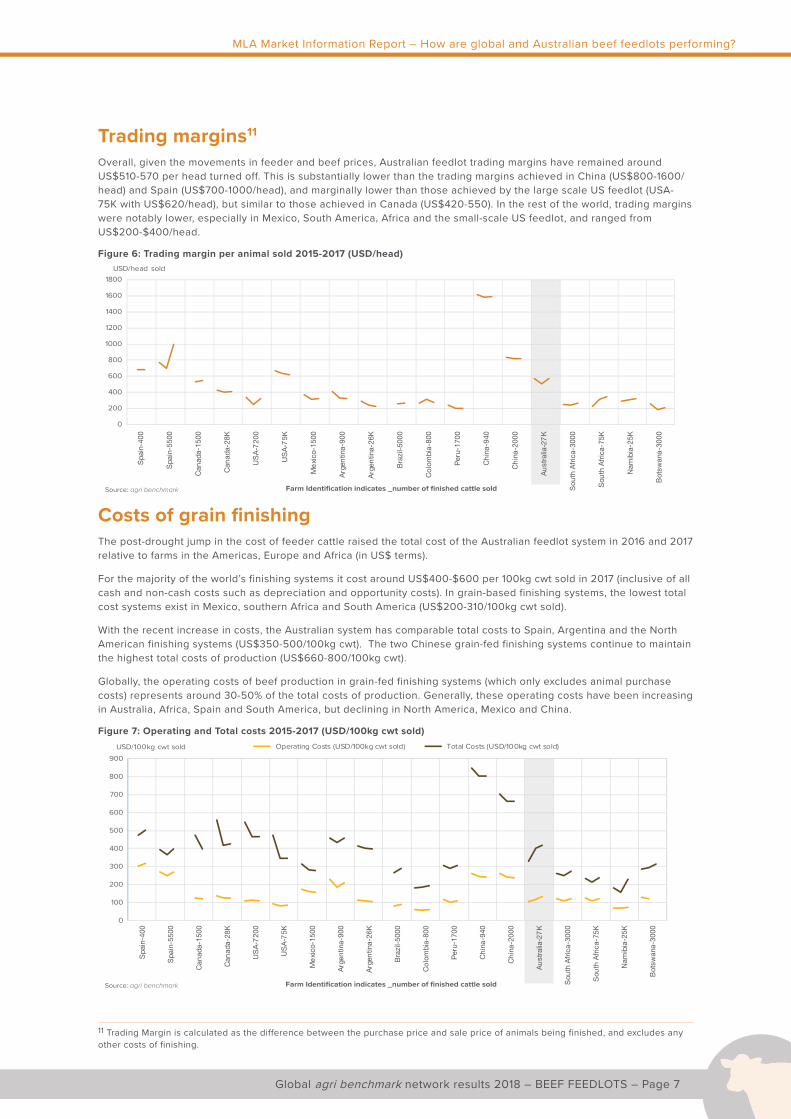
Trading margins11
Overall, given the movements in feeder and beef prices, Australian feedlot trading margins have remained around US$510-570 per head turned off. This is substantially lower than the trading margins achieved in China (US$800-1600/head) and Spain (US$700-1000/head), and marginally lower than those achieved by the large scale US feedlot (USA-75K with US$620/head), but similar to those achieved in Canada (US$420-550). In the rest of the world, trading margins were notably lower, especially in Mexico, South America, Africa and the small-scale US feedlot, and ranged from US$200-$400/head.
Figure 6: Trading margin per animal sold 2015-2017 (USD/head)
Source: agri benchmark Farm Identification indicates _number of finished cattle sold
0
200
400
600
800
1000
1200
1400
1600
1800
Spa
in-4
00
Spa
in-5
500
Can
ada-
1500
Can
ada-
28K
US
A-7
200
US
A-7
5K
Me
xico
-150
0
Arg
entin
a-90
0
Arg
entin
a-26
K
Bra
zil-5
000
Co
lom
bia-
800
Per
u-17
00
Ch
ina-
940
Ch
ina-
2000
Au
stra
lia-2
7K
Sou
th A
fric
a-30
00
Sou
th A
fric
a-75
K
Nam
ibia
-25K
Bot
swan
a-30
00
USD/head sold
Costs of grain finishingThe post-drought jump in the cost of feeder cattle raised the total cost of the Australian feedlot system in 2016 and 2017 relative to farms in the Americas, Europe and Africa (in US$ terms).
For the majority of the world’s finishing systems it cost around US$400-$600 per 100kg cwt sold in 2017 (inclusive of all cash and non-cash costs such as depreciation and opportunity costs). In grain-based finishing systems, the lowest total cost systems exist in Mexico, southern Africa and South America (US$200-310/100kg cwt sold).
With the recent increase in costs, the Australian system has comparable total costs to Spain, Argentina and the North American finishing systems (US$350-500/100kg cwt). The two Chinese grain-fed finishing systems continue to maintain the highest total costs of production (US$660-800/100kg cwt).
Globally, the operating costs of beef production in grain-fed finishing systems (which only excludes animal purchase costs) represents around 30-50% of the total costs of production. Generally, these operating costs have been increasing in Australia, Africa, Spain and South America, but declining in North America, Mexico and China.
Figure 7: Operating and Total costs 2015-2017 (USD/100kg cwt sold)
Source: agri benchmark Farm Identification indicates _number of finished cattle sold
0
100
200
300
400
500
600
700
800
900
Spa
in-4
00
Spa
in-5
500
Can
ada-
1500
Can
ada-
28K
US
A-7
200
US
A-7
5K
Me
xico
-150
0
Arg
entin
a-90
0
Arg
entin
a-26
K
Bra
zil-5
000
Co
lom
bia-
800
Per
u-17
00
Ch
ina-
940
Ch
ina-
2000
Au
stra
lia-2
7K
Sou
th A
fric
a-30
00
Sou
th A
fric
a-75
K
Nam
ibia
-25K
Bot
swan
a-30
00
USD/100kg cwt sold Operating Costs (USD/100kg cwt sold) Total Costs (USD/100kg cwt sold)
11 Trading Margin is calculated as the difference between the purchase price and sale price of animals being finished, and excludes any other costs of finishing.
Page 8 – Global agri benchmark network results 2018 – BEEF FEEDLOTS
MLA Market Information Report – How are global and Australian beef feedlots performing?
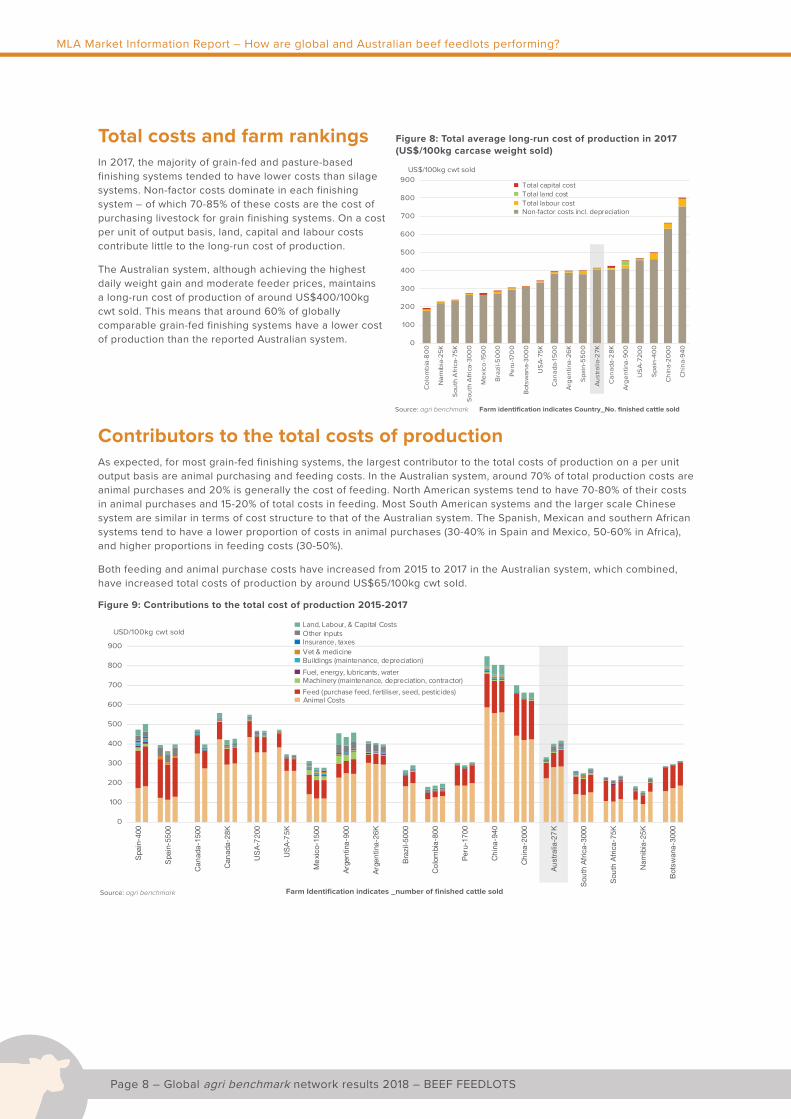
Total costs and farm rankingsIn 2017, the majority of grain-fed and pasture-based finishing systems tended to have lower costs than silage systems. Non-factor costs dominate in each finishing system – of which 70-85% of these costs are the cost of purchasing livestock for grain finishing systems. On a cost per unit of output basis, land, capital and labour costs contribute little to the long-run cost of production.
The Australian system, although achieving the highest daily weight gain and moderate feeder prices, maintains a long-run cost of production of around US$400/100kg cwt sold. This means that around 60% of globally comparable grain-fed finishing systems have a lower cost of production than the reported Australian system.
Contributors to the total costs of productionAs expected, for most grain-fed finishing systems, the largest contributor to the total costs of production on a per unit output basis are animal purchasing and feeding costs. In the Australian system, around 70% of total production costs are animal purchases and 20% is generally the cost of feeding. North American systems tend to have 70-80% of their costs in animal purchases and 15-20% of total costs in feeding. Most South American systems and the larger scale Chinese system are similar in terms of cost structure to that of the Australian system. The Spanish, Mexican and southern African systems tend to have a lower proportion of costs in animal purchases (30-40% in Spain and Mexico, 50-60% in Africa), and higher proportions in feeding costs (30-50%).
Both feeding and animal purchase costs have increased from 2015 to 2017 in the Australian system, which combined, have increased total costs of production by around US$65/100kg cwt sold.
Figure 9: Contributions to the total cost of production 2015-2017
Source: agri benchmark Farm Identification indicates _number of finished cattle sold
0
100
200
300
400
500
600
700
800
900
Spa
in-4
00
Spa
in-5
500
Can
ada-
1500
Can
ada-
28K
US
A-7
200
US
A-7
5K
Me
xico
-150
0
Arg
entin
a-90
0
Arg
entin
a-26
K
Bra
zil-5
000
Co
lom
bia-
800
Per
u-17
00
Ch
ina-
940
Ch
ina-
2000
Au
stra
lia-2
7K
Sou
th A
fric
a-30
00
Sou
th A
fric
a-75
K
Nam
ibia
-25K
Bot
swan
a-30
00
USD/100kg cwt sold
Animal Costs Feed (purchase feed, fertiliser, seed, pesticides) Machinery (maintenance, depreciation, contractor) Fuel, energy, lubricants, water Buildings (maintenance, depreciation) Vet & medicine Insurance, taxes Other inputsLand, Labour, & Capital Costs
Source: agri benchmark Farm identification indicates Country_No. finished cattle sold
0
100
200
300
400
500
600
700
800
900
Col
ombi
a-8
00
Nam
ibia
-25K
Sout
h A
frica
-75K
Sout
h A
frica
-300
0
Mex
ico-
1500
Bra
zil-5
000
Peru
-170
0
Bot
swan
a-30
00
USA
-75K
Can
ada-
1500
Arge
ntin
a-26
K
Spai
n-55
00
Aust
ralia
-27K
Can
ada-
28K
Arge
ntin
a-90
0
USA
-720
0
Spai
n-40
0
Chi
na-2
000
Chi
na-9
40
Non-factor costs incl. depreciation Total labour cost Total land cost Total capital cost
US$/100kg cwt sold
Figure 8: Total average long-run cost of production in 2017 (US$/100kg carcase weight sold)
Global agri benchmark network results 2018 – BEEF FEEDLOTS – Page 9
MLA Market Information Report – How are global and Australian beef feedlots performing?
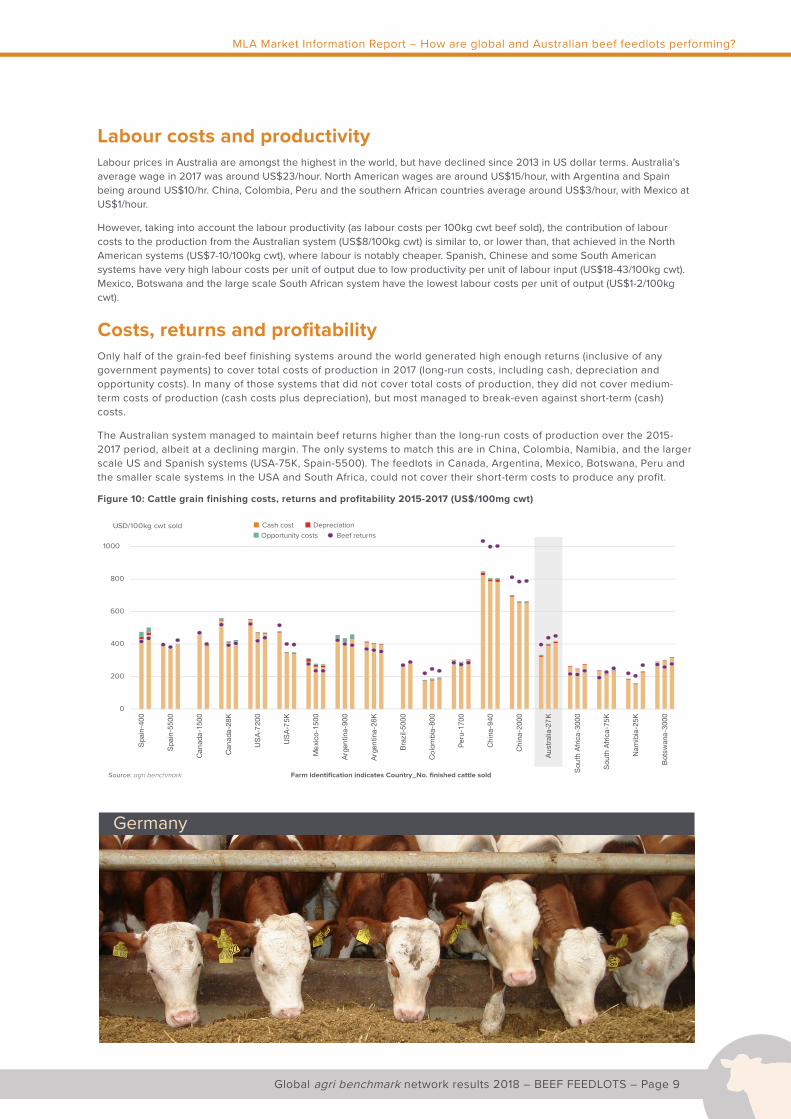
Labour costs and productivityLabour prices in Australia are amongst the highest in the world, but have declined since 2013 in US dollar terms. Australia’s average wage in 2017 was around US$23/hour. North American wages are around US$15/hour, with Argentina and Spain being around US$10/hr. China, Colombia, Peru and the southern African countries average around US$3/hour, with Mexico at US$1/hour.
However, taking into account the labour productivity (as labour costs per 100kg cwt beef sold), the contribution of labour costs to the production from the Australian system (US$8/100kg cwt) is similar to, or lower than, that achieved in the North American systems (US$7-10/100kg cwt), where labour is notably cheaper. Spanish, Chinese and some South American systems have very high labour costs per unit of output due to low productivity per unit of labour input (US$18-43/100kg cwt). Mexico, Botswana and the large scale South African system have the lowest labour costs per unit of output (US$1-2/100kg cwt).
Costs, returns and profitabilityOnly half of the grain-fed beef finishing systems around the world generated high enough returns (inclusive of any government payments) to cover total costs of production in 2017 (long-run costs, including cash, depreciation and opportunity costs). In many of those systems that did not cover total costs of production, they did not cover medium-term costs of production (cash costs plus depreciation), but most managed to break-even against short-term (cash) costs.
The Australian system managed to maintain beef returns higher than the long-run costs of production over the 2015-2017 period, albeit at a declining margin. The only systems to match this are in China, Colombia, Namibia, and the larger scale US and Spanish systems (USA-75K, Spain-5500). The feedlots in Canada, Argentina, Mexico, Botswana, Peru and the smaller scale systems in the USA and South Africa, could not cover their short-term costs to produce any profit.
Figure 10: Cattle grain finishing costs, returns and profitability 2015-2017 (US$/100mg cwt)
0
200
400
600
800
1000
Spa
in-4
00
Spa
in-5
500
Can
ada-
1500
Can
ada-
28K
US
A-7
200
US
A-7
5K
Me
xico
-150
0
Arg
entin
a-90
0
Arg
entin
a-26
K
Bra
zil-5
000
Co
lom
bia-
800
Per
u-17
00
Ch
ina-
940
Ch
ina-
2000
Au
stra
lia-2
7K
Sou
th A
fric
a-30
00
Sou
th A
fric
a-75
K
Nam
ibia
-25K
Bot
swan
a-30
00
USD/100kg cwt sold Cash cost DepreciationOpportunity costs Beef returns
Source: agri benchmark Farm identification indicates Country_No. finished cattle sold
Germany
Page 10 – Global agri benchmark network results 2018 – BEEF FEEDLOTS
MLA Market Information Report – How are global and Australian beef feedlots performing?
In comparison…Australian grain-based beef finishing systems have:
• Relatively short days-on-feed when compared globally, and high entry and slaughter weights, which is comparable to North American systems.
• The highest daily weight gains of around 2.1kg/day during finishing. Most systems achieve daily weight gains of around 1.5kg/day, with some poorer performing systems in China, Argentina and Colombia achieving around 1kg/day or less.
• Received above average prices for beef when compared globally, and paid below average prices for feeder cattle. Given changes in entry weights, the trading margin has remained at around US$550 per head. This is similar to that achieved in North America, but half of that achieved in China, and nearly double that achieved in South America and Africa.
• Above average total costs of production when compared to other grain-fed finishing systems, with both operational and total costs increasing from 2015 to 2017. Around 60% of the systems analysed achieved a lower cost of production than the Australian system.
• Livestock purchases and feeding costs contributing around 70% and 20%, respectively, to the total costs of production, both of which have increased from 2015 to 2017 to lift the total costs of production by over US$65/100kg cwt sold.
• High labour costs and high labour productivity which achieves a moderate-to-low labour costs per unit of output, similar to North American systems where labour costs are around 35% lower.
• Returns which covered the long-run costs of production in each of the last three years – out performing most beef finishing systems in the world (excluding China, Colombia, Namibia and larger scale US feedlots).
Australia
© Meat & Livestock Australia Limited 2019. MLA makes no representation as to the accuracy of any information or advice contained in this document and excludes all liability, whether in contract, tort (including negligence or breach of statutory duty) or otherwise as a result of reliance by any person on such information or advice. Reproduction in whole or part of this publication is prohibited without prior consent and acknowledgement of Meat & Livestock Australia.
All use of MLA publications, reports and information is subject to MLA’s Market Report and Information Terms of Use. Please read our terms of use carefully and ensure you are familiar with its content – click here for MLA’s terms of use.
Top Related