


Languages
Pages
Legal

Presentation to City CouncilFebruary 12, 2013
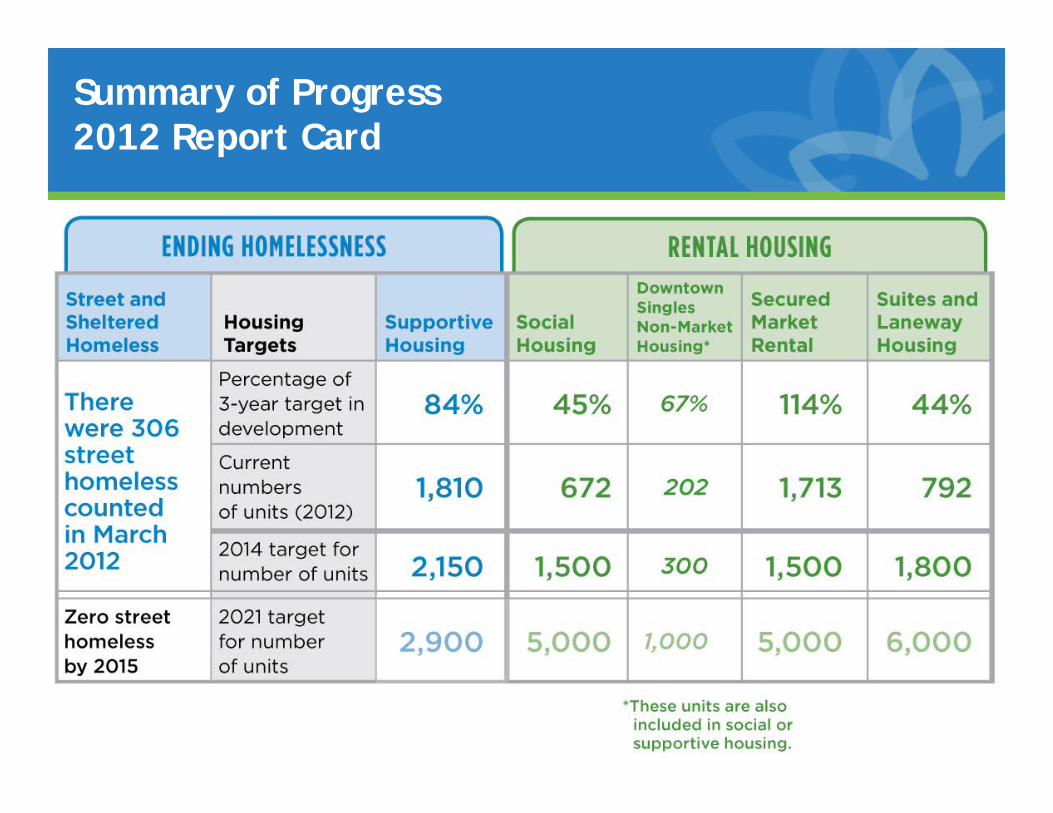
Housing & Homelessness Strategy Targets 2012-20142012 Report Card

2
Recent Headlines

3
Recent Headlines

4
Recent Headlines

1. End Street Homelessness by 2015
2. Increase affordable housing choices for all citizens
Council Goals
5
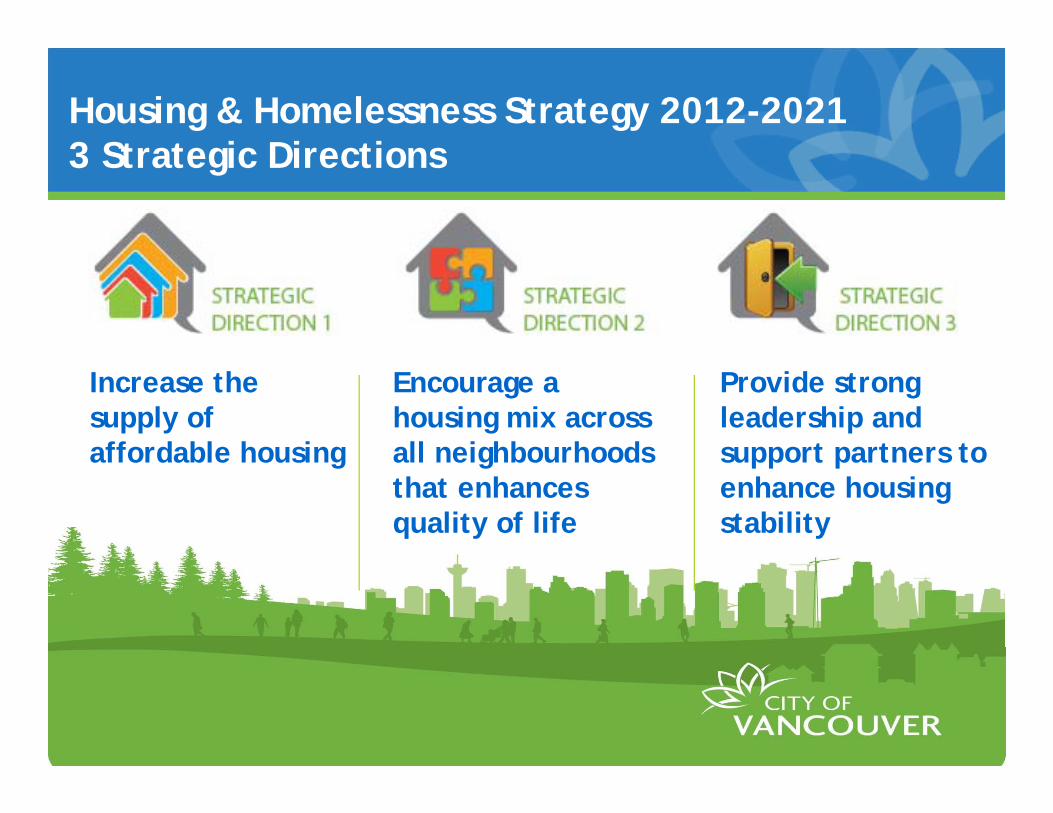
Housing & Homelessness Strategy 2012-20213 Strategic Directions
Increase the supply of affordable housing
Encourage a housing mix across all neighbourhoodsthat enhances quality of life
Provide strong leadership and support partners to enhance housing stability

Future demand by 2041
7
Population – Increase of 110,000+
Jobs – Increase of 76,000+
Age – 21% of population will 65+

8
2,900units
5,000units
5,000units
6,000units
Market driven
Ensure capacity to meet needs of street homeless
Housing & Homelessness Strategy 10 Year Targets - 2012-2021
$0 - $375 $375 - $1075 $1075 - $1500 $1500 +
Cost of Housing per Month (Singles)*
Average income available for housing (singles): $975
*Sources: BC government shelter component of income assistance, CMHC 2012 Rental Market Report, 2006 census.

9
Housing & Homelessness Strategy 3 Year Targets - 2012-2014
2,150 new units of supportive housing
1,500 new units of social housing• incl. 300 units for
downtown singles
1,500 new units of secured market rental housing
1,800 new units of secondary market rental housing (suites and laneway houses)
Between 2012 and 2014 the City will enable:
Shelter capacity to meet needs of street homeless

10
Indicators: 3 Year Targets: Performance Measures:
1. Street & Sheltered Homeless
Shelter capacity to meet needs of street homeless
2. Supportive housing 2,150 units
3. Social housing 1,500 units
4. Downtown singles non-market housing
300 Units
5. Secured market rental 1,500 units
6. Secondary market rental
1,800 units
Numbers
Locations
Actions Taken
Housing & Homelessness StrategyReport Card Structure

11
Indicator1: Street & Sheltered Homeless

12
Numbers: Street & Sheltered Homeless
– Street homeless down 62% since 2008
– Street homeless up in 2012 due to 139 fewer shelter beds from 2011
– Homelessness is stabilizing
535700 765
1,2941,427
1,29693
664
811
421 154306
0
500
1,000
1,500
2,000
2002 2003 2004 2005 2006 2007 2008 2009 2010 2011 2012
Number of Homeless in the City(Estimates from Homeless Counts)
Street
Sheltered
1,715
1,576
1,364
628
1,581 1,602

– Shelter facilities located where there is greatest need
– Street homeless found in many neighbourhoods
13
888888888
202020202020202020
114
666666666
232323232323232323
141414141414141414
131313131313131313
104
131313131313131313
222222222222222222
128
461511
Sheltered Homeless PopulationSheltered Homeless PopulationSheltered Homeless PopulationSheltered Homeless PopulationSheltered Homeless PopulationSheltered Homeless PopulationSheltered Homeless PopulationSheltered Homeless PopulationSheltered Homeless Population
Unsheltered Homeless PopulationUnsheltered Homeless PopulationUnsheltered Homeless PopulationUnsheltered Homeless PopulationUnsheltered Homeless PopulationUnsheltered Homeless PopulationUnsheltered Homeless PopulationUnsheltered Homeless PopulationUnsheltered Homeless PopulationLocal Area BoundaryLocal Area BoundaryLocal Area BoundaryLocal Area BoundaryLocal Area BoundaryLocal Area BoundaryLocal Area BoundaryLocal Area BoundaryLocal Area Boundary
2012
Note: data points w/ less than 5 persons are not labeled
Locations:Street & Sheltered Homeless
14
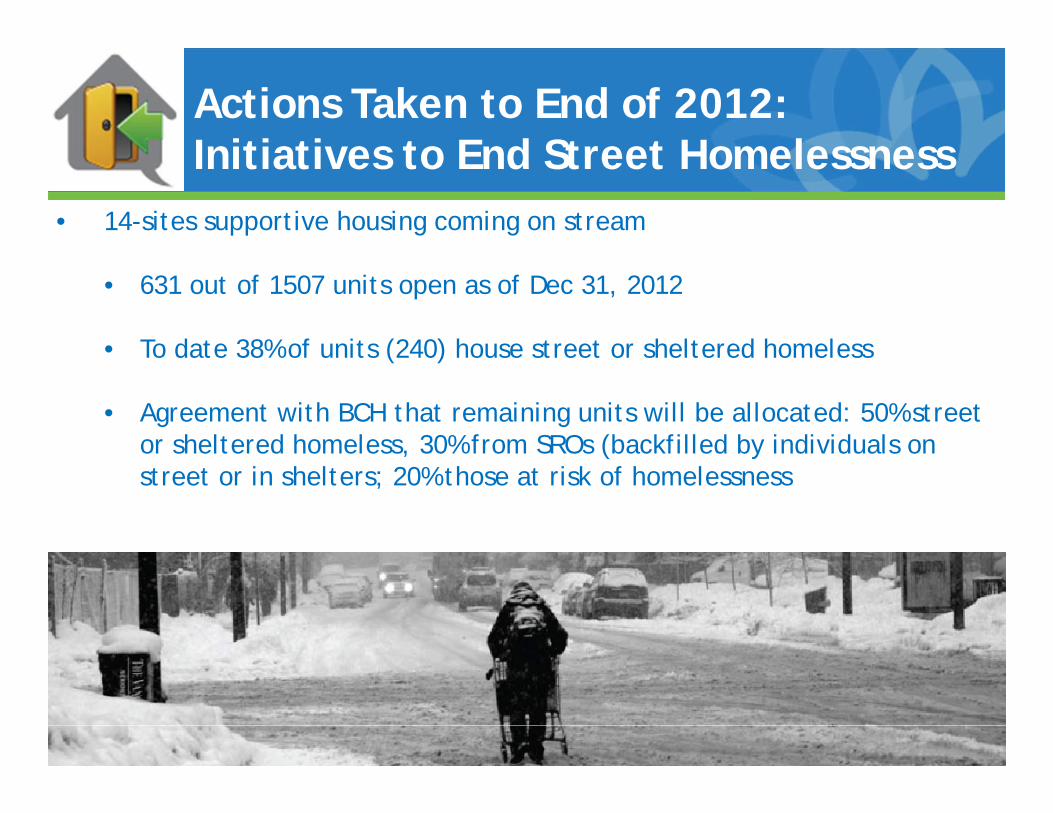
Actions Taken to End of 2012: Initiatives to End Street Homelessness
• 14-sites supportive housing coming on stream
• 631 out of 1507 units open as of Dec 31, 2012
• To date 38% of units (240) house street or sheltered homeless
• Agreement with BCH that remaining units will be allocated: 50% street or sheltered homeless, 30% from SROs (backfilled by individuals on street or in shelters; 20% those at risk of homelessness
15
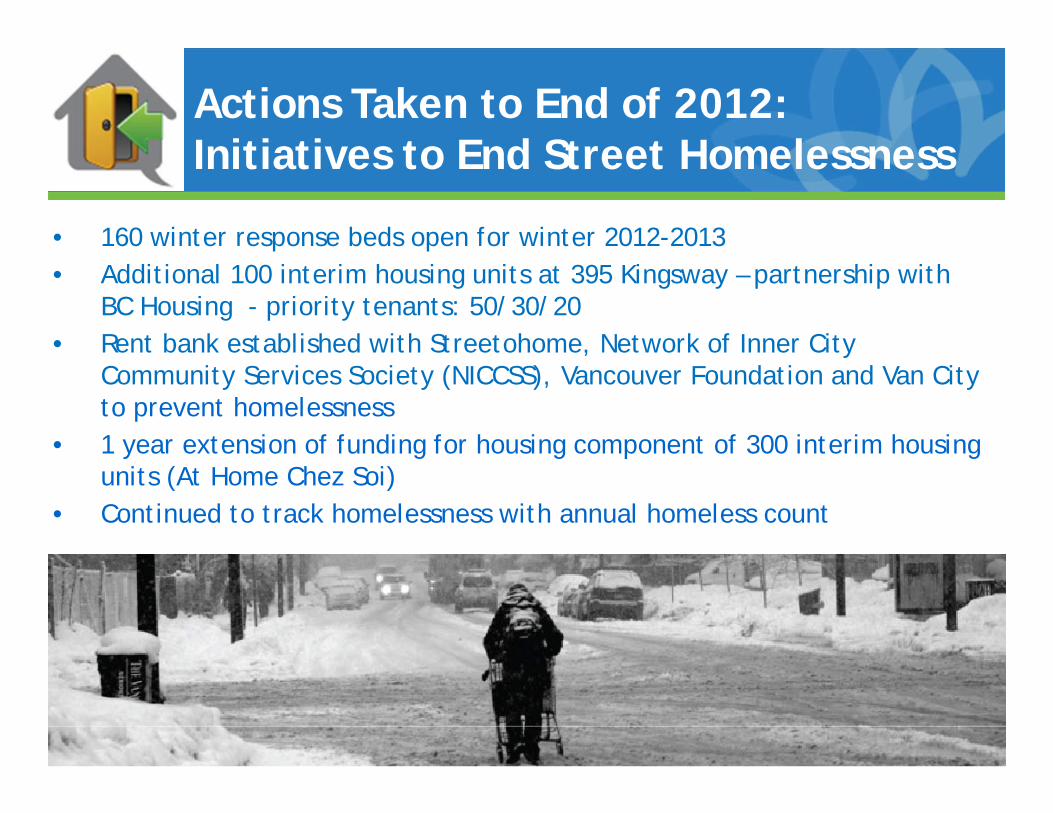
Actions Taken to End of 2012: Initiatives to End Street Homelessness
• 160 winter response beds open for winter 2012-2013• Additional 100 interim housing units at 395 Kingsway – partnership with
BC Housing - priority tenants: 50/30/20• Rent bank established with Streetohome, Network of Inner City
Community Services Society (NICCSS), Vancouver Foundation and Van City to prevent homelessness
• 1 year extension of funding for housing component of 300 interim housing units (At Home Chez Soi)
• Continued to track homelessness with annual homeless count

16
Performance measure Progress towards 3 year goal
Street homeless down 62% since 2008
Winter response shelters located where need is greatest
2012 Homeless count used to leverage Government of BC for more interim housing units and shelter capacity for winter 2012/13
Summary:Street & Sheltered Homeless
Numbers
Locations
ActionsTaken

17
The Housing Development Process:Creating supply
(Indicators 2 - 6)

18
The Housing Development Process:Creating supply
• Committed/ Approved• Committed / Approved projects have an approved
rezoning or DP application or an approved Council report confirming funding
Under Construction• Projects are under construction
Completed• Projects are completed
Mor
e ce
rtai
n

19
Indicator 2: Supportive Housing Units

Numbers:Supportive Housing Units and Targets

Locations: New Supportive Housing Units*
Sum of New Supportive Housing in Each Local AreaLocal Area Boundary
*Map reflects sum of: committed, under construction and recent completions (2010 -2012)

22
• 56 units of supportive housing for homeless individuals with mental illness
• Partnership with: BC Housing and supportive housing provider (Kettle Friendship Society)
• Anonymous private donor: funding 100% operating costs including funds for support of tenants
• City role:• Adaptive reuse of heritage building• Zoning approval• DCL Waiver• Land at no cost• Capital cost contribution
Actions Taken:Example of Taylor Manor

23
Performance measure Progress towards 3 year goal
1,810 units in development(84% of 2014 target for new units)
Locations are driven by opportunities on city-owned & partner sites
Recent Council commitments have leveraged city assets:• Taylor Manor (56 units)• VPL Strathcona (22 units)
Numbers
Locations
ActionsTaken
Summary: Supportive Housing Units

24
Indicator 3: Social Housing

Numbers: New Social Housing Units

New social housing will be located around the city
Locations: New Social Housing Units
Sum of New Social Housing in each Local Area
Local Area Boundary
*Map reflects sum of: committed, under construction and recent completions (2012)

Actions Taken: Leveraging City Land
• 4 city owned sites to be leased at a nominal value to create affordable rental housing
• Potential to create over 350 units
• Evaluation criteria included• # of units below market rent • Housing tenure and mix• Equity contribution by partners
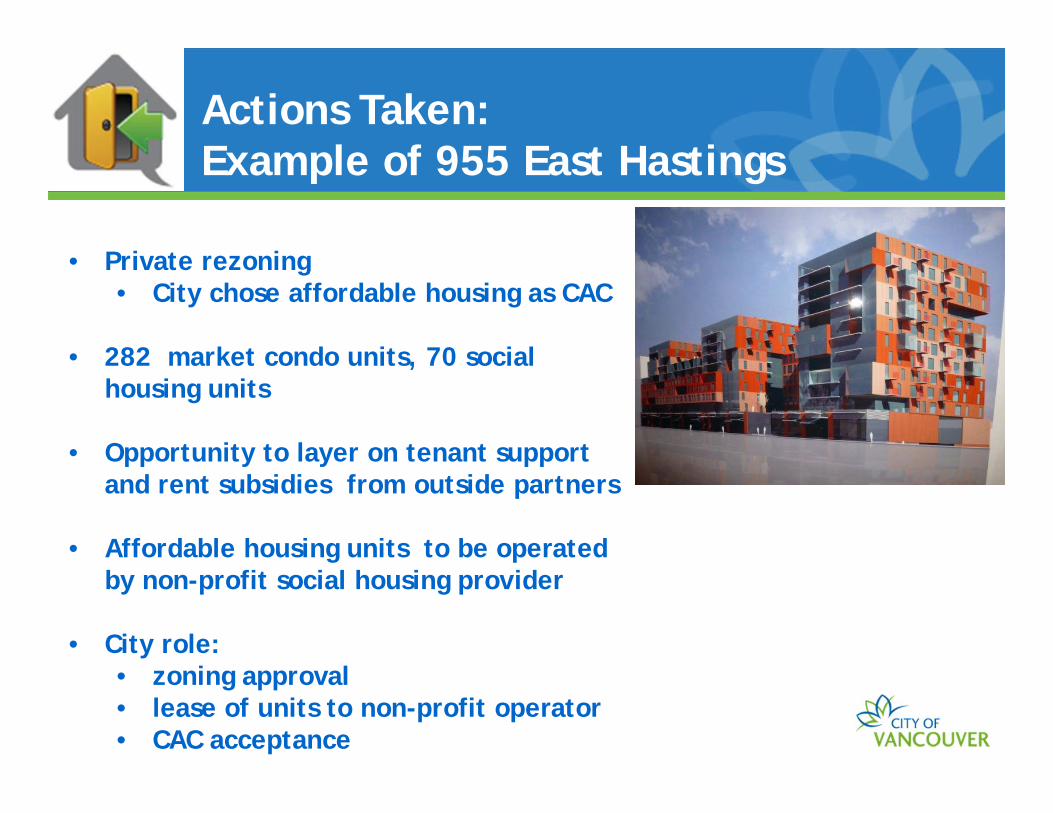
Actions Taken:Example of 955 East Hastings
• Private rezoning • City chose affordable housing as CAC
• 282 market condo units, 70 social housing units
• Opportunity to layer on tenant support and rent subsidies from outside partners
• Affordable housing units to be operated by non-profit social housing provider
• City role:• zoning approval• lease of units to non-profit operator• CAC acceptance

29
Performance measure Progress towards 3 year goal
672 units in development(45% of 2014 target for new units)
All around the city
City Sites RFEOI could add over 350 units
Large re-zonings create opportunities for new units• Arbutus Centre (100 units)• 955 E Hastings (70 units)
Numbers
Locations
Actions
Summary: Social Housing

30
Indicator 4: Downtown Singles Non Market Housing

– One for one replacement of Single Room Occupancy units with self contained social housing (2005 DTES Housing Plan and 1991 Downtown South housing objectives)
– As the City grows and changes, continue to ensure that housing is available for singles with very low income
Goals:Downtown Singles Non-Market Housing

32
Numbers: Total Stock of Low Income Singles Housing in the Downtown Core
BC Housing conversion of 1500 SRO units to non-market

33
Downtown Singles Non-Market Housing Units
New units counted towards 2014 target are:
• Self-contained (private kitchen & bath)• Social or Supportive housing units• In the downtown core (Burrard to Clark)• 1-bed & studio units

Numbers: Downtown Singles Non-Market Housing
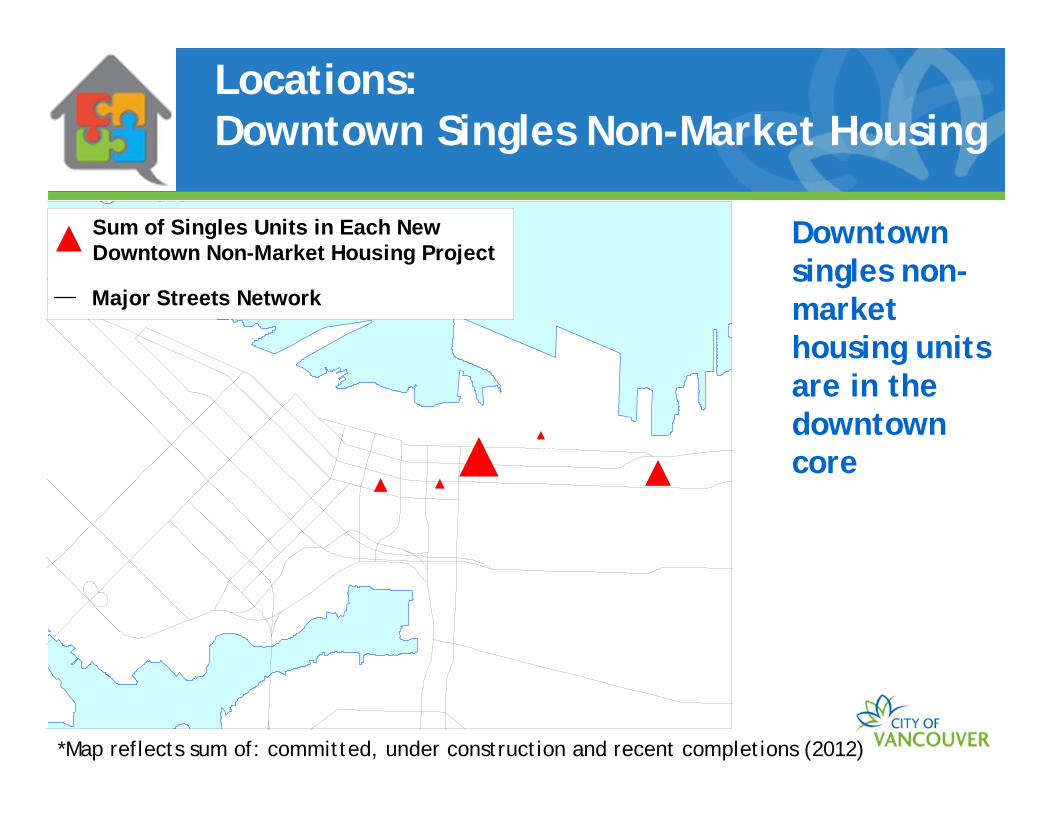
Downtown singles non-market housing units are in the downtown core
Locations:Downtown Singles Non-Market Housing
Sum of Singles Units in Each New Downtown Non-Market Housing Project
Major Streets Network
*Map reflects sum of: committed, under construction and recent completions (2012)

– Less than half of new non-market downtown single units renting at welfare rate ($375/month) due to lack of sufficient subsidy
– 2011 low income survey found that only 24% of private SROs renting at welfare rate $375/ month (compared to 36% in 2009)
– Estimated 95% of 2100 non-market SRO units renting at welfare rate (to be confirmed in 2013 low-income survey)
– 1300 of BC Housing’s SRO units under-going major renovation (P3) rather than replacement – liveability & maintenance improved plus affordability protected
Challenges
37
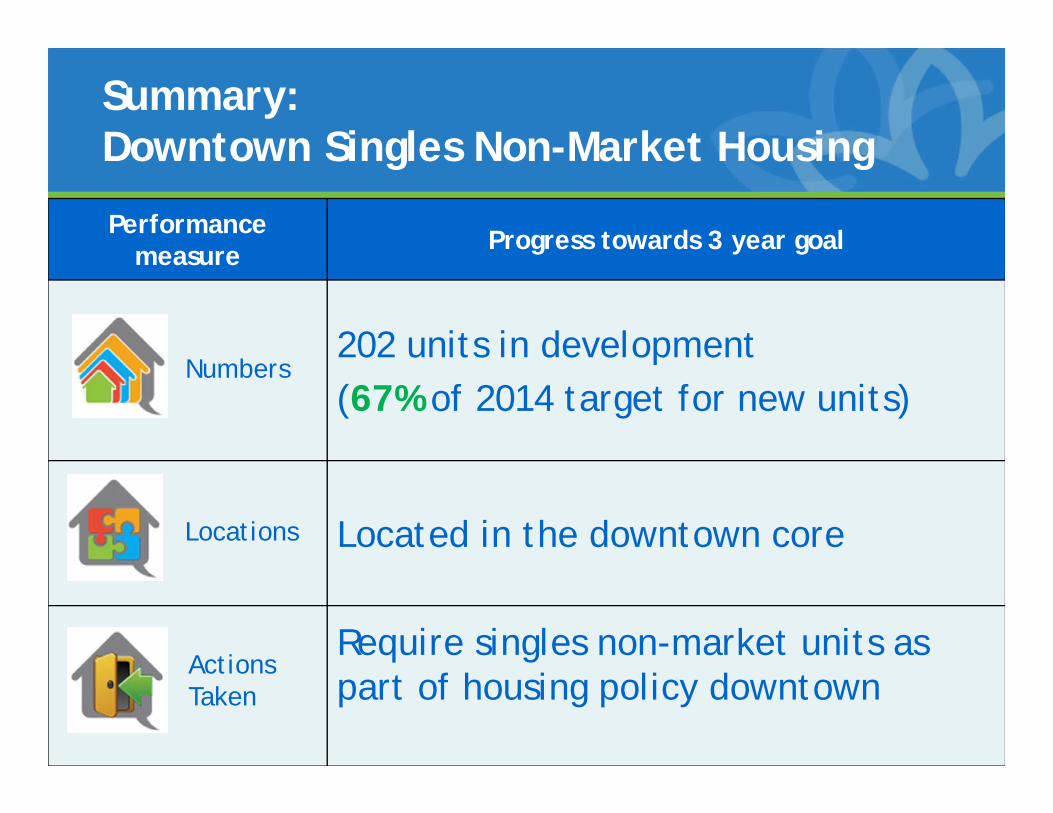
Performance measure Progress towards 3 year goal
202 units in development(67% of 2014 target for new units)
Located in the downtown core
Require singles non-market units as part of housing policy downtown
Numbers
Locations
Actions Taken
Summary:Downtown Singles Non-Market Housing

38
Indicator 5: Secured Market Rental

Market Rental Housing Challengesre
ntal
uni
ts
Market-rental Apartment Completions by Decade (occupied)
Limited new supply of market rental housing in recent decades
Notes:
Rental units in the 1980s, 1990s, and 2000s includes both stratified and un-stratified rental units
Source: CMHC

50 60
117
192 196
40
50
100
150
200
250
2006 2007 2008 2009 2010 2011
rent
al u
nits
Market Rental Housing Challenges
Market-rental Apartment Completions (Occupied) 2006 - 2011
Very limited new rental units constructed over last five years (average 150 units/year)
Majority of rental units built in 2009 and 2010 were City initiatives
1 Kingsway: 98 units (City-built)
Olympic Village: 119 units (policy requirement)
Privately-initiated market rental units
City initiatives

Numbers: New Secured Market Rental

New units are located in a variety of city neighbourhoods
Locations: New Secured Market Rental
Sum of New Market RentalHousing in Each Local AreaLocal Area Boundary
*Map reflects sum of: committed, under construction and recent completions (2012)

43
• Short Term Incentives for Rental (STIR) program review
• Secured Market Rental Policy (Rental 100) approved by Council
• Cambie Corridor Plan requires 20% market rental housing in some areas
• Market rental as part of major re-zonings (e.g. Rogers Arena)
Actions Taken: Enabling Secured Market Rental

44
Performance measure Progress towards 3 year goal
1713 units in development(114% of 2014 target for new units)
A variety of neighbourhoods
Short Term Incentives for Rental program review
Secured Market Rental Policy approved
Cambie Corridor Plan requires market rental housing
Enabling major re-zonings to add to supply
Numbers
Locations
ActionsTaken
Summary: Secured Market Rental
45
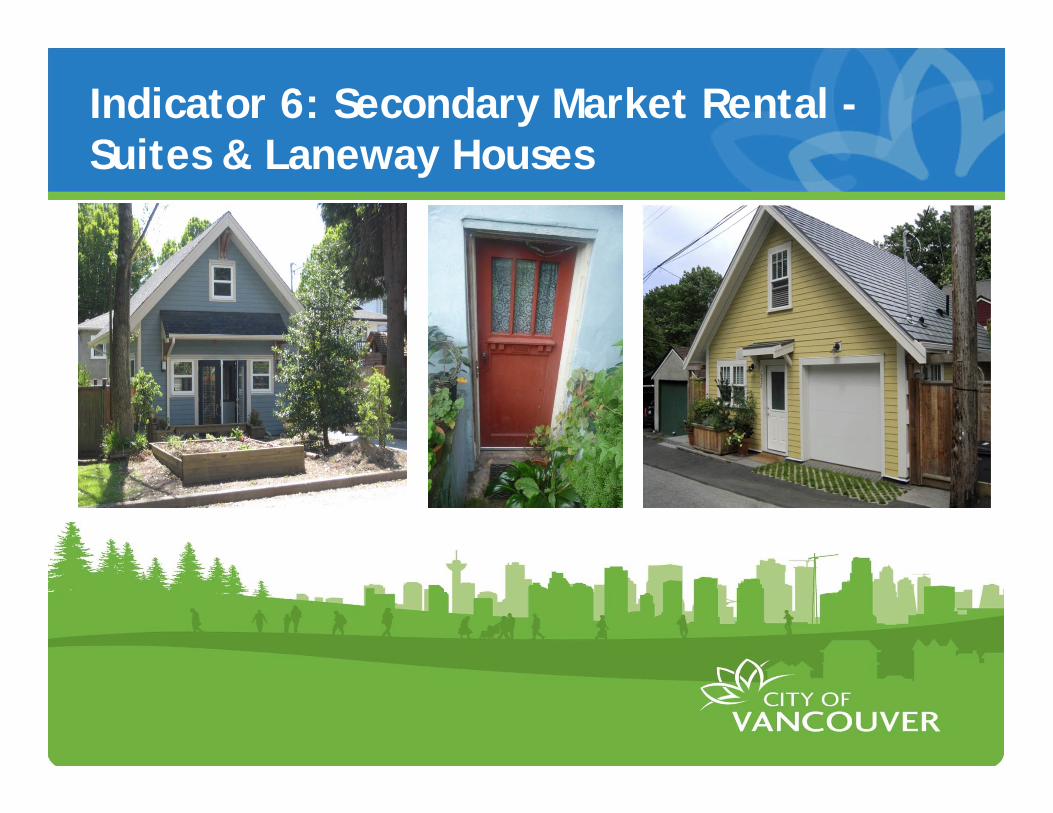
Indicator 6: Secondary Market Rental -Suites & Laneway Houses

Numbers: Secondary Market Rental -Suites & Laneway Houses

2012 permits for suites and laneway houses are found across the city outside the downtown
Locations: New Suites & Laneway Houses2012 permits
2012 Suites Permits2012 Laneway House Permits
Local Area Boundary

48
Performance measure Progress towards 3 year goal
792 units in development(44% of 2014 target for new units)
Suites and laneway houses are found across the city (outside the downtown)
Streamlined process for laneway house permit approvals (fall 2012)
Numbers
Locations
Actions
Summary:Secondary Market Rental - Suites & Laneway Houses
49
Summary of Progress2012 Report Card

50
Mayor’s Task Force on Housing Affordability Recommendations:
• Expand laneway housing to additional single family zones
• Explore feasibility of laneway housing in duplex zones
• Expand the zoning districts and housing forms for secondary suites (e.g. row houses)
• Consult with industry on revisions to BBL to require “suite readiness”
• Use 20 sites interim rezoning policy to test models for affordable homeownership
A home for everyone
Top Related