


Languages
Pages
Legal


Home Performance with Energy Star:
Unregulated Fuels Impact Evaluation
(2011-2013)
Final Report November 2016
Prepared for
The New York State
Energy Research and Development Authority
Judeen Byrne
Emily Shusas
Project Managers
Prepared by:
ERS
120 Water Street, Suite 350
North Andover, MA 01845
Phone: 978-521-2550
Principal Investigator:
West Hill Energy and Computing, Inc.

i
NOTICE
This report was prepared by ERS and its subcontractor West Hill Energy, in the course of
performing work contracted for and sponsored by the New York State Energy Research and
Development Authority (hereinafter the “Sponsor”). The opinions expressed in this report do not
necessarily reflect those of the Sponsor or the State of New York, and reference to any specific
product, service, process, or method does not constitute an implied or expressed recommendation
or endorsement of it. Further, the Sponsor, the State of New York, and the contractor make no
warranties or representations, expressed or implied, as to the fitness for particular purpose or
merchantability of any product, apparatus, or service, or the usefulness, completeness, or
accuracy of any processes, methods, or other information contained, described, disclosed, or
referred to in this report. The Sponsor, the State of New York, and the contractor make no
representation that the use of any product, apparatus, process, method, or other information will
not infringe privately owned rights and will assume no liability for any loss, injury, or damage
resulting from, or occurring in connection with, the use of information constrained, described,
disclosed, or referred to in this report.
ii
ABSTRACT
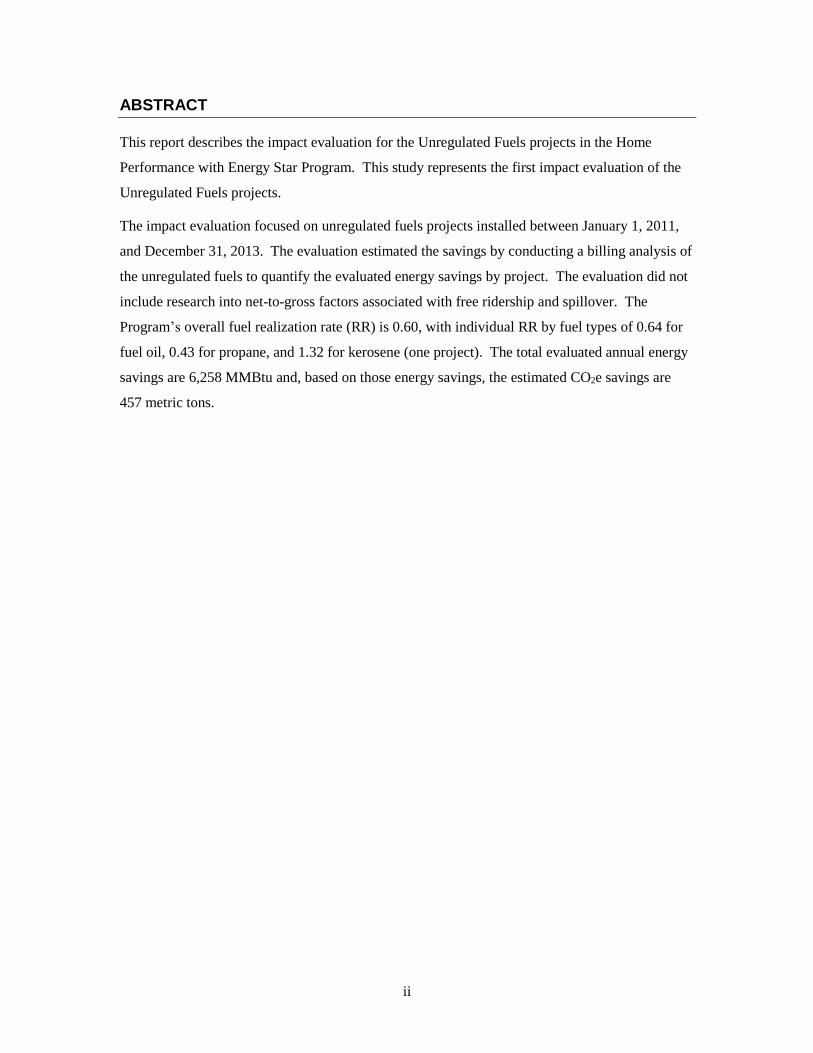
This report describes the impact evaluation for the Unregulated Fuels projects in the Home
Performance with Energy Star Program. This study represents the first impact evaluation of the
Unregulated Fuels projects.
The impact evaluation focused on unregulated fuels projects installed between January 1, 2011,
and December 31, 2013. The evaluation estimated the savings by conducting a billing analysis of
the unregulated fuels to quantify the evaluated energy savings by project. The evaluation did not
include research into net-to-gross factors associated with free ridership and spillover. The
Program’s overall fuel realization rate (RR) is 0.60, with individual RR by fuel types of 0.64 for
fuel oil, 0.43 for propane, and 1.32 for kerosene (one project). The total evaluated annual energy
savings are 6,258 MMBtu and, based on those energy savings, the estimated CO2e savings are
457 metric tons.

iii
ACKNOWLEDGMENTS
The Impact Evaluation Team wishes to acknowledge the significant contribution of NYSERDA
Project Managers Judeen Byrne and Emily Shusas, and the input of the NYSERDA Impact staff.
The preparation of this evaluation and report was led by Kathryn Parlin of West Hill Energy and
Computing with support from Lucas Sanford-Long and Rumbi Vushe, and collection of the
unregulated fuels billing records was conducted by ERS.

iv
CONTENTS
LIST OF TABLES ................................................................................................ V
SECTION 1: EXECUTIVE SUMMARY ................................................................. 1
SECTION 2: INTRODUCTION AND EVALUATION CONTEXT AND ISSUES ... 3 2.1 Program Description ............................................................................................ 3 2.2 Evaluation Context and Issues............................................................................. 4
2.2.1 Cooperation from Participants and Fuel Dealers ...................................... 5 2.2.2 Irregular Fuel Deliveries ........................................................................... 5 2.2.3 Secondary Heating Fuels ......................................................................... 5
SECTION 3: METHODS ....................................................................................... 7 3.1 Sample Frame ..................................................................................................... 7 3.2 Screener Survey .................................................................................................. 7 3.3 Attrition in the Billing Model .................................................................................. 8 3.4 Preparing for Calculating Savings ........................................................................ 9 3.5 Calculation of Household Savings ..................................................................... 10 3.6 Sources of Uncertainty ...................................................................................... 12 3.7 Measure Level Savings ..................................................................................... 12
SECTION 4: RESULTS AND FINDINGS ........................................................... 14 4.1 RGGI PRogram Savings .................................................................................... 15 4.2 Measure Level Results ...................................................................................... 16 4.3 Summary ........................................................................................................... 16
APPENDIX A: GLOSSARY OF TERMS ............................................................ 18
APPENDIX B: BIAS AND SAMPLING PRECISION .......................................... 20
APPENDIX C: SURVEY DISPOSITION ............................................................. 23
APPENDIX D: HOMEOWNERS SURVEY ......................................................... 25
APPENDIX E: SURVEY RESULTS MEMO ....................................................... 45
APPENDIX F: FUEL DEALER DATA COLLECTION DETAILS ........................ 58
APPENDIX G: SOURCES OF UNCERTAINTY ................................................. 60
v
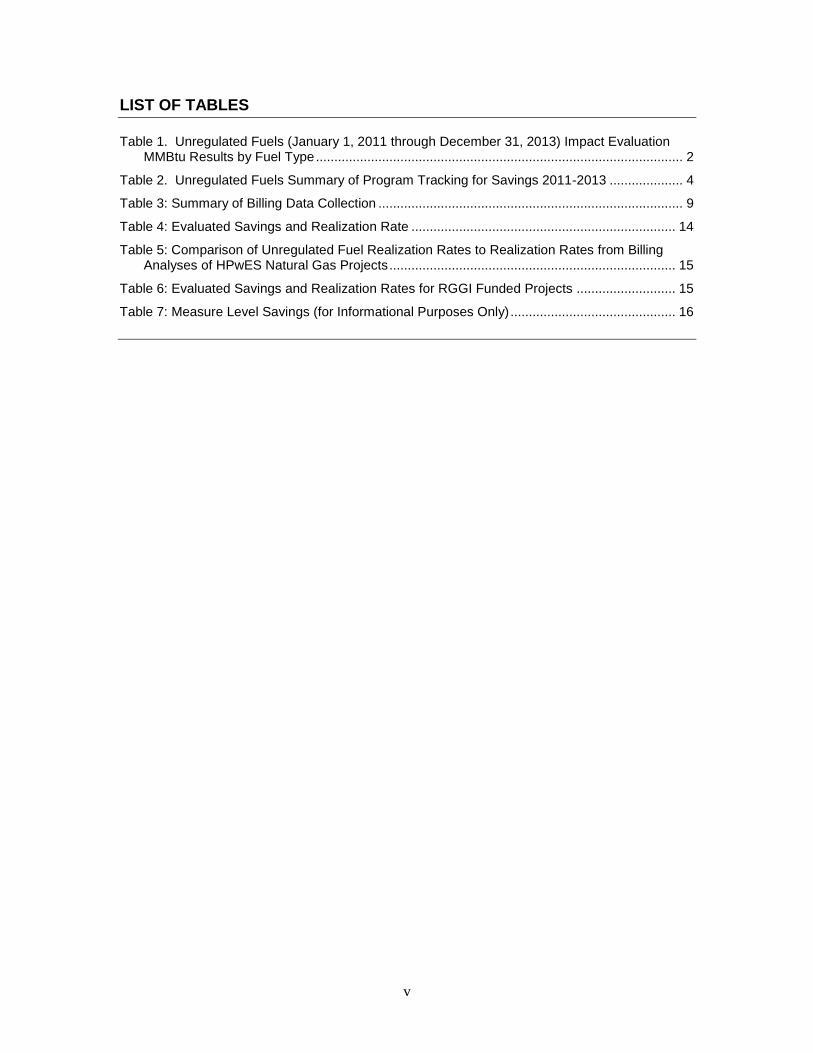
LIST OF TABLES
Table 1. Unregulated Fuels (January 1, 2011 through December 31, 2013) Impact Evaluation MMBtu Results by Fuel Type .................................................................................................... 2
Table 2. Unregulated Fuels Summary of Program Tracking for Savings 2011-2013 .................... 4
Table 3: Summary of Billing Data Collection ................................................................................... 9
Table 4: Evaluated Savings and Realization Rate ........................................................................ 14
Table 5: Comparison of Unregulated Fuel Realization Rates to Realization Rates from Billing Analyses of HPwES Natural Gas Projects .............................................................................. 15
Table 6: Evaluated Savings and Realization Rates for RGGI Funded Projects ........................... 15
Table 7: Measure Level Savings (for Informational Purposes Only) ............................................. 16
1
SECTION 1: EXECUTIVE SUMMARY
NYSERDA’s Home Performance with Energy Star (HPwES) Program includes “unregulated
fuels” (Unreg Fuels) projects. “Unregulated fuels” here refers to fossil fuels (i.e., primarily fuel
oil, propane, and kerosene) that are not provided by a regulated utility1.
This report provides a detailed description and results of the impact evaluation of the Unreg Fuels
projects completed between January 1, 2011 and December 31, 2013. The primary objective of
the evaluation was to establish rigorous and defensible estimates of evaluated gross savings and
emission reductions attributable to Unreg Fuels projects. This study is the first comprehensive
impact evaluation of Unreg Fuels.
This impact evaluation measured the savings attributed to unregulated fuel consumption on a
house-by-house basis, using participant surveys and billing analysis to establish first year energy
savings. The results were then aggregated to the fuel type and program level to calculate an
overall realization rate (RR).2 The potential savings from heating with wood or wood pellets
were not estimated.3
Also discussed in this report are savings of Unreg Fuels projects funded by Regional Greenhouse
Gas Initiative (RGGI). RGGI funds are used for cost-effective oil and propane efficiency
measures, such as replacing inefficient oil and propane heating equipment and other measures
that have a direct impact on reducing Greenhouse Gas (GHG) emissions from oil and propane
consumption.
The sample for this evaluation included unregulated fuel projects funded from other funding
sources including the American Reinvestment and Recovery Act (ARRA), Energy Efficiency
Portfolio Standard (EEPS) and System Benefits Charge (SBC). Post hoc stratification was
conducted to calculate the RR for the RGGI-funded-only projects (see Section 4.1). This analysis
indicated the RR for RGGI projects is almost identical to the RR for the sample as a whole (61%
as compared to 60%). The evaluated savings resulting from the Program are presented in Table 1.
1 Natural Gas is provided by a regulated utility.
2 The RR represents the percentage of program-estimated savings that the Impact Evaluation Team estimates as being
actually achieved based on the results of the impact evaluation.
3 Estimating the change in wood use due to energy efficiency measures is highly problematic since wood is purchased
in cords, which have a highly variable Btu content ranging from 20 to 40 MMBtu per cord depending on the type of
wood and homeowners are unlikely to be able to estimate wood use to greater granularity than half a cord. Thus, the
margin of error in comparing the wood use from one year to the next is likely to be the same order of magnitude as the
estimated savings. While wood pellet fuel is less variable in MMBtu content per ton, there is still some variability and
as well similar issues with the reliability of measuring the amount used.

HPwES: Unregulated Fuels Impact Evaluation Report Executive Summary
2
Table 1. Unregulated Fuels (January 1, 2011 through December 31, 2013) Impact Evaluation
MMBtu Results by Fuel Type
Fuel Type
Number of
Projects in
Analysis
Program
Reported
Savings in
MMBtus
Realization
Rate
Evaluated
Gross
Savings in
MMBtu
NYSERDA
Conversion
Factors (pound
CO2e/MMBtu)
Estimated
Metric Tons
CO2e Saved
Fuel Oil 150a 8,385 0.64 5,365 162.9 397
Propane 57a 2,030 0.43 873 136.1 59
Kerosene 1 15b 1.32 20 161.2 2
Total 207a 10,431 0.60 6,258 457
Sums may not total due to rounding. a One of the projects included sufficient program and oil data to calculate savings for both. b The Program incorrectly claimed fuel oil savings for the one kerosene project.
The approach used for this evaluation included the following:
1. A participant screener survey to collect key information, including identifying fuel
dealers, secondary heating sources and changes in thermostat setting over time
a. Respondents were requested to return consent forms to allow us to request billing
information from their fuel dealers
2. Collection of billing records from the fuel dealers
3. Conducting a billing analysis using the survey results and program and billing records
The sample frame included participants with over 10 MMBtu of unregulated fossil fuel savings.
As part of program participation, many homeowners had already provided signed consent to
request billing information from their fuel dealers, which eliminated the step of collecting the
consent form for these participants.
The final sample was comprised of participants with complete consumption history for the
primary heating fuel used during the analysis period. Normalized Annual Consumption (NAC)
modeling was conducted to estimate the change in consumption between the pre- and post-
installation periods on a house-by-house basis. These results were then aggregated to the
program level to calculate the realization rate.

3
SECTION 2: INTRODUCTION AND EVALUATION CONTEXT AND ISSUES
This section presents the program description, the evaluation goals, and a summary of the issues
faced with this evaluation.
2.1 PROGRAM DESCRIPTION
New York State invests RGGI proceeds to support comprehensive strategies that best achieve the
RGGI CO2 emission reduction goals. These strategies aim to reduce global climate change and
pollution through energy efficiency, renewable energy, and carbon abatement technology.
Home Performance with ENERGY STAR (HPwES) is a national program, administered by the
U.S. Department of Energy, to help homeowners improve the efficiency and comfort of their
homes using a comprehensive, whole-house approach, while helping to protect the environment.
As the sponsor for the New York statewide HPwES program, NYSERDA’s primary goal is to
encourage homeowners to use certified home performance contractors to identify and implement
energy improvements. A substantial proportion of homeowners in New York State use
unregulated fossil fuels to heat their homes, RGGI funding is used to promote the installation of
measures designed to reduce use of these unregulated fossil fuels and to reduce greenhouse
gasses.
The HPwES Program encourages home and building owners and tenants of existing one- to four-
family homes and small low rise buildings to implement comprehensive energy efficiency-related
improvements that save electricity, natural gas and unregulated fossil fuels. Eligible measures
include conducting air sealing, replacing or adding insulation, replacing inefficient boilers,
furnaces and water heaters and installing water heater conservation measures.
Program tracking by measure is highly detailed and both savings and extra energy use are
recorded for each fuel type. Extra energy use can occur when measures switch energy use
between two fuel types, such as replacing electric baseboard heat with a natural gas boiler. Table
2. presents program reported savings by fuel type for RGGI and non-RGGI projects with over 10
MMBtu of unregulated fuel savings for program years 2011, 2012, and 2013.

HPwES: Unregulated Fuels Impact Evaluation Report Methods
4
Table 2. Unregulated Fuels Summary of Program Tracking for Savings 2011-2013
Program Reported Annual Savings (MMBtu)
Installation Year and
Funding Source # of Projects Fuel Oil Propane Kerosene
2011 RGGI 87 3,614 0 0
2012 RGGI 1,602 73,518 1,291 858
2013 RGGI 1,843 64,399 -2,507 297
Total RGGI 3,532 141,531 -1,215 1,155
2011 Non-RGGI 1,284 59,913 6,306 839
2012 Non-RGGI 872 35,334 709 77
2013 Non-RGGI 792 59,041 849 312
Total Non-RGGI 2,948 154,287 7,865 1,228
Total 6,480 295,818 6,649 2,383
Sums may not total due to rounding.
2.2 EVALUATION CONTEXT AND ISSUES
Billing analysis was selected as the evaluation method since it is appropriate for retrofit programs
where the baseline is the existing condition prior to the installation. In addition, the savings need
to be large enough to separate the program effects from the month-to-month variability of
residential energy consumption. A general rule of thumb is that billing analysis works when the
program savings are expected to be 8% to 10% or more of the total consumption.4 Sampling
precision and bias are discussed in Appendix B.
Billing analysis for unregulated fuels poses challenges not commonly encountered with regulated
energy sources. Some of the issues are as follows:
obtaining billing records requires extensive cooperation from participants and fuel dealers
fuel deliveries may not occur on a regular basis and the fuel tank may not be filled to
capacity during a given delivery
secondary heating fuels may be used and consumption patterns are more likely to vary in
homes with secondary fuels.
The approach to addressing each of these issues follows below.
4 TecMarket Works. 2004 California Evaluation Framework, prepared for the California Public Utilities Commission
and the Project Advisory Group, September 2004, page 101. Smaller savings can be found with larger sample sizes.

HPwES: Unregulated Fuels Impact Evaluation Report Methods
5
Cooperation from Participants and Fuel Dealers
The Impact Evaluation Team anticipated that the process of collecting billing records would be
difficult and lengthy, as it required numerous steps involving the program staff, survey
respondents and fuel dealers. Some fuel dealers were more responsive than others to requests for
billing records. Monetary incentives were not offered to fuel dealers.
Irregular Fuel Deliveries
To be able to determine the amount of fuel used during a specific period from billing records, it is
necessary to know the date of the delivery, the amount of fuel delivered and whether the tank was
filled to capacity. Partial deliveries were identified using information collected from both the
participants and the fuel dealers to interpret the billing data for analysis. Three levels of review
were conducted to address this issue.
1. In the screener survey, participants were asked how frequently the fuel tank was filled to
capacity.
2. Fuel dealers were asked to identify partial deliveries, and some fuel dealers were able to
comply with this request.
3. The fuel records were scrutinized and homes with regular deliveries of a specific and
even number of gallons (such as 50, 100, or 250) were flagged as partial deliveries.
Homes with many partial deliveries were removed from the billing analysis.
Secondary Heating Fuels
Secondary heat is common in New York homes and NYSERDA program records show that
savings are estimated for multiple heating fuels in a home where appropriate. While evaluating
energy savings through a whole house analysis including all heating sources may be desirable,
not all heating sources’ data are always available. For this evaluation no savings from wood were
estimated as estimating the change in wood use due to energy efficiency measures is fraught with
difficulty.5
The realization rate was carefully calculated to include only the savings associated with the fuels
that were also included in the billing model. Thus, the comparison of the model results to the
5 Wood is purchased in cords, which have a highly variable Btu content ranging from 20 to 40 MMBtu per cord, and
homeowners are unlikely to be able to estimate wood use to greater granularity than half a cord. Thus, the margin of
error in comparing the wood use from one year to the next is likely to be the same order of magnitude as the estimated
savings.

HPwES: Unregulated Fuels Impact Evaluation Report Methods
6
program reported savings was a direct comparison, i.e., NYSERDA calculated the proportion of
the savings associated with specific fuels and the model estimated savings for those specific fuels.
Billing analysis is a snapshot and changes in the household energy use patterns over time may
affect the longer term savings. The screener survey was used to obtain key details about the use
of secondary heat sources and changes in the use of primary and secondary heating fuels between
the pre- and post-periods.

HPwES: Unregulated Fuels Impact Evaluation Report Methods
7
SECTION 3: METHODS
This section describes the methods used to estimate evaluated gross savings for unregulated fossil
fuels portion of HPwES program. The subsections cover the sample frame, screener survey,
attrition in the billing model, preparation of data, calculation of household savings and measure
level savings.
3.1 SAMPLE FRAME
The sample frame6 consisted of homeowners who installed measures through the HPwES
Program during the period of January 2011 through December 2013 and met the following
criteria:
1. Used an unregulated fuel as a primary or secondary heating source during the pre-
installation period
a. participants who switched to natural gas through the Program were included, as
well as those who used unregulated fuels in both the pre- and post-periods
2. Had total savings from fuel oil, propane, and kerosene greater than 10 MMBtu
a. ten MMBtu was chosen as a cutoff as it represents approximately 10% of an
average household’s fuel consumption, a large enough impact to be identified in
the billing analysis7
3. Had at least one phone number in the program database.
The projects were combined by site ID (address) as some homes had more than one project
during the analysis period. This resulted in a sample frame with 4,953 homes.
3.2 SCREENER SURVEY
The process of preparing for the unregulated fuel billing analysis began with a screener survey.
The screener survey was designed to accomplish the following objectives:
1. Confirm fuel dealer in program records and identify fuel dealers used but not identified in
program records
2. Identify respondents who need to sign an additional consent form
6 Lohr, S., Sampling: Design and Analysis, Duxbury Press, 1999.
7 The HPwES PY2010-2013 Impact Evaluation report provides the evaluated MMBtu and the evaluated savings as a
percent of the average heating consumption per home for PY2007-2008 and PY2010-2013. The average annual
consumption per home is about 108 MMBtu/ year (17.3 MMBtu/16%) and 95 MMBtu/year (13.3/14%) for the earlier
and later evaluations, respectively. (Table 6, Home Performance with ENERGY STAR Program Impact Evaluation
Report (PY2010-2013) Final Report Volume 2: Phase 1 Billing Analysis, the New York State Energy Research and
Development Authority. Prepared by ERS and West Hill Energy and Computing. November 2016.)

HPwES: Unregulated Fuels Impact Evaluation Report Methods
8
3. Confirm measure installations
4. Obtain additional details about heating use and pattern of fuel deliveries to inform the
billing analysis
The survey was fielded in two parts. First, a Web-based survey of participants was fielded by
Abt/SBRI8 between March 31st 2015 and May 11th 2015. Follow up telephone surveys were
conducted with those participants who did not respond to the Web survey. Consent forms to
collect fuel dealer data were sent to all respondents who completed the survey and no incentives
were offered for completing the survey or returning the signed release form. For participants who
did not return the signed consent form, the program enrollment forms with the signed consent
were used when available.
Ultimately, 1,201 out of the 4,953 eligible participants in the sample frame completed the
screener survey. The survey disposition is included as Appendix C and the screener survey
instrument is provided in Appendix D. A memo with details about the results of the survey is
included as Appendix E. Additional information regarding the collection of the billing records is
included in Appendix F.
3.3 ATTRITION IN THE BILLING MODEL
Conducting a billing analysis of unregulated fuels requires multiple steps. In addition to fielding
the screener survey and obtaining permission to request billing records from the homeowners,
each fuel dealer was contacted individually and had to agree to provide the bills. Some homes
were removed from the model due to incomplete billing records, as described below.
Attrition occurred at each step of the process. The evaluation plan called for 200 homes in the
final model, and the survey sizes were estimated to account for the expected attrition. This
process was successfully resolved with 207 homes in the final model.
In a typical natural gas or electric billing analysis, approximately 40 to 50% of the potential
participants are removed due to incomplete data or other anomalies. The attrition due to data
cleaning for this evaluation was similar. The billing records received from fuel dealers were
reviewed and participants were removed from the billing model for the following reasons:
1. For non-fuel switch projects, less than 300 days of pre-installation or 300 days of post-
installation billing records
8 Abt/SBRI is NYSERDA’s evaluation survey contractor.

HPwES: Unregulated Fuels Impact Evaluation Report Methods
9
2. For fuel switch projects, less than 300 days of pre or post-installation billing records,
depending on the period when the fuel was used for heating
3. Some billing records were missing during analysis period, most often because the
participant used multiple fuel dealers and some did not provide billing records
4. Billing records were for a fuel that was not used for heating or was mostly or entirely
partial fills
A summary of the attrition is included in Table 3. Of the 844 participants with signed consent
forms and who completed the survey, billing records were received for 456 (54%) and 25% of
these projects were included in the final model.
Table 3: Summary of Billing Data Collection
Description Number of
Participants
Percent of Survey
Respondents
Completed screener survey 1,201
Returned consent forms 299 25%
Consent form available from program records 545 45%
Total with usable consent form 844 70%
Billing records were received 456 38%
Sufficient billing records for analysis 221 18%
In billing model 207 17%
3.4 PREPARING FOR CALCULATING SAVINGS
The data preparation and calculation of savings was conducted in the following order:
1. Identified partial fuel deliveries and combined with the next delivery with a filled tank
2. Identified pre and post installation period and removed projects with insufficient data
3. Converted the gallons of fossil fuel use to MMBtu
4. Calculated heating degree days (HDD) for each delivery period
The inconsistent nature of unregulated fossil fuel deliveries makes billing analysis more
complicated. Some participants receive fairly regular fuel deliveries and others may have the fuel
tank filled only when it is almost empty. If the fuel tank is filled to capacity, it is possible to
determine the amount of fuel used between deliveries since the amount delivered is the total fuel
consumed since the last delivery.

HPwES: Unregulated Fuels Impact Evaluation Report Methods
10
The first part of this process was to assess whether the fuel tanks were filled to capacity. This
issue was investigated by reviewing information from both participant screener survey and the
billing records received from the fuel dealers. This process included the following steps:
1. Participants were asked in the screener survey how often the fuel tank is filled to capacity
and almost 82% reported filling the tank all or most of the time.
2. Fuel dealers were asked to identify whether the tank was filled at each recorded delivery
and some fuel dealers were able to provide this information.
3. Deliveries of a multiple of 50 gallons, most often 100, 150 or 250 gallons, or with a very
short time period to the next delivery, were flagged as potential partial fills.
4. For deliveries identified as potential partial fills, the fuel was combined with the next full
delivery so that the delivery would represent the consumption during the period.
Participants with many potential partial fills were dropped from the analysis.
Given the irregular nature of fossil fuel delivery schedules, up to three years of pre and post usage
data were used. The inner bounds of the pre/post periods were defined as the delivery dates that
were closest to the installation date(s) and still fell within the selected period, e.g., the pre-period
ended on the fuel delivery date that was before the installation date and closest to the installation
date. Projects with less than 300 days of pre or post data were identified and removed if they
were not a fuel switch.
Heating degree days (HDD) for each delivery period (from the previous to the current delivery)
were calculated using hourly weather data collected by the National Oceanographic and
Atmospheric Administration (NOAA) from seven weather stations as identified by home in the
program tracking database. Weather stations with fewer than 10 sites were adjusted to the next
closest weather station. The HDD were calculated for each day and summed over each delivery
period for use in the regression analysis.
HDD were calculated using 4 different base temperatures (55°F, 60°F, 65°F and 70°F) to cover
the range of expected balance points in the homes. Regressions were conducted at all four base
temperatures for each home.
3.5 CALCULATION OF HOUSEHOLD SAVINGS
The primary analysis method was similar to the Princeton Scorekeeping Method (PRISM) and
involved conducting a house-by-house regression of the heating degree days on fossil fuel

HPwES: Unregulated Fuels Impact Evaluation Report Methods
11
consumption for the pre-installation and the post-installation period and comparing the results.
For homes with a fuel switch and sufficient data for only one of the fuels, the savings (or extra
use) were calculated for that fuel only.
The steps to calculate the savings are as follows:
1. Conduct pre and post regression analysis using the HDD and MMBtu consumption for
each home.
2. Identify the correct regression model to used based on survey information and available
data.
3. Remove projects with problematic data or regression results.
4. Calculate savings and summarize final results
The method of estimating savings depended on whether the same fuel was used for both space
and water heating.
Homes with the Same Fuel for Space and Water Heating
Based on the survey data, homes using the same fuel for hot water and heating were identified.
For these homes the base water heating use was estimated through the addition of an intercept in
the regression analysis, as follows:
1. If the estimated intercept for these homes was in a reasonable range, e.g., the intercept
was positive and of a magnitude that could signify base use, the heating use was
estimated using the intercept model.
2. If the intercept was negative, indicating that the billing records were not granular enough
to estimate water heating use, a non-intercept model was used instead.
There were a number of homes without survey responses to determine if the hot water and space
heat fuel was the same. For these homes the intercept and non-intercept model were both tested
and the model with the better fit was used.
Homes with Space Heating Only
Homes with the heating fuel used for space heating were analyzed differently. For these homes,
the regression only included fuel deliveries with at least 8 HDD/day to reduce the uncertainty
added from deliveries during the shoulder season and summer. This regression used a non-
intercept model as there was no base use in these homes.
HPwES: Unregulated Fuels Impact Evaluation Report Methods
12
Estimating Savings
The regression results were reviewed and homes with low R2 values (<0.7) or negative intercepts
and hot water savings were dropped. The verified savings for the remaining projects were
calculated using the 60 °F base HDD for all homes, as a review of the regression results indicated
that the 60° F base HDD provided more reliable results for most homes.
For homes using more than one type of unregulated fuel (such as oil and propane), the realization
rate was calculated using only the claimed fuel savings (or extra use) for which fuel data was
collected.
From the regression models, the savings from the heating measures were determined by
calculating the heating slope (MMBtu/HDD) separately for the pre- and post-installation period.
The difference in the two values was then multiplied by the 5-year annual average HDD for the
appropriate weather station. The water heating savings were calculated as the difference between
the pre- and post-period intercepts (MMBtu/day) multiplied by 365 days to obtain an annualized
value. In addition to calculating the MMBtu savings, the carbon dioxide savings were estimated
from the evaluated savings.
3.6 SOURCES OF UNCERTAINTY
There are two major sources of uncertainty in the savings calculations:
1. Use of a secondary heating fuel, particularly if there is change in use of the secondary
fuel between the pre- and post-periods; for example, some homeowners who have a wood
stove and an oil or propane central heating system may decide to increase wood use when
the price of oil or propane is higher.
2. Determining the balance point and applying the appropriate HDD base temperature,
which could vary from home to home as the balance points may be different
In both cases, sensitivity analyses were conducted to assess the potential range of the uncertainty
and found that these sources are unlikely to have a substantial impact on the RR. For further
discussion, see Appendices B and G.
3.7 MEASURE LEVEL SAVINGS
In addition to the calculation of the household savings, a secondary analysis to estimate measure
level savings was conducted for informational purposes. While household savings are reasonably

HPwES: Unregulated Fuels Impact Evaluation Report Methods
13
reliable, the measure level savings are more difficult to estimate with the modeling, and the
variability in the model prevents estimating these savings with a high degree of precision.9
A pooled regression was conducted to estimate savings at the measure level using the equation:
𝐻𝑆 = ∑ 𝛽𝑖
𝑝
𝑖=1
𝑥𝑖 + 𝜀
where
HS is the household savings in annual MMBtu
𝑥𝑖 is a dummy variable, set to 1 if measure i was installed
𝛽𝑖 is the regression coefficient for measure i, i.e., the savings for the measure in
annual MMBtu
ε is the error term
In addition to the dummy variable model, a statistically adjusted engineering (SAE) model was
also conducted by replacing xi with the program reported savings for the measure.
9 The precision is generally worse for the second stage regression approach than for the pooled time series models used
in the natural gas billing analysis.
14
SECTION 4: RESULTS AND FINDINGS
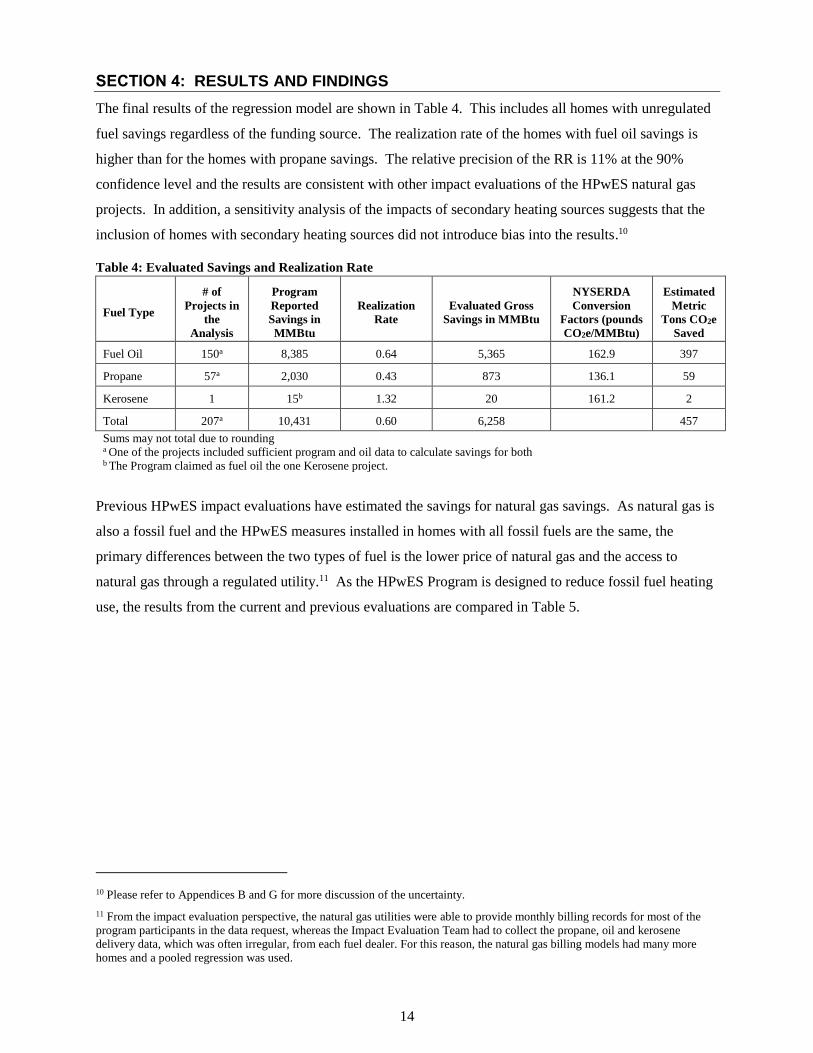
The final results of the regression model are shown in Table 4. This includes all homes with unregulated
fuel savings regardless of the funding source. The realization rate of the homes with fuel oil savings is
higher than for the homes with propane savings. The relative precision of the RR is 11% at the 90%
confidence level and the results are consistent with other impact evaluations of the HPwES natural gas
projects. In addition, a sensitivity analysis of the impacts of secondary heating sources suggests that the
inclusion of homes with secondary heating sources did not introduce bias into the results.10
Table 4: Evaluated Savings and Realization Rate
Fuel Type
# of
Projects in
the
Analysis
Program
Reported
Savings in
MMBtu
Realization
Rate
Evaluated Gross
Savings in MMBtu
NYSERDA
Conversion
Factors (pounds
CO2e/MMBtu)
Estimated
Metric
Tons CO2e
Saved
Fuel Oil 150a 8,385 0.64 5,365 162.9 397
Propane 57a 2,030 0.43 873 136.1 59
Kerosene 1 15b 1.32 20 161.2 2
Total 207a 10,431 0.60 6,258 457
Sums may not total due to rounding a One of the projects included sufficient program and oil data to calculate savings for both b The Program claimed as fuel oil the one Kerosene project.
Previous HPwES impact evaluations have estimated the savings for natural gas savings. As natural gas is
also a fossil fuel and the HPwES measures installed in homes with all fossil fuels are the same, the
primary differences between the two types of fuel is the lower price of natural gas and the access to
natural gas through a regulated utility.11 As the HPwES Program is designed to reduce fossil fuel heating
use, the results from the current and previous evaluations are compared in Table 5.
10 Please refer to Appendices B and G for more discussion of the uncertainty.
11 From the impact evaluation perspective, the natural gas utilities were able to provide monthly billing records for most of the
program participants in the data request, whereas the Impact Evaluation Team had to collect the propane, oil and kerosene
delivery data, which was often irregular, from each fuel dealer. For this reason, the natural gas billing models had many more
homes and a pooled regression was used.

HPwES: Unregulated Fuels Impact Evaluation Report Results
15
Table 5: Comparison of Unregulated Fuel Realization Rates to Realization Rates from Billing Analyses of
HPwES Natural Gas Projects
Metric 2011-2013 2010-20111 2007-20082
Unregulated Fuel Savings Natural Gas Savings Natural Gas Savings
Number of Utilities N/A 7 3
Realization Rate 0.60 0.48 0.65
Relative Precision +/- 11% +/- 1% +/- 7%
Average Evaluated Savings per Household
28.1 MMBtu 13.3 MMBtu 17.3 MMBtu
Lower 90% Confidence Limit 25.0 MMBtu 13.2 MMBtu 16.1 MMBtu
Upper 90% Confidence Limit 31.2 MMBtu 13.4 MMBtu 18.5 MMBtu
Percent of Pre-Installation Use
Saved3 27% 14% 16%
Number of Homes in Model 207 5,009 2,462
1 Home Performance with ENERGY STAR Program Impact Evaluation Report (PY2010-2013) Final Report Volume 2:
Phase 1 Billing Analysis, the New York State Energy Research and Development Authority. Prepared by ERS and West Hill
Energy and Computing. November 2016. Table 6. 2 NYSERDA 2007-2008 Home Performance with ENERGY STAR® Program Impact Evaluation Report Final, the New York
State Energy Research and Development Authority. Prepared by Megdal & Associates, LLC. September 2012.
3 The annual consumption per home during the pre-installation period was averaged for all homes in the billing models. The
“percent of pre-installation use saved” is the average annual evaluated savings divided by the annual average pre-installation
consumptions.
4.1 RGGI PROGRAM SAVINGS
Post hoc stratification was conducted to estimate the RR for the 132 RGGI funded projects separately
from the other homes. The 70 non-RGGI homes were funded by ARRA, SBC and EEPS. When the
RGGI funded projects are evaluated alone, the RR is very close to the overall RR (61% as compared to
the program RR of 60%). As the program implementation is identical regardless of the fuel type, this
outcome is expected. However, the smaller sample of RGGI projects results in a reduction in relative
precision from +/-11% to +/-19%. Consequently, the Impact Evaluation Team recommends using the RR
from the entire sample.
Table 6: Evaluated Savings and Realization Rates for RGGI Funded Projects
Fuel Type
# of
Projects in
the
Analysis
Program
Reported
Savings in
MMBtu
Realization
Rate
Evaluated Gross
Savings in
MMBtu
NYSERDA
Conversion
Factors (pounds
CO2e/MMBtu)
Estimated
Metric Tons
of CO2e
Saved
Fuel Oil 105a 5,167 0.64 3,307 162.9 244
Propane 28a 782 0.45 352 136.1 22
Kerosene 0 0 0.00 0 161.2 0
Total 132a 5,949 0.61 3,629 27,655 266 Sums may not total due to rounding a One of the projects included sufficient program and oil data to calculate savings for both
HPwES: Unregulated Fuels Impact Evaluation Report Results
16
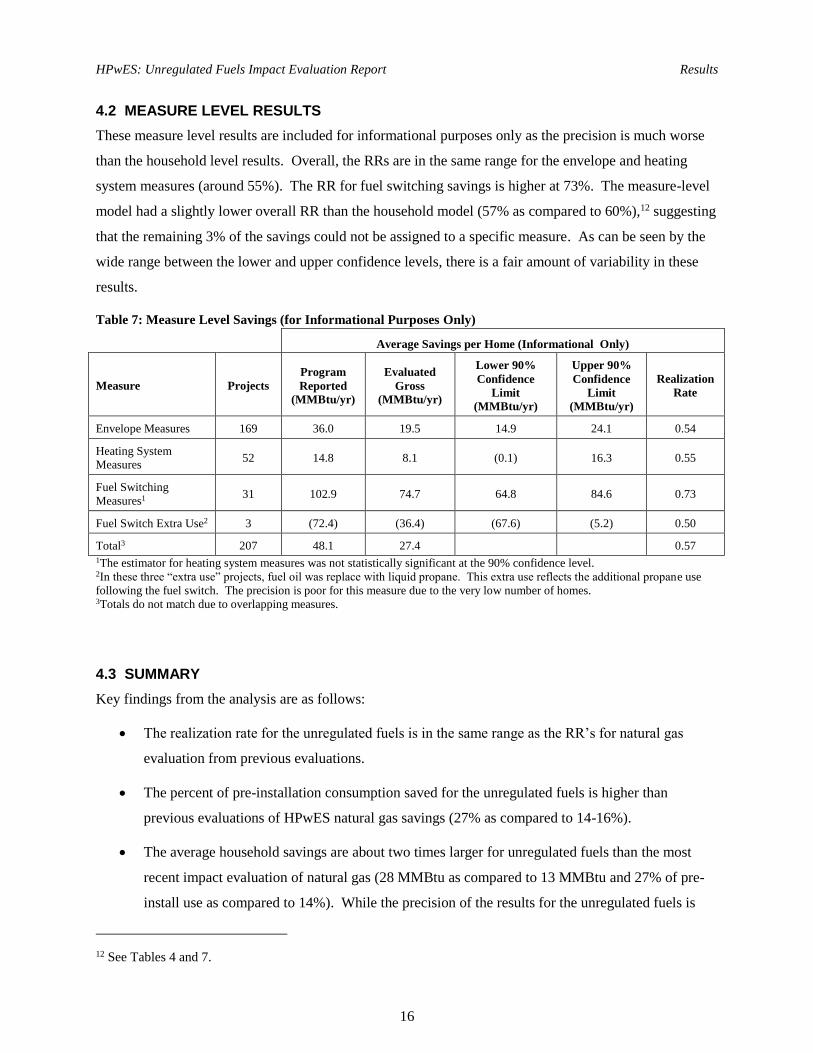
4.2 MEASURE LEVEL RESULTS
These measure level results are included for informational purposes only as the precision is much worse
than the household level results. Overall, the RRs are in the same range for the envelope and heating
system measures (around 55%). The RR for fuel switching savings is higher at 73%. The measure-level
model had a slightly lower overall RR than the household model (57% as compared to 60%),12 suggesting
that the remaining 3% of the savings could not be assigned to a specific measure. As can be seen by the
wide range between the lower and upper confidence levels, there is a fair amount of variability in these
results.
Table 7: Measure Level Savings (for Informational Purposes Only)
Average Savings per Home (Informational Only)
Measure Projects
Program
Reported
(MMBtu/yr)
Evaluated
Gross
(MMBtu/yr)
Lower 90%
Confidence
Limit
(MMBtu/yr)
Upper 90%
Confidence
Limit
(MMBtu/yr)
Realization
Rate
Envelope Measures 169 36.0 19.5 14.9 24.1 0.54
Heating System Measures
52 14.8 8.1 (0.1) 16.3 0.55
Fuel Switching
Measures1 31 102.9 74.7 64.8 84.6 0.73
Fuel Switch Extra Use2 3 (72.4) (36.4) (67.6) (5.2) 0.50
Total3 207 48.1 27.4 0.57 1The estimator for heating system measures was not statistically significant at the 90% confidence level. 2In these three “extra use” projects, fuel oil was replace with liquid propane. This extra use reflects the additional propane use
following the fuel switch. The precision is poor for this measure due to the very low number of homes. 3Totals do not match due to overlapping measures.
4.3 SUMMARY
Key findings from the analysis are as follows:
The realization rate for the unregulated fuels is in the same range as the RR’s for natural gas
evaluation from previous evaluations.
The percent of pre-installation consumption saved for the unregulated fuels is higher than
previous evaluations of HPwES natural gas savings (27% as compared to 14-16%).
The average household savings are about two times larger for unregulated fuels than the most
recent impact evaluation of natural gas (28 MMBtu as compared to 13 MMBtu and 27% of pre-
install use as compared to 14%). While the precision of the results for the unregulated fuels is
12 See Tables 4 and 7.

HPwES: Unregulated Fuels Impact Evaluation Report Results
17
higher (worse) than the natural gas evaluations due to the smaller number of homes in the model,
this difference is substantial and is statistically significant.
The realization rate seems to be fairly similar across the major measure categories, suggesting
that there is not a particular measure category driving the low realization rate.
A recent comparison of residential retrofit programs in the Northeast suggests that the 27% savings in
comparison to pre-installation bills is an excellent outcome, at least as compared to natural gas savings.
Of the seven programs with natural gas savings in this comparison, the program with the highest percent
savings achieved 22% of the pre-installation natural gas consumption.13
The HPwES historical and current RR’s and this comparison to other, similar programs suggest that the
Unregulated Fuels Component of the HPwES Program is achieving substantial savings. However, the
program estimated savings are overstated by a large margin. This issue has been investigated as part of
the HPwES Phase 2 Impact Evaluation, and the final report will be published later in 2016.
13 Bartsch, A., Danaher, C. “The Shell Game: Finding Thermal Savings in Residential Retrofit Programs,” 2014 Berlin
Conference, Berlin, Germany: International Energy Policy and Programme Evaluation Conference, September, 2014. The
program was a high-use residential program operated by Vermont Gas.

18
APPENDIX A: GLOSSARY OF TERMS14
attrition -The reduction in number as a result of failure to meet criteria.
billing analysis - Estimation of program savings through the analysis of billing records comparing
consumption prior to program participants and following program participation. This term
encompasses a variety of types of analysis, from simple pre/post to complex regressions.
building shell/envelope - The assembly of exterior components of a building which enclose conditioned
spaces, through which thermal energy may be transferred to or from the exterior, unconditioned
spaces, or the ground. The measures in HPwES in this category include insulation (attic and wall
insulation), window and door replacement, and air sealing.
DHW - domestic hot water, also water heater or water heating
evaluated gross savings-The change in energy consumption and/or demand that results directly from
program-related actions taken by participants in an efficiency program, regardless of why they
participated, as calculated by the program Impact Evaluation Team.
fossil fuel - Fuels formed from buried deposits of organic material, for example natural gas, fuel oil,
propane and kerosene
heating degree days (HDD) -A measure of the heating requirements for a building based on the
difference between the exterior temperature and a base temperature. The base temperature used
should be the temperature at which no heating is needed, and varies based on a building’s heating
settings and internal gains.
Home Performance with Energy Star (HPwES) -A comprehensive energy efficiency services program
for existing one- to four-family homes and low-rise residential buildings. The Program uses a
network of Building Performance Institute (BPI) Gold Star contractors to perform diagnostic testing
on the home, recommend improvements, determine the payback period for those improvements, and
install improvements selected by the homeowner. The Program uses RGGI funds for cost-effective
oil and propane efficiency measures, such as replacing inefficient oil and propane heating equipment
and other measures that have a direct impact on reducing GHG emissions from oil and propane
consumption. Income-qualified homeowners are eligible for higher incentive rates to make energy
improvements.
normalization -For the purpose of billing analysis this generally refers to temperature normalization. It is
a process of adjusting the savings to represent a year of typical temperatures rather than any variation
in temperatures between the pre and post installation years.
R2, R-squared - Proportion of variability in a regression data set that can be explained by the model.
realization rate (RR) – The ratio of the evaluated gross savings to the program reported savings. The
RR calculation for electric energy for a sampled project is shown below:
𝑅𝑅 =𝑘𝑊ℎ𝑒𝑣𝑎𝑙𝑢𝑎𝑡𝑖𝑜𝑛
𝑘𝑊ℎ𝑝𝑟𝑜𝑔𝑟𝑎𝑚
where,
𝑅𝑅 is the realization rate
𝑘𝑊ℎ𝑒𝑣𝑎𝑙𝑢𝑎𝑡𝑖𝑜𝑛 is the evaluated kWh savings (estimated by the impact evaluation contractor)
14 NYSERDA generally follows and uses the terms as defined in the “Northeast Energy Efficiency Partnerships Glossary of
Terms,” found at http://neep.org/uploads/EMV%20Forum/EMV%20Products/EMV_Glossary_Terms_Acronyms.pdf. This
glossary defines those terms absent from the NEEP report or provides more-specific definitions to generalized NEEP terms.

HPwES: Unregulated Fuels Impact Evaluation Report Appendix A
19
𝑘𝑊ℎ𝑝𝑟𝑜𝑔𝑟𝑎𝑚 is the kWh savings claimed by program
Regional Greenhouse Gas Initiative -In New York State, the Regional Greenhouse Gas Initiative
(RGGI) program has been implemented through two complementary regulations: the New York State
(NYS or the State) Department of Environmental Conservation (DEC) established New York’s
Carbon Dioxide (CO2) Budget Trading Program (6 NYCRR Part 242, 6 NYCRR Part 200, General
Provisions), and the New York State Energy Research and Development Authority (NYSERDA)
established the CO2 Allowance Auction Program (21 NYCRR Part 507).
New York State invests RGGI proceeds to support comprehensive strategies that best achieve the
RGGI CO2 emission reduction goals. These strategies aim to reduce global climate change and
pollution through energy efficiency, renewable energy, and carbon abatement technology.
secondary heating fuel - Fuels used as a secondary heating source, often wood or electric, but can also
be another fossil fuel.
unregulated fuels/unregulated fossil fuels -fuels (e.g., fuel oil, propane, and kerosene) used for space or
water heating, but not subject to regulation by the State of New York or federal authorities

HPwES: Unregulated Fuels Impact Evaluation Report Appendix B
20
APPENDIX B: BIAS AND SAMPLING PRECISION
Bias and sampling precision are two critical factors that affect the underlying reliability of evaluation
results. The evaluation was designed to generate a sufficiently large sample size to address the sampling
precision. The primary sources of potential bias are as follows:
the final list of participants who have sufficient billing history and are included in the model may
not be representative of the entire program population due to attrition
some external (non-program) factors may influence energy use but cannot be directly included in
the regression models
net effects, such as spillover, may be partially captured in models intended to estimate gross
savings
while it is assumed that the program is strictly retrofit, some measures, particularly heating
equipment, may in fact be market opportunity as the equipment has reached the end of its useful
life
Each of these potential sources of bias is discussed below.
Attrition
The concern regarding attrition is whether the removal of specific groups of homes with similar
characteristics may introduce bias into the regression results. The potential impacts of attrition are
dependent upon the relationship between the type of homes removed from the model and the program
delivery mechanisms, as well as the methods used to conduct the analysis and calculate evaluated
program savings.
The results from the billing analysis were translated to the program as a whole via realization rates, i.e.,
the relationship between the verified and program claimed savings was used as opposed to estimating
average savings per home.15 Thus, in assessing the potential bias associated with attrition from the billing
analysis, the key issue is whether there is any expectation that specific groups of homes have different
realization rates rather than whether the homes in the model are a good match to the homes in the
population.
15 An alternative strategy would be to use the billing analysis to establish program savings by measure group or by household,
apply these values to the program as a whole to estimate the evaluated program savings and then calculate the realization rate for
the whole program on this basis. Under this scenario, it would be important to ensure that the participants in the model were
similar to the program as a whole in terms of housing stock, weather conditions, and other factors.

HPwES: Unregulated Fuels Impact Evaluation Report Appendix B
21
There are two known issues that may potentially introduce bias into the analysis results. If specific large
contractors are better or worse at estimating programs savings and if all homes completed by one or more
of these large contractors are completely removed from the analysis, attrition could present a potential
source of bias. The second potential source of bias comes from participants who tend to move often and
are effectively removed from the analysis as a group since there is insufficient pre- or post-installation
billing records to be able to estimate savings. There is no way to assess the impact of this effect or
modify the billing models to address it. Potential bias from these sources on the realization rate could be
either upward or downward.
External Factors
External factors may impact energy use. When savings are estimated from a billing analysis, these
external impacts may introduce either an upward or downward bias to the results. The NAC model
controls for seasonal changes in energy use that can be directly incorporated into the model, such as
weather. However, it is possible the estimation of program impacts can be affected by other factors that
change over time. These types of changes can be conceptualized in two broad categories:
1. Changes in the overall economy that affect the residential market in a global way, such as volatile
gasoline prices, unemployment rates, or an increase in home heating costs.
2. Individual changes that affect specific homes, such as acquiring new household members, taking
a longer vacation, or having a change in one's work schedule
The most common approach to investigating the external factors is to incorporate non-participant billing
data by developing a trend line of non-participant consumption patterns, assessing overall changes in non-
participant energy consumption during the same period or directly incorporating non-participants' billing
records in the regression models.
Collecting the billing data for this analysis was a long and difficult process, and it was not possible collect
nonparticipant billing data. It should also be noted that the use of nonparticipant billing data could
introduce net effects, such as free ridership or spillover, into the models. In the end, a billing analysis that
includes both participants and a nonparticipant comparison group will likely produce savings estimates
that are somewhere in between gross and net effects and, thus, difficult to interpret with any degree of
accuracy.
Many changes occur over time within homes that are completely outside the influence of the program and
yet have an impact on energy use within homes. The approach of including all homes with sufficient
billing history in the model is intended to provide a sufficient number of homes in the sample to allow
these variations to balance out. This conclusion was supported by a recent residential impact evaluation

HPwES: Unregulated Fuels Impact Evaluation Report Appendix B
22
which included detailed surveys of homeowners and a restricted billing analysis. This evaluation
concluded that modeling the individual changes within each home did not affect the savings estimates.16
Homeowner surveys were conducted for all participants in the model. The purpose of these surveys was
to obtain permission to verify that homes are heating with unregulated fossil fuels, request billing records
from fuel dealers, and identify the way that participants used secondary heating sources before and after
program services.
Net Effects
The objective of this impact evaluation was to estimate savings for the program, i.e., the reduction in
energy use at the home directly due to measures installed through the program.
The analysis included participants only, as obtaining non-participant billing data was not feasible with the
time line and budget. However, the participant-only models may also include net effects in the form of
participant Inside Spill Over. This type of spillover occurs when a program participant learns about
efficiency through the program and then elects to install additional measures on their own at the same
location. Since this net effect occurs in response to information learned through program participation, it
can only occur after the program-related installation and will tend to reduce consumption during the post-
installation period.
Replacement at End of Equipment Life
Water and heating system replacements are the measures which could possibly be market opportunity if
the existing equipment was at the end of its useful life. While estimating retrofit savings for market
opportunity measures would tend to introduce an upward bias into the evaluated savings, the majority of
heating system replacements were fuel switches and there were relatively few water system replacements.
Thus, this issue is unlikely to have a substantial impact on the results.
16 NYSERDA 2007-2008 EMPOWER NEW YORKSM Program Impact Evaluation Report, Prepared for The New York State
Energy Research and Development Authority. Prepared by Megdal & Associates, LLC. February 2012.
23
APPENDIX C: SURVEY DISPOSITION
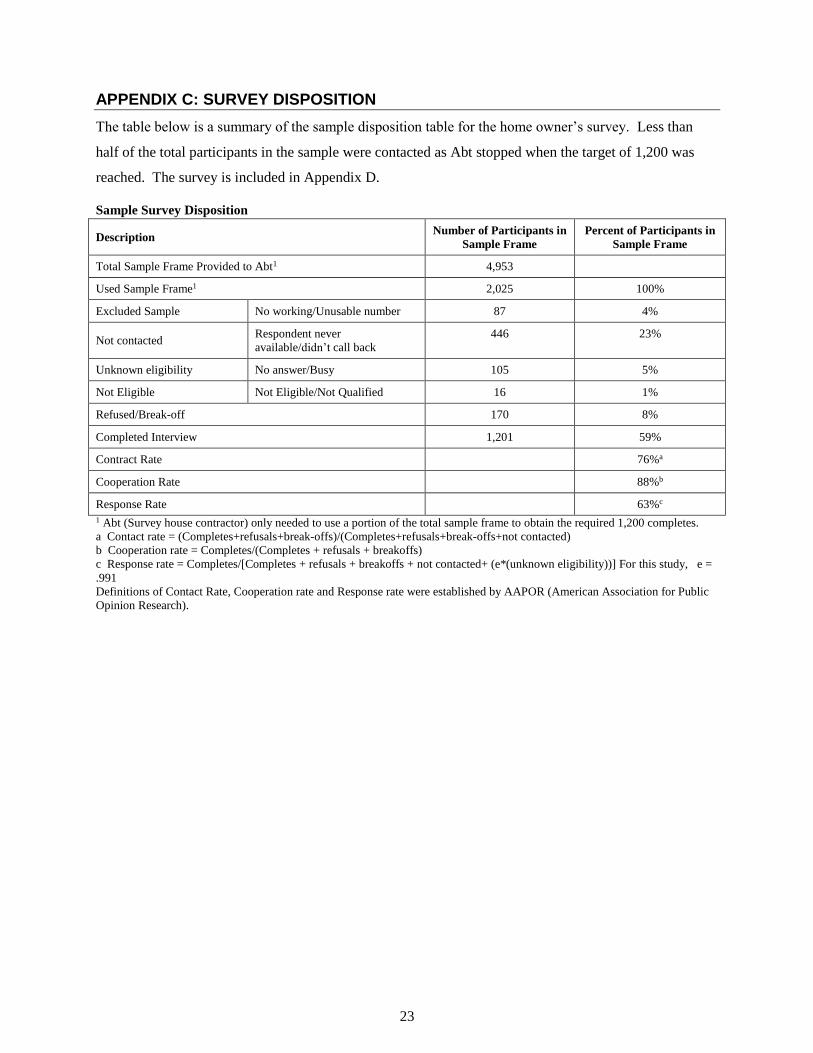
The table below is a summary of the sample disposition table for the home owner’s survey. Less than
half of the total participants in the sample were contacted as Abt stopped when the target of 1,200 was
reached. The survey is included in Appendix D.
Sample Survey Disposition
Description Number of Participants in
Sample Frame
Percent of Participants in
Sample Frame
Total Sample Frame Provided to Abt1 4,953
Used Sample Frame1 2,025 100%
Excluded Sample No working/Unusable number 87 4%
Not contacted Respondent never
available/didn’t call back
446 23%
Unknown eligibility No answer/Busy 105 5%
Not Eligible Not Eligible/Not Qualified 16 1%
Refused/Break-off 170 8%
Completed Interview 1,201 59%
Contract Rate 76%a
Cooperation Rate 88%b
Response Rate 63%c
1 Abt (Survey house contractor) only needed to use a portion of the total sample frame to obtain the required 1,200 completes.
a Contact rate = (Completes+refusals+break-offs)/(Completes+refusals+break-offs+not contacted)
b Cooperation rate = Completes/(Completes + refusals + breakoffs)
c Response rate = Completes/[Completes + refusals + breakoffs + not contacted+ (e*(unknown eligibility))] For this study, e =
.991
Definitions of Contact Rate, Cooperation rate and Response rate were established by AAPOR (American Association for Public
Opinion Research).

25
APPENDIX D: HOMEOWNERS SURVEY
Unregulated Fuel Impact Evaluation
Home Performance with ENERGY STAR®: Homeowners Survey
March 6, 2015
CONTACT INFORMATION SHEET
Respondent Name
Address
City/State/ZIP
Phone
Customer ID
Contractor
Date Work Completed
Measures Installed
SM1-Insulation
SM2-Air Sealing
SM3-Replacement windows or doors
SM4-Heating System
SM5-Programmable Thermostat
SM6-Water Heater
SM7-Hot water conservation measures
Program Primary Fuel
Program Fuel Dealer
Interview Date
Interviewer Initials

HPwES: Unregulated Fuels Impact Evaluation Report Appendix D
26
Section Purpose Questions
SCR Find correct person SCR1- SCR5
M Confirm installed measures M1-M11
BPI BPI recognition BPI1-BPI2
HS Heating system and fuel use information HS1-HS8
FD Fuel dealer and delivery FD1-FD6
B Barriers to installation B1-B3
T Thermostat settings T1-T5
WH Water heater WH1-WH2
OCC Occupancy changes OCC1-OCC8
D Demographic information D1-D3
C
Consent form reminder/questions; closer
question allowing additional comments
on Program
C1-C6
SURVEY COMPLETE: FIELD UNREGFUEL=1 AT END OF SURVEY

HPwES: Unregulated Fuels Impact Evaluation Report Appendix D
27
4.4 FORMATTING NOTES: ALL TEXT IN CAPS (EXCEPT WHEN DENOTING THE ENERGY STAR PROGRAM) IS NOT INTENDED TO BE READ. DIRECTIONS ARE IN SQUARE BRACKETS IN BOLD.
[IF A NAME IS PROVIDED, ASK TO SPEAK WITH NAMED CONTACT. OTHERWISE, ASK
TO SPEAK TO AN ADULT (IF NECESSARY). WHEN PERSON COMES TO THE PHONE OR
IF PERSON ANSWERING PHONE ASKS WHAT THIS IS ABOUT, READ:]
Phone number to dial: (<area>) <prefix>-<suffix>, ext: <PHEXT>
Interviewer notes: <INTNOTE:O>
Hello, may I please speak to [NAME]?
My name is ___________ and I'm calling on behalf of the New York State Energy Research and
Development Authority or NYSERDA.
We’re calling households that installed efficiency upgrades through NYSERDA’s Home Performance
with ENERGY STAR Program. We’re calling today to ask you some questions about your experience
with this Program to help us evaluate how NYSERDA might serve people better. NYSERDA recently
sent you a letter telling you that we would be calling.
[READ IF NECESSARY OR ASKS HOW WE GOT THEIR INFO:]
Our records show that you worked with a participating ENERGY STAR contractor to have an energy
audit and install efficiency upgrades.
[READ THE FOLLOWING PARAGRAPH FOR ALL RESPONDENTS]
You were selected as part of a carefully designed sample and feedback about your experience with this
program is very important to future planning for energy efficiency programs in New York. Your
responses to this survey will be kept confidential to the extent permitted by law.
SCR1. I have your name down as the contact for the Home Performance with ENERGY STAR Program.
Do you recall installing energy efficiency upgrades through the Home Performance with
ENERGY STAR Program?
1. YES [GO TO SCR3]
2. NO
96 DON’T KNOW [THANK AND TERMINATE]
97 REFUSED [THANK AND TERMINATE]
SCR2. Is there someone else in your household that might be able to help me?

HPwES: Unregulated Fuels Impact Evaluation Report Appendix D
28
1. YES [ASK TO SPEAK TO NEW CONTACT, RESTART AT INTRO]
2. NO [THANK AND TERMINATE]
96 DON’T KNOW [THANK AND TERMINATE]
97 REFUSED [THANK AND TERMINATE]
[ONCE CORRECT PERSON IS ON THE LINE, REINTRODUCE AND CONTINUE.]
This survey will take about 10 minutes to complete, depending on your answers.
[IF NECESSARY]: Can we schedule a time for me to call you back?
[IF NOT A CONVENIENT TIME, SCHEDULE A FOLLOW-UP DATE AND TIME, AND
RECORD IT BELOW.]
APPOINTMENT DATE AND TIME: ________________________________________
SCR3. Our records show that your address is [ADDRESS] in [TOWN], is this correct?
1. YES
2. NO – [PLEASE SPECIFY: _______________________________________________]
96 DON’T KNOW [THANK AND TERMINATE]
97 REFUSED [THANK AND TERMINATE]
SCR4. Our records also show that your home had energy efficiency upgrades completed by
[CONTRACTOR]. Is this correct?
1. YES
2. NO –NEVER HAD EFFICIENCY UPGRADES DONE AT MY HOME [THANK AND
TERMINATE]
3. NO –WRONG CONTRACTOR NAME [PLEASE SPECIFY CORRECT NAME]:
________________________________________
96 DON’T KNOW
97 REFUSED
SCR5. Were all of the energy efficiency upgrades completed in [MONTH/YEAR COMPLETED]?
1. YES – [CONTINUE TO NEXT SECTION]
2. NO –WRONG YEAR [PLEASE SPECIFY CORRECT MONTH/YEAR]:
________________________________________
96 DON’T KNOW
97 REFUSED

HPwES: Unregulated Fuels Impact Evaluation Report Appendix D
29
MEASURE INSTALLATIONS
The next set of questions refers to the efficiency upgrades installed through the Program.
[FOR EACH INSTALLED MEASURE MARKED IN THE SAMPLE FRAME FILE, ASK
QUESTION M1, M2 AND M3. FOR MEASURES SM4 AND SM6, CONTINUE WITH
QUESTIONS M4 THROUGH M6 AND THEN RETURN TO M1 FOR THE NEXT MEASURE.
FOR MEASURES SM1, SM2, SM3, SM5 AND SM7, ASK M1, M2 and M3 ONLY. CONTINUE
TO M7 AFTER QUESTION M3 FOR SM7. TABLE 1 PROVIDES THE [MEAS] AND
[SMDESC] LANGUAGE USED IN QUESTIONS M1 THROUGH M6. ASK The SERIES FOR UP
TO 4 SPECIFIED MEASURES.]
Table 1.
Survey Measures [MEAS] Description [SMDESC]
SM1. [INSULATION] SMDESC1. insulation
SM2. [AIR SEALING] SMDESC2. air sealing
SM3. [REPLACEMENT WINDOWS OR
DOORS] SMDESC3. high efficiency windows or doors
SM4. [HEATING SYSTEM] SMDESC4. a high efficiency heating system
SM5. [PROGRAMMABLE THERMOSTAT] SMDESC5. a programmable thermostat
SM6. [WATER HEATER] SMDESC6. a high efficiency water heater
SM7. [HOT WATER CONSERVATION
MEASURES] (e.g., low flow showerhead, tank
wrap, or pipe insulation)
SMDESC7. hot water conservation measures
[START MEASURE LOOP; SM[X]=1 TO MEASNUM. MEASNUM = TOTAL NUMBER OF
MEASURES INDENTIFIED IN THE SAMPLE FRAME.]
M1. Did you install SMDESC[X]?
1. YES
2. NO
96 DON’T KNOW
97 REFUSED
M2. [IF X NE 3 AND X NE 7] Was the MEAS[X] recommended in the Home Performance with
ENERGY STAR audit report?
[IF X = 3 OR X= 7] Were the MEAS[X] recommended in the Home Performance with ENERGY STAR
audit report?
1 YES
2 NO
HPwES: Unregulated Fuels Impact Evaluation Report Appendix D
30
96 DON’T KNOW
97 REFUSED
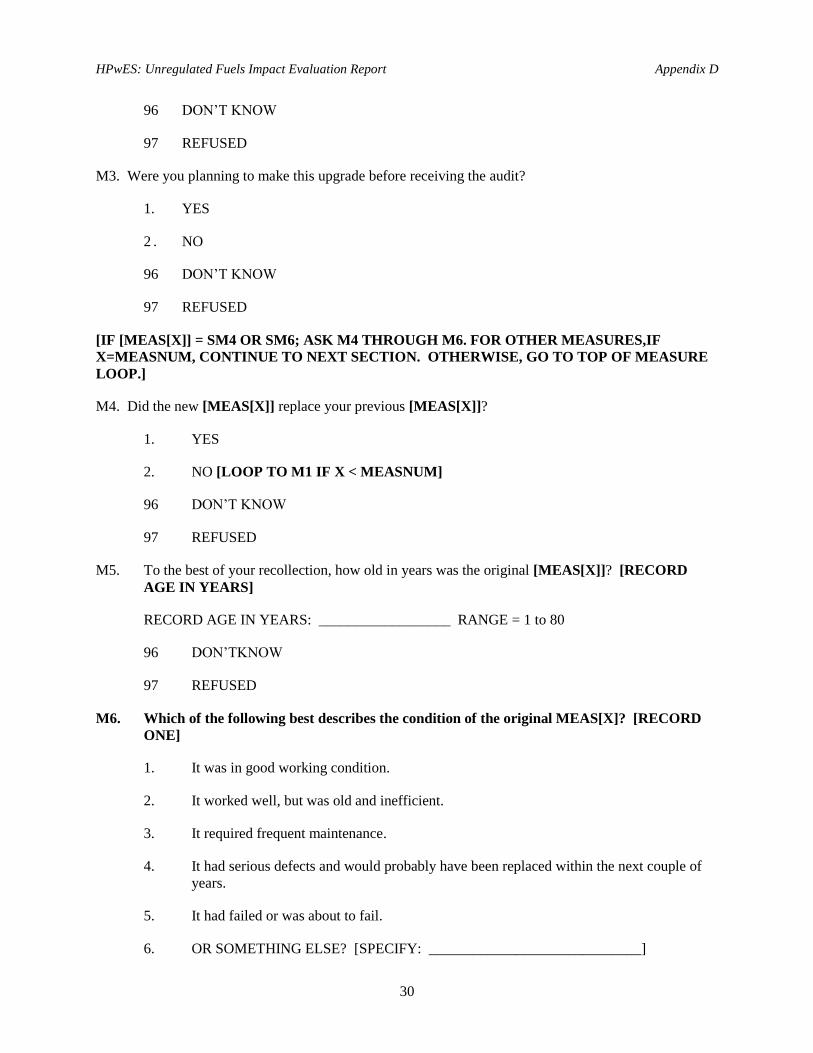
M3. Were you planning to make this upgrade before receiving the audit?
1. YES
2 . NO
96 DON’T KNOW
97 REFUSED
[IF [MEAS[X]] = SM4 OR SM6; ASK M4 THROUGH M6. FOR OTHER MEASURES,IF
X=MEASNUM, CONTINUE TO NEXT SECTION. OTHERWISE, GO TO TOP OF MEASURE
LOOP.]
M4. Did the new [MEAS[X]] replace your previous [MEAS[X]]?
1. YES
2. NO [LOOP TO M1 IF X < MEASNUM]
96 DON’T KNOW
97 REFUSED
M5. To the best of your recollection, how old in years was the original [MEAS[X]]? [RECORD
AGE IN YEARS]
RECORD AGE IN YEARS: __________________ RANGE = 1 to 80
96 DON’TKNOW
97 REFUSED
M6. Which of the following best describes the condition of the original MEAS[X]? [RECORD
ONE]
1. It was in good working condition.
2. It worked well, but was old and inefficient.
3. It required frequent maintenance.
4. It had serious defects and would probably have been replaced within the next couple of
years.
5. It had failed or was about to fail.
6. OR SOMETHING ELSE? [SPECIFY: _____________________________]
HPwES: Unregulated Fuels Impact Evaluation Report Appendix D
31
96 DON’T KNOW
97 REFUSED
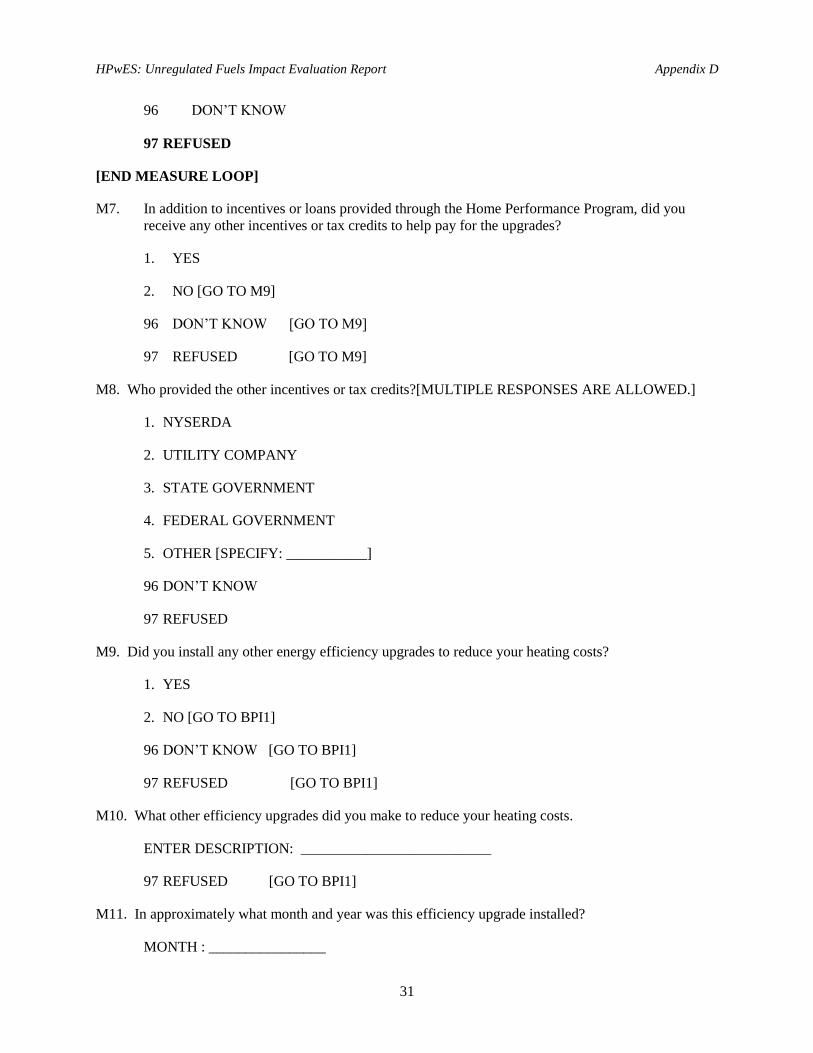
[END MEASURE LOOP]
M7. In addition to incentives or loans provided through the Home Performance Program, did you
receive any other incentives or tax credits to help pay for the upgrades?
1. YES
2. NO [GO TO M9]
96 DON’T KNOW [GO TO M9]
97 REFUSED [GO TO M9]
M8. Who provided the other incentives or tax credits?[MULTIPLE RESPONSES ARE ALLOWED.]
1. NYSERDA
2. UTILITY COMPANY
3. STATE GOVERNMENT
4. FEDERAL GOVERNMENT
5. OTHER [SPECIFY: ___________]
96 DON’T KNOW
97 REFUSED
M9. Did you install any other energy efficiency upgrades to reduce your heating costs?
1. YES
2. NO [GO TO BPI1]
96 DON’T KNOW [GO TO BPI1]
97 REFUSED [GO TO BPI1]
M10. What other efficiency upgrades did you make to reduce your heating costs.
ENTER DESCRIPTION: __________________________
97 REFUSED [GO TO BPI1]
M11. In approximately what month and year was this efficiency upgrade installed?
MONTH : ________________

HPwES: Unregulated Fuels Impact Evaluation Report Appendix D
32
YEAR: ________
96 DON’T KNOW
97 REFUSED
BPI QUESTIONS
BPI1. Have you heard of the Building Performance Institute?
1. YES
2. NO [GO TO HS1]
96 DON’T KNOW [GO TO HS1]
97 REFUSED [GO TO HS1]
BPI2. When selecting the contractor, did you look for a BPI contractor?
1. YES
2. NO
96 DON’T KNOW
97 REFUSED
HEATING SYSTEM INFORMATION
[SET UNREGFUEL=1. ]
HS1. Which heating fuels do you use? Please list all heating fuels, including space heaters. [DO NOT
READ ON PHONE. LIST ALL ON WEB VERSION, CHOOSE AS MANY AS APPLY]
WEB Question: Which of the following heating fuels do you use, including space heaters?
1. FUEL OIL
2. NATURAL GAS (NOT PROPANE)
3. LIQUID PROPANE GAS
4. ELECTRIC
5. WOOD
6. WOOD PELLETS
7. KEROSENE
8. OTHER (SPECIFY: ______________)

HPwES: Unregulated Fuels Impact Evaluation Report Appendix D
33
97 REFUSED [SET UNREGFUEL TO 0; GO TO B1]
[SET FUELNUM= NUMBER OF RESPONSES TO HS1 (1 THROUGH 8 ). IF FUELNUM=1,
SKIP TO HS3.]
HS2. Please rank the fuels by how much each one contributes to heating your home, with the primary
fuel at the top. [IF NEEDED: For example, if you heat with oil and have a wood stove that you
use occasionally, oil is ranked as the first fuel and wood as the second. NOTE TO
INTERVIEWER: RANKING IS IMPORTANT, EVEN IF THERE IS LITTLE
DIFFERENCE BETWEEN THE USE OF THE FIRST AND SECOND FUELS.]
1 FUEL 1: ______________
2 FUEL 2: ______________
3 FUEL 3: ______________
4 FUEL 4: ______________
5 ALL FUELS ARE USED EQUALLY
[IF HS2 = 5, ASSIGN FUEL1 TO THE FIRST FUEL SELECTED IN HS1, AND FUEL2 TO THE
SECOND, ETC.]
HS3. What was your primary heating fuel prior to your work being done? [DO NOT READ,
CHOOSE ONE]
1. FUEL OIL
2. NATURAL GAS (NOT PROPANE)
3. LIQUID PROPANE GAS
4. ELECTRIC
5. WOOD
6. WOOD PELLETS
7. KEROSENE
8. OTHER (SPECIFY: ______________)
97 REFUSED [SET UNREGFUEL TO 0; GO TO B1]
[IF NO MENTION OF FUEL OIL, PROPANE OR KEROSENE IN HS1 THROUGH HS3, SET
UNREGFUEL=0 AND GO TO THE BARRIERS SECTION, STARTING WITH B1.]
[HEATING SYSTEM LOOP I=1 TO FUELNUM.]

HPwES: Unregulated Fuels Impact Evaluation Report Appendix D
34
HS4. What type of FUEL[I] heating system do you have? [RECORD ALL THAT APPLY.
PROMPT IF NECESSARY.]
1. HOT AIR FURNACE
2. WATER OR STEAM BOILER
3. RADIANT
4. WOODSTOVE OR WOOD FIREPLACE INSERT
5. PELLET STOVE OR PELLET FIREPLACE INSERT
6. FIREPLACE
7. ELECTRIC BASEBOARD
8. SPACE HEATER
9. OTHER [Please describe type:_______]
96 DON’T KNOW
97 REFUSED
[IF FUELNUM=1, EXIT HEATING SYSTEM LOOP AND GO TO FD1.]
HS5. Which of the following best describes how you use the FUEL[I] heat since the work was done?
[READ LIST, RECORD ONE]
1. Throughout the entire heating season from September to May
2. Only during the coldest months from December to February]
3. Only in the Spring and Fall
4. Only on the coldest days
5. Rarely
6. OTHER (SPECIFY: ___________________)
96. DON’T KNOW
97. REFUSED
HS6. Approximately what percent of your living space is heated by the FUEL[I] heating system?
[READ LIST, RECORD ONE]
1. 100%
2. 81 to 99%

HPwES: Unregulated Fuels Impact Evaluation Report Appendix D
35
3. 61 to 80%
4. 41 to 60%
5. 21 to 40%
6. Less than 20%
96 DON’T KNOW
97 REFUSED
HS7. Comparing the winter since your work was done to the winter before the work, did you change
the way you use your FUEL[I] heat? For example, did you make a decision to increase or
decrease the use of your FUEL[I] heat? Please stop me when you hear the appropriate response.
[READ LIST, RECORD ONE]
1. No, I used the FUEL[I] heat about the same during the winter before the work was done
2. Yes, I did not use the FUEL[I] heat at all during the winter before the work was done
3. Yes, I used the FUEL[I] heat a lot less during the winter before the work was done
4. Somewhat less
5. Somewhat more
6. Or a lot more during the winter before the work was done
96 DON”T KNOW
97 REFUSED
[END LOOP]
[ASK HS8 AND HS8a IF FUEL1, FUEL2, FUEL3 OR FUEL4 IS WOOD OR WOOD PELLETS. ]
HS8. Approximately how many cords of wood did you burn last winter 2013/2014?
1. _____________[RECORD RESPONSE]
96 DON’T KNOW
97 REFUSED
HS8a. Approximately how many tons of pellets did your burn last winter of 2013/14?
1. _____________[RECORD RESPONSE]
96 DON’T KNOW

HPwES: Unregulated Fuels Impact Evaluation Report Appendix D
36
97 REFUSED
FUEL DEALER QUESTIONS
FD1. [IF FUELDEALER1 IS FILLED IN] Our records indicate that you purchase fuel from
[FUELDEALER1]. Is this correct?
1. YES
2. NO
96 DON’T KNOW
97 REFUSED
FD2. Have you used more than one fuel dealer during the past five years? [IF FUELNUM>1, ADD:]
Please include fuel dealers for all of your heating fuels.
1. YES
2. NO [GO TO FD4]
96 DON’T KNOW [GO TO FD4]
97 REFUSED [GO TO FD4]
FD3. How many fuel dealers have you used during the past five years?
1. TWO
2. THREE
3. MORE THAN 3
96 DON’T KNOW
97 REFUSED
FD4. [IF FD1=YES AND FD2=NO, GO TO FD5.]
[IF FD2=NO, ASK:] What is the name of your fuel dealer?
[IF FD2=YES, ASK:] What are the names of your fuel dealers?
ENTER NAMES: __________________________________
96 DON’T KNOW
97 REFUSED
HPwES: Unregulated Fuels Impact Evaluation Report Appendix D
37
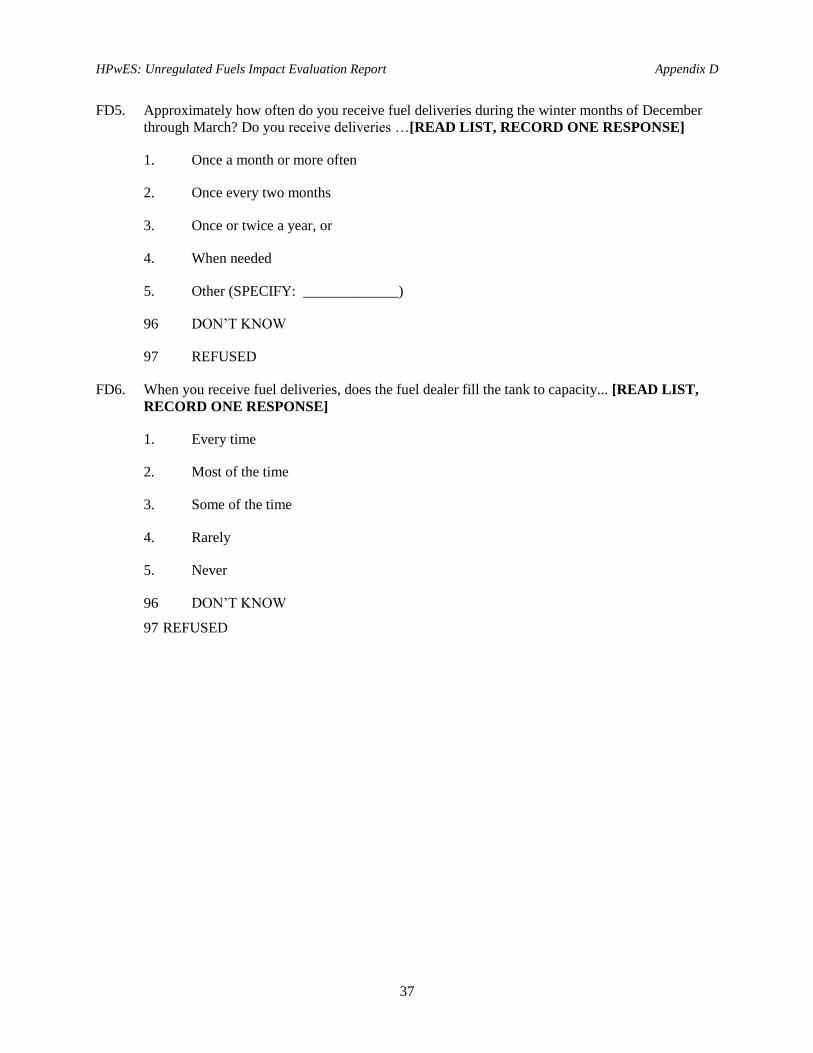
FD5. Approximately how often do you receive fuel deliveries during the winter months of December
through March? Do you receive deliveries …[READ LIST, RECORD ONE RESPONSE]
1. Once a month or more often
2. Once every two months
3. Once or twice a year, or
4. When needed
5. Other (SPECIFY: _____________)
96 DON’T KNOW
97 REFUSED
FD6. When you receive fuel deliveries, does the fuel dealer fill the tank to capacity... [READ LIST,
RECORD ONE RESPONSE]
1. Every time
2. Most of the time
3. Some of the time
4. Rarely
5. Never
96 DON’T KNOW
97 REFUSED

HPwES: Unregulated Fuels Impact Evaluation Report Appendix D
38
BARRIERS TO INSTALLATION
B1. Please tell me in your own words why you participated in the Home Performance with ENERGY
STAR Program.
1. [RECORD VERBATIM]
96 DON’T KNOW
97 REFUSED
B2. Thinking back to before your Home Performance audit, can you tell me why you decided to
request the audit and install the efficiency upgrades?
1. [RECORD VERBATIM]
96 DON’T KNOW
97 REFUSED
B3. What prevented you from taking action earlier?
1. [RECORD VERBATIM]
96 DON’T KNOW
97 REFUSED
[IF UNREGFUEL=0, SKIP TO D1.]
THERMOSTAT USE
T1. How do you control your FUEL1 heat? Do you… [READ LIST, RECORD ONE RESPONSE;
RANDOMIZE RESPONSES 1 TO 3]
1. Set it at one temperature and leave it
2. Manually adjust the temperature as needed
3. Set it back using a programmable thermostat
4. OTHER, [SPECIFY: ________________]
96 DON’T KNOW
97 REFUSED
T2. Comparing the winter before your efficiency upgrades were completed to the winter after, did
you notice a change in your heating fuel bills?
1. YES
2. NO

HPwES: Unregulated Fuels Impact Evaluation Report Appendix D
39
96 DON’T KNOW [GO TO WH1]
97 REFUSED [GO TO WH1]
T3. After the work was completed, did you change the way you use the FUEL1 heat? Which of these
best describes your reaction? [READ LIST, CHOOSE ONE; RANDOMIZE RESPONSES.]
1. You turned up the thermostat
2. You turned down the thermostat
3. You left thermostat setting the same [GO TO WH1]
96 DON’T KNOW [GO TO WH1]
97 REFUSED [GO TO WH1]
T4. Did you change the thermostat setting by 5 degrees or more?
1. YES
2. NO
96 DON’T KNOW
97 REFUSED
T5. Thinking back to before the work was done, how did you control the [FUEL1] heat? Did you…
[READ LIST, RECORD ONE RESPONSE IF RESPONDENT INDICATES MULTIPLE
RESPONSES, READ: How do you control the heat in your living room and kitchen? ]
1. Set it at one temperature and leave it
2. Manually adjust the temperature as needed
3. Set it back using a programmable thermostat
95 OTHER [SPECIFY: _____________]
96 DON’T KNOW
97 REFUSED
WATER HEATING
WH1. What fuel do you use to heat your water? [PROMPT IF NECESSARY. IF RESPONDENT
SAYS GAS, CLARIFY: Do you heat your water with natural gas or propane?]
1. NATURAL GAS, NOT PROPANE
2. ELECTRIC

HPwES: Unregulated Fuels Impact Evaluation Report Appendix D
40
3. PROPANE
4. FUEL OIL
5. SOLAR WITH ELECTRIC BACK UP
6. SOLAR WITH PROPANE BACK UP
7. OTHER [SPECIFY: _____________]
96. DON’T KNOW [GO TO OCC1]
97. REFUSED [GO TO OCC1]
WH2. What fuel did you use to heat your water prior to the work? [PROMPT IF NECESSARY. IF
RESPONDENT SAYS GAS, CLARIFY: Do you heat your water with natural gas or propane?]
1. NATURAL GAS, NOT PROPANE
2. ELECTRIC
3. PROPANE
4. FUEL OIL
5. SOLAR WITH ELECTRIC BACK UP
6. SOLAR WITH PROPANE BACK UP
7. OTHER [SPECIFY: _____________]
96. DON’T KNOW
97. REFUSED
OCCUPANCY
READ FOR ALL
We would like to ask you some questions about any changes you might have had in the number of people
living in your home and in your day-to-day schedule before the work and after.
OCC1. Which seasons of the year is your home occupied?
[CHECK ALL MENTIONED. PROMPT IF NECESSARY]
1. ALL FOUR SEASONS (YEAR AROUND)
2. WINTER
3. SUMMER
4. SPRING

HPwES: Unregulated Fuels Impact Evaluation Report Appendix D
41
5. FALL
6. OTHER [SPECIFY: _____________]
96. DON’T KNOW
97. REFUSED
OCC2. Including all adults and children, how many people currently live in your household more than
nine months out of the year?
1. [RECORD NUMBER] Range = 1 to 10, where 10 = 10 or more
96. REFUSED [GO TO OCC4]
97. DON’T KNOW [GO TO OCC4]
OCC3. Thinking back to before the work was done, how many people were living in your home?
1. [RECORD NUMBER] Range = 1 to 10, 10 = 10 or more
96. DON’T KNOW
97. REFUSED
OCC4. Compared to the winter months before the work was done, was there a change in your vacation
schedule or the number of weeks when no one was at home? [IF RESPONDENT SAYS NO,
RECORD AND GO TO NEXT SECTION. IF RESPONDENT SAYS YES, PROMPT
WITH 2 AND 3.]
1. NO, NO CHANGE IN SCHEDULE. [GO TO D1]
2. YES, less time away since the work was done. [GO TO OCC5]
3. YES, more time away since the work was done. [GO TO OCC6]
96 DON”T KNOW [GO TO OCC7]
97 REFUSED [GO TO OCC7]
OCC5. Was the time away since the work shorter by… [READ LIST]
1. More than 2 weeks [GO TO OCC7]
2. Less than 2 weeks [GO TO OCC7]
96 DON’T KNOW [GO TO OCC7]
97 REFUSED [GO TO OCC7]
OCC6. Was the time away since the work longer by… [READ LIST]
1. More than 2 weeks

HPwES: Unregulated Fuels Impact Evaluation Report Appendix D
42
2. Less than 2 weeks
96 DON’T KNOW
97 REFUSED
OCC7. Did any members of your household have a change in day-to-day schedule when comparing
before the work was done in your home and after?
1. YES
2. NO [GO TO D1]
96 DON’T KNOW [GO TO D1]
97 REFUSED [GO TO D1]
OCC8. How did the schedule change? Were members of your home… [READ LIST]
1. At home more since the work
2. At home less since the work
3. OTHER [SPECIFY: _____________]
96 DON’T KNOW
97 REFUSED
DEMOGRAPHICS
I have a few general questions for statistical purposes. This information will be combined across all
respondents and will not be shared with anyone outside of the NYSERDA evaluation team.
D1. What is the highest level of education completed by a homeowner in this household? Please stop
me when I reach the correct response?
1. Less than high school
2. High school graduate
3. Some college/vocational or technical school (including Associate’s degree)
4. College graduate (Bachelor’s degree)
5. Some graduate school
6. Post graduate degree
97 REFUSED

HPwES: Unregulated Fuels Impact Evaluation Report Appendix D
43
D2. Please stop me when I read the range that contains the total combined income of all members of
your household for 2014. [READ LIST, RECORD ONE]
1. Less than $25,000
2. $25,000 to less than $50,000
3. $50,000 to less than $75,000
4. $75,000 to less than $100,000
5. $100,000 to less than $150,000
6. $150,000 to less than $200,000
7. $200,000 or more
96 DON’T KNOW
97 REFUSED
D3. And your gender? [ASK IN WEB VERSION, RECORD IN PHONE VERSION]
1. MALE
2. FEMALE
BILLING HISTORY RELEASE FORM
[IF UNREGFUEL=0, SKIP TO C5, OTHERWISE, READ THE FOLLOWING]
C1. [UNREGFUEL=1] The next step is to sign and mail back the form giving us permission to request
your usage information from your natural gas and electric utilities. We will send you the form in
the mail, or you may download it from the Internet.
[IF NEEDED: Your usage information will be used to estimate the savings from Home
Performance efficiency upgrades. Your usage information will be kept confidential. IF MORE
IS NEEDED: Only the aggregated results of the analysis will be made available to the public.]
May I confirm your name, mailing address and e-mail? We have your name as …
[NAME]
RECORD NAME CORRECTIONS: __________________________
[ADDRESS]
RECORD MAILING ADDRESS CORRECTIONS: _________________________

HPwES: Unregulated Fuels Impact Evaluation Report Appendix D
44
[EMAIL]
RECORD EMAIL CORRECTIONS: __________________________________
C2. [UNREGFUEL=1] If you would prefer to download the form, it is available at XXX. Would you
like us to mail or e-mail you the permission form?
1. MAIL
2. E-MAIL
3. NEITHER, WILL DOWNLOAD
C5. Is there anything else you would like to tell us about the Home Performance Program?
1. [RECORD VERBATIM]
97. REFUSED
C6. That is all of the questions I have for you today. We may be conducting a follow-up survey in the
next three to four months. Would you be willing to participate?
1. YES
2. NO
97. REFUSED
Please return your billing history release form as soon as possible. Thank you again for your assistance
with this study.

HPwES: Unregulated Fuels Impact Evaluation Report Appendix E
45
APPENDIX E: SURVEY RESULTS MEMO
DATE: November 4, 2015
TO: Judeen Bryne, Tracey DeSimone, NYSERDA
FROM: Kathryn Parlin, Rumbi Vushe, Lucas Sanford-Long, West Hill Energy and Computing
RE: Draft Results from the Survey of Home Performance with ENERGY STAR® Program Participants
with Unregulated Fuel Savings, Program Years 2011-2013
1 INTRODUCTION
The Home Performance with ENERGY STAR® Program (HPwES or “Program”) encourages
homeowners to implement energy efficiency improvements that will reduce costs and energy use. The
program offers comprehensive free or reduced-cost energy audits conducted by a Building Performance
Institute (BPI) certified contractor and financial assistance to help qualifying homeowners make energy
efficiency upgrades. Audit recipients may choose the HPwES contractor to install recommended
measures through the Program or install efficiency measures on their own. Homeowners who participate
in the Program are eligible for incentives and the savings for these projects are tracked and reported under
the HPwES Program. A substantial proportion of HPwES participants use unregulated fuels such as
fuel oil, propane, kerosene or wood as their primary heating source.
This impact evaluation was designed to verify the savings achieved by the Home Performance with
ENERGY STAR® Program (HPwES or “Program”) in homes using unregulated fuels for heating.
Several previous impact evaluations have estimated the verified natural gas and electric savings, as billing
records can be more easily obtained from these regulated utilities.
This impact evaluation has three major components:
1. A survey of participating homeowners to a) verify installation, b) identify all fossil fuel dealer(s)
used during the analysis period and c) collect information about household characteristics to
inform the billing analysis
2. Collection of the billing records from the fossil fuel dealers
3. Billing analysis
This memo addresses the results of the participant survey. The remaining sections of this memo provide a
brief description of the program, an overview of methods, results, and conclusions.
2 PROGRAM DESCRIPTION AND ACTIVITY
The Home Performance with ENERGY STAR® Program (HPwES or “Program”) encourages home and
building owners and tenants of existing one- to four-family homes and small low rise buildings to
implement comprehensive energy efficiency-related improvements. Improvements and technologies are
installed by a participating contractor with at least one employee accredited by the Building
Performance Institute (BPI). Eligible measures include building shell measures, such as air sealing and
insulation; efficient appliances, such as ENERGY STAR refrigerators; heating measures, such as
boilers and furnaces; cooling measures, such as ENERGY STAR room or central air conditioners;
water conservation measures; domestic hot water improvements; efficient lighting; and certain
renewable energy technologies.

HPwES: Unregulated Fuels Impact Evaluation Report Appendix E
46
The HPwES Program also offers enhanced assistance to low- to moderate-income households. The
“Assisted” component of the HPwES Program is available to residents with up to 80% of area or state
median income, whichever is higher.
A wide range of energy efficiency measures are installed through the Program, from screw-in CFLs and
replacement refrigerators to insulation and heating system replacements. While the vast majority of
measures have net energy savings, specific measures sometimes result in savings from one fuel and
additional use of another fuel. This situation occurs due to measures that are designed to shift energy use
from one fuel to another and from some measures that are primarily designed to save one fuel, but may
cause an increase in consumption of another fuel.
Program tracking by measure is highly detailed and both savings and extra use (which occasionally
results when measures switch energy use between two fuel types, such as replacing electric baseboard
heat with a natural gas boiler) are recorded for each fuel type.
Table A below shows that a large proportion of households that participated in the survey installed
envelope measures (insulation and air sealing). Figure 1 shows that over 90% of the Program reported
unregulated fuel savings were associated with heating system repair or replacement, air sealing and
insulation measures.
Table A: Measure Installations
Measure Description Number of Respondents1 Percentage of Respondents1
Insulation 953 79%
Air sealing 938 78%
Windows or doors 85 7%
Heating System 492 41%
Programmable thermostat 273 23%
Water heater 286 24%
Hot water conservation measures 160 13%
Total Respondents1 1,201
1 The total number of respondents reflects the unique number of households that installed any of the measures. The columns do not add to total as
some participants installed multiple measures.
Figure 1: Program Reported Unregulated Fuels Savings by End Use

HPwES: Unregulated Fuels Impact Evaluation Report Appendix E
47
3 METHODS
This section describes the methods used in the survey analysis. It covers the sample frame, survey
fielding, and eligibility for the billing analysis and release form collection.
3.1 SAMPLE FRAME
The sample frame consisted of homeowners who installed measures through the HPwES Program during
the period of January 2011 through December 2013 and met the following criteria:
1. Used an unregulated fuel as a primary or secondary heating source during the pre-installation
period; participants who switched to natural gas through the Program were included, as well as
those who used unregulated fuels in both the pre- and post-periods
2. Had total savings from fuel oil, propane, and kerosene greater than 10 MMBtu; ten MMBtu was
chosen as a cutoff as it represents approximately 10% of an average household’s fuel
consumption, a large enough impact to be identified in the billing analysis17
3. Had at least one phone number in the program database.
The projects were combined by site ID as some homes had more than one project during the analysis
period. This resulted in a sample frame with 4,953 sites.
3.2 SURVEY FIELDING
The survey was fielded in two parts. First, a Web-based survey of participants was fielded by Abt/SBRI
between March 31st 2015 and May 11th 2015. Follow up telephone surveys were conducted with those
participants who did not respond to the Web survey. Utility release forms to collect fuel dealer data were
sent to all respondents who completed the survey. No incentives were offered for completing the survey
or returning the signed release form. The survey disposition is shown in Table B.
Table B: Survey Disposition
Description Number of Respondents Percent of Respondents
Total Sample Frame Provided to Abt 4,953
Used Sample Frame1 2,025 100%
Excluded Sample Not working/Unusable number 87 4%
Not contacted Respondent never available/call back 446 23%
Unknown Eligibility No Answer/Busy 105 5%
Not Eligible Not Eligible/Not Qualified 16 1%
Refused/Break Off 170 8%
Completed Interview 1,201 59%
Contact Rate 76%a
Cooperation Rate 88%b
Response Rate 63%c 1 Abt only needed to use a portion of the total sample frame to obtain the required 1,200 completes.
a Contact rate = (Completes+refusals+break-offs)/(Completes+refusals+break-offs+not contacted) b Cooperation rate = Completes/(Completes+refusals+breakoffs)
c Response rate = Completes/[Completes+refusals+breakoffs+not contacted+ (e*(unknown eligibility))]. For this study e =.00881
17The previous billing analyses show that the average heating consumption for HPwES participants with natural gas is about 100
MMBtu per year. (Memorandum of February 4, 2014 from the ERS Impact Evaluation Team to NYSERDA detailing the results
of the HPwES Phase I evaluation, Table 1.)

HPwES: Unregulated Fuels Impact Evaluation Report Appendix E
48
Due to an error in the skip pattern, a number of participants who responded through the Web survey did
not answer the questions on heating system controls, hot water use and occupancy. A follow up survey
was done for these participants to collect the missing information, but not all participants responded.
Consequently, 341(28%) of the 1,201 respondents who qualified for billing analysis do not have
responses to those questions. This information is helpful but not necessary for the billing analysis.
A copy of the survey instrument is included as Attachment A.
3.3 ELIGIBILITY FOR THE BILLING ANALYSIS
The sample frame consisted of homeowners who were identified in the program database as having
unregulated fuel savings. Respondents were asked to identify their primary heating fuel before and after
completing the energy efficiency upgrades. Some survey respondents did not identify an unregulated
fuel. Since there was a discrepancy between program records and survey responses, the number of
households eligible for billing analysis will be determined by the returned permission forms. For the
purposes of this evaluation, unregulated fuels were defined as bulk delivered fossil fuels that include fuel
oil, wood pellets, propane and kerosene.
The results of this survey analysis are based on all respondents who participated in the survey. Of the
1,201 homeowners who participated in the survey, 93% (1,112) reported using an unregulated fuel as the
primary heating source during the pre-installation period. Out of the remaining 89 respondents, 57% (51)
used wood, 27% (24) used either electric or natural gas and the rest reported using coal or provided
invalid responses.
3.4 RELEASE FORMS
The actual contract for the work is between the customer and the contractor, however, as part of the
contracting process, the participants sign a release form18 allowing NYSERDA to request billing records
from their fuel dealers. However, participants may change fuel dealers over time and/or use multiple fuel
dealers; in these cases, one or more fuel dealers may not be listed on the release form and a new release
form needs to be obtained.
Consequently, participants needed to be contacted to verify their fuel dealers and ascertain whether an
additional release form is needed, the first step in the evaluation was a screener survey. The screener
survey was designed to meet the following objectives:
1. Confirm fuel dealer in program records and identify respondents with more than one fuel dealer
2. Obtain name(s) of fuel dealers used but not identified in program records
3. Identify respondents who need to sign an additional release form
4. Confirm measure installations
5. Obtain additional details about heating use and pattern of fuel deliveries to inform the billing
analysis
The Impact Evaluation team is currently contacting the fuel dealers to request the billing records.
3.5 MOTIVATIONS FOR PARTICIPATING
The survey included three open ended questions (below) to investigate the reasons for participating and
barriers to participation:
18 The program implementer, Conservations Services Group (CSG), collects and maintains these release forms. CSG is under
contract with NYSERDA to deliver the HPwES Program.

HPwES: Unregulated Fuels Impact Evaluation Report Appendix E
49
1. Please tell me in your own words why you participated in the Home Performance with Energy
Star Program.
2. Thinking back to before your Home Performance audit, can you tell me why you decided to
request the audit and install the efficiency upgrades?
3. What prevented you from taking action earlier?
These inquiries allow respondents to explain the motivations and barriers to participation in their own
words, and provides insights into participant behavior that may be helpful for future program design. In
this evaluation, the questions were open ended and responses were not restricted. As part of the survey
analysis, the responses were reviewed and coded. The first two questions were analyzed together, as the
answers were often similar.
4 RESULTS
The primary goals of the survey was to identify a) all of the fuel dealers used by respondents during the
analysis period and b) those respondents requiring an additional release form to collect billing records.
The secondary objective was to collect additional information on household characteristics for the billing
analysis. The first part of the results section covers the number of fuel dealers and progress in collecting
the release forms. The subsequent sections provide information on patterns of household fuel use.
4.1 FUEL DEALERS AND RELEASE FORMS
Both NYSERDA and the fuel dealers require written permission from the HPwES participants prior to
requesting billing records. As part of program implementation, all participants sign a release form listing
their fuel dealer(s). If one or more fuel dealers used during the analysis period were not listed on the
release form collected by the Program or the fuel dealer was missing in the program records, additional
efforts are required to collect an updated form.
The number of fuel dealers used provides an indicator of whether an updated release form is necessary
and also gives a sense of the level of difficulty of obtaining complete fuel records for the home. Survey
respondents were asked the number of fuel dealers they used during the analysis period and whether the
program records correctly identified their fuel dealer. Respondents were asked to confirm the fuel dealer
listed in the program records. Table C shows the percentage of respondents that reported having one or
more fuel dealers over the analysis period.
Table C: Number of Fuel Dealers per Respondent
Number of Fuel Dealers Number of Respondents Percent of Respondents
One 798 66%
Two 276 23%
Three 61 5%
More than 3 28 2%
Don’t know 38 3%
Total Respondents 1,201
As of October 9, 2015, there are usable forms for 844 respondents and complete billing data has been
received for 327. The original goal was to have 200 homes in the final model, which will most likely
require collecting billing data for about 400 respondents as 40% to 50% is typically eliminated in the data
cleaning process. The Impact Evaluation Team is currently collecting additional billing data and entering
and reviewing the billing data already received. Even under the worst case scenario of 327 respondents
with billing data, it is likely that the final model will have about 160 homes, which should be sufficient to
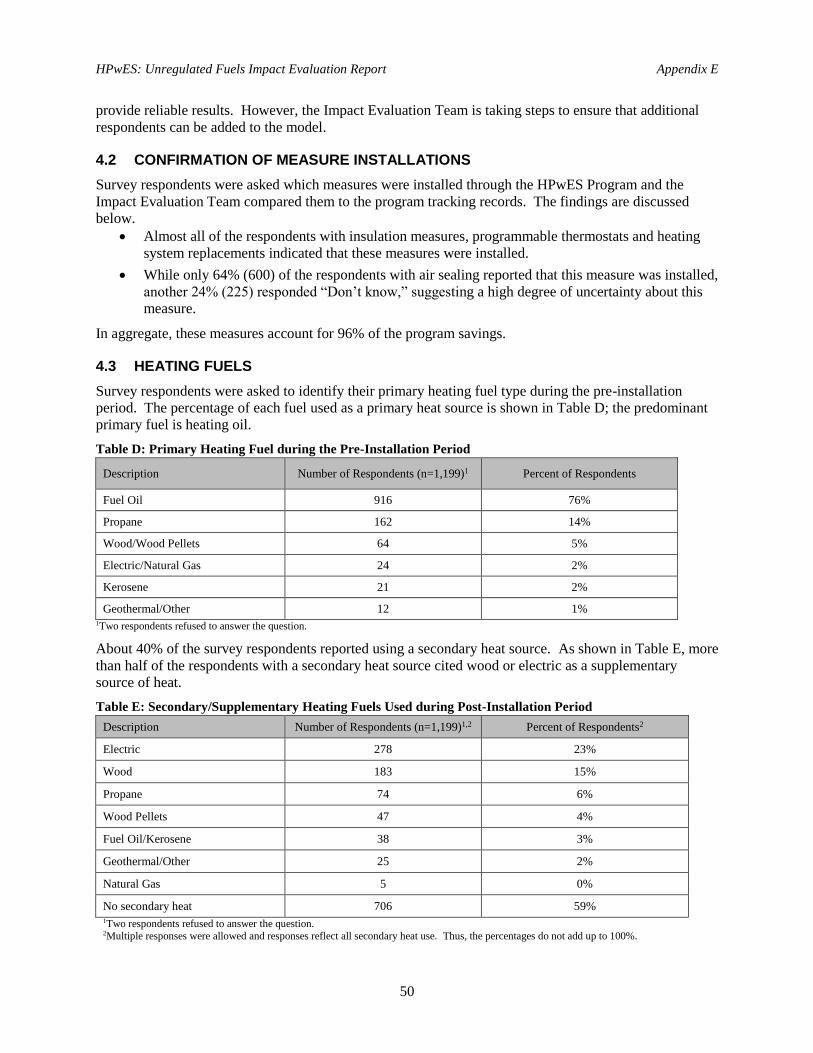
HPwES: Unregulated Fuels Impact Evaluation Report Appendix E
50
provide reliable results. However, the Impact Evaluation Team is taking steps to ensure that additional
respondents can be added to the model.
4.2 CONFIRMATION OF MEASURE INSTALLATIONS
Survey respondents were asked which measures were installed through the HPwES Program and the
Impact Evaluation Team compared them to the program tracking records. The findings are discussed
below.
Almost all of the respondents with insulation measures, programmable thermostats and heating
system replacements indicated that these measures were installed.
While only 64% (600) of the respondents with air sealing reported that this measure was installed,
another 24% (225) responded “Don’t know,” suggesting a high degree of uncertainty about this
measure.
In aggregate, these measures account for 96% of the program savings.
4.3 HEATING FUELS
Survey respondents were asked to identify their primary heating fuel type during the pre-installation
period. The percentage of each fuel used as a primary heat source is shown in Table D; the predominant
primary fuel is heating oil.
Table D: Primary Heating Fuel during the Pre-Installation Period
Description Number of Respondents (n=1,199)1 Percent of Respondents
Fuel Oil 916 76%
Propane 162 14%
Wood/Wood Pellets 64 5%
Electric/Natural Gas 24 2%
Kerosene 21 2%
Geothermal/Other 12 1% 1Two respondents refused to answer the question.
About 40% of the survey respondents reported using a secondary heat source. As shown in Table E, more
than half of the respondents with a secondary heat source cited wood or electric as a supplementary
source of heat.
Table E: Secondary/Supplementary Heating Fuels Used during Post-Installation Period
Description Number of Respondents (n=1,199)1,2 Percent of Respondents2
Electric 278 23%
Wood 183 15%
Propane 74 6%
Wood Pellets 47 4%
Fuel Oil/Kerosene 38 3%
Geothermal/Other 25 2%
Natural Gas 5 0%
No secondary heat 706 59% 1Two respondents refused to answer the question. 2Multiple responses were allowed and responses reflect all secondary heat use. Thus, the percentages do not add up to 100%.

HPwES: Unregulated Fuels Impact Evaluation Report Appendix E
51
4.4 FUEL SWITCHES
Fuel switching involves replacing one fuel with another. NYSERDA’s HPwES Program offers a variety
of options, including switching from one unregulated fuel to another unregulated fuel.
The purpose of the billing analysis is to verify the magnitude of the savings in participating homes using
unregulated fuels. When fuel switching is recommended through the Program, the unregulated fuel
savings are the amount of fuel that is replaced by another source. Thus, it is possible to include homes
that used an unregulated fuel in the pre-installation period, even if they switched to a regulated fuel in the
post-installation period. For those participants who switched from one unregulated fuel to a different
unregulated fuel, it may be possible to verify both the savings from the initial, replaced fuel and extra use
of the new fuel.
The survey included questions about pre-installation and post-installation primary heating fuel; Table F
and the below bullets provide specifics on the fuel switching for primary space heat. Four hundred and
thirty-eight (438) respondents changed their heating fuel in the post-installation period:
49% (216) switched from fuel oil to natural gas.
9% (38) switched from an unregulated heating fuel to electric heat, primarily heat pumps.
Overall, 60% (263) of the 438 respondents switched from an unregulated to a regulated fuel
(mostly natural gas) while the rest switched from one unregulated fuel to another.
Table F: Fuel Switching for Primary Space Heat
Pre-Installation Fuel Number of Homes with Fuel
Switches
Number of Homes
Switched to a Regulated
Fuel
Number of Homes Switched to
Another Unregulated Fuel
Fuel Oil/Kerosene 350 240 110
Wood/Wood Pellets 46 4 42
Propane 28 17 11
Electric 12 2 10
Natural Gas 2 0 2
Total Respondents 438 263 175
4.5 FUEL DELIVERY METHODS
A critical part of the billing analysis is determining how much fuel was used during a specific period of
time. To interpret the billing records, the Impact Evaluation Team needs to understand the frequency of
deliveries and whether the tank was filled at the time of delivery.19 The participant survey provided the
opportunity to assess how often the fuel tanks are filled and whether they are filled to capacity.
The results outlined in Table G, shows that 64% (611) have fuel deliveries once a month or every two
months.20 About 23% (221) of the respondents receive deliveries on an as needed basis.
19 The requests to the fuel dealers explicitly list whether or not the tank was filled for each delivery.
20 The question was asked assuming that the fuel delivery method was consistent over the analysis period. However, it was
confusing to respondents who switched fuels. Some of these respondents provided the answer for their previous, unregulated
fuel, and others simply said that they were currently using natural gas, electric or geothermal.
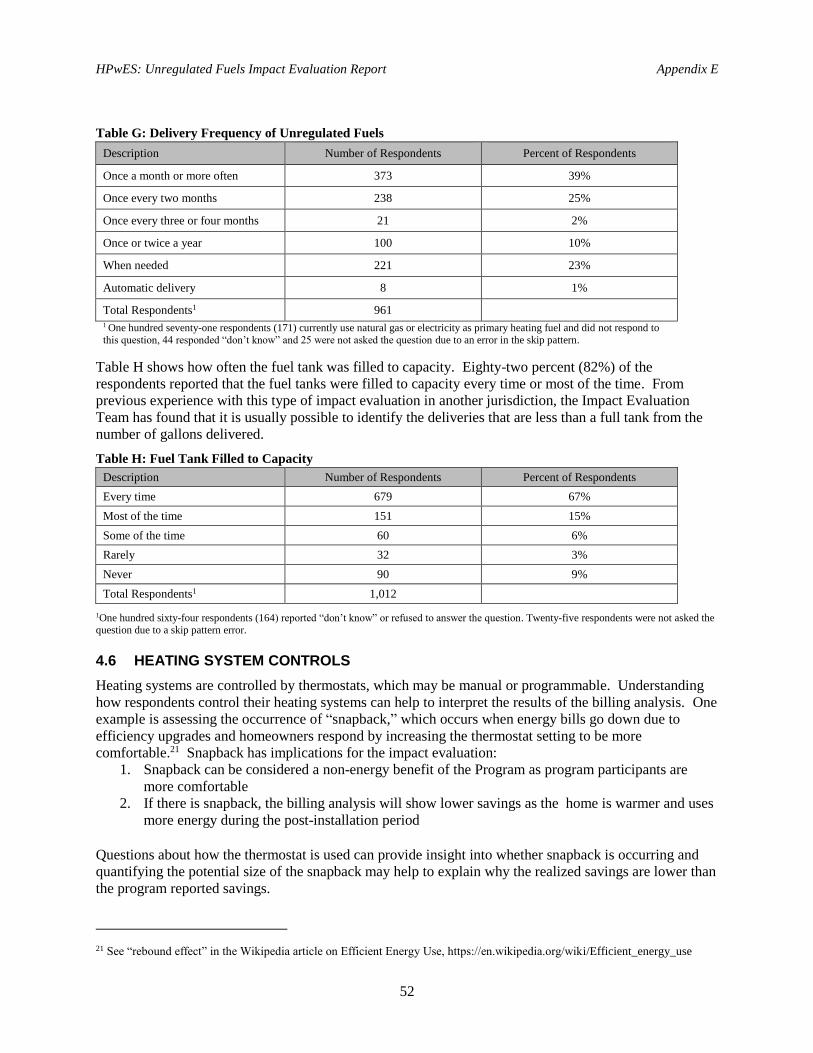
HPwES: Unregulated Fuels Impact Evaluation Report Appendix E
52
Table G: Delivery Frequency of Unregulated Fuels
Description Number of Respondents Percent of Respondents
Once a month or more often 373 39%
Once every two months 238 25%
Once every three or four months 21 2%
Once or twice a year 100 10%
When needed 221 23%
Automatic delivery 8 1%
Total Respondents1 961 1 One hundred seventy-one respondents (171) currently use natural gas or electricity as primary heating fuel and did not respond to
this question, 44 responded “don’t know” and 25 were not asked the question due to an error in the skip pattern.
Table H shows how often the fuel tank was filled to capacity. Eighty-two percent (82%) of the
respondents reported that the fuel tanks were filled to capacity every time or most of the time. From
previous experience with this type of impact evaluation in another jurisdiction, the Impact Evaluation
Team has found that it is usually possible to identify the deliveries that are less than a full tank from the
number of gallons delivered.
Table H: Fuel Tank Filled to Capacity
Description Number of Respondents Percent of Respondents
Every time 679 67%
Most of the time 151 15%
Some of the time 60 6%
Rarely 32 3%
Never 90 9%
Total Respondents1 1,012
1One hundred sixty-four respondents (164) reported “don’t know” or refused to answer the question. Twenty-five respondents were not asked the question due to a skip pattern error.
4.6 HEATING SYSTEM CONTROLS
Heating systems are controlled by thermostats, which may be manual or programmable. Understanding
how respondents control their heating systems can help to interpret the results of the billing analysis. One
example is assessing the occurrence of “snapback,” which occurs when energy bills go down due to
efficiency upgrades and homeowners respond by increasing the thermostat setting to be more
comfortable.21 Snapback has implications for the impact evaluation:
1. Snapback can be considered a non-energy benefit of the Program as program participants are
more comfortable
2. If there is snapback, the billing analysis will show lower savings as the home is warmer and uses
more energy during the post-installation period
Questions about how the thermostat is used can provide insight into whether snapback is occurring and
quantifying the potential size of the snapback may help to explain why the realized savings are lower than
the program reported savings.
21 See “rebound effect” in the Wikipedia article on Efficient Energy Use, https://en.wikipedia.org/wiki/Efficient_energy_use
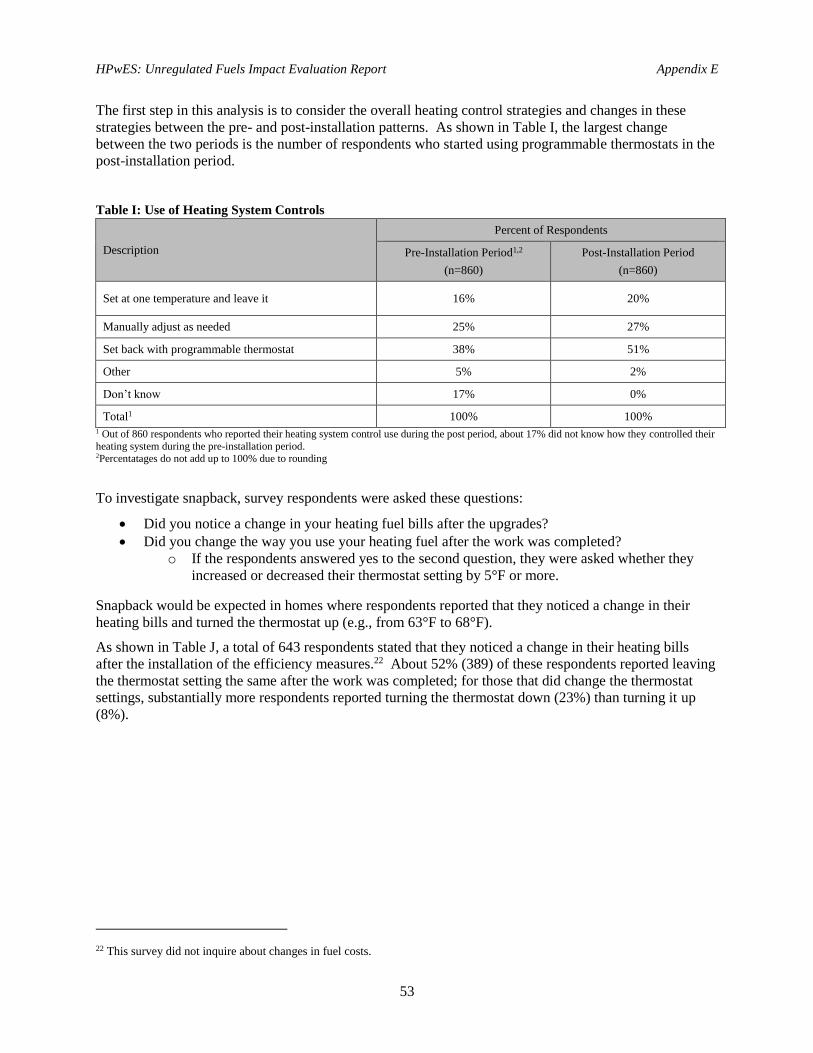
HPwES: Unregulated Fuels Impact Evaluation Report Appendix E
53
The first step in this analysis is to consider the overall heating control strategies and changes in these
strategies between the pre- and post-installation patterns. As shown in Table I, the largest change
between the two periods is the number of respondents who started using programmable thermostats in the
post-installation period.
Table I: Use of Heating System Controls
Description
Percent of Respondents
Pre-Installation Period1,2
(n=860)
Post-Installation Period
(n=860)
Set at one temperature and leave it 16% 20%
Manually adjust as needed 25% 27%
Set back with programmable thermostat 38% 51%
Other 5% 2%
Don’t know 17% 0%
Total1 100% 100% 1 Out of 860 respondents who reported their heating system control use during the post period, about 17% did not know how they controlled their
heating system during the pre-installation period. 2Percentatages do not add up to 100% due to rounding
To investigate snapback, survey respondents were asked these questions:
Did you notice a change in your heating fuel bills after the upgrades?
Did you change the way you use your heating fuel after the work was completed?
o If the respondents answered yes to the second question, they were asked whether they
increased or decreased their thermostat setting by 5°F or more.
Snapback would be expected in homes where respondents reported that they noticed a change in their
heating bills and turned the thermostat up (e.g., from 63°F to 68°F).
As shown in Table J, a total of 643 respondents stated that they noticed a change in their heating bills
after the installation of the efficiency measures.22 About 52% (389) of these respondents reported leaving
the thermostat setting the same after the work was completed; for those that did change the thermostat
settings, substantially more respondents reported turning the thermostat down (23%) than turning it up
(8%).
22 This survey did not inquire about changes in fuel costs.

HPwES: Unregulated Fuels Impact Evaluation Report Appendix E
54
Table J: Changes in Thermostat Use
After the work,
did you notice a
change in heating
bills?
Number of
Respondents
Percent of
Respondents
After the work, did you change
the way you use your heating
fuel?
Number of
Respondents
Percent of
Respondents
Yes 643 85%
Turned thermostat up 57 8%
Turned thermostat down 173 23%
Left thermostat setting the same 389 52%
Don't know 24 3%
No 111 15%
Turned thermostat up 7 1%
Turned thermostat down 15 2%
Left thermostat setting the same 80 11%
Don't know 9 1%
Of the 721 respondents who reported either changing their heating system use in the post-installation
period or leaving it the same, 100 (14%) reported changing the thermostat setting by 5°F or more. Only
3% (20) of respondents reported that they noticed a change in their heating bill and increased their
thermostat setting by 5°F or more. These results suggest that snap back is a rare occurrence.
4.7 WATER HEATING FUEL
Typically, space and water heating equipment are the two largest energy-consuming devices in residential
homes. Space heating use is highly dependent on outside temperature, but water heating consumption
tends to remain relatively constant throughout the year. To interpret the billing records, evaluators need
to know whether the heating fuel is used for both space and water heating, or just one.
About 43% of 942 respondents used the same fuel (oil or propane) for both space and water heating
during the post-installation period. As with space heating, some participants changed the water heating
fuel after participating in the Program, primarily from fuel oil to natural gas.
Figure 2 provides a summary of these results.

HPwES: Unregulated Fuels Impact Evaluation Report Appendix E
55
Figure 2: Water Heating Fuel in the Pre- and Post-Installation Period
4.8 REASONS FOR PARTICIPATING IN THE HOME PERFORMANCE PROGRAM.
This section describes the responses to the open ended questions about motivations for, and barriers to,
participating in HPwES.23 One thousand one hundred and eighty (1,180) respondents provided valid
answers to questions on motivation for participation and 1,104 respondents provided valid responses to
the barriers questions. Motivations are discussed first, followed by barriers.
Motivations
Respondents were asked why they requested the audit and installed measures through HPwES. The key
findings are as follows:
Saving energy and money were the most often cited reasons for participation, with well over half
of the respondents mentioning one of these two reasons.
Over a quarter (315) of the respondents listed improving the comfort of their homes.
About 20% (237) indicated that they participated to take advantage of the free audit and/or the
financial incentives offered by the program.
Another 16% (193) gave reasons that were unrelated to energy use or other program-related
services, such as recently purchasing the home or starting a remodeling project.
The responses are illustrated in Figure 3 below.
23See Section 3.5 for the wording of the questions and preparation for the analysis.

HPwES: Unregulated Fuels Impact Evaluation Report Appendix E
56
Figure 3: Reasons for Participating in HPwES and Installing Measures
Barriers
The survey question asked why respondents did not take action earlier. Concern about paying for the
upgrade was the most commonly cited barrier to taking action to improve the efficiency of the homes,
with 35% (414) of respondents. Non-energy related issues, such as recently purchasing the home or
procrastination, were the second most common, followed closely by lack of information. Only 2% (23)
of respondents indicated that they were concerned about finding a contractor. These results are
summarized in Figure 4.
Figure 4: Barriers to Participating in HPwES and Installing Measures
At the end of the survey, respondents were asked if they would like to provide additional comments on
any aspect of the Program, and about 600 of the 1,201 respondents did so. Approximately 68% (413) of

HPwES: Unregulated Fuels Impact Evaluation Report Appendix E
57
the comments were positive, indicating that the respondents were pleased with the results. About 31%
(190) were negative, expressing dissatisfaction. The primary sources of concern were1) the contractor,
reflecting either poor customer service and/or poor installation quality, and 2) the savings were less than
projected or the project was not worth the cost.
5 CONCLUSIONS
The primary objective of the screener survey was to obtain the release forms for collecting data from the
fuel dealers. From the 1,201 respondents, signed release forms have been collected for 844 and complete
billing records for 327 to date, and data collection efforts are continuing. From previous experience in
other jurisdictions, the original work plan was based on obtaining signed release forms for 1,000
respondents, resulting in receiving fuel bills for about 500 respondents and 200 homes in the final billing
model. While the overall number of participants with signed release forms is lower than expected,
preliminary data collection efforts suggest that contractor cooperation may be higher. Given the 327
participants with billing records to date, it seems likely that there will be at least 160 homes in the billing
analysis, which is likely to be sufficient to obtain reliable results.
The review of household fuel delivery and heating use were reasonably consistent with other, similar
evaluations, suggesting that there will not be any unanticipated barriers to the billing analysis. Over 90%
of the respondents used either one or two fuel dealers during the analysis period, which simplifies the
billing data collection. A large majority of respondents have regular fuel deliveries, and less than half use
the same fuel for space and water heating.
The investigation into motivations for, and barriers to, participation provide insight into the mindset of the
participating homeowners. While the most often-cited reasons for participation were to save energy
and/or money, a smaller but still substantial proportion (20%) wanted to take advantage of the free energy
audit and/or incentives and 10% (118) responded to some type of program promotion (home show,
recommendations from participating contractors or friends). Concerns about money was the primary
barrier, followed by non-energy (or personal) issues and lack of information. Few respondents mentioned
lack of time or finding a contractor.
The response rate for this survey was quite high (63%), suggesting that non-response bias is not likely to
be an issue. The survey provided the key information needed for identifying which respondents need to
sign an updated release form and also for providing an initial assessment of the critical factors affecting
the billing analysis.

58
APPENDIX F: FUEL DEALER DATA COLLECTION DETAILS
As a part of the fuel dealer data collection each fuel dealer was contacted by phone initially to determine
if they were willing to provide the fuel delivery records for the customers who had provided permission
forms. The phone call was followed with a letter (sample below) including the request details if the
dealer was willing to participate. Some reasons data was not provided are included:
Refused to provided data (no reason given)
Only provide data to the customer
No longer had older data
Did not have a customer on record
The program-collected permission forms were too old
Sample Letter/Fax/Email:
July 29, 2015
«Fuel_Dealer_Name»
«Dealer_Address»
«Dealer_Town», «Dealer_State»«Dealer_Zipcode»
Dear «Fuel_Dealer_Name»,
Energy and Resource Solutions (ERS), on behalf of the New York State Energy Research and
Development Authority (NYSERDA), would like to thank you for your willingness to assist in
our evaluation of the Home Performance with ENERGY STAR ® (HPwES) Program. This
program helps New York homeowners implement energy efficiency improvements by
providing energy assessments and assistance with planning, financing, and implementing
energy saving measures. Common measures include air sealing and insulation, heating system
replacement, and ENERGY STAR ® appliances.
The evaluation is designed to measure the savings from these energy efficiency upgrades by
comparing the amount of delivered fuel (adjusted for weather) before and after the installations.
The cooperation of your company and other fuel dealers makes this important research
possible.
At this time we have received consent forms for «Number_of_Customer_Records_Requested»
participants that listed «Fuel_Dealer_Name» as their fuel provider. The customer information
for these participants is outlined in the table below. Please provide all fuel delivery records
available for each customer on the table from the Start Date through the End Date indicated
below.
«Fuel_Dealer_Name»Customer Request
Participant Name Address City Zipcode Fuel Type
Account
Number Start Date End Date

HPwES: Unregulated Fuels Impact Evaluation Report Appendix F
59
In order to be able to use the data in our analysis, it must include at a minimum: delivery date,
quantity delivered, type of fuel, and whether the tank was filled. Please complete and return
the form below with your data to help us interpret your billing system.
Fuel Information Requested Where to find this in delivery records
Delivery date
Fuel type
Amount & Unit of fuel (gallons, etc.)
Was the tank filled?
Attached to this letter you will find copies of the signed participant consent forms for each
customer. NYSERDA’s analysis will not identify individual participants, and the information
provided will be kept confidential to the extent permitted by law.
Fuel records can be returned by the following methods:
Email: [email protected]
Mail: Energy and Resource Solutions
120 Water Street, Suite 350
North Andover, MA 01845
Attn: Ari Michelson
Fax: 978-521-4588
Should you have any questions about this study, please feel free to contact Tracey DeSimone at
NYSERDA, 518-962-1090 ext. 3452 or [email protected]. Specific questions about
this request can be directed to Ari Michelson at ERS, [email protected] or 978-332-5826.
Sincerely,
Ari Michelson
ERS Project Manager

60
APPENDIX G: SOURCES OF UNCERTAINTY
The two major sources of uncertainty, i.e., the presence of secondary heating fuels and variable
balance points, are discussed in more detail below.
Secondary Heating Fuels
Almost half of the homes in the analysis (87 of the 207) self-identified as having a secondary heat
source in the survey. The use of a secondary fuel causes uncertainty because a change in the use
of the secondary fuel can result in an apparent increase or decrease in use that would be attributed
to the program. In particular, the use of secondary heating sources like wood or wood pellets can
vary based on the difference in cost between wood and oil or propane and/or winter temperatures.
During the survey, respondents were asked about changes in fuel use, and 31 (15% of homes in
the model) identified some change in use. However, many respondents appeared to report
changes in fuel use due to the Program, e.g., eight reported changing their use due to a fuel switch
and 6 reported a decrease in the use of all fuels. These responses indicates that most homeowners
did not report a change in the use of secondary fuels.
When compared to the overall realization rate, the homes with a secondary fuel have a slightly
lower realization rate (56% vs 60%) that the program overall. This small difference indicates
secondary fuel use is unlikely to have much of an impact on the RR.
Variable Balance Points
The balance point of a home is the outside temperature at which the heating system turns on.
Thermostat settings and internal gains are contributing factors and the balance point often varies
from homes. A pooled billing analysis, however, often treats all homes as if they have the same
balance point.
As this analysis was based on conducting house-by-house regressions, there was the potential to
model each home with a different balance point. Accordingly, the regression was run for each
project using a HDD base of 55, 60, 65 and 70. The the fits of the regression were compared to
determine the appropriate HDD base temperature and regression to use for the calculation of
savings.
This analysis showed that the HDD base temperature with the highest R2 did not necessarily
relate to the model with the most reasonable estimates, e.g., for many homes using the same fuel
for water and space heating, the “best” model resulted in a negative intercept suggesting that there
was no base (water heating) use. In addition, the R2 values varied by only a few percent and the

HPwES: Unregulated Fuels Impact Evaluation Report Appendix G
61
“best” model tended to be either 70°F or 55°F. The models using 60°F or 65°F generally had
more reasonable base use in the intercept models, with fewer negative intercepts or very high
intercepts.
Ultimately, the HDD base 60°F was used for all homes in the analysis. A sensitivity analysis was
done by calculating the savings using other HDD base temperatures. The realization rate using
difference base temperatures ranged from 59% to 61%, which bracket the 60% RR using a base
temperature of 60°F. This indicates that the different base temperatures did not have a large
impact on the overall results. The Impact Evaluation Team is most confident in the individual
regressions using the base temperature of 60°F.
Top Related