


Languages
Pages
Legal


__________________________
Matthew Potts
University of Bristol Faculty of Engineering
Queen's Building, University Walk, Bristol, BS8 1TR, U.K
Pia Sartor
University of Bristol Faculty of Engineering
Queen's Building, University Walk, Bristol, BS8 1TR, U.K
Angus Johnson
Thales Research and Technology UK
Thales Research and Technology, Worton Grange, Reading, RG2 0SB, U.K
Seth Bullock
University of Bristol Faculty of Engineering
Merchant Venturers Building, 75 Woodland Road, Bristol, BS8 1UB, U.K
Hidden Structures: Using Graph Theory to
Explore Complex System of Systems
Architectures
Matthew Potts, Pia Sartor, Angus Johnson and Seth Bullock
Abstract The increasing interconnectivity of complex engineered system of systems
(SoS) leads to difficulties ensuring systems architectures are of sufficient quality (avail-
ability, maintainability, reliability, etc.). Typically reductionist approaches are used
during systems architecting which may fail to provide the desired insights into key re-
lationships and behaviors. New approaches are therefore needed and this work shows
how tools from complexity science can be applied. Data from a NATO Architecture
Framework complex SoS architecture, based on a Search and Rescue Use Case, is mod-
elled using graph theory. The analysis includes degree distribution, density, connected
components and modularity. Such analysis supports architectural decision making such
as dependency allocation, boundary identification, areas of focus and selection between
architectures. It is shown how the analysis from complexity science can be used to an-
alyze complex SoS architectures, to provide an alternative view, that explores relation-
ships and structure in a non-reductionist, general approach when considering architec-
ture decisions.

2
1 Introduction
Large defense and space organizations are often faced with the challenge of designing
a System of Systems (SoS) or a system that will operate within the context of a SoS. A
SoS can be defined as “an assemblage of components with Operational and Managerial
Independence”[1], a “set of systems for a task that none of the systems can accomplish
on its own”[2] and may have key characteristics of “autonomy, belonging, connectivity,
diversity and emergence”[3] where emergence here is “the principle that entities exhibit
properties which are meaningful only when attributed to the whole, not to its parts”[4].
At the start of the Systems Development Process[5] some requirements may exist and
a system architecture, the “fundamental concepts/properties of a system, embodies in
elements, relationships, and principles of design”[6] is needed to assist understanding
context, exploration of alternatives, understand trades and support decision making[7].
Such systems are increasingly likely to be complex[8]; formed of many heavily inter-
connected components whose behavior is emergent and cannot simply be inferred from
the behavior of components[9].
Systems architecture methodologies, such as the NATO Architecture Framework
(NAF)[10] provide practitioners with many tools, techniques and views to explore dif-
ferent perspectives of a system in order to create some shared understanding and sup-
port decision making. For example, system architecture methodologies can support in-
vestment decisions such as whether to bid for a particular project, or design decisions
that will affect the subsequent system, sub-system and component design. The NAF v4
methodology is currently under development but is “likely to be based on The Open
Group Architecture Framework (TOGAF) Architecture Development Method (ADM)
with input from other sources”[10]. The ADM [11] proposes an iterative eight step
approach to developing systems architectures. An architecture team uses the methodol-
ogy to build a shared understanding within the team of the problem space and guides
thinking towards a viable solution space through the creation of several Architecture
Views (AVs) along several perspectives and considerations, shown in Fig. 1.

3
Fig. 1. NAF v4 Viewpoints and example AVs.
The concern with this approach however is that when constructing AVs several heu-
ristics are used which are appear in conflict with complex systems approaches, for ex-
ample reductionism and aggregation. The original work of Rechtin[12] and recent up-
dates from Sillitto[13], suggests a practitioner should ‘simplify, simplify, simplify’. For
complex SoS such reductionist approaches may mask the underlying structures and re-
lationships that are important for understanding and characterizing the SoS. New ap-
proaches are therefore needed.
A potential solution resides in bringing complexity science to bear on systems engi-
neering, with the path initially laid out in the work of Sheard[14] and Bolton[15].
Sheard’s[16] more recent Complexity Primer serves as a good background to this line
of inquiry. Structural assessments of system architectures are not new, with work by
Sinha and de Weck[17] exploring complexity assessments of topologies. However such
work is based on systems architectures that are not as broad as system architectures in
the context of Architecture Frameworks, such as NAF.
More recently Harrison[18] explored the potential use of Graph Theory for Systems
Engineering, specifically looking at a system design and calculating throughput, meas-
uring complexity and trying to optimize design. While throughput may be an interesting
property for some systems, its utility for systems that have no clear sink or source is
perhaps limited. The design optimization approach and complexity measuring ap-
proaches are potentially interesting avenues of investigation however this paper seeks
to build an abstraction of a complex SoS architecture from AVs, as opposed to the
abstraction used by Harrison, and investigate the utility of complexity science tools
from that starting point.
This paper proposes a new methodology to explore the underling structure and rela-
tionships of complex System of Systems (SoS) architectures in order to support shared
understanding and decision making. This research seeks to build on previous work,
remaining aligned to the same thinking, but starting from a perspective of complex SoS
architectures and Architecture Frameworks such as NAF. This work seeks to provide

4
an additional view, coherent with SoS engineering approaches like that of Luzeaux[19]
and current systems architecting methodologies,.
A fictitious Search and Rescue Architecture, created to help refine NAF v4, is used
to create a directed graph (digraph) which is then visualized and analyzed. The analysis
includes degree distribution, density, strongly connected components and modularity.
Such analysis supports architectural decision making, such as dependency allocation,
boundary identification, areas of focus and support selection between architectures.
The approach suggests that complexity science tools, namely graph theory, can start
to visualize, understand and explore the hidden structure and relationships of complex
SoS architectures. A discussion on the utility of such an approach is presented noting
that the exploitation of this as a robust tool within industry requires careful considera-
tion and further work is proposed to drive this forward.
2 Search and Rescue Architecture
This research took data from a Search and Rescue Architecture that was developed by
Thales in order to inform systems architecture training and help the development of
NAF v4. The system is based on a real life complex SoS, having the key characteristics
detailed in Table 1, making it a useful use case for tangible products, having also been
used by others to develop systems architecture analysis[20,21].
Table 1. SAR Characterization.
Key term Important characteristics from
definition
SAR SoS characteristics
System
of Sys-
tems
(SoS)
An assemblage of
components with Op-
erational and Mana-
gerial Independence.
Each constituent system is a system in
their own right with their own manage-
ment and operations, brought together
for a common purpose.
A set of systems for a
task that none of the
systems can accom-
plish its own
Although aspects of SAR could be
conducted by individual systems, a full
maritime SAR capability relies on the
overall SoS availability.
Autonomy, belong-
ing, connectivity, di-
versity and emer-
gence.
Each system can operate autono-
mously without the SoS, connectivity
is open when systems join and have a
range of communications and opera-
tions available to them. The systems
are diverse, emergence[4] is the ability
of the SoS to effectively coordinate a
search operation over a large area for a
small, moving object and recover it
with precision and speed to a place of

5
The Search and Rescue SoS seeks to detect distressed persons or vessels and recover
them to a place of safety in a maritime context. The SoS comprises many entities in-
cluding rotary and fixed wing air assets with modules fitted such as sensors and recov-
ery equipment, fast and slow maritime vessels, a plethora of personnel, command and
control communications and information services and several agencies from procure-
ment, training delivery, administration and execution, shown in Fig. 2.
Fig. 2. High Level Operational Concept Diagram Search and Rescue [22].
In the use case views can be taken from the fictitious “Yellow” country, which is part
of a wider fictitious “Rainbow” international organization, or from commercial entities
that may wish to bid for aspects of a program to enhance the capability. In either case,
in order to build a shared understanding of the SoS an architecture is produced in ac-
cordance with NAF v4. A potential limitation of this approach however is that it re-
quires the team to keep several of these views in mind at one time to attempt to make
sense of the whole, although some views exist to provide high level context, NAF does
safety. The individual parts of the SoS
cannot carry this out alone.
Complex
System
System formed of
many interconnected
components; system
has the capacity to
exhibit emergence,
behavior cannot be
simply inferred from
the behavior of com-
ponents.
The many interconnected components
of the SAR SoS come from the myriad
of individual systems within the SoS
and the emergent behavior has already
been considered.
6
not have a view that exposes dependencies across the entire system. Referring back to
Table 1, an approach is sought that explores key relationships and structures of the
system as a whole, something the following approach attempts to address.
3 Results
Graph theory has been used extensively to analyze large complex networks by model-
ling system elements as vertices and the relationships between them as edges, with wide
ranging applications in biology, networks and social science [23-25]. It is assumed the
reader has an understanding of graph theory and basic analysis of graphs. Refer to [23-
25] for further information.
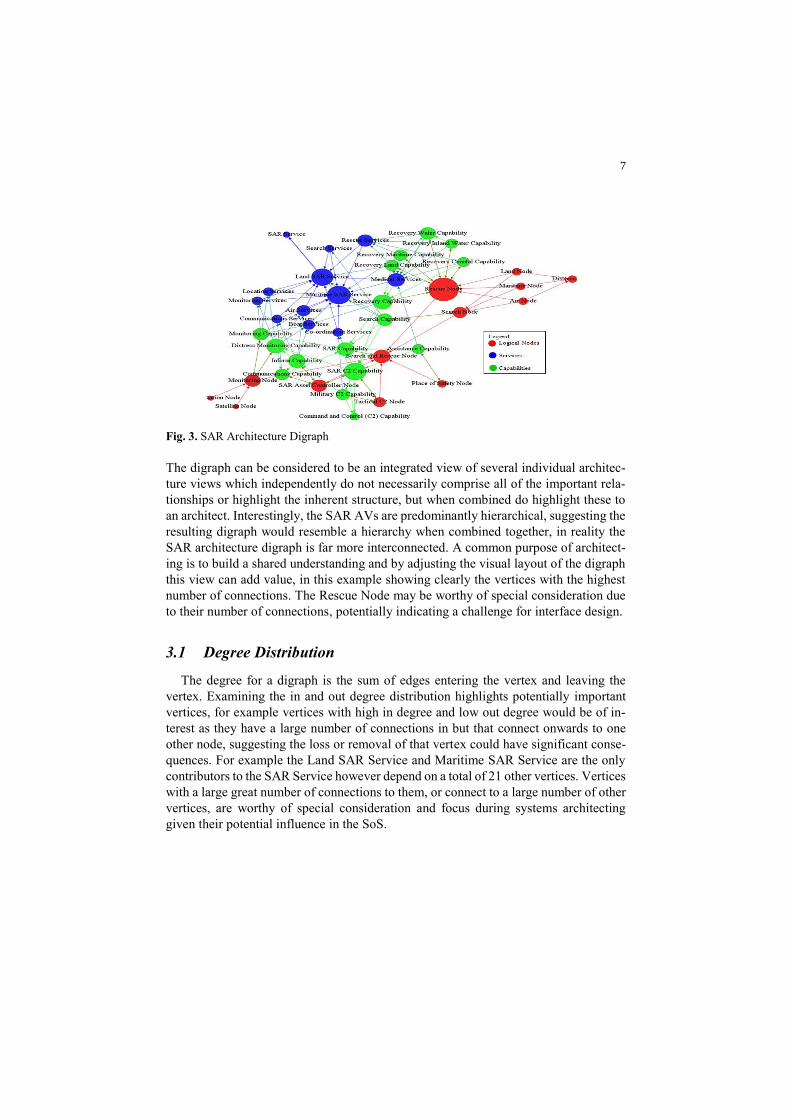
A digraph was constructed using several AVs from the SAR architecture, where ca-
pabilities, services and logical nodes (from logical views in NAF, not to be confused
with nodes from graph theory) were modelled as vertices with relationships between
them modelled as directed edges with no weightings. The ability to visualize the struc-
ture and relationships of the complex SoS architecture is shown below (Fig. 3) with
Logical Nodes (red), Services (blue) and Capabilities (green) and vertices sized by de-
gree, highlighting to an architecture team potential areas to focus on. The digraph was
visualized and analyzed using Gephi[26], a common open source software package.
Several software packages and algorithms offer ways to visualize a graph and a thor-
ough review of these is not provided here, instead the interested reader is pointed to
Tamassia[27]. The initial visualization of a digraph is likely to be in a random layout
but is shown here in a common layout (Yifan Hu Force Directed Layout[28]) with man-
ual adjustment of vertices for readability.
There is no obvious source or sink with this digraph, or edge weights added, so flow
problems cannot be explored. AVs were taken that could be deemed as primary areas
of interest, there is a concern however that the abstraction hides potentially significant
information from view, for example in such a model there is currently no measure of
how important individual relationships or vertices are in their own right. The main focus
of this inquiry however is to explore structure and relationships. For a detailed expla-
nation of individual elements one can return to the NAF views where such detail is
readily available.
7
Fig. 3. SAR Architecture Digraph
The digraph can be considered to be an integrated view of several individual architec-
ture views which independently do not necessarily comprise all of the important rela-
tionships or highlight the inherent structure, but when combined do highlight these to
an architect. Interestingly, the SAR AVs are predominantly hierarchical, suggesting the
resulting digraph would resemble a hierarchy when combined together, in reality the
SAR architecture digraph is far more interconnected. A common purpose of architect-
ing is to build a shared understanding and by adjusting the visual layout of the digraph
this view can add value, in this example showing clearly the vertices with the highest
number of connections. The Rescue Node may be worthy of special consideration due
to their number of connections, potentially indicating a challenge for interface design.
3.1 Degree Distribution
The degree for a digraph is the sum of edges entering the vertex and leaving the
vertex. Examining the in and out degree distribution highlights potentially important
vertices, for example vertices with high in degree and low out degree would be of in-
terest as they have a large number of connections in but that connect onwards to one
other node, suggesting the loss or removal of that vertex could have significant conse-
quences. For example the Land SAR Service and Maritime SAR Service are the only
contributors to the SAR Service however depend on a total of 21 other vertices. Vertices
with a large great number of connections to them, or connect to a large number of other
vertices, are worthy of special consideration and focus during systems architecting
given their potential influence in the SoS.

8
3.2 Density
The density of the digraph is calculated as (1) where E is the number of edges in the
digraph and V is the number of vertices in the digraph. The density is therefore a meas-
ure of how densely connected the digraph is, a value of one corresponding to every
possible connection between vertices being present.
𝐷 = |𝐸|
|𝑉| (|𝑉| − 1) (1)
The density (1) of the SAR architecture digraph is 0.074, with each vertex in the
SAR example only connected to a few other vertices. If the architecture had a great deal
more connections between vertices this value would be higher but for the SAR SoS the
loss of a vertex or an edge could have a large impact on the overall connectivity of the
digraph suggesting its structure may not have much resiliency. Density could help de-
cide between two competing complex SoS architectures, the higher density solution is
likely to have a greater integration, or at least dependency management challenge,
whereas the lower density solution may have less relationships to be concerned with.
Conversely however a lower density digraph structure may not have as much resiliency
to the loss of a connection or vertex.
3.3 Strongly Connected Components
A digraph is considered strongly connected if there is a path (a distinct sequence of
edges connecting vertices[29]) in each direction between each pair of nodes, in other
words if every node is reachable from every other nodes in both directions. This paper
uses Tarjan’s[30] depth-first search algorithm to detect strongly connected compo-
nents; groupings of vertices that meet the above criteria.
By showing the groupings of vertices that can all reach each other it may suggest the
existence of a core and periphery of the digraph. This may assist the overall understand-
ing and characterization of the complex SoS, especially if considering an organization
that is trying to understand where their systems influence in the wider SoS. This may
help identify where to apportion responsibility, boundaries, or internal and external de-
pendencies. The SAR architecture digraph has two separate strongly connected com-
ponents (Fig. 4), the first strongly connected component (left) has 9 vertices all con-
nected (22% of total vertices) while the second Strongly Connected Component (right)
identifies 7 vertices all connected (17% of total vertices).

9
Fig. 4. SAR Architecture Strongly Connected Components
3.4 Modularity
Community detection (the identification of clusters or communities of vertices with
many edges joining vertices of the same cluster or community and comparatively few
between clusters or communities) within graphs remains an ongoing research inquiry,
the interested reader is directed to Fortunato’s[31] work. Modularity is a popular
method and provides a measure of how readily the digraph can be divided into modules,
resulting in groupings of vertices that are more strongly connected then they would be
in a random digraph[32]. This paper utilizes the algorithm of Blondel et al[33] to cal-
culate the modularity of the digraph. Analysis thus far has grouped vertices with similar
quantitative properties whereas modularity groups by similar connections. A visualiza-
tion of the digraph, colored by modules, is shown in Fig. 5. In the SAR example it
appears that the Communication Service, Boat Service, Distress Monitoring Capability,
Inform Capability, Communications Capability and SAR Asset Controller Node could
be considered as one grouping of related aspects (orange vertices). This offers a differ-
ent approach, contrasted with Fig. 3, when considering boundaries for complex SoS
architectures; by focusing on communities of similar nodes in terms of their structure.
Fig. 5. SAR digraph with vertices colored by modularity class.
10
4 Discussion
By modelling a complex SoS architecture as a digraph a vast range of analytical tools
from complexity science become available. The approach enables a visualization of a
structure and relationships that would otherwise remain hidden or rely on the viewer to
construct a model in their head. An architecture team can use this approach to identify
areas to focus attention on and enable partitioning of the system architecture in an al-
ternative way which may assist boundary and dependency allocation.
In the early phases of a project, when an organization is trying to make investment
decisions, such as whether to make bids for aspects of a SoS, this analysis can help
determine influence of different aspects of the SoS. For example, if the “Yellow” coun-
try tendered for part of the SoS that is firmly on the periphery of the SoS, or has many
external system dependencies, it may be of little interest to a commercial organization.
Architectures are created using a blend of art and science, whereas the tools from
graph theory are predominately empirically based, thus caution should be exercised
when making decisions based on empirical values with a small number of architectural
elements. Instead, an approach is recommended that uses the analysis and visualization
from graph theory for specific purposes: to visualize structure, to identify areas of in-
terest, and to temper architecture decisions such as which architecture to choose or in-
vestment appraisals. The proposed methodology cannot be seen as a wholly alternative
approach, rather as a complimentary one to be used in conjunction with traditional
methods to provide a view dedicated to what makes a complex SoS challenging; a per-
spective on underlying structure and relationships.
5 Conclusion and Future Work
This paper has introduced the problem of supporting decision making on complex
SoS architectures. Traditional architecture framework methodologies and system archi-
tecture approaches may not provide sufficient insight into the underlying relationships
and structure of the SoS as they create static views from a single perspective. A SAR
Architecture was introduced and a methodology was described to model this as a di-
graph. This representation allows analysis into the structural properties of the model
and visualization. From this analysis it is suggested that architectural decisions could
be made around boundary selection or investment decisions.
Further work should concentrate on demonstrating the utility of this approach on
different use cases with larger data sets, comparing a complex SoS to a non complex
systems architecture and using different architecture frameworks for the data. The util-
ity of the approach could be improved by the creation of a tool for the extraction of data
from a collection of AVs and automatically conducting analysis, along with determin-
ing which metrics or properties are most valuable.
Although the work does not replace or challenge existing practices, it does suggest
a complimentary view that can be taken when considering complex SoS architectures
by integrating readily available data into a single digraph for analysis. Such analysis
helps highlight important characteristics like structure and relationships which may

11
support decision making however further work is qualify the utility of such an approach
against larger datasets and broader examples.
Acknowledgements
This research was funded by the Engineering and Physical Science Research Council
and Thales under ICASE 16000139. The authors would like to thank Dave Harvey and
Jean-Luc Garnier at Thales who provided valuable insights during this work.
References
1. Maier MW Architecting principles for systems‐of‐systems. In: INCOSE International
Symposium, 1996. vol 1. Wiley Online Library, pp 565-573
2. ISO/IEC/IEEE International Standard - Systems and software engineering -- System life cycle
processes (2015). ISO/IEC/IEEE 15288 First edition 2015-05-15:1-118.
doi:10.1109/IEEESTD.2015.7106435
3. Boardman J, Sauser B System of Systems-the meaning of of. In: System of Systems
Engineering, 2006 IEEE/SMC International Conference on, 2006. IEEE, p 6 pp.
4. Checkland P (1999) Systems thinking, systems practice; Soft systems methodology: A 30 year
retrospective. West Sussex, England: John Wiley and Sons
5. Buede DM, Miller WD (2016) The engineering design of systems: models and methods. John
Wiley & Sons,
6. ISO/IEC/IEEE Systems and software engineering - Architecture description. (2011).
ISO/IEC/IEEE 42010:2011(E) (Revision of ISO/IEC 42010:2007 and IEEE Std 1471-2000):1-
46. doi:10.1109/IEEESTD.2011.6129467
7. SEBoK authors (2017) System Architecture --- Guide to the Systems Engineering Body of
Knowledge (SEBoK), version 1.8. Guide to the Systems Engineering Body of Knowledge
(SEBoK)
8. Hartmann R, Belhoff B, Oster C, Friedenthal S, Paredis C, Kemp D, Stoewer H, Nichols D,
Wade J (2014) A World In Motion, Systems Engineering Vision 2025. INCOSE, San Diego, CA
9. Bar-Yam Y (1997) Dynamics of complex systems, vol 213. Addison-Wesley Reading, MA,
10. North Atlantic Treaty Organization (2017) NATO Architecture Framework v4.0
Documentation (draft). http://nafdocs.org/.
11. Haren V (2011) TOGAF Version 9.1. Van Haren Publishing,
12. Rechtin E (1991) Systems architecting: Creating and building complex systems, vol 199. vol
1. Prentice Hall Englewood Cliffs, NJ,
13. Sillitto H (2014) Architecting systems: concepts, principles and practice. College
Publications,
14. Sheard SA, Mostashari A (2009) Principles of complex systems for systems engineering.
Systems Engineering 12 (4):295-311
15. Bolton PW (2006) Complexity Science A Vital Tool for Systems Engineering in the 21st
Century, INSIGHT Volume 9, Issue 1. Insight 9 (1):27-27

12
16. Sheard S, Cook S, Honour E, Hybertson D, Krupa J, McEver J, McKinney D, Ondrus P, Ryan
A, Scheurer R (2015) A complexity primer for systems engineers. white paper, Incose Complex
Systems Working Group
17. Sinha K, de Weck OL Structural complexity quantification for engineered complex systems
and implications on system architecture and design. In: ASME 2013 International Design
Engineering Technical Conferences and Computers and Information in Engineering Conference,
2013. American Society of Mechanical Engineers, pp V03AT03A044-V003AT003A044
18. Harrison WK (2016) The Role of Graph Theory in System of Systems Engineering. IEEE
Access 4:1716-1742
19. Luzeaux D, Wippler J-L (2013) Complex systems and systems of systems engineering. John
Wiley & Sons,
20. Franke U, Johnson P, Ericsson E, Flores WR, Zhu K Enterprise architecture analysis using
fault trees and MODAF. In: Proceedings of CAiSE Forum, 2009. pp 61-66
21. Cohen M Simulation Preorder Semantics for Traceability Relations in Enterprise
Architecture. In: IFIP Working Conference on The Practice of Enterprise Modeling, 2014.
Springer, pp 103-117
22. NAFv4 Chapter 2 Example. (Under Development, Libert P (Airbus), Garnier J-L (Thales),
2016-2017).
23. Newman ME (2003) The structure and function of complex networks. SIAM review 45
(2):167-256
24. Strogatz SH (2001) Exploring complex networks. Nature 410 (6825):268-276
25. Barabási A-L (2003) Linked: The new science of networks. AAPT,
26. Bastian M, Heymann S, Jacomy M (2009) Gephi: an open source software for exploring and
manipulating networks. ICWSM 8:361-362
27. Tamassia R (2013) Handbook of graph drawing and visualization. CRC press,
28. Hu Y (2005) Efficient, high-quality force-directed graph drawing. Mathematica Journal 10
(1):37-71
29. Diestel R (2005) Graph Theory, Electronic. Graduate Texts in Mathematics 173
30. Tarjan R (1972) Depth-first search and linear graph algorithms. SIAM journal on computing
1 (2):146-160
31. Fortunato S (2010) Community detection in graphs. Physics reports 486 (3):75-174
32. Newman ME (2006) Modularity and community structure in networks. Proceedings of the
national academy of sciences 103 (23):8577-8582
33. Blondel VD, Guillaume J-L, Lambiotte R, Lefebvre E (2008) Fast unfolding of communities
in large networks. Journal of statistical mechanics: theory and experiment 2008 (10):P10008
Top Related