


Languages
Pages
Legal

Hepatitis B ControlStrategic Information and Country Profiles

2
Hepatitis B ControlStrategic Information and Country Profiles
© World Health Organization 2013
ISBN-13 978 92 9061 633 7
All rights reserved. Publications of the World Health Organization are available on the WHO web site (www.who.int) or can be purchased from WHO Press, World Health Organization, 20 Avenue Appia, 1211 Geneva 27, Switzerland (tel.: +41 22 791 3264; fax: +41 22 791 4857; e-mail: [email protected]).
Requests for permission to reproduce or translate WHO publications –whether for sale or for non-commercial distribution– should be addressed to WHO Press through the WHO web site (www.who.int/about/licensing/copyright_form/en/index.html). ). For WHO Western Pacific Regional Publications, request for permission to reproduce should be addressed to Publications Office, World Health Organization, Regional Office for the Western Pacific, P.O. Box 2932, 1000, Manila, Philippines, fax: +632 521 1036, e-mail: [email protected]
The designations employed and the presentation of the material in this publication do not imply the expression of any opinion whatsoever on the part of the World Health Organization concerning the legal status of any country, territory, city or area or of its authorities, or concerning the delimitation of its frontiers or boundaries. Dotted lines on maps represent approximate border lines for which there may not yet be full agreement.
The mention of specific companies or of certain manufacturers’ products does not imply that they are endorsed or recommended by the World Health Organization in preference to others of a similar nature that are not mentioned. Errors and omissions excepted, the names of proprietary products are distinguished by initial capital letters.
All reasonable precautions have been taken by the World Health Organization to verify the information contained in this publication. However, the published material is being distributed without warranty of any kind, either expressed or implied. The responsibility for the interpretation and use of the material lies with the reader. In no event shall the World Health Organization be liable for damages arising from its use.
Cover: AFP
CONTENTS
III
1. Abbreviations IV
2. Context 1
3. Regional Progress: Hepatitis B Control Milestones 2
4. Regional Progress: Chronic Hepatitis B Virus Prevalence 4
5. Regional Progress: Hepatitis B Vaccination Coverage, 1990 – 2011 6
6. Regional Progress: Status of the 2012 Hepatitis B Control Milestone 7
7. Country Profiles
American Samoa 8
Australia 9
BruneI Darussalam 10
Cambodia 11
China 12
Hong Kong (China) 13
Macao (China) 14
Cook Islands 15
Fiji 16
French Polynesia 17
Guam 18
Japan 19
Kiribati 20
Lao People’s Democratic Republic 21
Malaysia 22
Marshall Islands 23
Federated States of Micronesia 24
Mongolia 25
Nauru 26
New Caledonia 27
New Zealand 28
Niue 29
Northern Mariana Islands 30
Palau 31
Papua New Guinea 32
Philippines 33
Republic of Korea 34
Samoa 35
Singapore 36
Solomon Islands 37
Tokelau 38
Tonga 39
Tuvalu 40
Vanuatu 41
Viet Nam 42
Wallis and Futuna 43
ABBREVIATIONS
IV
AusAID Australian Agency for International DevelopmentBD Birth DoseCDC Centers for Disease Control and PreventionDHS Demographic and Health SurveyDTP3 Third dose of diphtheria-pertussis-tetanus vaccineGAVI Global Alliance for Vaccines and ImmunizationHB Hepatitis BHBV Hepatitis B virusHepB Hepatitis BHepB3 Third dose of hepatitis B vaccineHBsAg Hepatitis B surface antigen (a marker of hepatitis B infection)JRF Joint reporting formNZAID New Zealand Agency for International DevelopmentSBA Skilled birth attendantWHO World Health OrganizationUNICEF United Nations Children’s Fund
1
CONTEXT
1
Remarkable progress has been made in controlling hepatitis B infection in the Western Pacific Region. In 2005 the Regional Committee for the Western Pacific made a momentous decision to adopt the world’s first regional hepatitis B control goal. Resolution WPR/RC56.R8 set a goal of less than 1% hepatitis B prevalence among children with a milestone target of less than 2% prevalence by 2012. In 2012 the Region made history by achieving that milestone. The countries and areas of the Western Pacific Region have proven that a well-planned programme including evidence-based policies and careful performance measurement is a formula for success.
This document provides an overview of the hepatitis B control programme in the Western Pacific Region, and hepatitis B data profiles for the 36 countries and areas of the Region. The profiles include demographic data, vaccination policies, childbirth delivery types, reported vaccination coverage from 2008–2012, vaccination coverage and seroprevalence survey summaries, and the status of hepatitis B control verification. We are hopeful that this easy-to-ready snapshot of up-to-date data by country will be a useful tool for decision-makers in sustaining and increasing the important gains in hepatitis B control in the Western Pacific Region.
The Region has proven that suffering and death due to hepatitis B infection need not continue. Currently nine countries and areas have been verified as having reached the goal of less than 1% hepatitis B prevalence among five-year-old children. Let us continue to work together to ensure that all countries and areas achieve and sustain the goal of less than 1% hepatitis B prevalence among children, and that hepatitis B infection becomes a thing of the past.
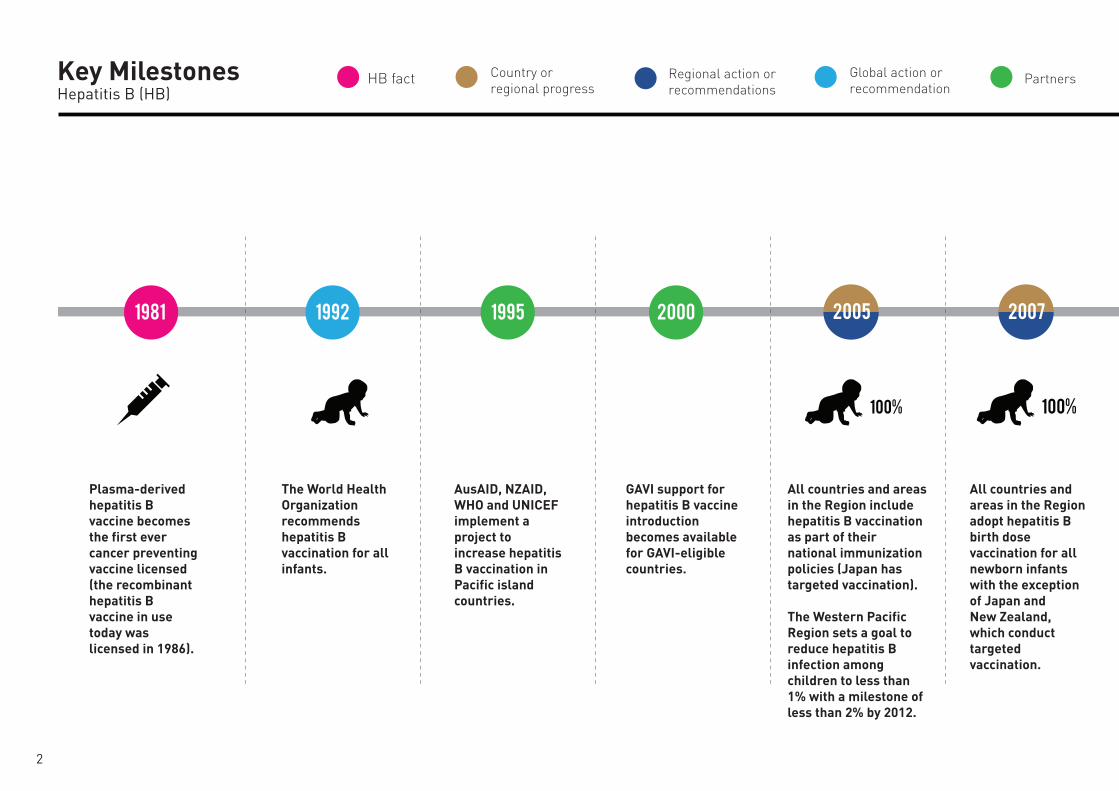
PartnersGlobal action or recommendation
Regional action or recommendations
Country or regional progress
Key MilestonesHepatitis B (HB)
HB fact
Plasma-derived hepatitis B vaccine becomes the first ever cancer preventing vaccine licensed (the recombinant hepatitis B vaccine in use today was licensed in 1986).
AusAID, NZAID, WHO and UNICEF implement a project to increase hepatitis B vaccination in Pacific island countries.
GAVI support for hepatitis B vaccine introduction becomes available for GAVI-eligible countries.
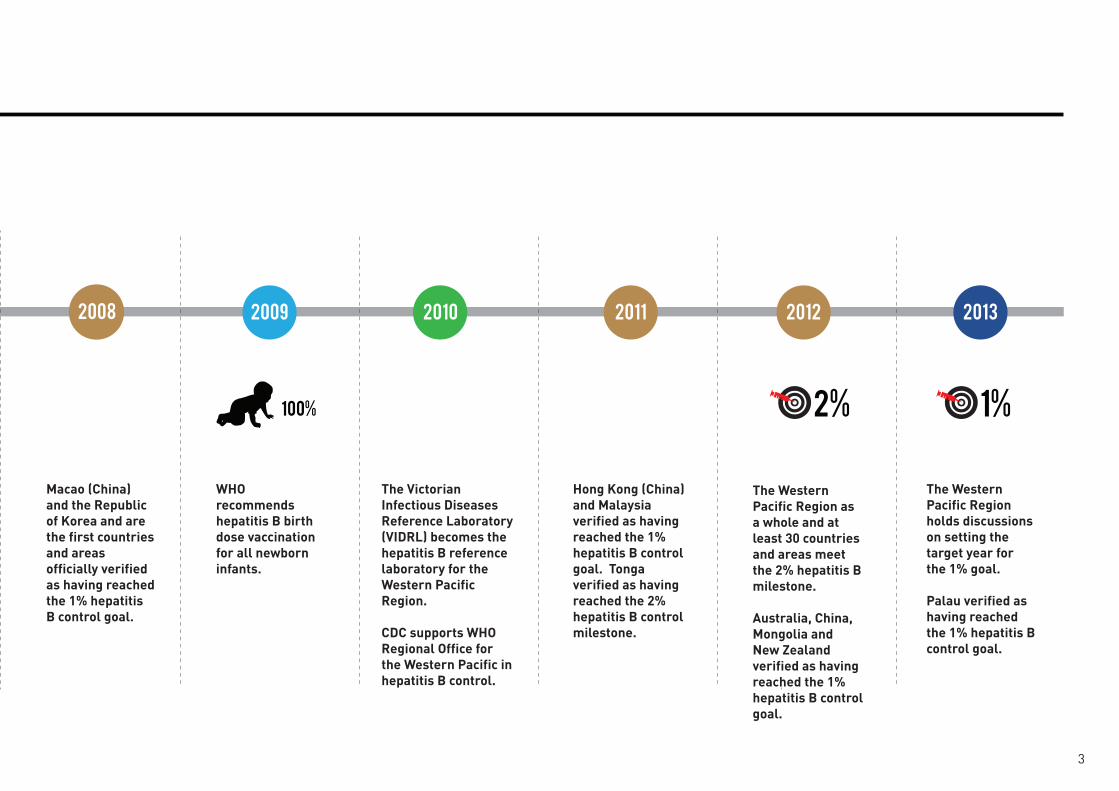
WHO recommends hepatitis B birth dose vaccination for all newborn infants.
Hong Kong (China) and Malaysia verified as having reached the 1% hepatitis B control goal. Tonga verified as having reached the 2% hepatitis B control milestone.
2%
The Western Pacific Region as a whole and at least 30 countries and areas meet the 2% hepatitis B milestone.
Australia, China, Mongolia and New Zealand verified as having reached the 1% hepatitis B control goal.
The Western Pacific Region holds discussions on setting the target year for the 1% goal.
Palau verified as having reached the 1% hepatitis B control goal.
The Victorian Infectious Diseases Reference Laboratory (VIDRL) becomes the hepatitis B reference laboratory for the Western Pacific Region.
CDC supports WHO Regional Office for the Western Pacific in hepatitis B control.
The World Health Organization recommends hepatitis B vaccination for all infants.
Macao (China) and the Republic of Korea and are the first countries and areas officially verified as having reached the 1% hepatitis B control goal.
100%
All countries and areas in the Region include hepatitis B vaccination as part of their national immunization policies (Japan has targeted vaccination). The Western Pacific Region sets a goal to reduce hepatitis B infection among children to less than 1% with a milestone of less than 2% by 2012.
All countries and areas in the Region adopt hepatitis B birth dose vaccination for all newborn infants with the exception of Japan and New Zealand, which conduct targeted vaccination.
100% 1%100%
2
PartnersGlobal action or recommendation
Regional action or recommendations
Country or regional progress
Key MilestonesHepatitis B (HB)
HB fact
Plasma-derived hepatitis B vaccine becomes the first ever cancer preventing vaccine licensed (the recombinant hepatitis B vaccine in use today was licensed in 1986).
AusAID, NZAID, WHO and UNICEF implement a project to increase hepatitis B vaccination in Pacific island countries.
GAVI support for hepatitis B vaccine introduction becomes available for GAVI-eligible countries.
WHO recommends hepatitis B birth dose vaccination for all newborn infants.
Hong Kong (China) and Malaysia verified as having reached the 1% hepatitis B control goal. Tonga verified as having reached the 2% hepatitis B control milestone.
2%
The Western Pacific Region as a whole and at least 30 countries and areas meet the 2% hepatitis B milestone.
Australia, China, Mongolia and New Zealand verified as having reached the 1% hepatitis B control goal.
The Western Pacific Region holds discussions on setting the target year for the 1% goal.
Palau verified as having reached the 1% hepatitis B control goal.
The Victorian Infectious Diseases Reference Laboratory (VIDRL) becomes the hepatitis B reference laboratory for the Western Pacific Region.
CDC supports WHO Regional Office for the Western Pacific in hepatitis B control.
The World Health Organization recommends hepatitis B vaccination for all infants.
Macao (China) and the Republic of Korea and are the first countries and areas officially verified as having reached the 1% hepatitis B control goal.
100%
All countries and areas in the Region include hepatitis B vaccination as part of their national immunization policies (Japan has targeted vaccination). The Western Pacific Region sets a goal to reduce hepatitis B infection among children to less than 1% with a milestone of less than 2% by 2012.
All countries and areas in the Region adopt hepatitis B birth dose vaccination for all newborn infants with the exception of Japan and New Zealand, which conduct targeted vaccination.
100% 1%100%
3
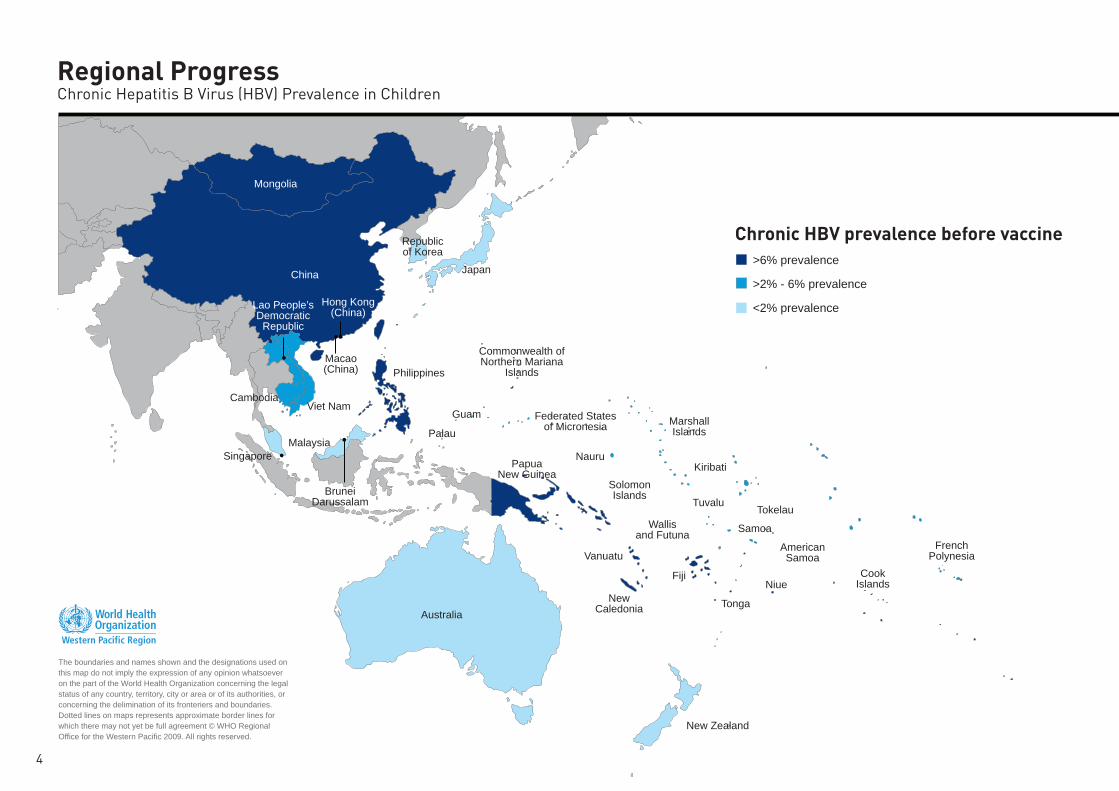
Regional ProgressChronic Hepatitis B Virus (HBV) Prevalence in Children
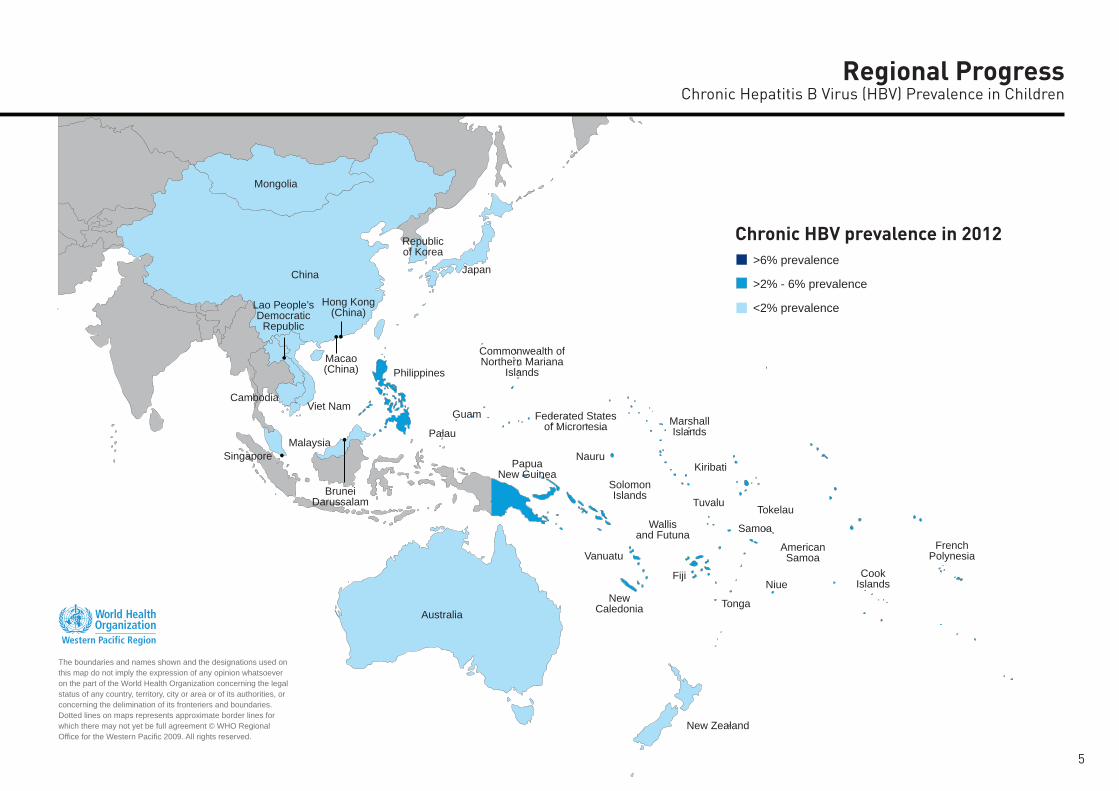
Regional ProgressChronic Hepatitis B Virus (HBV) Prevalence in Children
The boundaries and names shown and the designations used on this map do not imply the expression of any opinion whatsoever on the part of the World Health Organization concerning the legal status of any country, territory, city or area or of its authorities, or concerning the delimination of its fronteriers and boundaries. Dotted lines on maps represents approximate border lines for which there may not yet be full agreement © WHO Regional Office for the Western Pacific 2009. All rights reserved.
Chronic HBV prevalence before vaccine >6% prevalence
>2% - 6% prevalence
<2% prevalence
Chronic HBV prevalence in 2012 >6% prevalence
>2% - 6% prevalence
<2% prevalence
The boundaries and names shown and the designations used on this map do not imply the expression of any opinion whatsoever on the part of the World Health Organization concerning the legal status of any country, territory, city or area or of its authorities, or concerning the delimination of its fronteriers and boundaries. Dotted lines on maps represents approximate border lines for which there may not yet be full agreement © WHO Regional Office for the Western Pacific 2009. All rights reserved.
Mongolia
China Japan
Republic of Korea
Lao People’sDemocratic
Republic
Hong Kong (China)
Cambodia
SingaporeMalaysia
Viet Nam
Macao (China)
Australia
Commonwealth of Northern Mariana
Islands
MarshallIslands
Federated States of Micronesia
Philippines
Guam
BruneiDarussalam
Palau
PapuaNew Guinea
NauruKiribati
Vanuatu
New Zealand
SolomonIslands
NewCaledonia
Wallis and Futuna
Tuvalu
Tonga
Cook Islands
Fiji
Tokelau
American Samoa
French Polynesia
Niue
Samoa
4
Regional ProgressChronic Hepatitis B Virus (HBV) Prevalence in Children
Regional ProgressChronic Hepatitis B Virus (HBV) Prevalence in Children
The boundaries and names shown and the designations used on this map do not imply the expression of any opinion whatsoever on the part of the World Health Organization concerning the legal status of any country, territory, city or area or of its authorities, or concerning the delimination of its fronteriers and boundaries. Dotted lines on maps represents approximate border lines for which there may not yet be full agreement © WHO Regional Office for the Western Pacific 2009. All rights reserved.
Chronic HBV prevalence before vaccine >6% prevalence
>2% - 6% prevalence
<2% prevalence
Chronic HBV prevalence in 2012 >6% prevalence
>2% - 6% prevalence
<2% prevalence
The boundaries and names shown and the designations used on this map do not imply the expression of any opinion whatsoever on the part of the World Health Organization concerning the legal status of any country, territory, city or area or of its authorities, or concerning the delimination of its fronteriers and boundaries. Dotted lines on maps represents approximate border lines for which there may not yet be full agreement © WHO Regional Office for the Western Pacific 2009. All rights reserved.
Mongolia
China Japan
Republic of Korea
Lao People’sDemocratic
Republic
Hong Kong (China)
Cambodia
SingaporeMalaysia
Viet Nam
Macao (China)
Australia
Commonwealth of Northern Mariana
Islands
MarshallIslands
Federated States of Micronesia
Philippines
Guam
BruneiDarussalam
Palau
PapuaNew Guinea
NauruKiribati
Vanuatu
New Zealand
SolomonIslands
NewCaledonia
Wallis and Futuna
Tuvalu
Tonga
Cook Islands
Fiji
Tokelau
American Samoa
French Polynesia
Niue
Samoa
Mongolia
China Japan
Republic of Korea
Lao People’sDemocratic
Republic
Hong Kong (China)
Cambodia
SingaporeMalaysia
Viet Nam
Macao (China)
Australia
Commonwealth of Northern Mariana
Islands
MarshallIslands
Federated States of Micronesia
Philippines
Guam
BruneiDarussalam
Palau
PapuaNew Guinea
NauruKiribati
Vanuatu
New Zealand
SolomonIslands
NewCaledonia
Wallis and Futuna
Tuvalu
Tonga
Cook Islands
Fiji
Tokelau
American Samoa
French Polynesia
Niue
Samoa
5
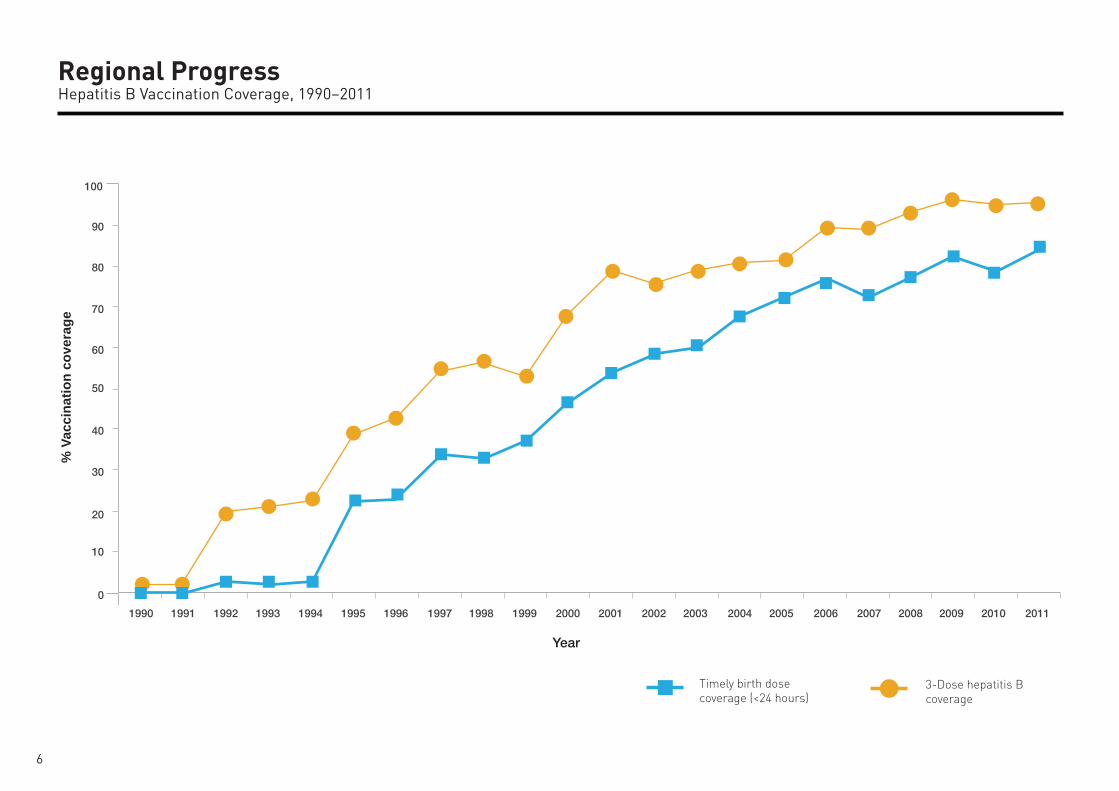
Regional ProgressHepatitis B Vaccination Coverage, 1990–2011
% V
acci
natio
n co
vera
ge
6
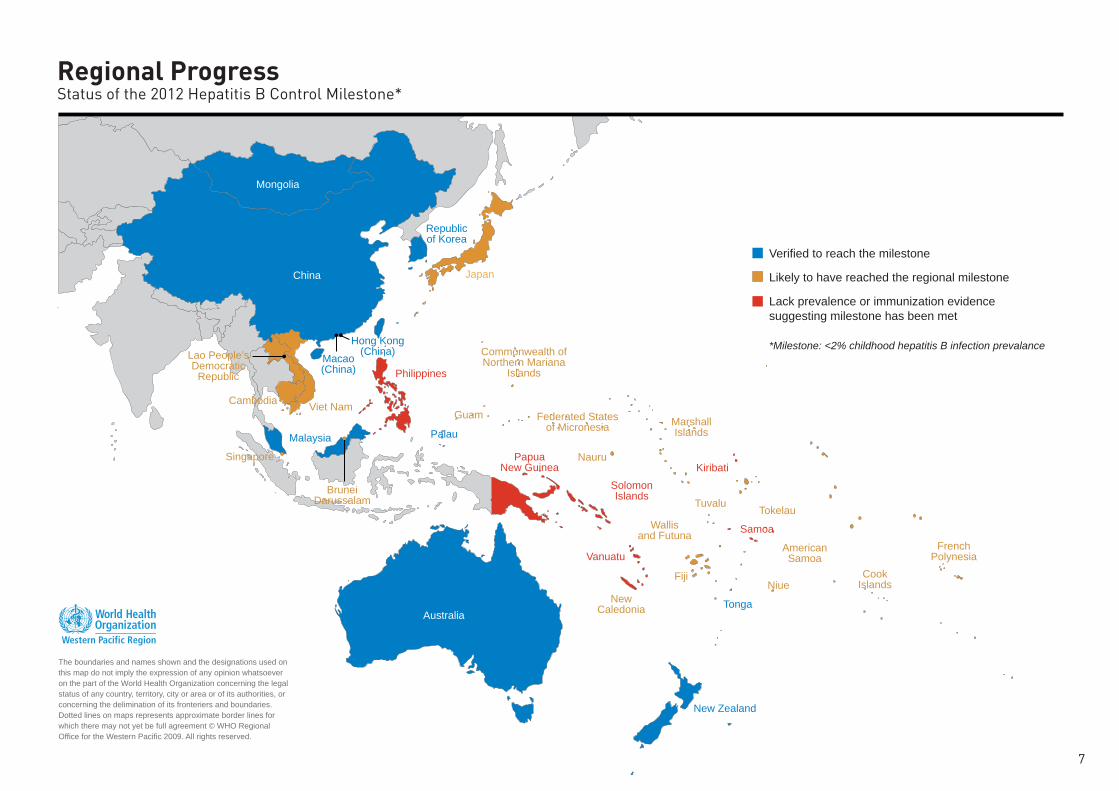
Verified to reach the milestone
Likely to have reached the regional milestone
Lack prevalence or immunization evidence suggesting milestone has been met
*Milestone: <2% childhood hepatitis B infection prevalance
Mongolia
China Japan
Republic of Korea
Lao People’sDemocratic
Republic
Cambodia
Singapore
Malaysia
Viet Nam
Macao (China)
Australia
Commonwealth of Northern Mariana
Islands
MarshallIslands
Federated States of Micronesia
Philippines
Guam
BruneiDarussalam
Palau
PapuaNew Guinea
NauruKiribati
Vanuatu
New Zealand
SolomonIslands
NewCaledonia
Wallis and Futuna
Tuvalu
Tonga
Cook Islands
Fiji
Tokelau
American Samoa
French Polynesia
Niue
Samoa
Hong Kong (China)
Regional ProgressStatus of the 2012 Hepatitis B Control Milestone*
The boundaries and names shown and the designations used on this map do not imply the expression of any opinion whatsoever on the part of the World Health Organization concerning the legal status of any country, territory, city or area or of its authorities, or concerning the delimination of its fronteriers and boundaries. Dotted lines on maps represents approximate border lines for which there may not yet be full agreement © WHO Regional Office for the Western Pacific 2009. All rights reserved.
7
Health facility
Home with SBA
Home with no SBA
Unknown
99.0%
1.0%
Vacc
inat
ion
cove
rage
(%)
0
20
40
60
80
100
20122011201020092008
Timely HepB BD HepB3 Any HepB BD
(%) D
istr
icts
201
2
0
20
40
60
80
100
Timely HepB BDHepB3
>94%90%–94%80%–89%50%–79%<50%
Abbreviations: DTP3: 3rd dose of Diphteria, Tetanus, and Pertussis Vaccine; HepB3: at least 3 doses of hepatitis B vaccine; HBsAg: hepatitis B surface antigen; SBA: Skilled Birth Attendant; Timely HepB BD: birth dose within 24 hours Sources: UN, UNICEF and WHO* HepB3 vaccination coverage when available, otherwise graph represents DPT3 coverage.
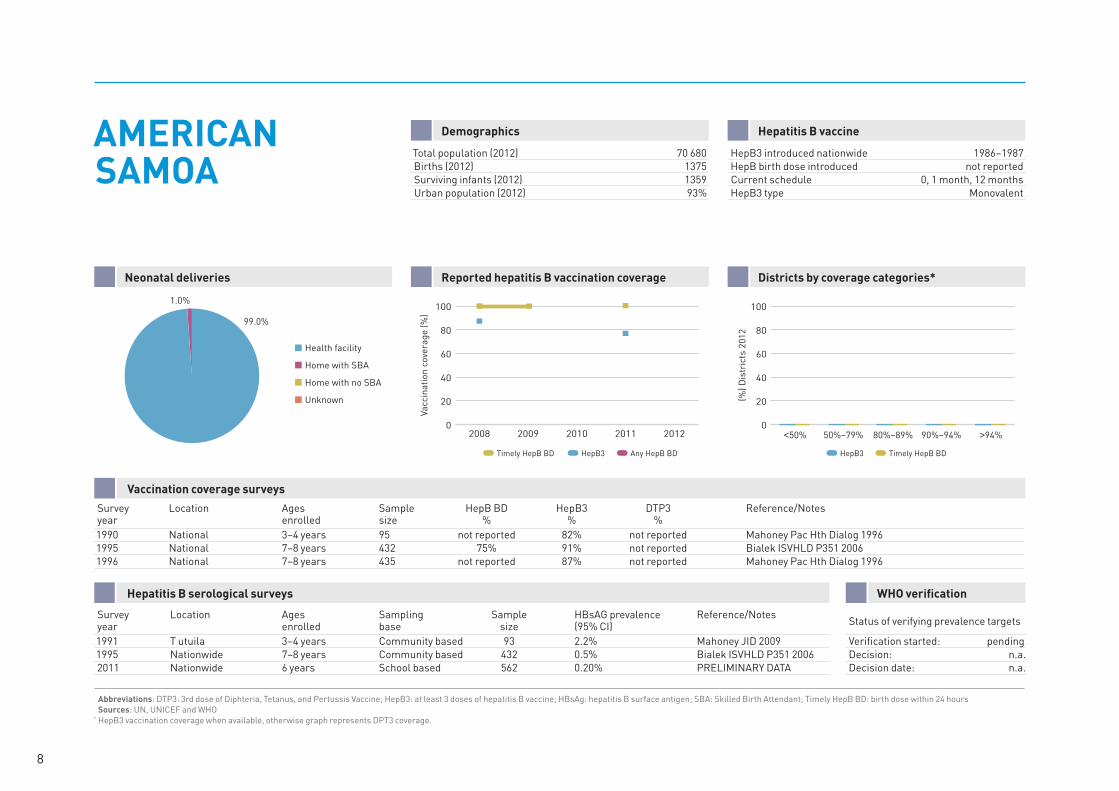
DemographicsAMERICAN SAMOA
Hepatitis B vaccine
Total population (2012) 70 680Births (2012) 1375Surviving infants (2012) 1359Urban population (2012) 93%
HepB3 introduced nationwide 1986–1987HepB birth dose introduced not reportedCurrent schedule 0, 1 month, 12 monthsHepB3 type Monovalent
Neonatal deliveries Reported hepatitis B vaccination coverage Districts by coverage categories*
Vaccination coverage surveys
Survey Location Ages Sample HepB BD HepB3 DTP3 Reference/Notes year enrolled size % % % 1990 National 3–4 years 95 not reported 82% not reported Mahoney Pac Hth Dialog 19961995 National 7–8 years 432 75% 91% not reported Bialek ISVHLD P351 20061996 National 7–8 years 435 not reported 87% not reported Mahoney Pac Hth Dialog 1996
Hepatitis B serological surveys
Survey Location Ages Sampling Sample HBsAG prevalence Reference/Notes year enrolled base size (95% CI) 1991 T utuila 3–4 years Community based 93 2.2% Mahoney JID 20091995 Nationwide 7–8 years Community based 432 0.5% Bialek ISVHLD P351 20062011 Nationwide 6 years School based 562 0.20% PRELIMINARY DATA
WHO verification
Status of verifying prevalence targets
Verification started: pendingDecision: n.a.Decision date: n.a.
8
Health facility
Home with SBA
Home with no SBA
Unknown
99.10%
0.90%
Vacc
inat
ion
cove
rage
(%)
0
20
40
60
80
100
20122011201020092008
Timely HepB BD HepB3 Any HepB BD
(%) D
istr
icts
201
2
0
20
40
60
80
100
Timely HepB BDHepB3
>94%90%–94%80%–89%50%–79%<50%
Abbreviations: DTP3: 3rd dose of Diphteria, Tetanus, and Pertussis Vaccine; HepB3: at least 3 doses of hepatitis B vaccine; HBsAg: hepatitis B surface antigen; SBA: Skilled Birth Attendant; Timely HepB BD: birth dose within 24 hours Sources: UN, UNICEF and WHO* HepB3 vaccination coverage when available, otherwise graph represents DPT3 coverage.
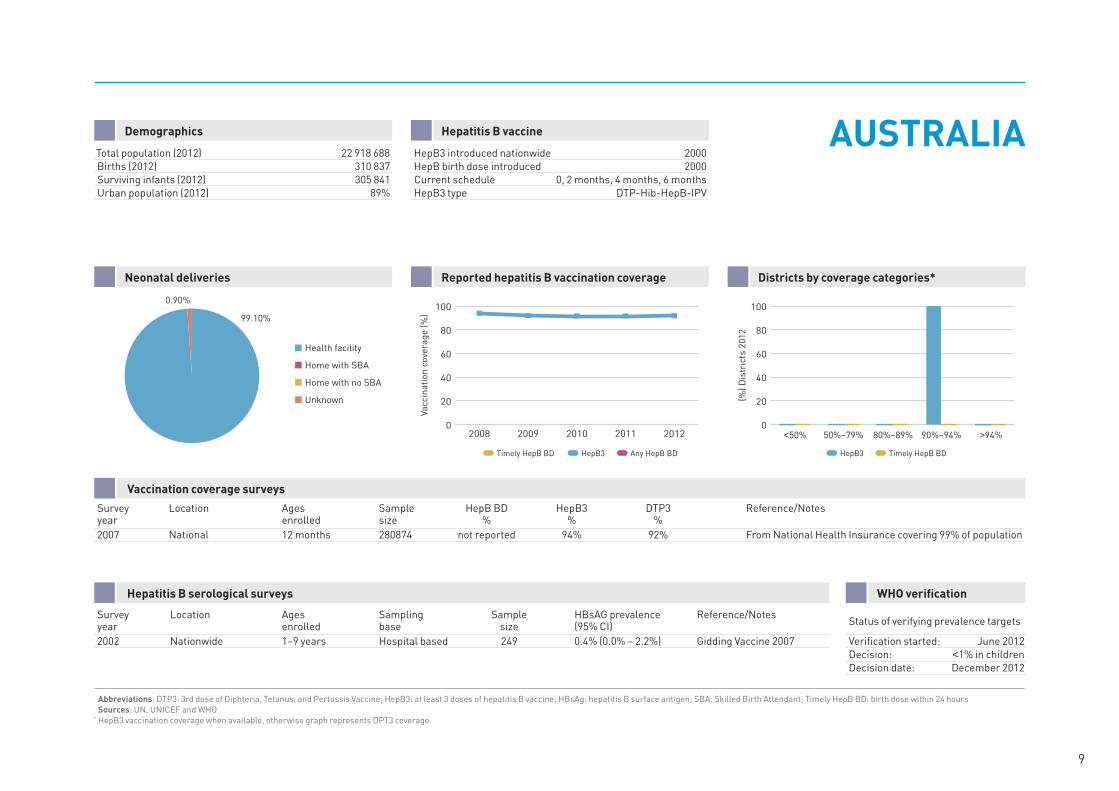
Demographics AUSTRALIAHepatitis B vaccine
Total population (2012) 22 918 688Births (2012) 310 837Surviving infants (2012) 305 841Urban population (2012) 89%
HepB3 introduced nationwide 2000HepB birth dose introduced 2000Current schedule 0, 2 months, 4 months, 6 monthsHepB3 type DTP-Hib-HepB-IPV
Neonatal deliveries Reported hepatitis B vaccination coverage Districts by coverage categories*
Vaccination coverage surveys
Survey Location Ages Sample HepB BD HepB3 DTP3 Reference/Notes year enrolled size % % % 2007 National 12 months 280874 not reported 94% 92% From National Health Insurance covering 99% of population
Hepatitis B serological surveys
Survey Location Ages Sampling Sample HBsAG prevalence Reference/Notes year enrolled base size (95% CI) 2002 Nationwide 1–9 years Hospital based 249 0.4% (0.0% – 2.2%) Gidding Vaccine 2007
WHO verification
Status of verifying prevalence targets
Verification started: June 2012Decision: <1% in childrenDecision date: December 2012
9
Health facility
Home with SBA
Home with no SBA
Unknown
99.80%
0.10%0.10%
Vacc
inat
ion
cove
rage
(%)
0
20
40
60
80
100
20122011201020092008
Timely HepB BD HepB3 Any HepB BD
(%) D
istr
icts
201
2
0
20
40
60
80
100
Timely HepB BDHepB3
>94%90%–94%80%–89%50%–79%<50%
Abbreviations: DTP3: 3rd dose of Diphteria, Tetanus, and Pertussis Vaccine; HepB3: at least 3 doses of hepatitis B vaccine; HBsAg: hepatitis B surface antigen; SBA: Skilled Birth Attendant; Timely HepB BD: birth dose within 24 hours Sources: UN, UNICEF and WHO* HepB3 vaccination coverage when available, otherwise graph represents DPT3 coverage.
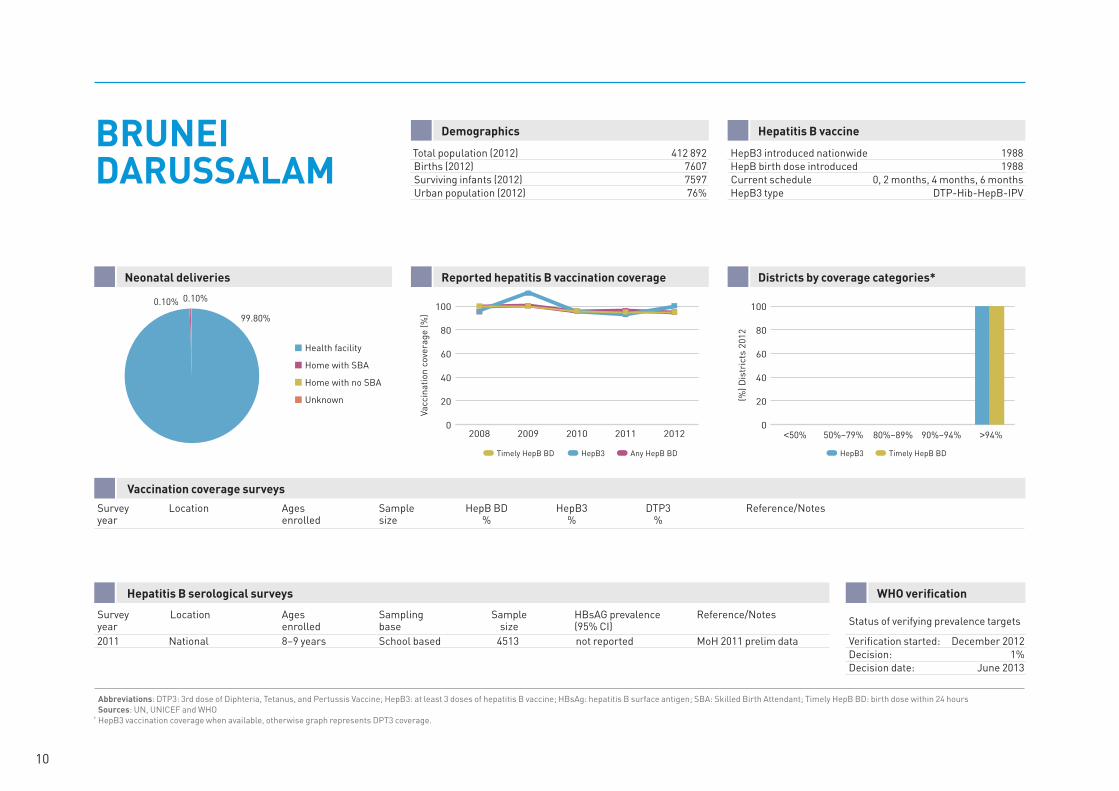
DemographicsBRUNEI DARUSSALAM
Hepatitis B vaccine
Total population (2012) 412 892Births (2012) 7607Surviving infants (2012) 7597Urban population (2012) 76%
HepB3 introduced nationwide 1988HepB birth dose introduced 1988Current schedule 0, 2 months, 4 months, 6 monthsHepB3 type DTP-Hib-HepB-IPV
Neonatal deliveries Reported hepatitis B vaccination coverage Districts by coverage categories*
Vaccination coverage surveys
Survey Location Ages Sample HepB BD HepB3 DTP3 Reference/Notes year enrolled size % % %
Hepatitis B serological surveys
Survey Location Ages Sampling Sample HBsAG prevalence Reference/Notes year enrolled base size (95% CI) 2011 National 8–9 years School based 4513 not reported MoH 2011 prelim data
WHO verification
Status of verifying prevalence targets
Verification started: December 2012Decision: 1%Decision date: June 2013
10
Health facility
Home with SBA
Home with no SBA
Unknown
54.0%
17.0%
29.0%
Vacc
inat
ion
cove
rage
(%)
0
20
40
60
80
100
20122011201020092008
Timely HepB BD HepB3 Any HepB BD
(%) D
istr
icts
201
2
0
20
40
60
80
100
Timely HepB BDHepB3
>94%90%–94%80%–89%50%–79%<50%
Abbreviations: DTP3: 3rd dose of Diphteria, Tetanus, and Pertussis Vaccine; HepB3: at least 3 doses of hepatitis B vaccine; HBsAg: hepatitis B surface antigen; SBA: Skilled Birth Attendant; Timely HepB BD: birth dose within 24 hours Sources: UN, UNICEF and WHO* HepB3 vaccination coverage when available, otherwise graph represents DPT3 coverage.
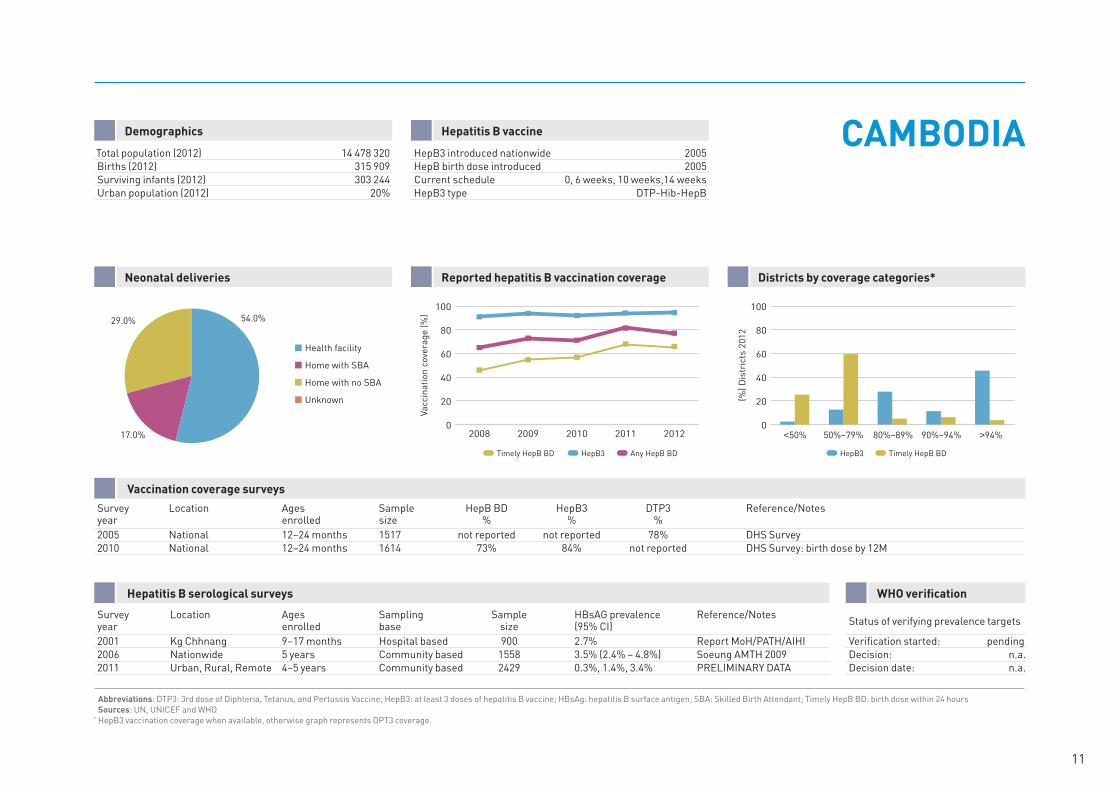
Demographics CAMBODIAHepatitis B vaccine
Total population (2012) 14 478 320Births (2012) 315 909Surviving infants (2012) 303 244Urban population (2012) 20%
HepB3 introduced nationwide 2005HepB birth dose introduced 2005Current schedule 0, 6 weeks, 10 weeks,14 weeksHepB3 type DTP-Hib-HepB
Neonatal deliveries Reported hepatitis B vaccination coverage Districts by coverage categories*
Vaccination coverage surveys
Survey Location Ages Sample HepB BD HepB3 DTP3 Reference/Notes year enrolled size % % % 2005 National 12–24 months 1517 not reported not reported 78% DHS Survey2010 National 12–24 months 1614 73% 84% not reported DHS Survey: birth dose by 12M
Hepatitis B serological surveys
Survey Location Ages Sampling Sample HBsAG prevalence Reference/Notes year enrolled base size (95% CI) 2001 Kg Chhnang 9–17 months Hospital based 900 2.7% Report MoH/PATH/AIHI2006 Nationwide 5 years Community based 1558 3.5% (2.4% – 4.8%) Soeung AMTH 20092011 Urban, Rural, Remote 4–5 years Community based 2429 0.3%, 1.4%, 3.4% PRELIMINARY DATA
WHO verification
Status of verifying prevalence targets
Verification started: pendingDecision: n.a.Decision date: n.a.
11
Health facility
Home with SBA
Home with no SBA
Unknown
96.30%
3.70%
Vacc
inat
ion
cove
rage
(%)
0
20
40
60
80
100
20122011201020092008
Timely HepB BD HepB3 Any HepB BD
(%) D
istr
icts
201
2
0
20
40
60
80
100
Timely HepB BDHepB3
>94%90%–94%80%–89%50%–79%<50%
Abbreviations: DTP3: 3rd dose of Diphteria, Tetanus, and Pertussis Vaccine; HepB3: at least 3 doses of hepatitis B vaccine; HBsAg: hepatitis B surface antigen; SBA: Skilled Birth Attendant; Timely HepB BD: birth dose within 24 hours Sources: UN, UNICEF and WHO* HepB3 vaccination coverage when available, otherwise graph represents DPT3 coverage.
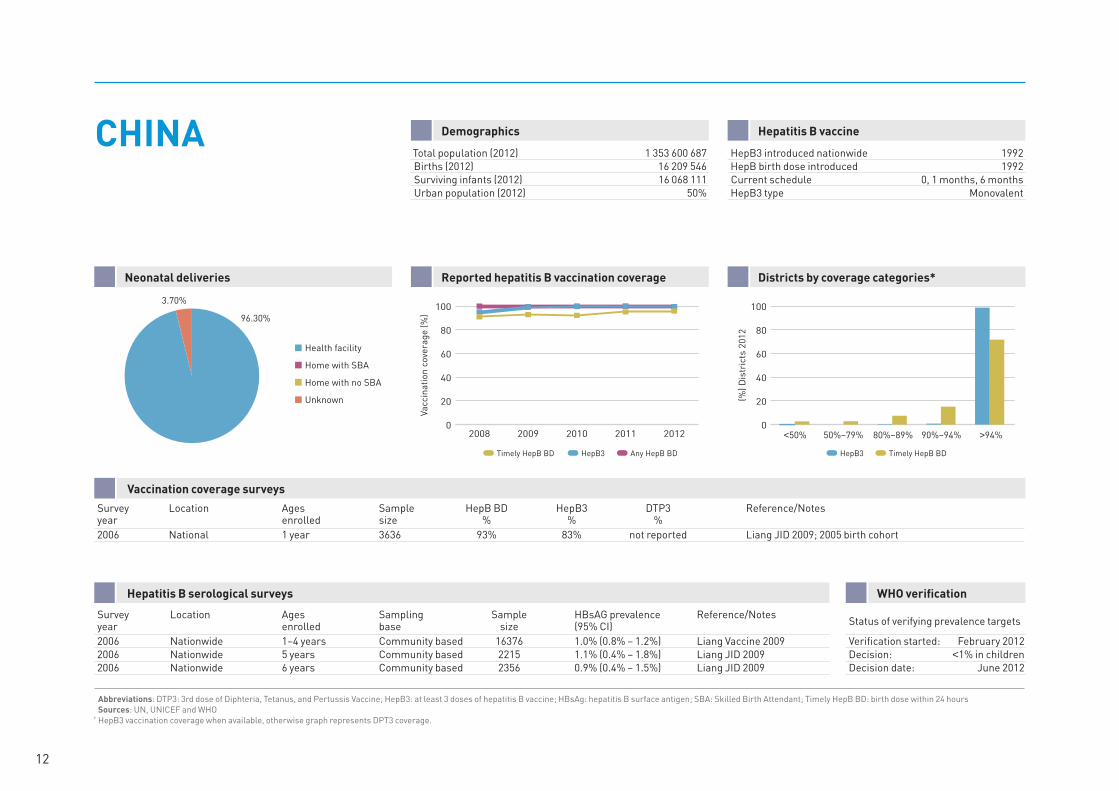
DemographicsCHINA Hepatitis B vaccine
Total population (2012) 1 353 600 687Births (2012) 16 209 546Surviving infants (2012) 16 068 111Urban population (2012) 50%
HepB3 introduced nationwide 1992HepB birth dose introduced 1992Current schedule 0, 1 months, 6 monthsHepB3 type Monovalent
Neonatal deliveries Reported hepatitis B vaccination coverage Districts by coverage categories*
Vaccination coverage surveys
Survey Location Ages Sample HepB BD HepB3 DTP3 Reference/Notes year enrolled size % % % 2006 National 1 year 3636 93% 83% not reported Liang JID 2009; 2005 birth cohort
Hepatitis B serological surveys
Survey Location Ages Sampling Sample HBsAG prevalence Reference/Notes year enrolled base size (95% CI) 2006 Nationwide 1–4 years Community based 16376 1.0% (0.8% – 1.2%) Liang Vaccine 20092006 Nationwide 5 years Community based 2215 1.1% (0.4% – 1.8%) Liang JID 20092006 Nationwide 6 years Community based 2356 0.9% (0.4% – 1.5%) Liang JID 2009
WHO verification
Status of verifying prevalence targets
Verification started: February 2012Decision: <1% in childrenDecision date: June 2012
12
Health facility
Home with SBA
Home with no SBA
Unknown
100.0%
Vacc
inat
ion
cove
rage
(%)
0
20
40
60
80
100
20122011201020092008
Timely HepB BD HepB3 Any HepB BD
(%) D
istr
icts
201
2
0
20
40
60
80
100
Timely HepB BDHepB3
>94%90%–94%80%–89%50%–79%<50%
Abbreviations: DTP3: 3rd dose of Diphteria, Tetanus, and Pertussis Vaccine; HepB3: at least 3 doses of hepatitis B vaccine; HBsAg: hepatitis B surface antigen; SBA: Skilled Birth Attendant; Timely HepB BD: birth dose within 24 hours Sources: UN, UNICEF and WHO* HepB3 vaccination coverage when available, otherwise graph represents DPT3 coverage.
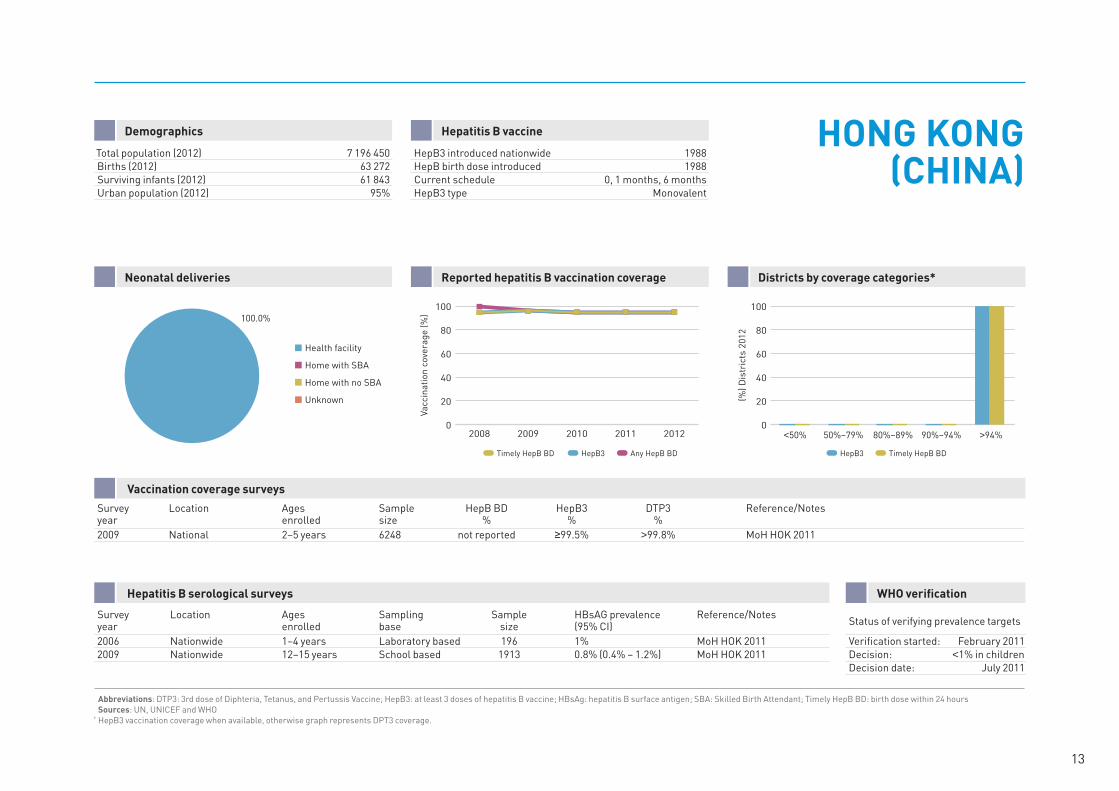
Demographics HONG KONG (CHINA)
Hepatitis B vaccine
Total population (2012) 7 196 450Births (2012) 63 272Surviving infants (2012) 61 843Urban population (2012) 95%
HepB3 introduced nationwide 1988HepB birth dose introduced 1988Current schedule 0, 1 months, 6 monthsHepB3 type Monovalent
Neonatal deliveries Reported hepatitis B vaccination coverage Districts by coverage categories*
Vaccination coverage surveys
Survey Location Ages Sample HepB BD HepB3 DTP3 Reference/Notes year enrolled size % % % 2009 National 2–5 years 6248 not reported ≥99.5% >99.8% MoH HOK 2011
Hepatitis B serological surveys
Survey Location Ages Sampling Sample HBsAG prevalence Reference/Notes year enrolled base size (95% CI) 2006 Nationwide 1–4 years Laboratory based 196 1% MoH HOK 20112009 Nationwide 12–15 years School based 1913 0.8% (0.4% – 1.2%) MoH HOK 2011
WHO verification
Status of verifying prevalence targets
Verification started: February 2011Decision: <1% in childrenDecision date: July 2011
13
Health facility
Home with SBA
Home with no SBA
Unknown
100.0%
Vacc
inat
ion
cove
rage
(%)
0
20
40
60
80
100
20122011201020092008
Timely HepB BD HepB3 Any HepB BD
(%) D
istr
icts
201
2
0
20
40
60
80
100
Timely HepB BDHepB3
>94%90%–94%80%–89%50%–79%<50%
Abbreviations: DTP3: 3rd dose of Diphteria, Tetanus, and Pertussis Vaccine; HepB3: at least 3 doses of hepatitis B vaccine; HBsAg: hepatitis B surface antigen; SBA: Skilled Birth Attendant; Timely HepB BD: birth dose within 24 hours Sources: UN, UNICEF and WHO* HepB3 vaccination coverage when available, otherwise graph represents DPT3 coverage.
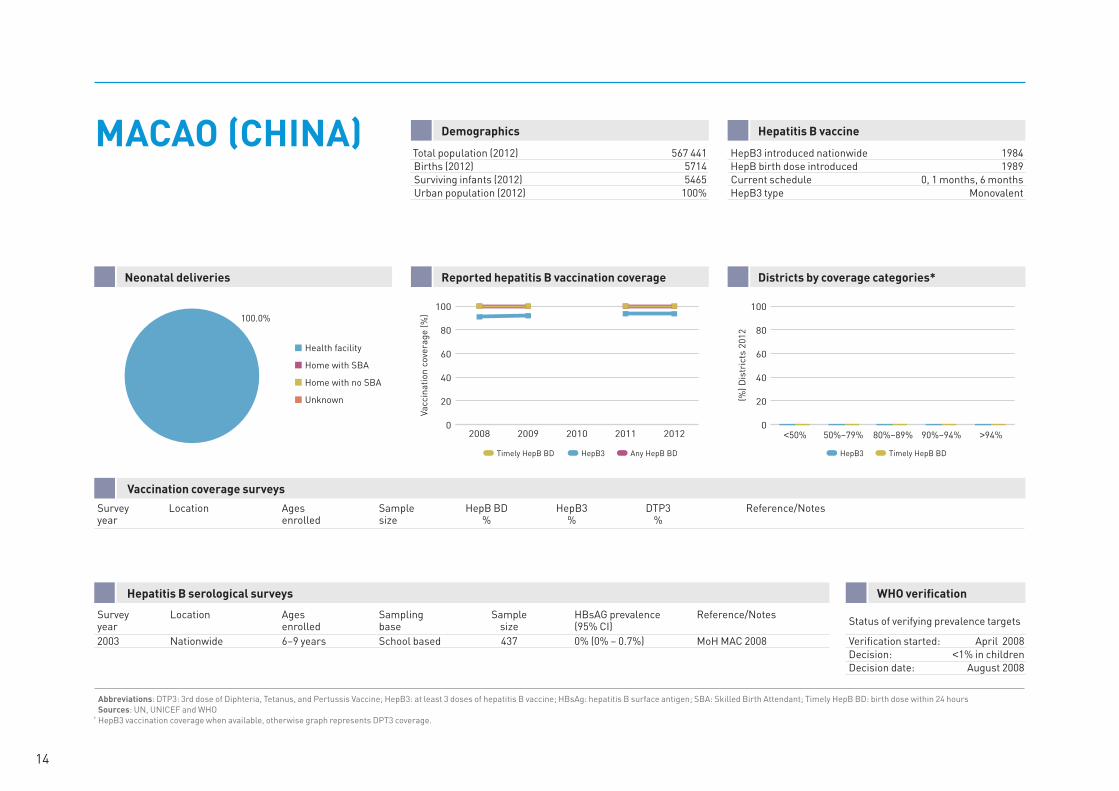
DemographicsMACAO (CHINA) Hepatitis B vaccine
Total population (2012) 567 441Births (2012) 5714Surviving infants (2012) 5465Urban population (2012) 100%
HepB3 introduced nationwide 1984HepB birth dose introduced 1989Current schedule 0, 1 months, 6 monthsHepB3 type Monovalent
Neonatal deliveries Reported hepatitis B vaccination coverage Districts by coverage categories*
Vaccination coverage surveys
Survey Location Ages Sample HepB BD HepB3 DTP3 Reference/Notes year enrolled size % % %
Hepatitis B serological surveys
Survey Location Ages Sampling Sample HBsAG prevalence Reference/Notes year enrolled base size (95% CI) 2003 Nationwide 6–9 years School based 437 0% (0% – 0.7%) MoH MAC 2008
WHO verification
Status of verifying prevalence targets
Verification started: April 2008Decision: <1% in childrenDecision date: August 2008
14
Health facility
Home with SBA
Home with no SBA
Unknown
99.60%
0.40%
Vacc
inat
ion
cove
rage
(%)
0
20
40
60
80
100
20122011201020092008
Timely HepB BD HepB3 Any HepB BD
(%) D
istr
icts
201
2
0
20
40
60
80
100
Timely HepB BDHepB3
>94%90%–94%80%–89%50%–79%<50%
Abbreviations: DTP3: 3rd dose of Diphteria, Tetanus, and Pertussis Vaccine; HepB3: at least 3 doses of hepatitis B vaccine; HBsAg: hepatitis B surface antigen; SBA: Skilled Birth Attendant; Timely HepB BD: birth dose within 24 hours Sources: UN, UNICEF and WHO* HepB3 vaccination coverage when available, otherwise graph represents DPT3 coverage.
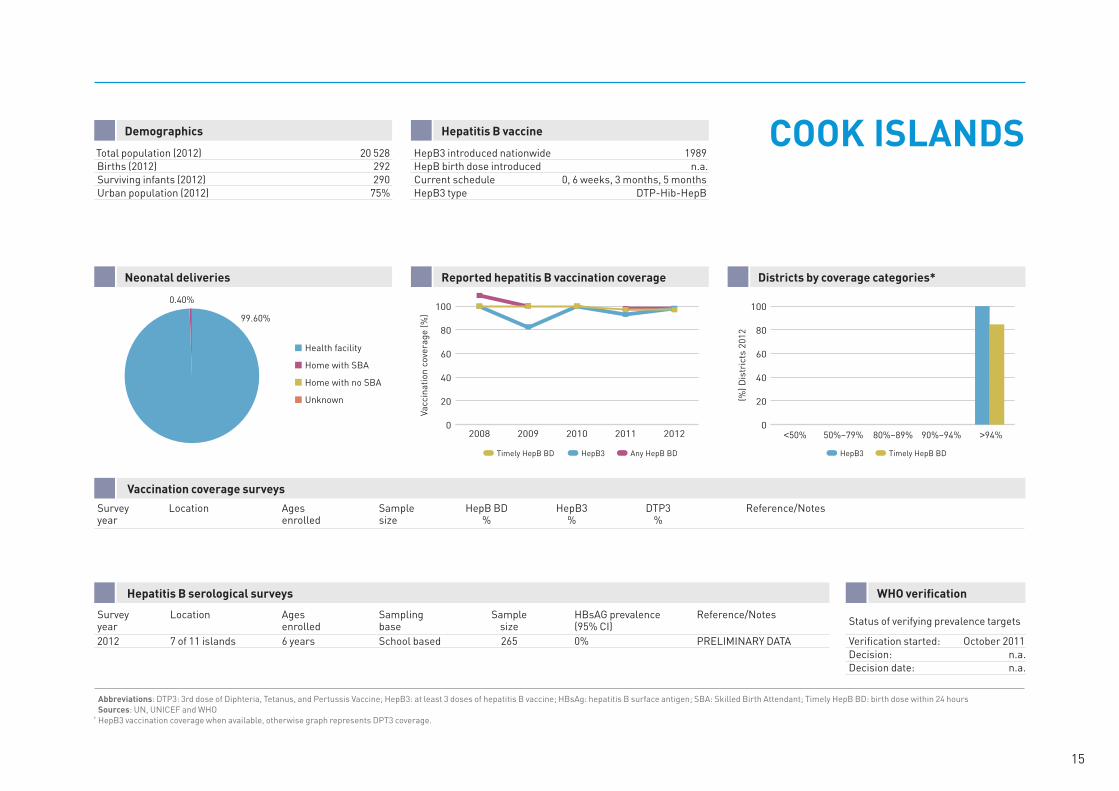
Demographics COOK ISLANDSHepatitis B vaccine
Total population (2012) 20 528Births (2012) 292Surviving infants (2012) 290Urban population (2012) 75%
HepB3 introduced nationwide 1989HepB birth dose introduced n.a.Current schedule 0, 6 weeks, 3 months, 5 monthsHepB3 type DTP-Hib-HepB
Neonatal deliveries Reported hepatitis B vaccination coverage Districts by coverage categories*
Vaccination coverage surveys
Survey Location Ages Sample HepB BD HepB3 DTP3 Reference/Notes year enrolled size % % %
Hepatitis B serological surveys
Survey Location Ages Sampling Sample HBsAG prevalence Reference/Notes year enrolled base size (95% CI) 2012 7 of 11 islands 6 years School based 265 0% PRELIMINARY DATA
WHO verification
Status of verifying prevalence targets
Verification started: October 2011Decision: n.a.Decision date: n.a.
15
Health facility
Home with SBA
Home with no SBA
Unknown
99.80%
0.20%
Vacc
inat
ion
cove
rage
(%)
0
20
40
60
80
100
20122011201020092008
Timely HepB BD HepB3 Any HepB BD
(%) D
istr
icts
201
2
0
20
40
60
80
100
Timely HepB BDHepB3
>94%90%–94%80%–89%50%–79%<50%
Abbreviations: DTP3: 3rd dose of Diphteria, Tetanus, and Pertussis Vaccine; HepB3: at least 3 doses of hepatitis B vaccine; HBsAg: hepatitis B surface antigen; SBA: Skilled Birth Attendant; Timely HepB BD: birth dose within 24 hours Sources: UN, UNICEF and WHO* HepB3 vaccination coverage when available, otherwise graph represents DPT3 coverage.
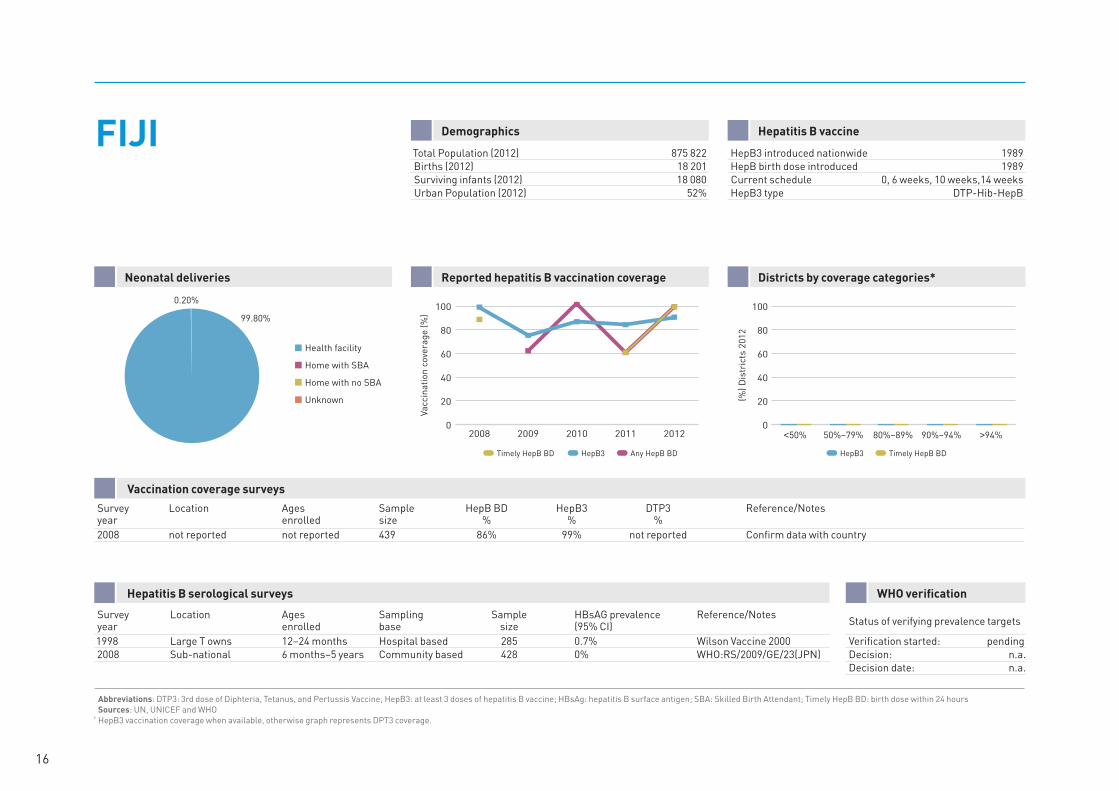
DemographicsFIJI Hepatitis B vaccine
Total Population (2012) 875 822Births (2012) 18 201Surviving infants (2012) 18 080Urban Population (2012) 52%
HepB3 introduced nationwide 1989HepB birth dose introduced 1989Current schedule 0, 6 weeks, 10 weeks,14 weeksHepB3 type DTP-Hib-HepB
Neonatal deliveries Reported hepatitis B vaccination coverage Districts by coverage categories*
Vaccination coverage surveys
Survey Location Ages Sample HepB BD HepB3 DTP3 Reference/Notes year enrolled size % % % 2008 not reported not reported 439 86% 99% not reported Confirm data with country
Hepatitis B serological surveys
Survey Location Ages Sampling Sample HBsAG prevalence Reference/Notes year enrolled base size (95% CI) 1998 Large T owns 12–24 months Hospital based 285 0.7% Wilson Vaccine 20002008 Sub-national 6 months–5 years Community based 428 0% WHO:RS/2009/GE/23(JPN)
WHO verification
Status of verifying prevalence targets
Verification started: pendingDecision: n.a.Decision date: n.a.
16
Health facility
Home with SBA
Home with no SBA
Unknown
99.00%
1.00%
Vacc
inat
ion
cove
rage
(%)
0
20
40
60
80
100
20122011201020092008
Timely HepB BD HepB3 Any HepB BD
(%) D
istr
icts
201
2
0
20
40
60
80
100
Timely HepB BDHepB3
>94%90%–94%80%–89%50%–79%<50%
Abbreviations: DTP3: 3rd dose of Diphteria, Tetanus, and Pertussis Vaccine; HepB3: at least 3 doses of hepatitis B vaccine; HBsAg: hepatitis B surface antigen; SBA: Skilled Birth Attendant; Timely HepB BD: birth dose within 24 hours Sources: UN, UNICEF and WHO* HepB3 vaccination coverage when available, otherwise graph represents DPT3 coverage.
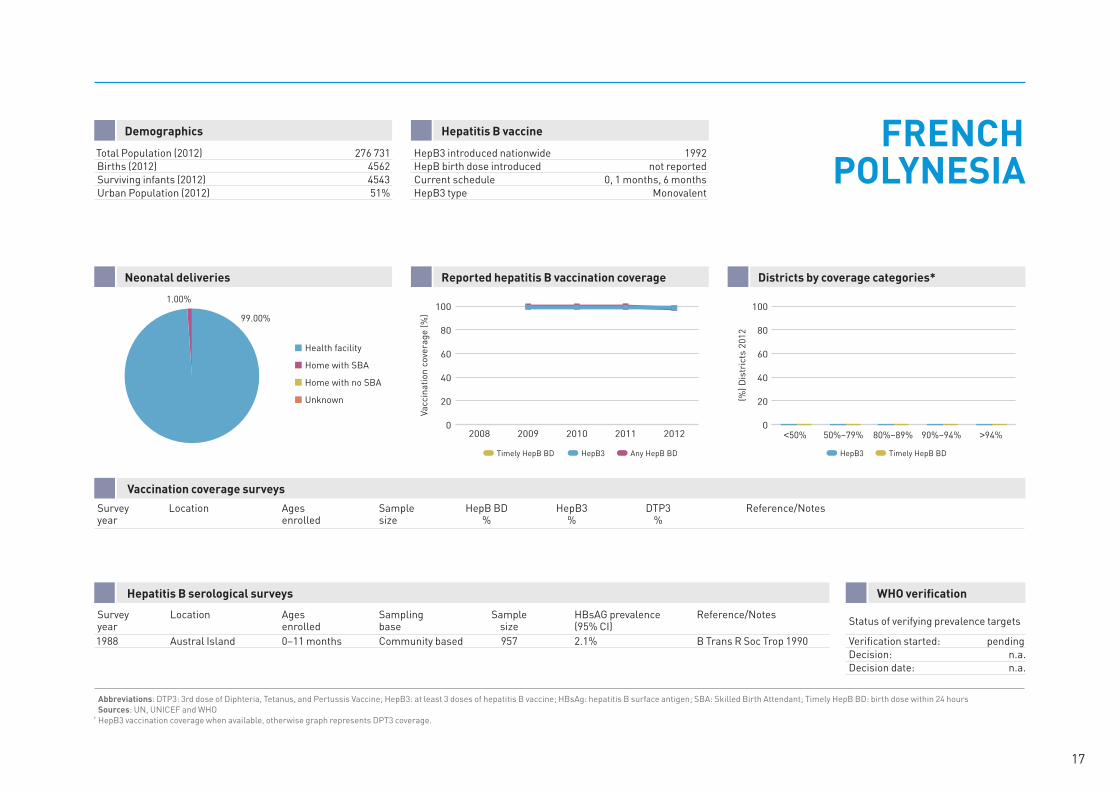
Demographics FRENCH POLYNESIA
Hepatitis B vaccine
Total Population (2012) 276 731Births (2012) 4562Surviving infants (2012) 4543Urban Population (2012) 51%
HepB3 introduced nationwide 1992HepB birth dose introduced not reportedCurrent schedule 0, 1 months, 6 monthsHepB3 type Monovalent
Neonatal deliveries Reported hepatitis B vaccination coverage Districts by coverage categories*
Vaccination coverage surveys
Survey Location Ages Sample HepB BD HepB3 DTP3 Reference/Notes year enrolled size % % %
Hepatitis B serological surveys
Survey Location Ages Sampling Sample HBsAG prevalence Reference/Notes year enrolled base size (95% CI) 1988 Austral Island 0–11 months Community based 957 2.1% B Trans R Soc Trop 1990
WHO verification
Status of verifying prevalence targets
Verification started: pendingDecision: n.a.Decision date: n.a.
17
Health facility
Home with SBA
Home with no SBA
Unknown
87.22%0.60%
12.20%
Vacc
inat
ion
cove
rage
(%)
0
20
40
60
80
100
20122011201020092008
Timely HepB BD HepB3 Any HepB BD
(%) D
istr
icts
201
2
0
20
40
60
80
100
Timely HepB BDHepB3
>94%90%–94%80%–89%50%–79%<50%
Abbreviations: DTP3: 3rd dose of Diphteria, Tetanus, and Pertussis Vaccine; HepB3: at least 3 doses of hepatitis B vaccine; HBsAg: hepatitis B surface antigen; SBA: Skilled Birth Attendant; Timely HepB BD: birth dose within 24 hours Sources: UN, UNICEF and WHO* HepB3 vaccination coverage when available, otherwise graph represents DPT3 coverage.
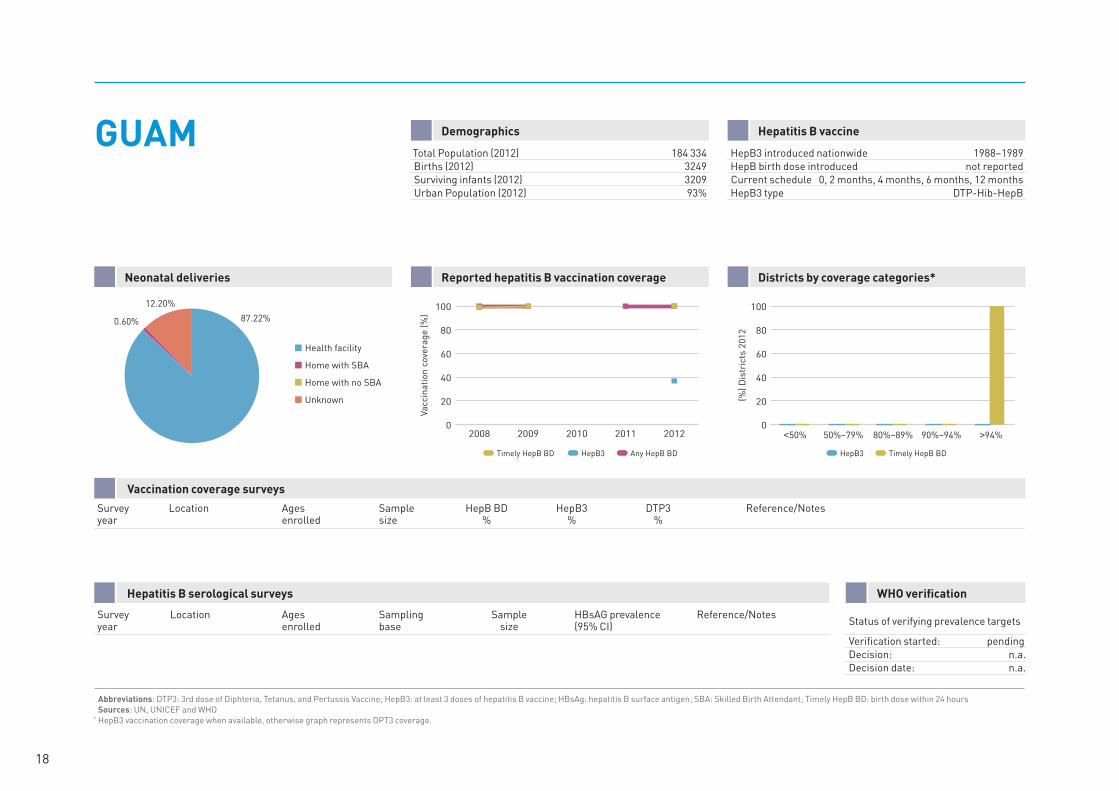
DemographicsGUAM Hepatitis B vaccine
Total Population (2012) 184 334Births (2012) 3249Surviving infants (2012) 3209Urban Population (2012) 93%
HepB3 introduced nationwide 1988–1989HepB birth dose introduced not reportedCurrent schedule 0, 2 months, 4 months, 6 months, 12 monthsHepB3 type DTP-Hib-HepB
Neonatal deliveries Reported hepatitis B vaccination coverage Districts by coverage categories*
Vaccination coverage surveys
Survey Location Ages Sample HepB BD HepB3 DTP3 Reference/Notes year enrolled size % % %
Hepatitis B serological surveys
Survey Location Ages Sampling Sample HBsAG prevalence Reference/Notes year enrolled base size (95% CI)
WHO verification
Status of verifying prevalence targets
Verification started: pendingDecision: n.a.Decision date: n.a.
18
Health facility
Home with SBA
Home with no SBA
Unknown
99.77%
0.18% 0.05%
Vacc
inat
ion
cove
rage
(%)
0
20
40
60
80
100
20122011201020092008
Timely HepB BD HepB3 Any HepB BD
(%) D
istr
icts
201
2
0
20
40
60
80
100
Timely HepB BDHepB3
>94%90%–94%80%–89%50%–79%<50%
Abbreviations: DTP3: 3rd dose of Diphteria, Tetanus, and Pertussis Vaccine; HepB3: at least 3 doses of hepatitis B vaccine; HBsAg: hepatitis B surface antigen; SBA: Skilled Birth Attendant; Timely HepB BD: birth dose within 24 hours Sources: UN, UNICEF and WHO* HepB3 vaccination coverage when available, otherwise graph represents DPT3 coverage.
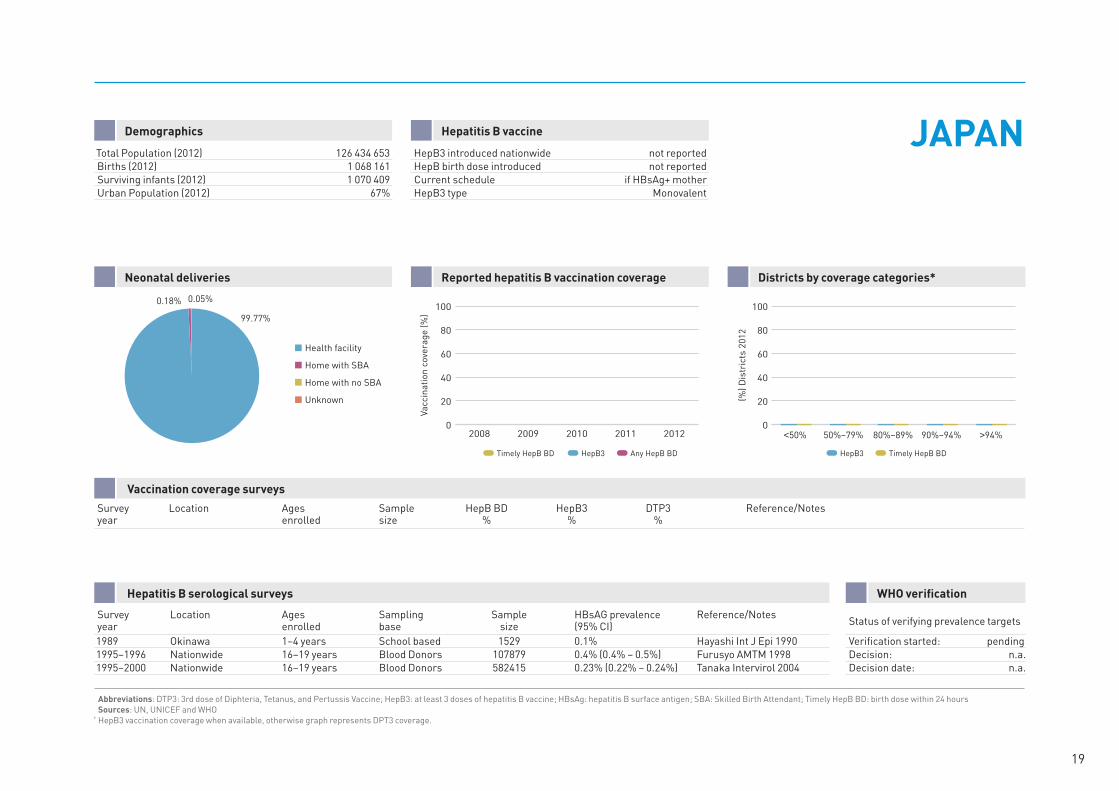
Demographics JAPANHepatitis B vaccine
Total Population (2012) 126 434 653Births (2012) 1 068 161Surviving infants (2012) 1 070 409Urban Population (2012) 67%
HepB3 introduced nationwide not reportedHepB birth dose introduced not reportedCurrent schedule if HBsAg+ motherHepB3 type Monovalent
Neonatal deliveries Reported hepatitis B vaccination coverage Districts by coverage categories*
Vaccination coverage surveys
Survey Location Ages Sample HepB BD HepB3 DTP3 Reference/Notes year enrolled size % % %
Hepatitis B serological surveys
Survey Location Ages Sampling Sample HBsAG prevalence Reference/Notes year enrolled base size (95% CI) 1989 Okinawa 1–4 years School based 1529 0.1% Hayashi Int J Epi 1990 1995–1996 Nationwide 16–19 years Blood Donors 107879 0.4% (0.4% – 0.5%) Furusyo AMTM 19981995–2000 Nationwide 16–19 years Blood Donors 582415 0.23% (0.22% – 0.24%) Tanaka Intervirol 2004
WHO verification
Status of verifying prevalence targets
Verification started: pendingDecision: n.a.Decision date: n.a.
19
Health facility
Home with SBA
Home with no SBA
Unknown
81.85%16.40%
1.75%
Vacc
inat
ion
cove
rage
(%)
0
20
40
60
80
100
20122011201020092008
Timely HepB BD HepB3 Any HepB BD
(%) D
istr
icts
201
2
0
20
40
60
80
100
Timely HepB BDHepB3
>94%90%–94%80%–89%50%–79%<50%
Abbreviations: DTP3: 3rd dose of Diphteria, Tetanus, and Pertussis Vaccine; HepB3: at least 3 doses of hepatitis B vaccine; HBsAg: hepatitis B surface antigen; SBA: Skilled Birth Attendant; Timely HepB BD: birth dose within 24 hours Sources: UN, UNICEF and WHO* HepB3 vaccination coverage when available, otherwise graph represents DPT3 coverage.
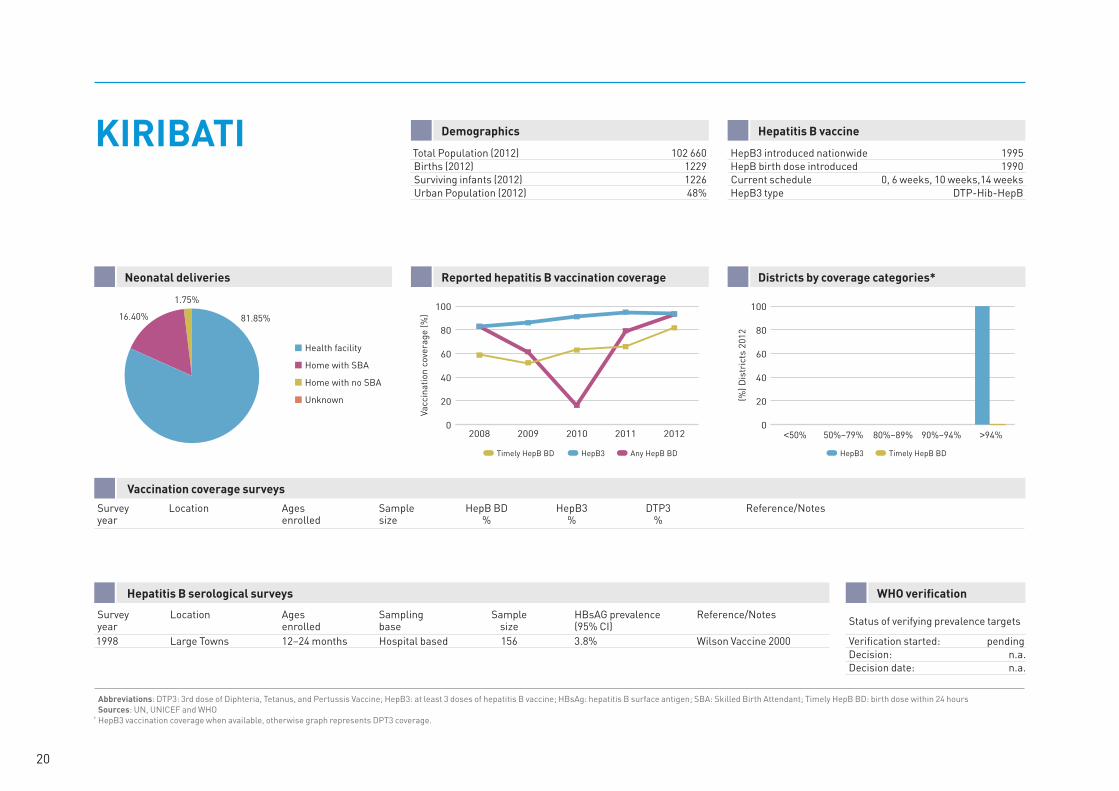
DemographicsKIRIBATI Hepatitis B vaccine
Total Population (2012) 102 660Births (2012) 1229Surviving infants (2012) 1226Urban Population (2012) 48%
HepB3 introduced nationwide 1995HepB birth dose introduced 1990Current schedule 0, 6 weeks, 10 weeks,14 weeksHepB3 type DTP-Hib-HepB
Neonatal deliveries Reported hepatitis B vaccination coverage Districts by coverage categories*
Vaccination coverage surveys
Survey Location Ages Sample HepB BD HepB3 DTP3 Reference/Notes year enrolled size % % %
Hepatitis B serological surveys
Survey Location Ages Sampling Sample HBsAG prevalence Reference/Notes year enrolled base size (95% CI) 1998 Large Towns 12–24 months Hospital based 156 3.8% Wilson Vaccine 2000
WHO verification
Status of verifying prevalence targets
Verification started: pendingDecision: n.a.Decision date: n.a.
20
Health facility
Home with SBA
Home with no SBA
Unknown
12.80%
5.70%
81.50%Va
ccin
atio
n co
vera
ge (%
)0
20
40
60
80
100
20122011201020092008
Timely HepB BD HepB3 Any HepB BD
(%) D
istr
icts
201
2
0
20
40
60
80
100
Timely HepB BDHepB3
>94%90%–94%80%–89%50%–79%<50%
Abbreviations: DTP3: 3rd dose of Diphteria, Tetanus, and Pertussis Vaccine; HepB3: at least 3 doses of hepatitis B vaccine; HBsAg: hepatitis B surface antigen; SBA: Skilled Birth Attendant; Timely HepB BD: birth dose within 24 hours Sources: UN, UNICEF and WHO* HepB3 vaccination coverage when available, otherwise graph represents DPT3 coverage.
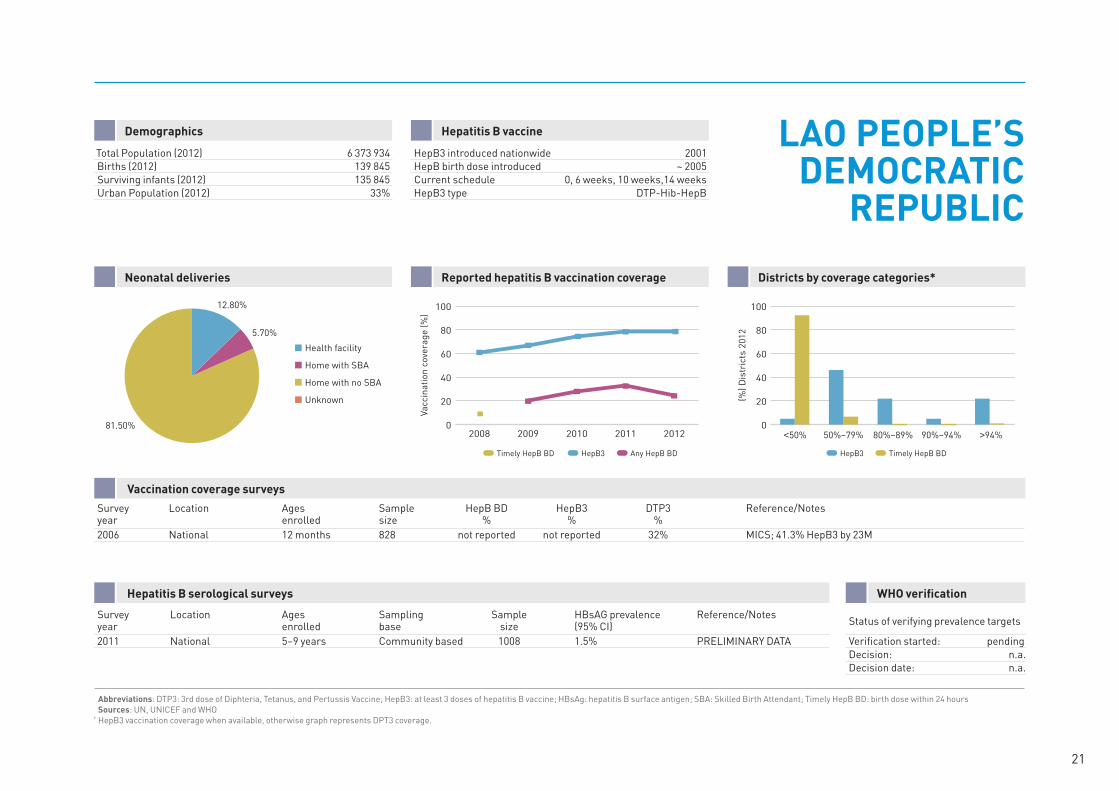
Demographics LAO PEOPLE’S DEMOCRATIC
REPUBLIC
Hepatitis B vaccine
Total Population (2012) 6 373 934Births (2012) 139 845Surviving infants (2012) 135 845Urban Population (2012) 33%
HepB3 introduced nationwide 2001HepB birth dose introduced ~ 2005Current schedule 0, 6 weeks, 10 weeks,14 weeksHepB3 type DTP-Hib-HepB
Neonatal deliveries Reported hepatitis B vaccination coverage Districts by coverage categories*
Vaccination coverage surveys
Survey Location Ages Sample HepB BD HepB3 DTP3 Reference/Notes year enrolled size % % % 2006 National 12 months 828 not reported not reported 32% MICS; 41.3% HepB3 by 23M
Hepatitis B serological surveys
Survey Location Ages Sampling Sample HBsAG prevalence Reference/Notes year enrolled base size (95% CI) 2011 National 5–9 years Community based 1008 1.5% PRELIMINARY DATA
WHO verification
Status of verifying prevalence targets
Verification started: pendingDecision: n.a.Decision date: n.a.
21
Health facility
Home with SBA
Home with no SBA
Unknown
98.12%
0.53% 1.35%
Vacc
inat
ion
cove
rage
(%)
0
20
40
60
80
100
20122011201020092008
Timely HepB BD HepB3 Any HepB BD
(%) D
istr
icts
201
2
0
20
40
60
80
100
Timely HepB BDHepB3
>94%90%–94%80%–89%50%–79%<50%
Abbreviations: DTP3: 3rd dose of Diphteria, Tetanus, and Pertussis Vaccine; HepB3: at least 3 doses of hepatitis B vaccine; HBsAg: hepatitis B surface antigen; SBA: Skilled Birth Attendant; Timely HepB BD: birth dose within 24 hours Sources: UN, UNICEF and WHO* HepB3 vaccination coverage when available, otherwise graph represents DPT3 coverage.
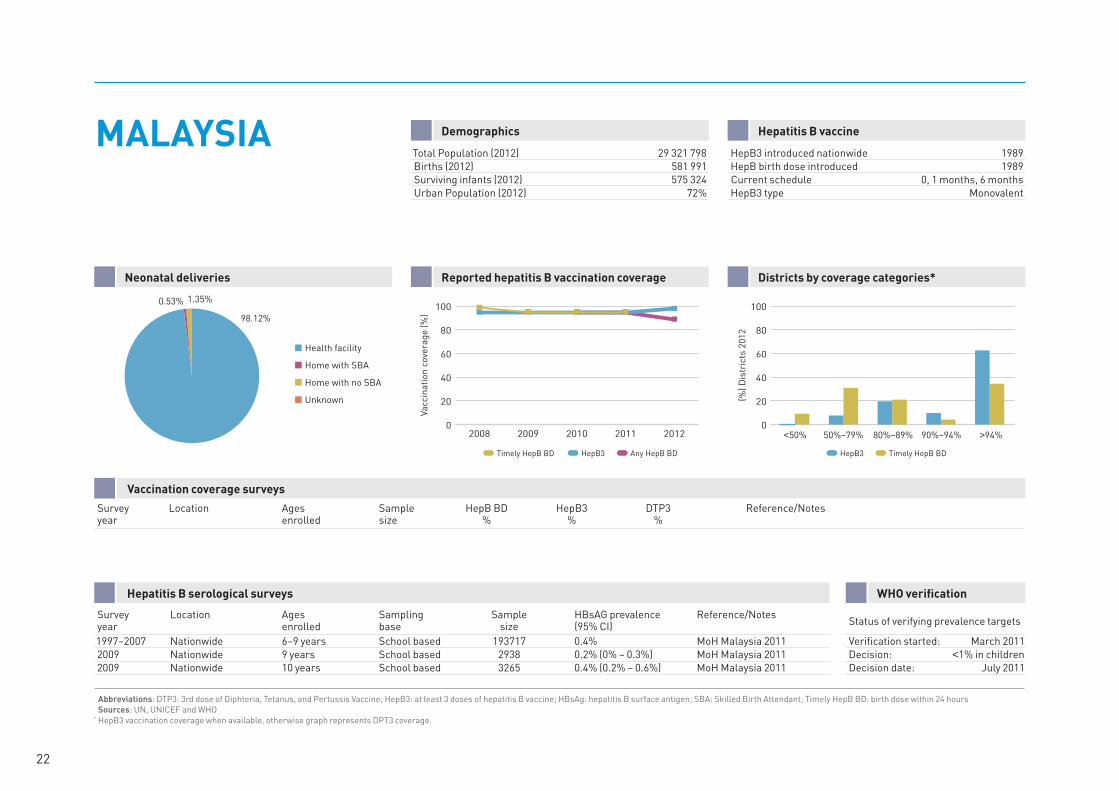
DemographicsMALAYSIA Hepatitis B vaccine
Total Population (2012) 29 321 798Births (2012) 581 991Surviving infants (2012) 575 324Urban Population (2012) 72%
HepB3 introduced nationwide 1989HepB birth dose introduced 1989 Current schedule 0, 1 months, 6 monthsHepB3 type Monovalent
Neonatal deliveries Reported hepatitis B vaccination coverage Districts by coverage categories*
Vaccination coverage surveys
Survey Location Ages Sample HepB BD HepB3 DTP3 Reference/Notes year enrolled size % % %
Hepatitis B serological surveys
Survey Location Ages Sampling Sample HBsAG prevalence Reference/Notes year enrolled base size (95% CI) 1997–2007 Nationwide 6–9 years School based 193717 0.4% MoH Malaysia 20112009 Nationwide 9 years School based 2938 0.2% (0% – 0.3%) MoH Malaysia 20112009 Nationwide 10 years School based 3265 0.4% (0.2% – 0.6%) MoH Malaysia 2011
WHO verification
Status of verifying prevalence targets
Verification started: March 2011Decision: <1% in childrenDecision date: July 2011
22
Health facility
Home with SBA
Home with no SBA
Unknown
97.00%
2.00% 1.00%
Vacc
inat
ion
cove
rage
(%)
0
20
40
60
80
100
20122011201020092008
Timely HepB BD HepB3 Any HepB BD
(%) D
istr
icts
201
2
0
20
40
60
80
100
Timely HepB BDHepB3
>94%90%–94%80%–89%50%–79%<50%
Abbreviations: DTP3: 3rd dose of Diphteria, Tetanus, and Pertussis Vaccine; HepB3: at least 3 doses of hepatitis B vaccine; HBsAg: hepatitis B surface antigen; SBA: Skilled Birth Attendant; Timely HepB BD: birth dose within 24 hours Sources: UN, UNICEF and WHO* HepB3 vaccination coverage when available, otherwise graph represents DPT3 coverage.
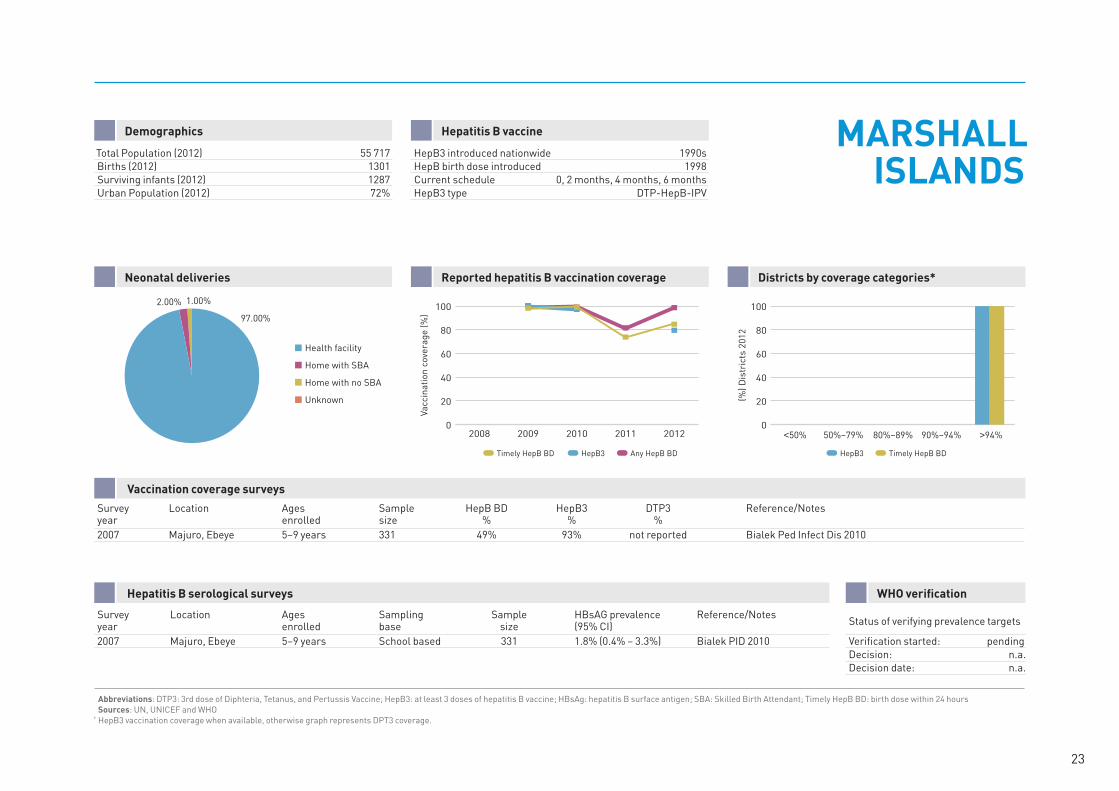
Demographics MARSHALL ISLANDS
Hepatitis B vaccine
Total Population (2012) 55 717Births (2012) 1301Surviving infants (2012) 1287Urban Population (2012) 72%
HepB3 introduced nationwide 1990sHepB birth dose introduced 1998Current schedule 0, 2 months, 4 months, 6 monthsHepB3 type DTP-HepB-IPV
Neonatal deliveries Reported hepatitis B vaccination coverage Districts by coverage categories*
Vaccination coverage surveys
Survey Location Ages Sample HepB BD HepB3 DTP3 Reference/Notes year enrolled size % % % 2007 Majuro, Ebeye 5–9 years 331 49% 93% not reported Bialek Ped Infect Dis 2010
Hepatitis B serological surveys
Survey Location Ages Sampling Sample HBsAG prevalence Reference/Notes year enrolled base size (95% CI) 2007 Majuro, Ebeye 5–9 years School based 331 1.8% (0.4% – 3.3%) Bialek PID 2010
WHO verification
Status of verifying prevalence targets
Verification started: pendingDecision: n.a.Decision date: n.a.
23
Health facility
Home with SBA
Home with no SBA
Unknown
80.00%20.00%
Vacc
inat
ion
cove
rage
(%)
0
20
40
60
80
100
20122011201020092008
Timely HepB BD HepB3 Any HepB BD
(%) D
istr
icts
201
2
0
20
40
60
80
100
Timely HepB BDHepB3
>94%90%–94%80%–89%50%–79%<50%
Abbreviations: DTP3: 3rd dose of Diphteria, Tetanus, and Pertussis Vaccine; HepB3: at least 3 doses of hepatitis B vaccine; HBsAg: hepatitis B surface antigen; SBA: Skilled Birth Attendant; Timely HepB BD: birth dose within 24 hours Sources: UN, UNICEF and WHO* HepB3 vaccination coverage when available, otherwise graph represents DPT3 coverage.
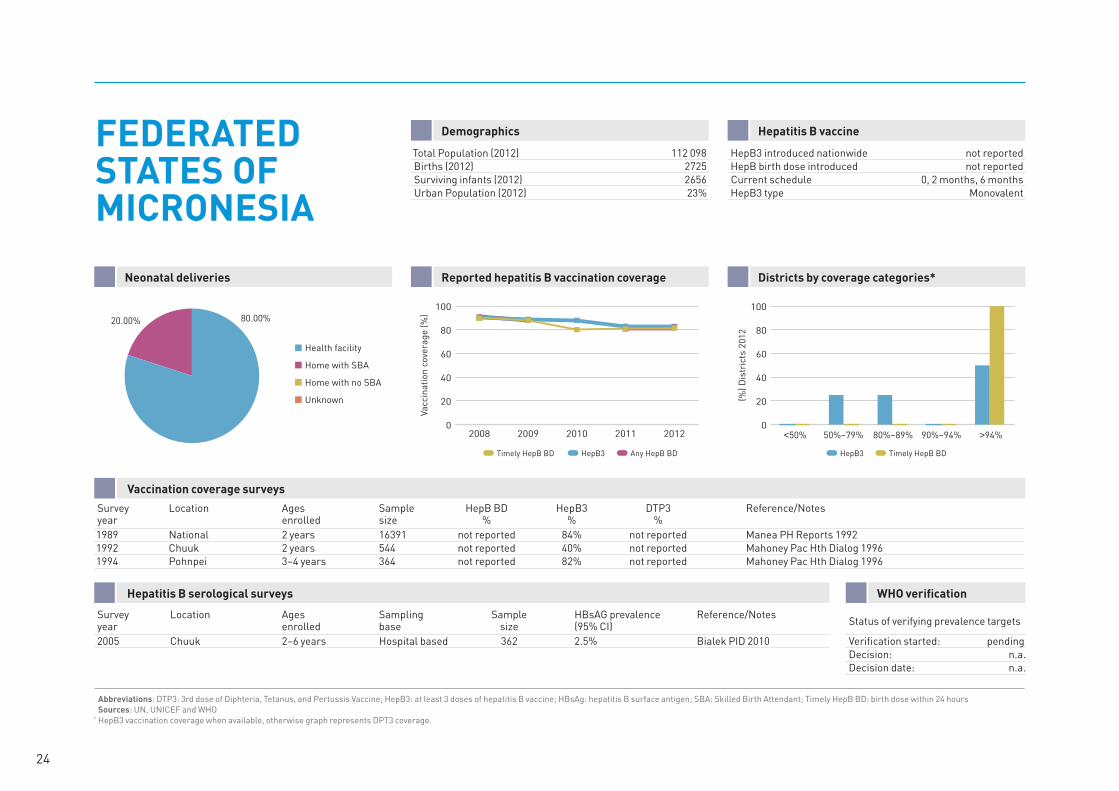
DemographicsFEDERATED STATES OF MICRONESIA
Hepatitis B vaccine
Total Population (2012) 112 098Births (2012) 2725Surviving infants (2012) 2656Urban Population (2012) 23%
HepB3 introduced nationwide not reportedHepB birth dose introduced not reportedCurrent schedule 0, 2 months, 6 monthsHepB3 type Monovalent
Neonatal deliveries Reported hepatitis B vaccination coverage Districts by coverage categories*
Vaccination coverage surveys
Survey Location Ages Sample HepB BD HepB3 DTP3 Reference/Notes year enrolled size % % % 1989 National 2 years 16391 not reported 84% not reported Manea PH Reports 19921992 Chuuk 2 years 544 not reported 40% not reported Mahoney Pac Hth Dialog 19961994 Pohnpei 3–4 years 364 not reported 82% not reported Mahoney Pac Hth Dialog 1996
Hepatitis B serological surveys
Survey Location Ages Sampling Sample HBsAG prevalence Reference/Notes year enrolled base size (95% CI) 2005 Chuuk 2–6 years Hospital based 362 2.5% Bialek PID 2010
WHO verification
Status of verifying prevalence targets
Verification started: pendingDecision: n.a.Decision date: n.a.
24
Health facility
Home with SBA
Home with no SBA
Unknown
99.51%
0.20%0.20%
Vacc
inat
ion
cove
rage
(%)
0
20
40
60
80
100
20122011201020092008
Timely HepB BD HepB3 Any HepB BD
(%) D
istr
icts
201
2
0
20
40
60
80
100
Timely HepB BDHepB3
>94%90%–94%80%–89%50%–79%<50%
Abbreviations: DTP3: 3rd dose of Diphteria, Tetanus, and Pertussis Vaccine; HepB3: at least 3 doses of hepatitis B vaccine; HBsAg: hepatitis B surface antigen; SBA: Skilled Birth Attendant; Timely HepB BD: birth dose within 24 hours Sources: UN, UNICEF and WHO* HepB3 vaccination coverage when available, otherwise graph represents DPT3 coverage.
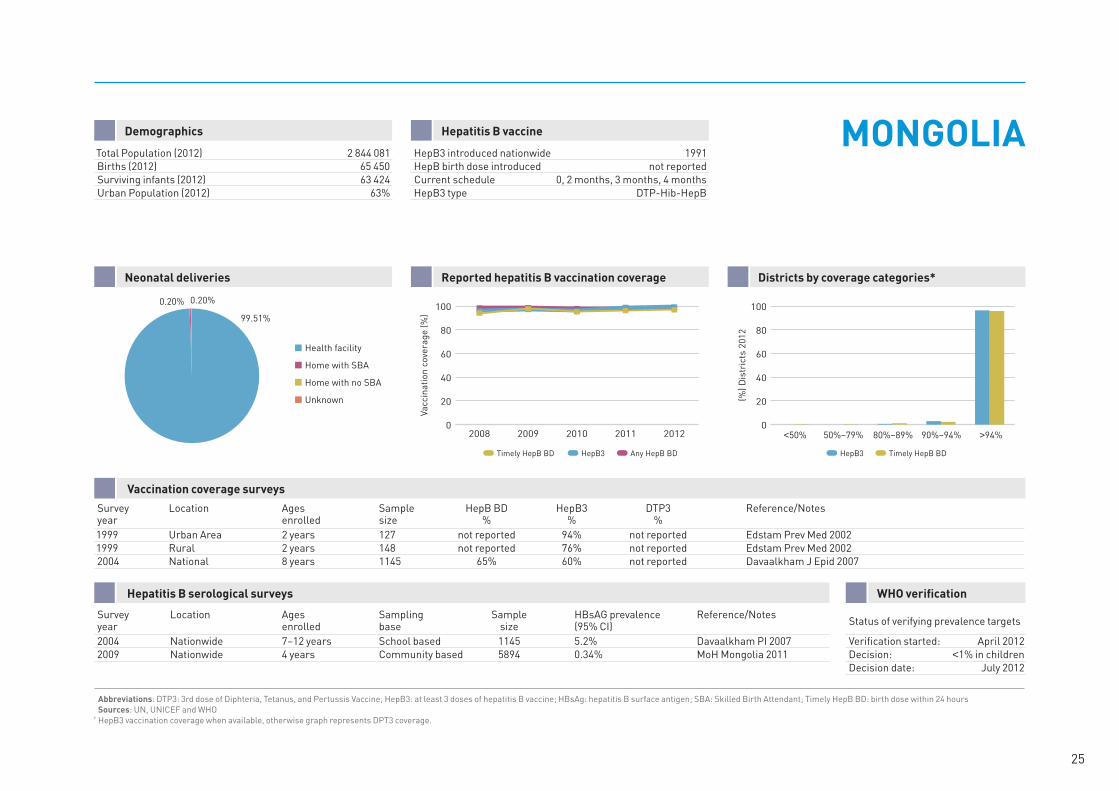
Demographics MONGOLIAHepatitis B vaccine
Total Population (2012) 2 844 081Births (2012) 65 450Surviving infants (2012) 63 424Urban Population (2012) 63%
HepB3 introduced nationwide 1991HepB birth dose introduced not reportedCurrent schedule 0, 2 months, 3 months, 4 monthsHepB3 type DTP-Hib-HepB
Neonatal deliveries Reported hepatitis B vaccination coverage Districts by coverage categories*
Vaccination coverage surveys
Survey Location Ages Sample HepB BD HepB3 DTP3 Reference/Notes year enrolled size % % % 1999 Urban Area 2 years 127 not reported 94% not reported Edstam Prev Med 20021999 Rural 2 years 148 not reported 76% not reported Edstam Prev Med 20022004 National 8 years 1145 65% 60% not reported Davaalkham J Epid 2007
Hepatitis B serological surveys
Survey Location Ages Sampling Sample HBsAG prevalence Reference/Notes year enrolled base size (95% CI) 2004 Nationwide 7–12 years School based 1145 5.2% Davaalkham PI 20072009 Nationwide 4 years Community based 5894 0.34% MoH Mongolia 2011
WHO verification
Status of verifying prevalence targets
Verification started: April 2012Decision: <1% in childrenDecision date: July 2012
25
Health facility
Home with SBA
Home with no SBA
Unknown
97.40%
Vacc
inat
ion
cove
rage
(%)
0
20
40
60
80
100
20122011201020092008
Timely HepB BD HepB3 Any HepB BD
(%) D
istr
icts
201
2
0
20
40
60
80
100
Timely HepB BDHepB3
>94%90%–94%80%–89%50%–79%<50%
Abbreviations: DTP3: 3rd dose of Diphteria, Tetanus, and Pertussis Vaccine; HepB3: at least 3 doses of hepatitis B vaccine; HBsAg: hepatitis B surface antigen; SBA: Skilled Birth Attendant; Timely HepB BD: birth dose within 24 hours Sources: UN, UNICEF and WHO* HepB3 vaccination coverage when available, otherwise graph represents DPT3 coverage.
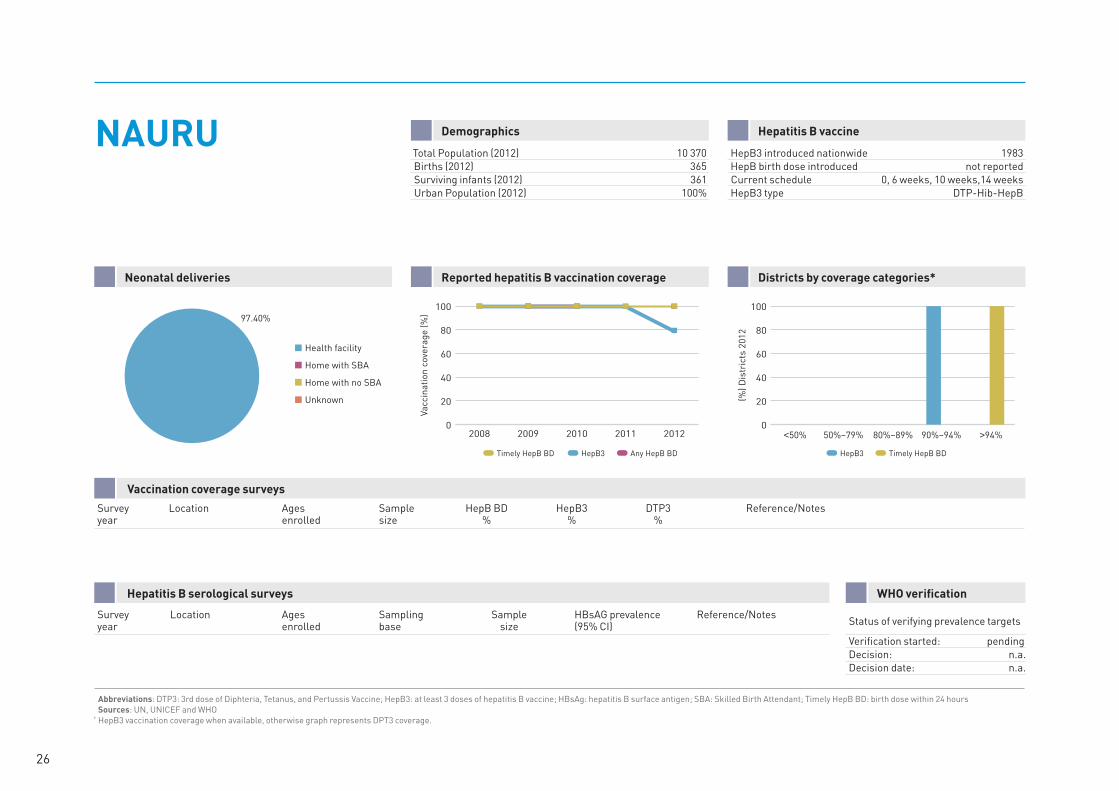
DemographicsNAURU Hepatitis B vaccine
Total Population (2012) 10 370Births (2012) 365Surviving infants (2012) 361Urban Population (2012) 100%
HepB3 introduced nationwide 1983HepB birth dose introduced not reportedCurrent schedule 0, 6 weeks, 10 weeks,14 weeksHepB3 type DTP-Hib-HepB
Neonatal deliveries Reported hepatitis B vaccination coverage Districts by coverage categories*
Vaccination coverage surveys
Survey Location Ages Sample HepB BD HepB3 DTP3 Reference/Notes year enrolled size % % %
Hepatitis B serological surveys
Survey Location Ages Sampling Sample HBsAG prevalence Reference/Notes year enrolled base size (95% CI)
WHO verification
Status of verifying prevalence targets
Verification started: pendingDecision: n.a.Decision date: n.a.
26
Health facility
Home with SBA
Home with no SBA
Unknown
87.60%4.37%8.03%
Vacc
inat
ion
cove
rage
(%)
0
20
40
60
80
100
20122011201020092008
Timely HepB BD HepB3 Any HepB BD
(%) D
istr
icts
201
2
0
20
40
60
80
100
Timely HepB BDHepB3
>94%90%–94%80%–89%50%–79%<50%
Abbreviations: DTP3: 3rd dose of Diphteria, Tetanus, and Pertussis Vaccine; HepB3: at least 3 doses of hepatitis B vaccine; HBsAg: hepatitis B surface antigen; SBA: Skilled Birth Attendant; Timely HepB BD: birth dose within 24 hours Sources: UN, UNICEF and WHO* HepB3 vaccination coverage when available, otherwise graph represents DPT3 coverage.
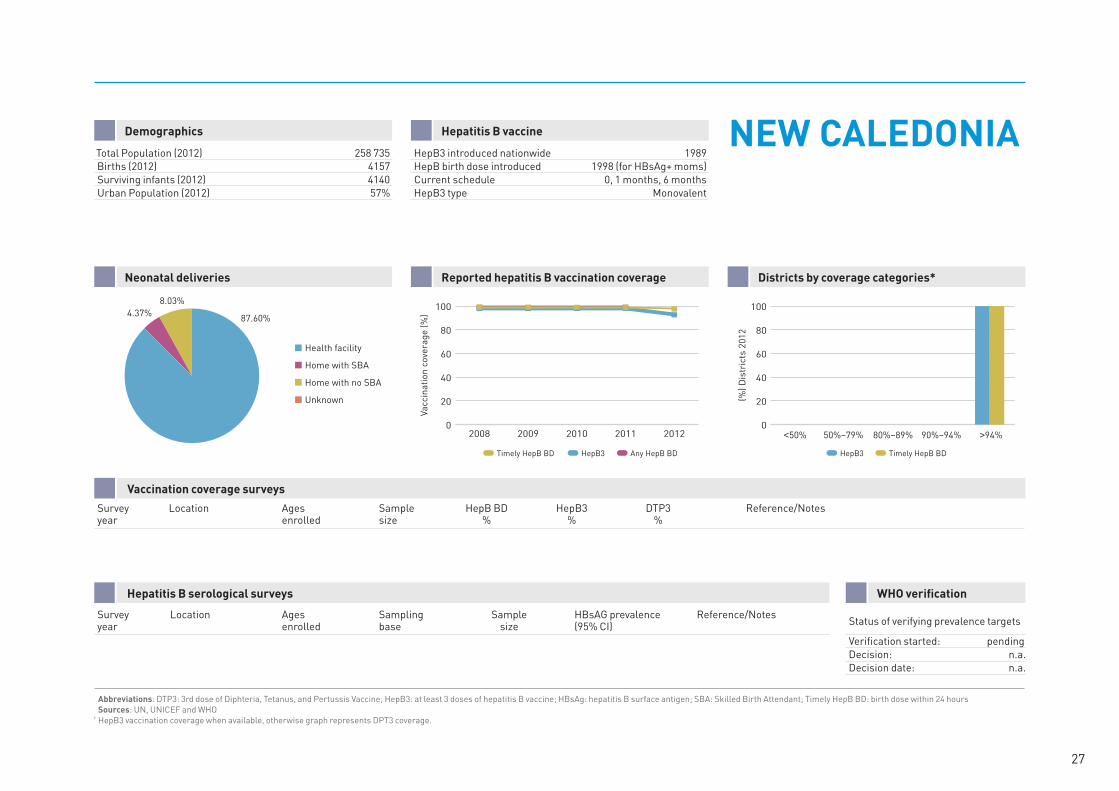
Demographics NEW CALEDONIAHepatitis B vaccine
Total Population (2012) 258 735Births (2012) 4157Surviving infants (2012) 4140Urban Population (2012) 57%
HepB3 introduced nationwide 1989HepB birth dose introduced 1998 (for HBsAg+ moms)Current schedule 0, 1 months, 6 monthsHepB3 type Monovalent
Neonatal deliveries Reported hepatitis B vaccination coverage Districts by coverage categories*
Vaccination coverage surveys
Survey Location Ages Sample HepB BD HepB3 DTP3 Reference/Notes year enrolled size % % %
Hepatitis B serological surveys
Survey Location Ages Sampling Sample HBsAG prevalence Reference/Notes year enrolled base size (95% CI)
WHO verification
Status of verifying prevalence targets
Verification started: pendingDecision: n.a.Decision date: n.a.
27
Health facility
Home with SBA
Home with no SBA
Unknown
95.30%
4.70%
Vacc
inat
ion
cove
rage
(%)
0
20
40
60
80
100
20122011201020092008
Timely HepB BD HepB3 Any HepB BD
(%) D
istr
icts
201
2
0
20
40
60
80
100
Timely HepB BDHepB3
>94%90%–94%80%–89%50%–79%<50%
Abbreviations: DTP3: 3rd dose of Diphteria, Tetanus, and Pertussis Vaccine; HepB3: at least 3 doses of hepatitis B vaccine; HBsAg: hepatitis B surface antigen; SBA: Skilled Birth Attendant; Timely HepB BD: birth dose within 24 hours Sources: UN, UNICEF and WHO* HepB3 vaccination coverage when available, otherwise graph represents DPT3 coverage.
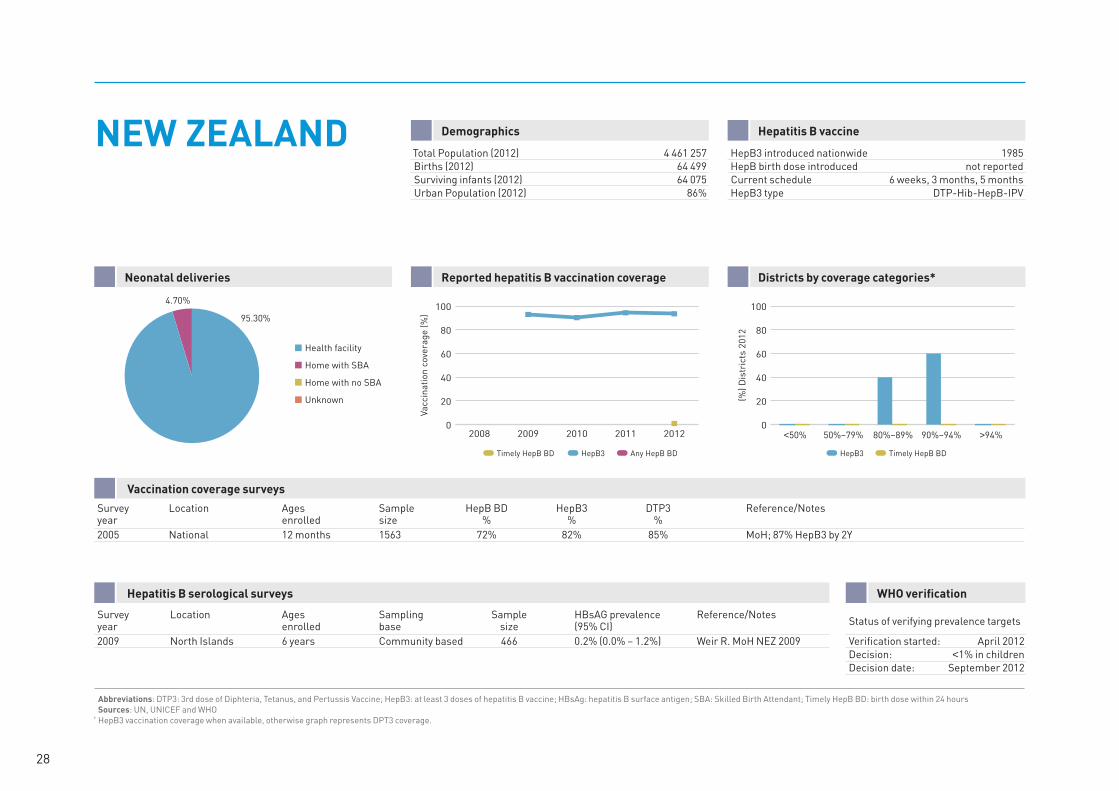
DemographicsNEW ZEALAND Hepatitis B vaccine
Total Population (2012) 4 461 257Births (2012) 64 499Surviving infants (2012) 64 075Urban Population (2012) 86%
HepB3 introduced nationwide 1985HepB birth dose introduced not reportedCurrent schedule 6 weeks, 3 months, 5 monthsHepB3 type DTP-Hib-HepB-IPV
Neonatal deliveries Reported hepatitis B vaccination coverage Districts by coverage categories*
Vaccination coverage surveys
Survey Location Ages Sample HepB BD HepB3 DTP3 Reference/Notes year enrolled size % % % 2005 National 12 months 1563 72% 82% 85% MoH; 87% HepB3 by 2Y
Hepatitis B serological surveys
Survey Location Ages Sampling Sample HBsAG prevalence Reference/Notes year enrolled base size (95% CI) 2009 North Islands 6 years Community based 466 0.2% (0.0% – 1.2%) Weir R. MoH NEZ 2009
WHO verification
Status of verifying prevalence targets
Verification started: April 2012Decision: <1% in childrenDecision date: September 2012
28
Health facility
Home with SBA
Home with no SBA
Unknown
100.0%
Vacc
inat
ion
cove
rage
(%)
0
20
40
60
80
100
20122011201020092008
Timely HepB BD HepB3 Any HepB BD
(%) D
istr
icts
201
2
0
20
40
60
80
100
Timely HepB BDHepB3
>94%90%–94%80%–89%50%–79%<50%
Abbreviations: DTP3: 3rd dose of Diphteria, Tetanus, and Pertussis Vaccine; HepB3: at least 3 doses of hepatitis B vaccine; HBsAg: hepatitis B surface antigen; SBA: Skilled Birth Attendant; Timely HepB BD: birth dose within 24 hours Sources: UN, UNICEF and WHO* HepB3 vaccination coverage when available, otherwise graph represents DPT3 coverage.
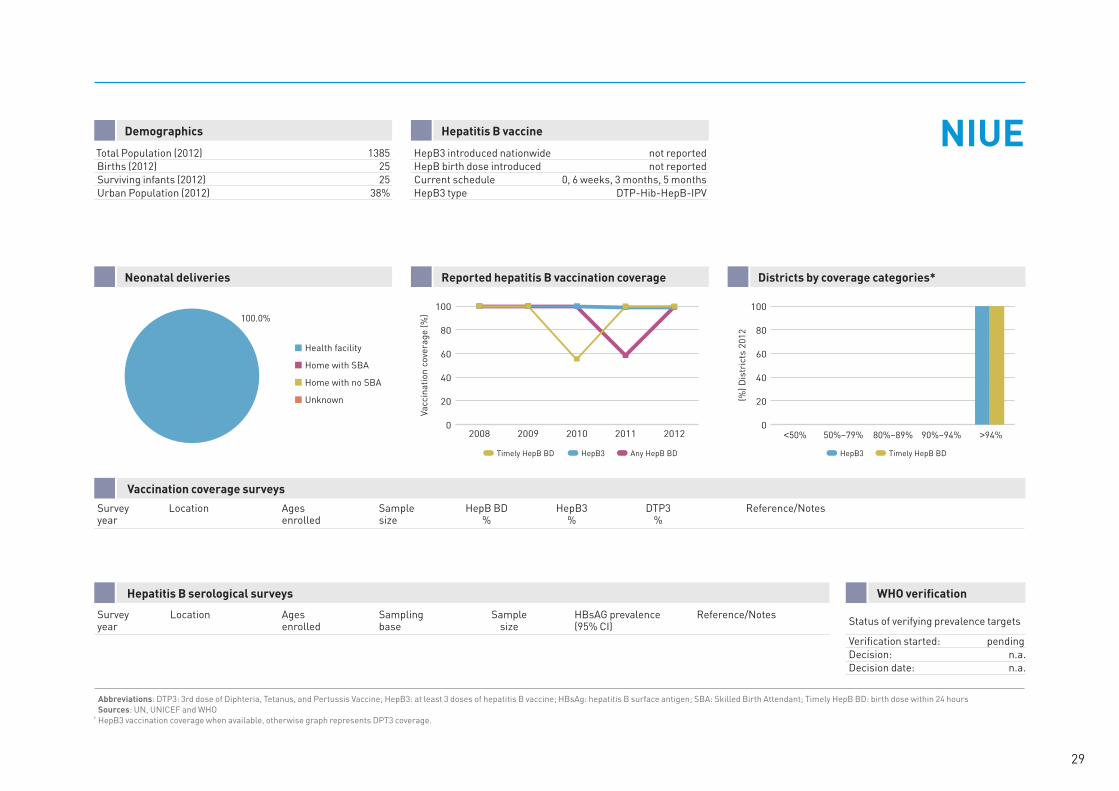
Demographics NIUEHepatitis B vaccine
Total Population (2012) 1385Births (2012) 25Surviving infants (2012) 25Urban Population (2012) 38%
HepB3 introduced nationwide not reportedHepB birth dose introduced not reportedCurrent schedule 0, 6 weeks, 3 months, 5 monthsHepB3 type DTP-Hib-HepB-IPV
Neonatal deliveries Reported hepatitis B vaccination coverage Districts by coverage categories*
Vaccination coverage surveys
Survey Location Ages Sample HepB BD HepB3 DTP3 Reference/Notes year enrolled size % % %
Hepatitis B serological surveys
Survey Location Ages Sampling Sample HBsAG prevalence Reference/Notes year enrolled base size (95% CI)
WHO verification
Status of verifying prevalence targets
Verification started: pendingDecision: n.a.Decision date: n.a.
29
Health facility
Home with SBA
Home with no SBA
Unknown
100.0%
Vacc
inat
ion
cove
rage
(%)
0
20
40
60
80
100
20122011201020092008
Timely HepB BD HepB3 Any HepB BD
(%) D
istr
icts
201
2
0
20
40
60
80
100
Timely HepB BDHepB3
>94%90%–94%80%–89%50%–79%<50%
Abbreviations: DTP3: 3rd dose of Diphteria, Tetanus, and Pertussis Vaccine; HepB3: at least 3 doses of hepatitis B vaccine; HBsAg: hepatitis B surface antigen; SBA: Skilled Birth Attendant; Timely HepB BD: birth dose within 24 hours Sources: UN, UNICEF and WHO* HepB3 vaccination coverage when available, otherwise graph represents DPT3 coverage.
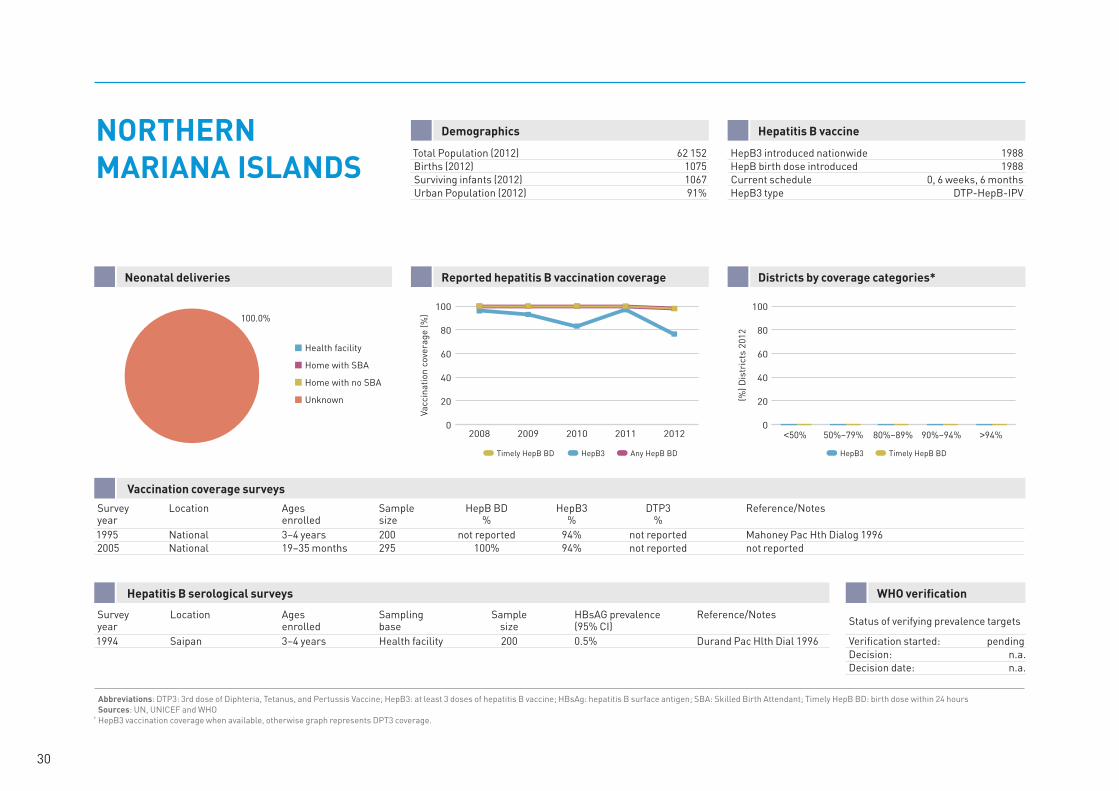
DemographicsNORTHERN MARIANA ISLANDS
Hepatitis B vaccine
Total Population (2012) 62 152Births (2012) 1075Surviving infants (2012) 1067Urban Population (2012) 91%
HepB3 introduced nationwide 1988HepB birth dose introduced 1988Current schedule 0, 6 weeks, 6 monthsHepB3 type DTP-HepB-IPV
Neonatal deliveries Reported hepatitis B vaccination coverage Districts by coverage categories*
Vaccination coverage surveys
Survey Location Ages Sample HepB BD HepB3 DTP3 Reference/Notes year enrolled size % % % 1995 National 3–4 years 200 not reported 94% not reported Mahoney Pac Hth Dialog 19962005 National 19–35 months 295 100% 94% not reported not reported
Hepatitis B serological surveys
Survey Location Ages Sampling Sample HBsAG prevalence Reference/Notes year enrolled base size (95% CI) 1994 Saipan 3–4 years Health facility 200 0.5% Durand Pac Hlth Dial 1996
WHO verification
Status of verifying prevalence targets
Verification started: pendingDecision: n.a.Decision date: n.a.
30
Health facility
Home with SBA
Home with no SBA
Unknown
100.0%
Vacc
inat
ion
cove
rage
(%)
0
20
40
60
80
100
20122011201020092008
Timely HepB BD HepB3 Any HepB BD
(%) D
istr
icts
201
2
0
20
40
60
80
100
Timely HepB BDHepB3
>94%90%–94%80%–89%50%–79%<50%
Abbreviations: DTP3: 3rd dose of Diphteria, Tetanus, and Pertussis Vaccine; HepB3: at least 3 doses of hepatitis B vaccine; HBsAg: hepatitis B surface antigen; SBA: Skilled Birth Attendant; Timely HepB BD: birth dose within 24 hours Sources: UN, UNICEF and WHO* HepB3 vaccination coverage when available, otherwise graph represents DPT3 coverage.
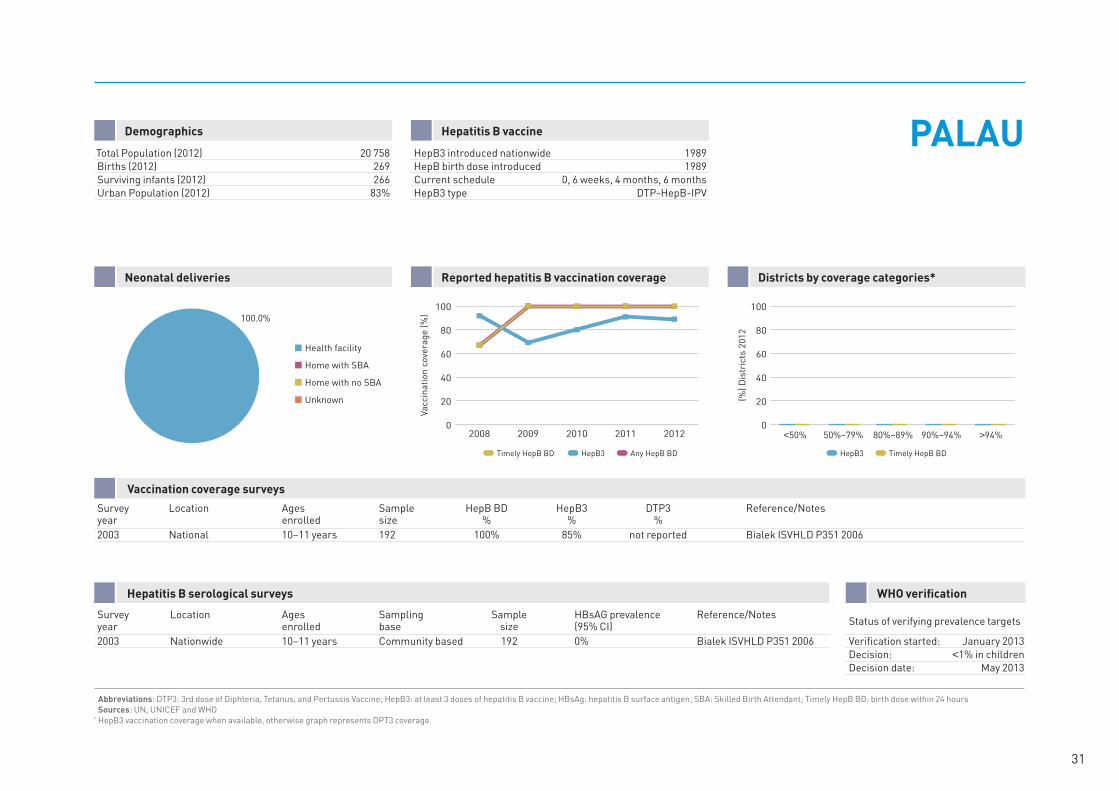
Demographics PALAUHepatitis B vaccine
Total Population (2012) 20 758Births (2012) 269Surviving infants (2012) 266Urban Population (2012) 83%
HepB3 introduced nationwide 1989HepB birth dose introduced 1989Current schedule 0, 6 weeks, 4 months, 6 monthsHepB3 type DTP-HepB-IPV
Neonatal deliveries Reported hepatitis B vaccination coverage Districts by coverage categories*
Vaccination coverage surveys
Survey Location Ages Sample HepB BD HepB3 DTP3 Reference/Notes year enrolled size % % % 2003 National 10–11 years 192 100% 85% not reported Bialek ISVHLD P351 2006
Hepatitis B serological surveys
Survey Location Ages Sampling Sample HBsAG prevalence Reference/Notes year enrolled base size (95% CI) 2003 Nationwide 10–11 years Community based 192 0% Bialek ISVHLD P351 2006
WHO verification
Status of verifying prevalence targets
Verification started: January 2013Decision: <1% in childrenDecision date: May 2013
31
Health facility
Home with SBA
Home with no SBA
Unknown
40.00%60.00%
Vacc
inat
ion
Cov
erag
e (%
)0
20
40
60
80
100
20122011201020092008
Timely HepB BD HepB3 Any HepB BD
(%) D
istr
icts
201
2
0
20
40
60
80
100
Timely HepB BDHepB3
>94%90%–94%80%–89%50%–79%<50%
Abbreviations: DTP3: 3rd dose of Diphteria, Tetanus, and Pertussis Vaccine; HepB3: at least 3 doses of hepatitis B vaccine; HBsAg: hepatitis B surface antigen; SBA: Skilled Birth Attendant; Timely HepB BD: birth dose within 24 hours Sources: UN, UNICEF and WHO* HepB3 vaccination coverage when available, otherwise graph represents DPT3 coverage.
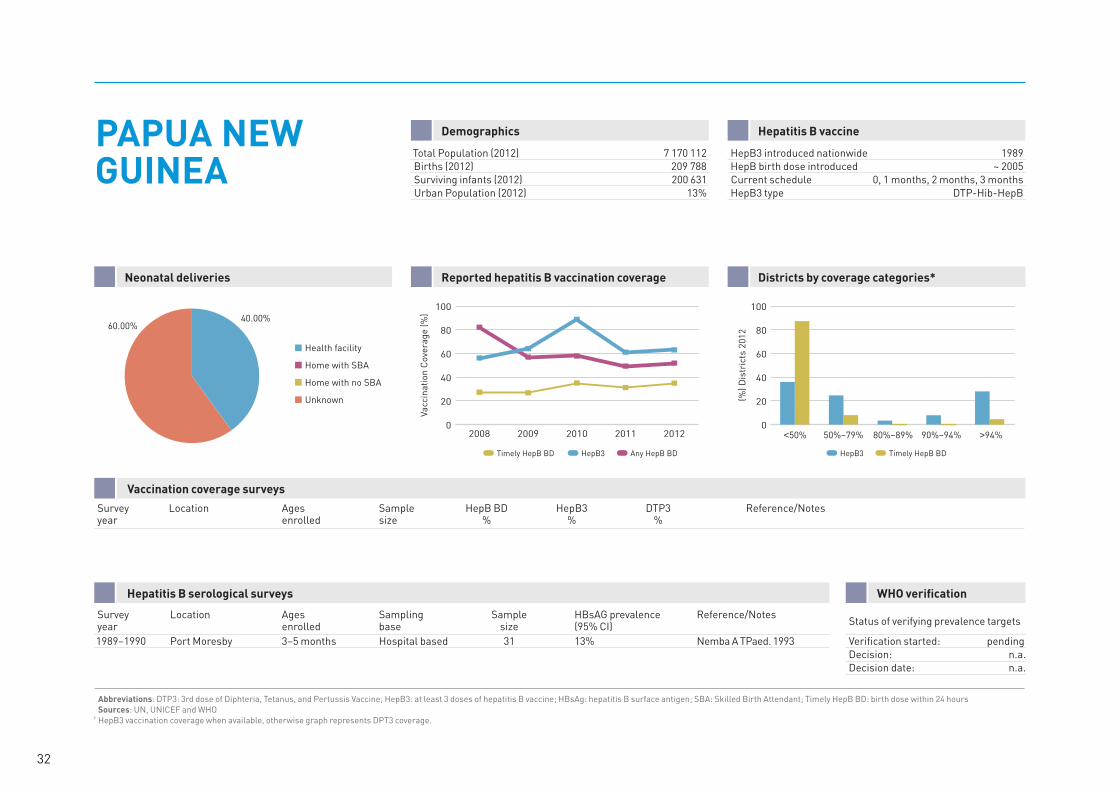
DemographicsPAPUA NEW GUINEA
Hepatitis B vaccine
Total Population (2012) 7 170 112Births (2012) 209 788Surviving infants (2012) 200 631Urban Population (2012) 13%
HepB3 introduced nationwide 1989HepB birth dose introduced ~ 2005Current schedule 0, 1 months, 2 months, 3 monthsHepB3 type DTP-Hib-HepB
Neonatal deliveries Reported hepatitis B vaccination coverage Districts by coverage categories*
Vaccination coverage surveys
Survey Location Ages Sample HepB BD HepB3 DTP3 Reference/Notes year enrolled size % % %
Hepatitis B serological surveys
Survey Location Ages Sampling Sample HBsAG prevalence Reference/Notes year enrolled base size (95% CI) 1989–1990 Port Moresby 3–5 months Hospital based 31 13% Nemba A TPaed. 1993
WHO verification
Status of verifying prevalence targets
Verification started: pendingDecision: n.a.Decision date: n.a.
32
33
Health facility
Home with SBA
Home with no SBA
Unknown
44.0%
18.20%
37.80%
Vacc
inat
ion
cove
rage
(%)
0
20
40
60
80
100
20122011201020092008
Timely HepB BD HepB3 Any HepB BD
(%) D
istr
icts
201
2
0
20
40
60
80
100
Timely HepB BDHepB3
>94%90%–94%80%–89%50%–79%<50%
Abbreviations: DTP3: 3rd dose of Diphteria, Tetanus, and Pertussis Vaccine; HepB3: at least 3 doses of hepatitis B vaccine; HBsAg: hepatitis B surface antigen; SBA: Skilled Birth Attendant; Timely HepB BD: birth dose within 24 hours Sources: UN, UNICEF and WHO* HepB3 vaccination coverage when available, otherwise graph represents DPT3 coverage.
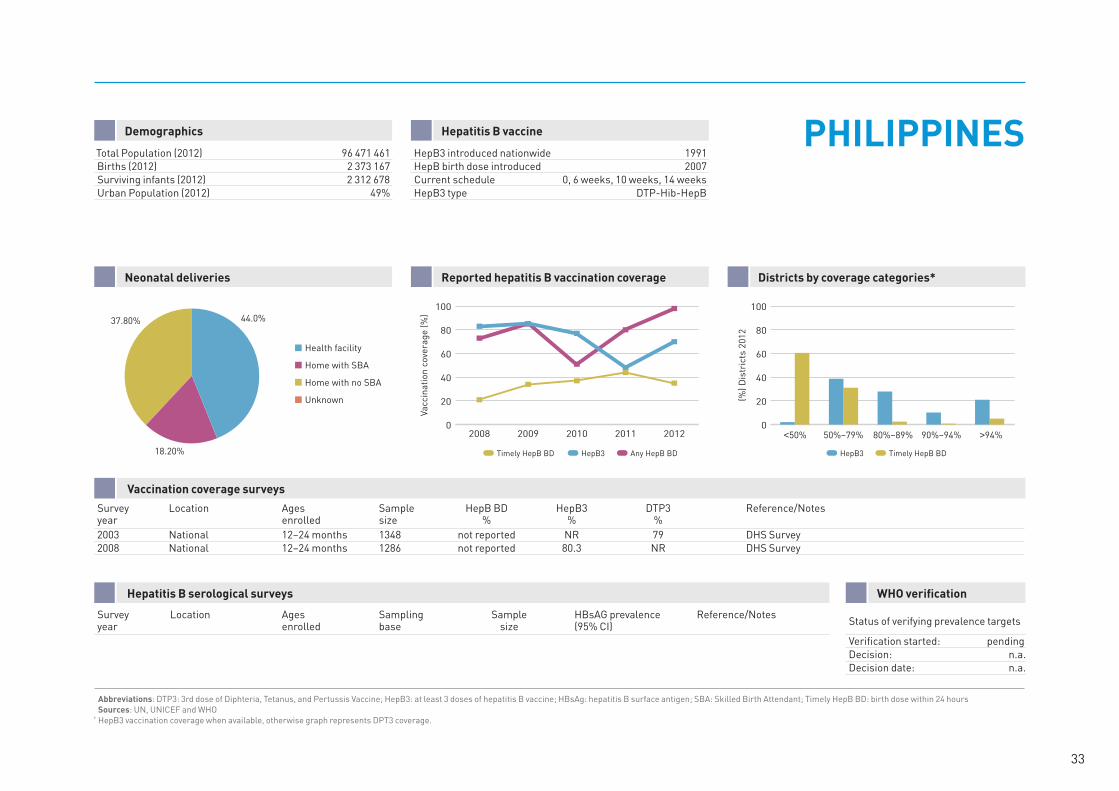
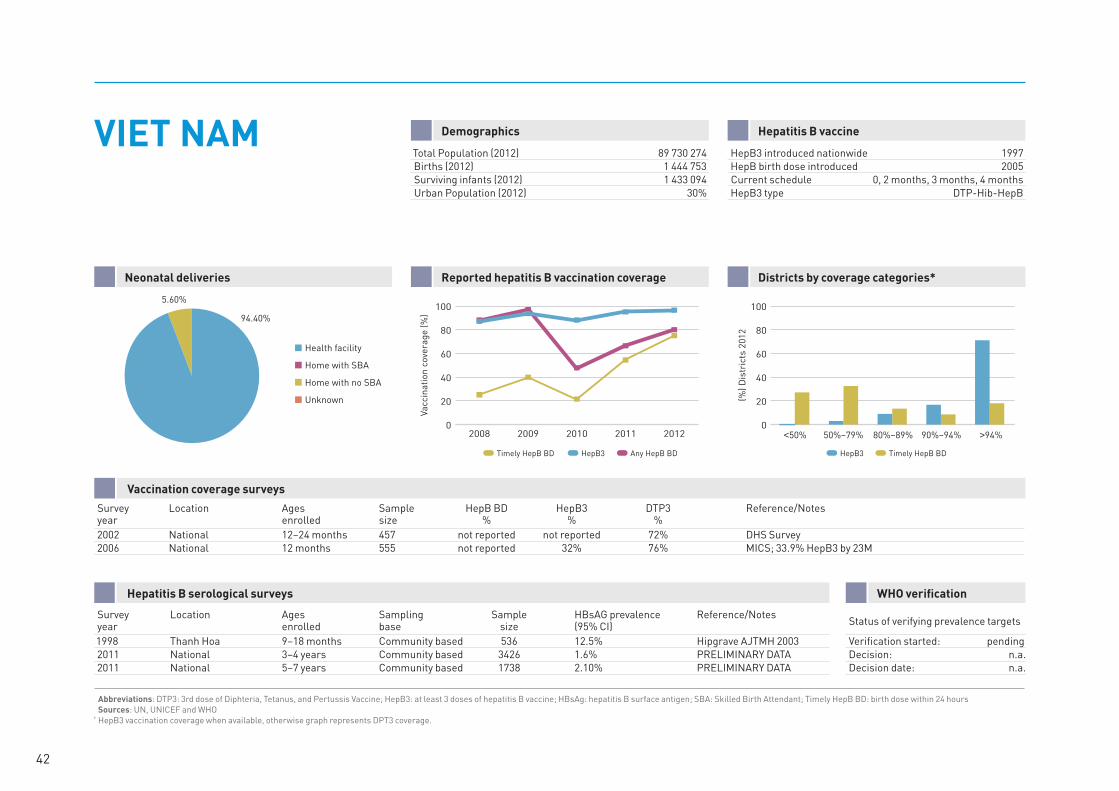
Demographics PHILIPPINESHepatitis B vaccine
Total Population (2012) 96 471 461Births (2012) 2 373 167Surviving infants (2012) 2 312 678Urban Population (2012) 49%
HepB3 introduced nationwide 1991HepB birth dose introduced 2007Current schedule 0, 6 weeks, 10 weeks, 14 weeksHepB3 type DTP-Hib-HepB
Neonatal deliveries Reported hepatitis B vaccination coverage Districts by coverage categories*
Vaccination coverage surveys
Survey Location Ages Sample HepB BD HepB3 DTP3 Reference/Notes year enrolled size % % % 2003 National 12–24 months 1348 not reported NR 79 DHS Survey 2008 National 12–24 months 1286 not reported 80.3 NR DHS Survey
Hepatitis B serological surveys
Survey Location Ages Sampling Sample HBsAG prevalence Reference/Notes year enrolled base size (95% CI)
WHO verification
Status of verifying prevalence targets
Verification started: pendingDecision: n.a.Decision date: n.a.
34
Health facility
Home with SBA
Home with no SBA
Unknown
99.90%
0.10%
Vacc
inat
ion
Cov
erag
e (%
)0
20
40
60
80
100
20122011201020092008
Timely HepB BD HepB3 Any HepB BD
(%) D
istr
icts
201
2
0
20
40
60
80
100
Timely HepB BDHepB3
>94%90%–94%80%–89%50%–79%<50%
Abbreviations: DTP3: 3rd dose of Diphteria, Tetanus, and Pertussis Vaccine; HepB3: at least 3 doses of hepatitis B vaccine; HBsAg: hepatitis B surface antigen; SBA: Skilled Birth Attendant; Timely HepB BD: birth dose within 24 hours Sources: UN, UNICEF and WHO* HepB3 vaccination coverage when available, otherwise graph represents DPT3 coverage.
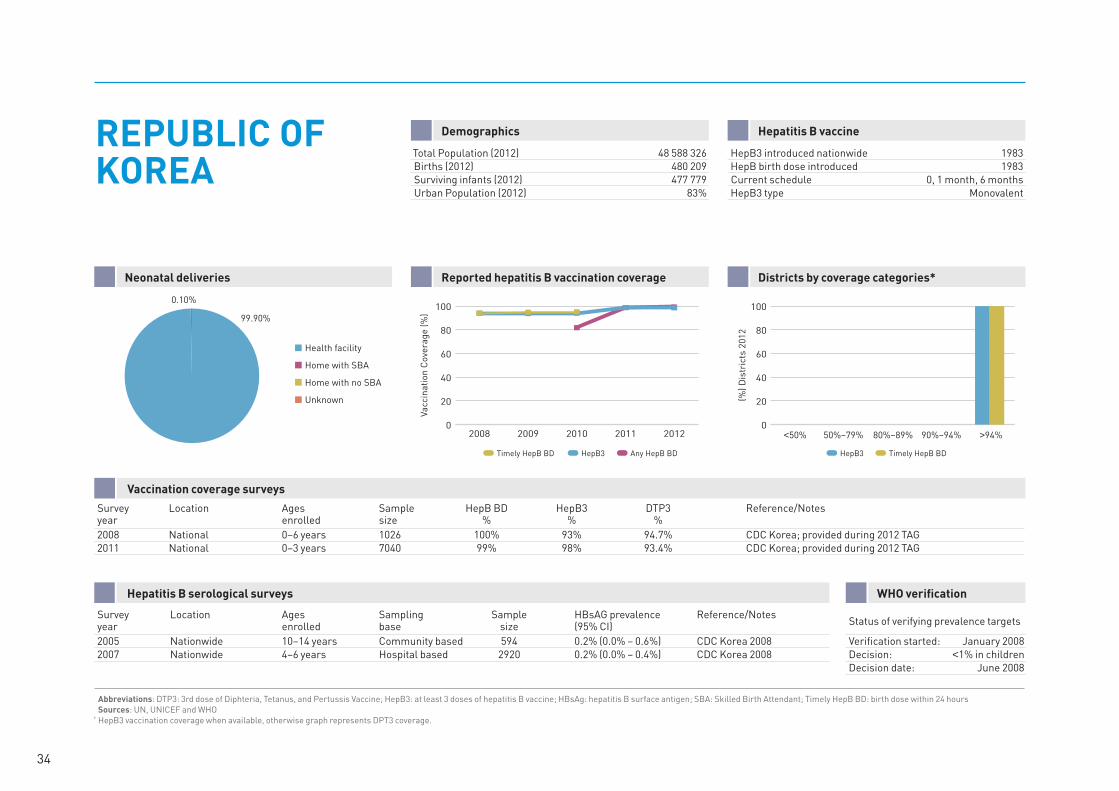
DemographicsREPUBLIC OF KOREA
Hepatitis B vaccine
Total Population (2012) 48 588 326Births (2012) 480 209Surviving infants (2012) 477 779Urban Population (2012) 83%
HepB3 introduced nationwide 1983HepB birth dose introduced 1983Current schedule 0, 1 month, 6 monthsHepB3 type Monovalent
Neonatal deliveries Reported hepatitis B vaccination coverage Districts by coverage categories*
Vaccination coverage surveys
Survey Location Ages Sample HepB BD HepB3 DTP3 Reference/Notes year enrolled size % % % 2008 National 0–6 years 1026 100% 93% 94.7% CDC Korea; provided during 2012 TAG2011 National 0–3 years 7040 99% 98% 93.4% CDC Korea; provided during 2012 TAG
Hepatitis B serological surveys
Survey Location Ages Sampling Sample HBsAG prevalence Reference/Notes year enrolled base size (95% CI) 2005 Nationwide 10–14 years Community based 594 0.2% (0.0% – 0.6%) CDC Korea 20082007 Nationwide 4–6 years Hospital based 2920 0.2% (0.0% – 0.4%) CDC Korea 2008
WHO verification
Status of verifying prevalence targets
Verification started: January 2008Decision: <1% in childrenDecision date: June 2008
Health facility
Home with SBA
Home with no SBA
Unknown
81.00%19.00%
Vacc
inat
ion
cove
rage
(%)
0
20
40
60
80
100
20122011201020092008
Timely HepB BD HepB3 Any HepB BD
(%) D
istr
icts
201
2
0
20
40
60
80
100
Timely HepB BDHepB3
>94%90%–94%80%–89%50%–79%<50%
Abbreviations: DTP3: 3rd dose of Diphteria, Tetanus, and Pertussis Vaccine; HepB3: at least 3 doses of hepatitis B vaccine; HBsAg: hepatitis B surface antigen; SBA: Skilled Birth Attendant; Timely HepB BD: birth dose within 24 hours Sources: UN, UNICEF and WHO* HepB3 vaccination coverage when available, otherwise graph represents DPT3 coverage.
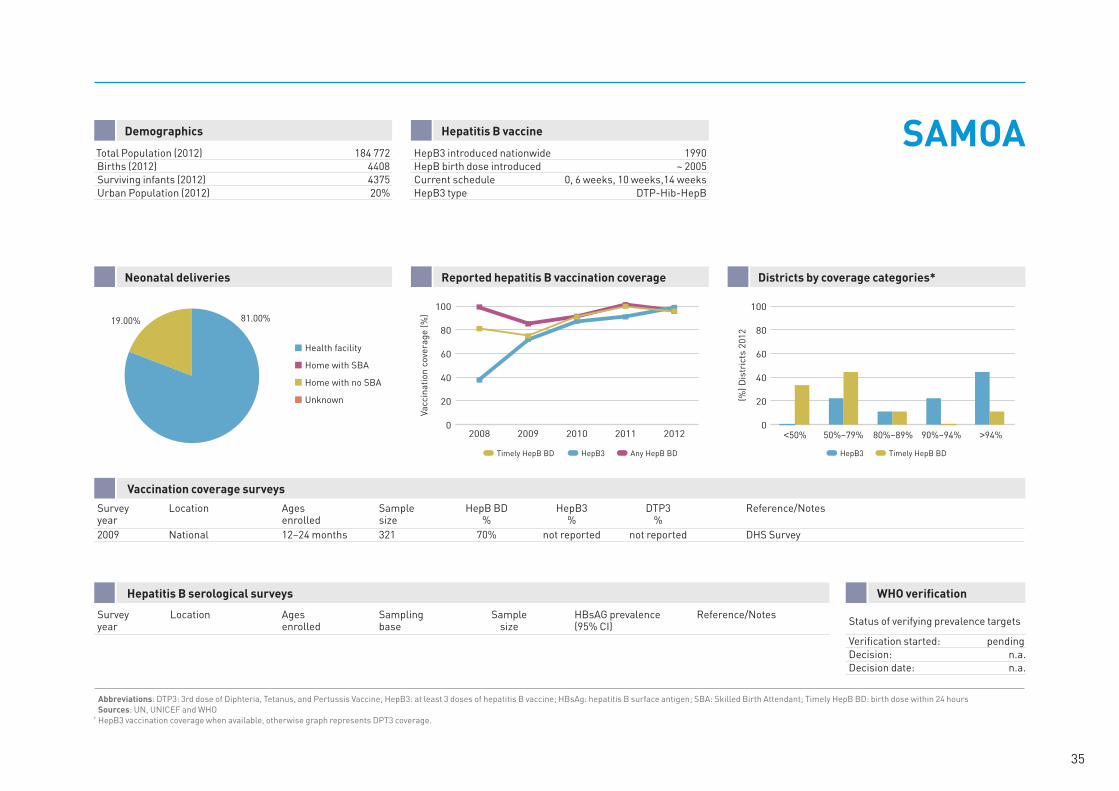
Demographics SAMOAHepatitis B vaccine
Total Population (2012) 184 772Births (2012) 4408Surviving infants (2012) 4375Urban Population (2012) 20%
HepB3 introduced nationwide 1990HepB birth dose introduced ~ 2005Current schedule 0, 6 weeks, 10 weeks,14 weeksHepB3 type DTP-Hib-HepB
Neonatal deliveries Reported hepatitis B vaccination coverage Districts by coverage categories*
Vaccination coverage surveys
Survey Location Ages Sample HepB BD HepB3 DTP3 Reference/Notes year enrolled size % % % 2009 National 12–24 months 321 70% not reported not reported DHS Survey
Hepatitis B serological surveys
Survey Location Ages Sampling Sample HBsAG prevalence Reference/Notes year enrolled base size (95% CI)
WHO verification
Status of verifying prevalence targets
Verification started: pendingDecision: n.a.Decision date: n.a.
35
Health facility
Home with SBA
Home with no SBA
Unknown
99.74%
0.26%
Vacc
inat
ion
cove
rage
(%)
0
20
40
60
80
100
20122011201020092008
Timely HepB BD HepB3 Any HepB BD
(%) D
istr
icts
201
2
0
20
40
60
80
100
Timely HepB BDHepB3
>94%90%–94%80%–89%50%–79%<50%
Abbreviations: DTP3: 3rd dose of Diphteria, Tetanus, and Pertussis Vaccine; HepB3: at least 3 doses of hepatitis B vaccine; HBsAg: hepatitis B surface antigen; SBA: Skilled Birth Attendant; Timely HepB BD: birth dose within 24 hours Sources: UN, UNICEF and WHO* HepB3 vaccination coverage when available, otherwise graph represents DPT3 coverage.
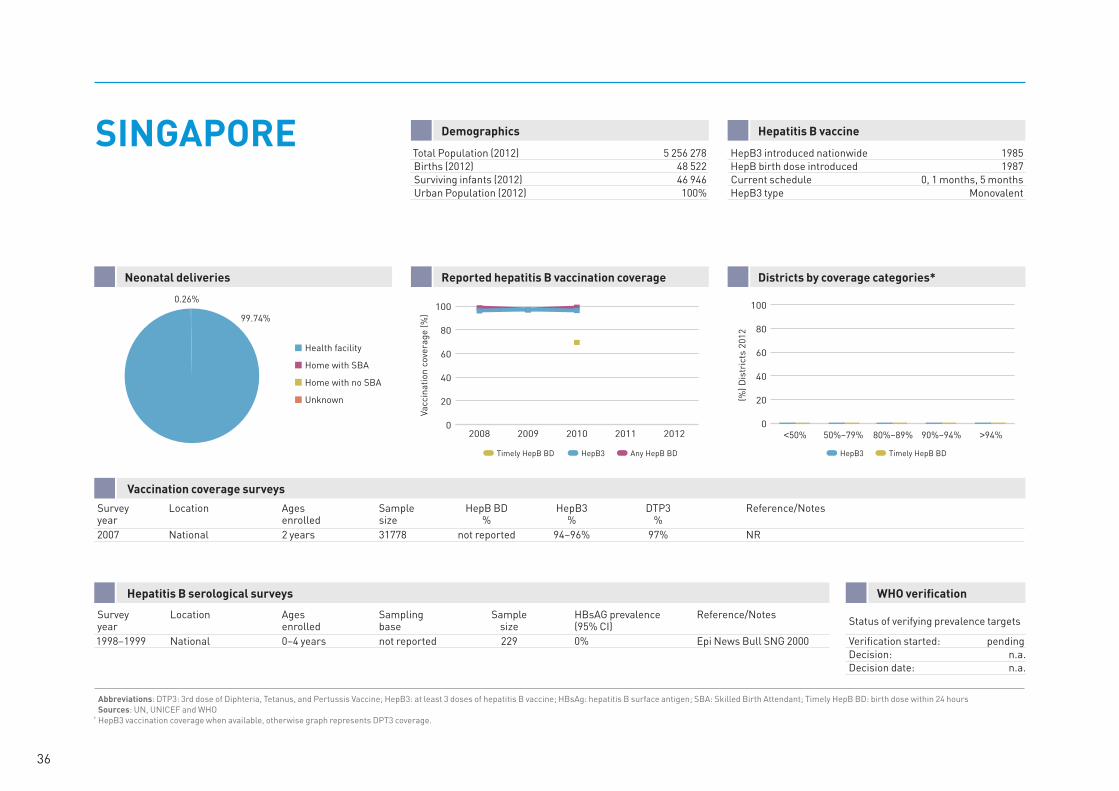
DemographicsSINGAPORE Hepatitis B vaccine
Total Population (2012) 5 256 278Births (2012) 48 522Surviving infants (2012) 46 946Urban Population (2012) 100%
HepB3 introduced nationwide 1985HepB birth dose introduced 1987Current schedule 0, 1 months, 5 monthsHepB3 type Monovalent
Neonatal deliveries Reported hepatitis B vaccination coverage Districts by coverage categories*
Vaccination coverage surveys
Survey Location Ages Sample HepB BD HepB3 DTP3 Reference/Notes year enrolled size % % % 2007 National 2 years 31778 not reported 94–96% 97% NR
Hepatitis B serological surveys
Survey Location Ages Sampling Sample HBsAG prevalence Reference/Notes year enrolled base size (95% CI) 1998–1999 National 0–4 years not reported 229 0% Epi News Bull SNG 2000
WHO verification
Status of verifying prevalence targets
Verification started: pendingDecision: n.a.Decision date: n.a.
36
Health facility
Home with SBA
Home with no SBA
Unknown
85.00%1.00%
14.00%
Vacc
inat
ion
cove
rage
(%)
0
20
40
60
80
100
20122011201020092008
Timely HepB BD HepB3 Any HepB BD
(%) D
istr
icts
201
2
0
20
40
60
80
100
Timely HepB BDHepB3
>94%90%–94%80%–89%50%–79%<50%
Abbreviations: DTP3: 3rd dose of Diphteria, Tetanus, and Pertussis Vaccine; HepB3: at least 3 doses of hepatitis B vaccine; HBsAg: hepatitis B surface antigen; SBA: Skilled Birth Attendant; Timely HepB BD: birth dose within 24 hours Sources: UN, UNICEF and WHO* HepB3 vaccination coverage when available, otherwise graph represents DPT3 coverage.
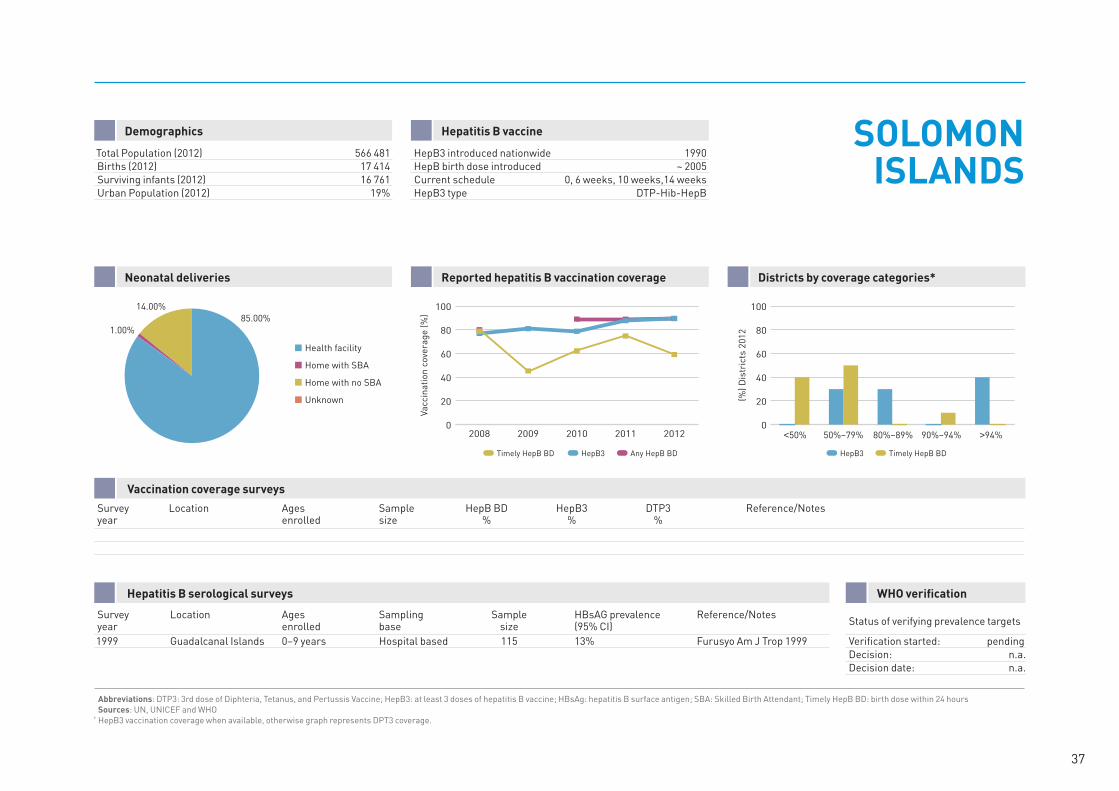
Demographics SOLOMON ISLANDS
Hepatitis B vaccine
Total Population (2012) 566 481Births (2012) 17 414Surviving infants (2012) 16 761Urban Population (2012) 19%
HepB3 introduced nationwide 1990HepB birth dose introduced ~ 2005Current schedule 0, 6 weeks, 10 weeks,14 weeksHepB3 type DTP-Hib-HepB
Neonatal deliveries Reported hepatitis B vaccination coverage Districts by coverage categories*
Vaccination coverage surveys
Survey Location Ages Sample HepB BD HepB3 DTP3 Reference/Notes year enrolled size % % %
Hepatitis B serological surveys
Survey Location Ages Sampling Sample HBsAG prevalence Reference/Notes year enrolled base size (95% CI) 1999 Guadalcanal Islands 0–9 years Hospital based 115 13% Furusyo Am J Trop 1999
WHO verification
Status of verifying prevalence targets
Verification started: pendingDecision: n.a.Decision date: n.a.
37
Health facility
Home with SBA
Home with no SBA
Unknown
100.0%
Vacc
inat
ion
cove
rage
(%)
0
20
40
60
80
100
20122011201020092008
Timely HepB BD HepB3 Any HepB BD
(%) D
istr
icts
201
2
0
20
40
60
80
100
Timely HepB BDHepB3
>94%90%–94%80%–89%50%–79%<50%
Abbreviations: DTP3: 3rd dose of Diphteria, Tetanus, and Pertussis Vaccine; HepB3: at least 3 doses of hepatitis B vaccine; HBsAg: hepatitis B surface antigen; SBA: Skilled Birth Attendant; Timely HepB BD: birth dose within 24 hours Sources: UN, UNICEF and WHO* HepB3 vaccination coverage when available, otherwise graph represents DPT3 coverage.
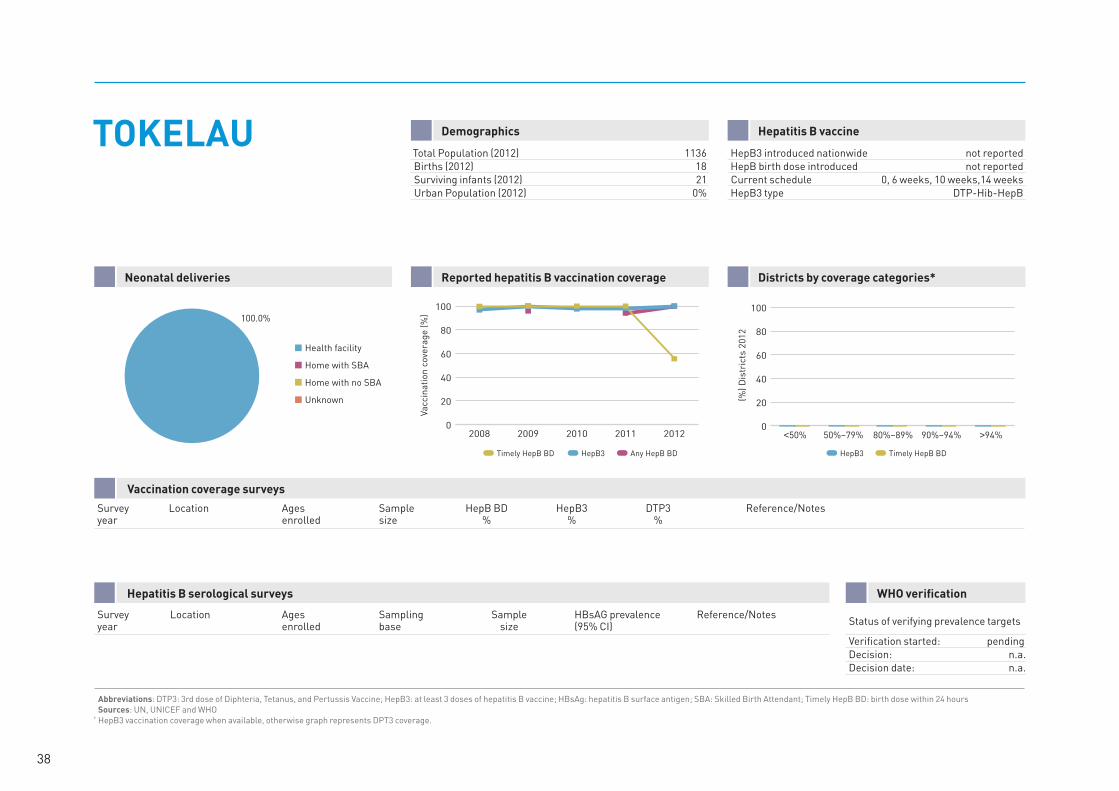
DemographicsTOKELAU Hepatitis B vaccine
Total Population (2012) 1136Births (2012) 18Surviving infants (2012) 21Urban Population (2012) 0%
HepB3 introduced nationwide not reportedHepB birth dose introduced not reportedCurrent schedule 0, 6 weeks, 10 weeks,14 weeksHepB3 type DTP-Hib-HepB
Neonatal deliveries Reported hepatitis B vaccination coverage Districts by coverage categories*
Vaccination coverage surveys
Survey Location Ages Sample HepB BD HepB3 DTP3 Reference/Notes year enrolled size % % %
Hepatitis B serological surveys
Survey Location Ages Sampling Sample HBsAG prevalence Reference/Notes year enrolled base size (95% CI)
WHO verification
Status of verifying prevalence targets
Verification started: pendingDecision: n.a.Decision date: n.a.
38
Health facility
Home with SBA
Home with no SBA
Unknown
98.00%
0.40% 1.60%
Vacc
inat
ion
cove
rage
(%)
0
20
40
60
80
100
20122011201020092008
Timely HepB BD HepB3 Any HepB BD
(%) D
istr
icts
201
2
0
20
40
60
80
100
Timely HepB BDHepB3
>94%90%–94%80%–89%50%–79%<50%
Abbreviations: DTP3: 3rd dose of Diphteria, Tetanus, and Pertussis Vaccine; HepB3: at least 3 doses of hepatitis B vaccine; HBsAg: hepatitis B surface antigen; SBA: Skilled Birth Attendant; Timely HepB BD: birth dose within 24 hours Sources: UN, UNICEF and WHO* HepB3 vaccination coverage when available, otherwise graph represents DPT3 coverage.
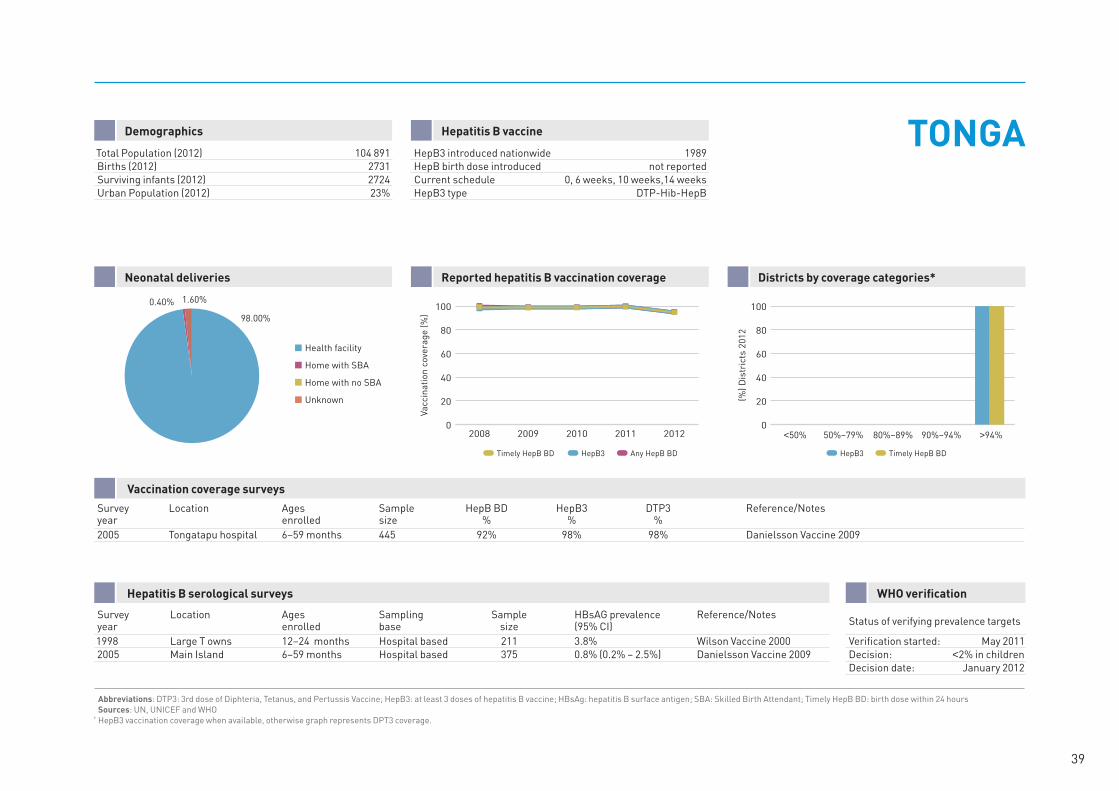
Demographics TONGAHepatitis B vaccine
Total Population (2012) 104 891Births (2012) 2731Surviving infants (2012) 2724Urban Population (2012) 23%
HepB3 introduced nationwide 1989HepB birth dose introduced not reportedCurrent schedule 0, 6 weeks, 10 weeks,14 weeksHepB3 type DTP-Hib-HepB
Neonatal deliveries Reported hepatitis B vaccination coverage Districts by coverage categories*
Vaccination coverage surveys
Survey Location Ages Sample HepB BD HepB3 DTP3 Reference/Notes year enrolled size % % % 2005 Tongatapu hospital 6–59 months 445 92% 98% 98% Danielsson Vaccine 2009
Hepatitis B serological surveys
Survey Location Ages Sampling Sample HBsAG prevalence Reference/Notes year enrolled base size (95% CI) 1998 Large T owns 12–24 months Hospital based 211 3.8% Wilson Vaccine 20002005 Main Island 6–59 months Hospital based 375 0.8% (0.2% – 2.5%) Danielsson Vaccine 2009
WHO verification
Status of verifying prevalence targets
Verification started: May 2011Decision: <2% in childrenDecision date: January 2012
39
Health facility
Home with SBA
Home with no SBA
Unknown
100.0%
Vacc
inat
ion
cove
rage
(%)
0
20
40
60
80
100
20122011201020092008
Timely HepB BD HepB3 Any HepB BD
(%) D
istr
icts
201
2
0
20
40
60
80
100
Timely HepB BDHepB3
>94%90%–94%80%–89%50%–79%<50%
Abbreviations: DTP3: 3rd dose of Diphteria, Tetanus, and Pertussis Vaccine; HepB3: at least 3 doses of hepatitis B vaccine; HBsAg: hepatitis B surface antigen; SBA: Skilled Birth Attendant; Timely HepB BD: birth dose within 24 hours Sources: UN, UNICEF and WHO* HepB3 vaccination coverage when available, otherwise graph represents DPT3 coverage.
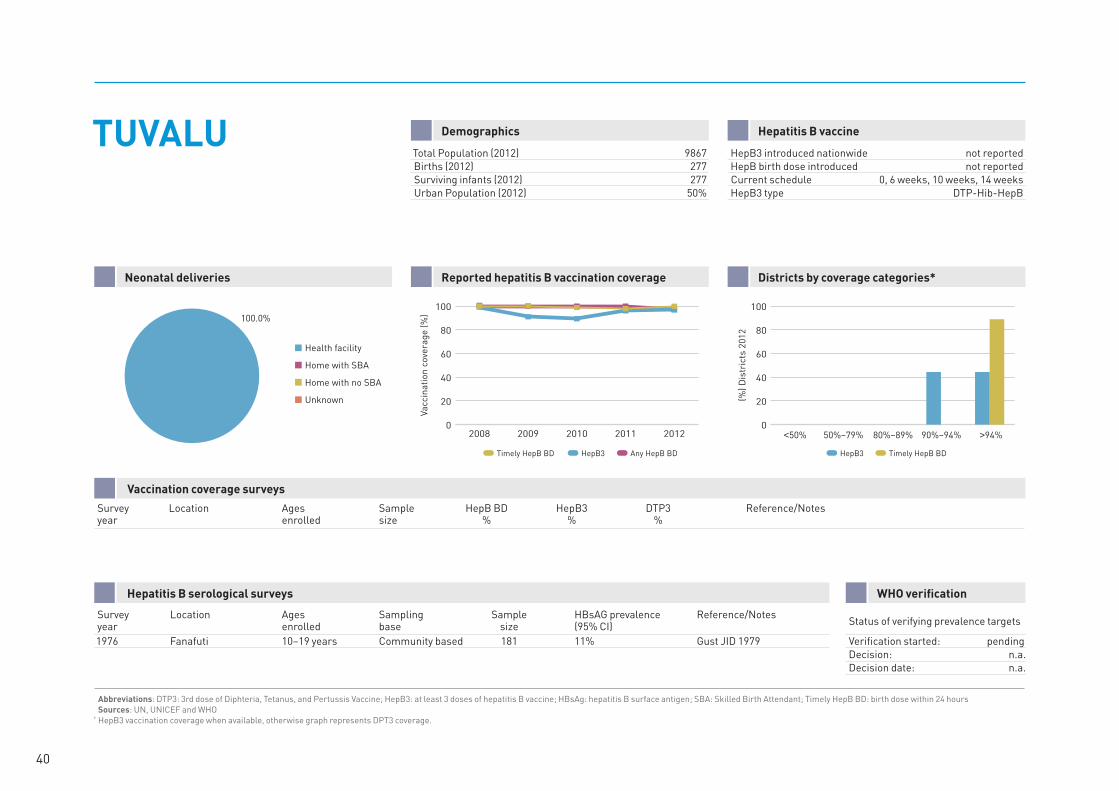
DemographicsTUVALU Hepatitis B vaccine
Total Population (2012) 9867Births (2012) 277Surviving infants (2012) 277Urban Population (2012) 50%
HepB3 introduced nationwide not reportedHepB birth dose introduced not reportedCurrent schedule 0, 6 weeks, 10 weeks, 14 weeksHepB3 type DTP-Hib-HepB
Neonatal deliveries Reported hepatitis B vaccination coverage Districts by coverage categories*
Vaccination coverage surveys
Survey Location Ages Sample HepB BD HepB3 DTP3 Reference/Notes year enrolled size % % %
Hepatitis B serological surveys
Survey Location Ages Sampling Sample HBsAG prevalence Reference/Notes year enrolled base size (95% CI) 1976 Fanafuti 10–19 years Community based 181 11% Gust JID 1979
WHO verification
Status of verifying prevalence targets
Verification started: pendingDecision: n.a.Decision date: n.a.
40
Health facility
Home with SBA
Home with no SBA
Unknown
80.0%20.0%
Vacc
inat
ion
cove
rage
(%)
0
20
40
60
80
100
20122011201020092008
Timely HepB BD HepB3 Any HepB BD
(%) D
istr
icts
201
2
0
20
40
60
80
100
Timely HepB BDHepB3
>94%90%–94%80%–89%50%–79%<50%
Abbreviations: DTP3: 3rd dose of Diphteria, Tetanus, and Pertussis Vaccine; HepB3: at least 3 doses of hepatitis B vaccine; HBsAg: hepatitis B surface antigen; SBA: Skilled Birth Attendant; Timely HepB BD: birth dose within 24 hours Sources: UN, UNICEF and WHO* HepB3 vaccination coverage when available, otherwise graph represents DPT3 coverage.
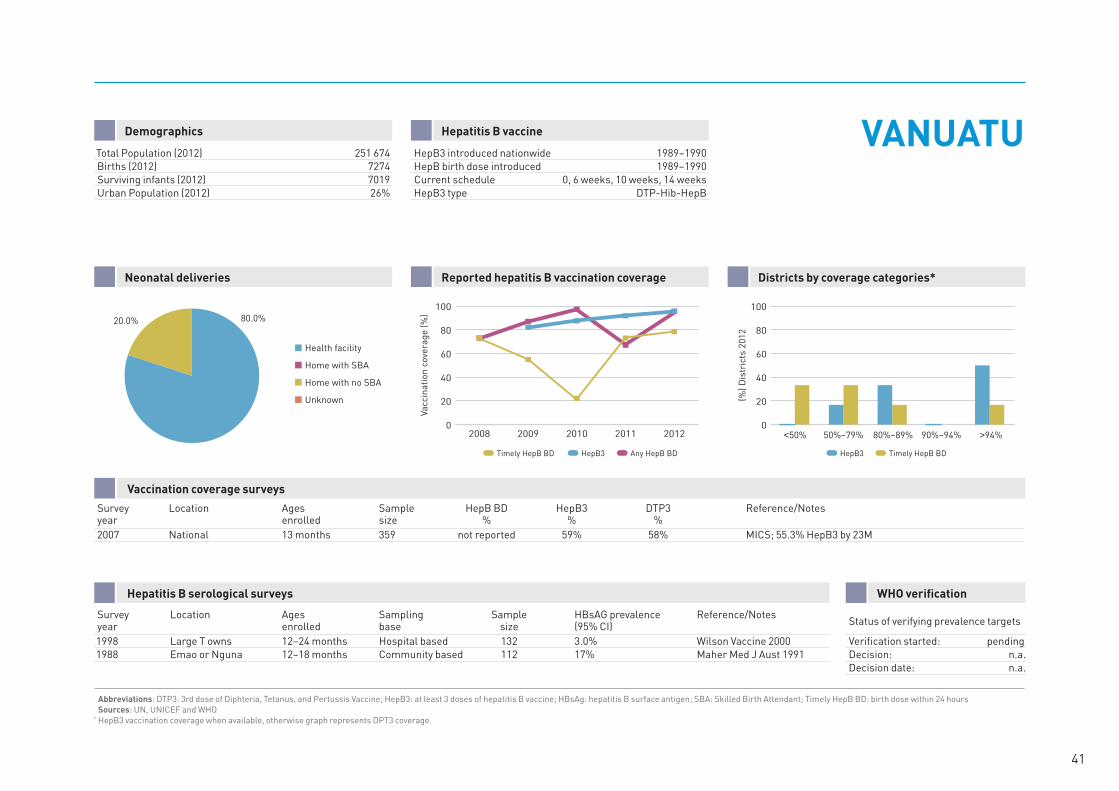
Demographics VANUATUHepatitis B vaccine
Total Population (2012) 251 674Births (2012) 7274Surviving infants (2012) 7019Urban Population (2012) 26%
HepB3 introduced nationwide 1989–1990HepB birth dose introduced 1989–1990Current schedule 0, 6 weeks, 10 weeks, 14 weeksHepB3 type DTP-Hib-HepB
Neonatal deliveries Reported hepatitis B vaccination coverage Districts by coverage categories*
Vaccination coverage surveys
Survey Location Ages Sample HepB BD HepB3 DTP3 Reference/Notes year enrolled size % % % 2007 National 13 months 359 not reported 59% 58% MICS; 55.3% HepB3 by 23M
Hepatitis B serological surveys
Survey Location Ages Sampling Sample HBsAG prevalence Reference/Notes year enrolled base size (95% CI) 1998 Large T owns 12–24 months Hospital based 132 3.0% Wilson Vaccine 20001988 Emao or Nguna 12–18 months Community based 112 17% Maher Med J Aust 1991
WHO verification
Status of verifying prevalence targets
Verification started: pendingDecision: n.a.Decision date: n.a.
41
Health facility
Home with SBA
Home with no SBA
Unknown
94.40%
5.60%
Vacc
inat
ion
cove
rage
(%)
0
20
40
60
80
100
20122011201020092008
Timely HepB BD HepB3 Any HepB BD
(%) D
istr
icts
201
2
0
20
40
60
80
100
Timely HepB BDHepB3
>94%90%–94%80%–89%50%–79%<50%
Abbreviations: DTP3: 3rd dose of Diphteria, Tetanus, and Pertussis Vaccine; HepB3: at least 3 doses of hepatitis B vaccine; HBsAg: hepatitis B surface antigen; SBA: Skilled Birth Attendant; Timely HepB BD: birth dose within 24 hours Sources: UN, UNICEF and WHO* HepB3 vaccination coverage when available, otherwise graph represents DPT3 coverage.
VIET NAM Demographics Hepatitis B vaccine
Total Population (2012) 89 730 274Births (2012) 1 444 753Surviving infants (2012) 1 433 094Urban Population (2012) 30%
HepB3 introduced nationwide 1997HepB birth dose introduced 2005Current schedule 0, 2 months, 3 months, 4 monthsHepB3 type DTP-Hib-HepB
Neonatal deliveries Reported hepatitis B vaccination coverage Districts by coverage categories*
Vaccination coverage surveys
Survey Location Ages Sample HepB BD HepB3 DTP3 Reference/Notes year enrolled size % % % 2002 National 12–24 months 457 not reported not reported 72% DHS Survey2006 National 12 months 555 not reported 32% 76% MICS; 33.9% HepB3 by 23M
Hepatitis B serological surveys
Survey Location Ages Sampling Sample HBsAG prevalence Reference/Notes year enrolled base size (95% CI) 1998 Thanh Hoa 9–18 months Community based 536 12.5% Hipgrave AJTMH 20032011 National 3–4 years Community based 3426 1.6% PRELIMINARY DATA2011 National 5–7 years Community based 1738 2.10% PRELIMINARY DATA
WHO verification
Status of verifying prevalence targets
Verification started: pendingDecision: n.a.Decision date: n.a.
42
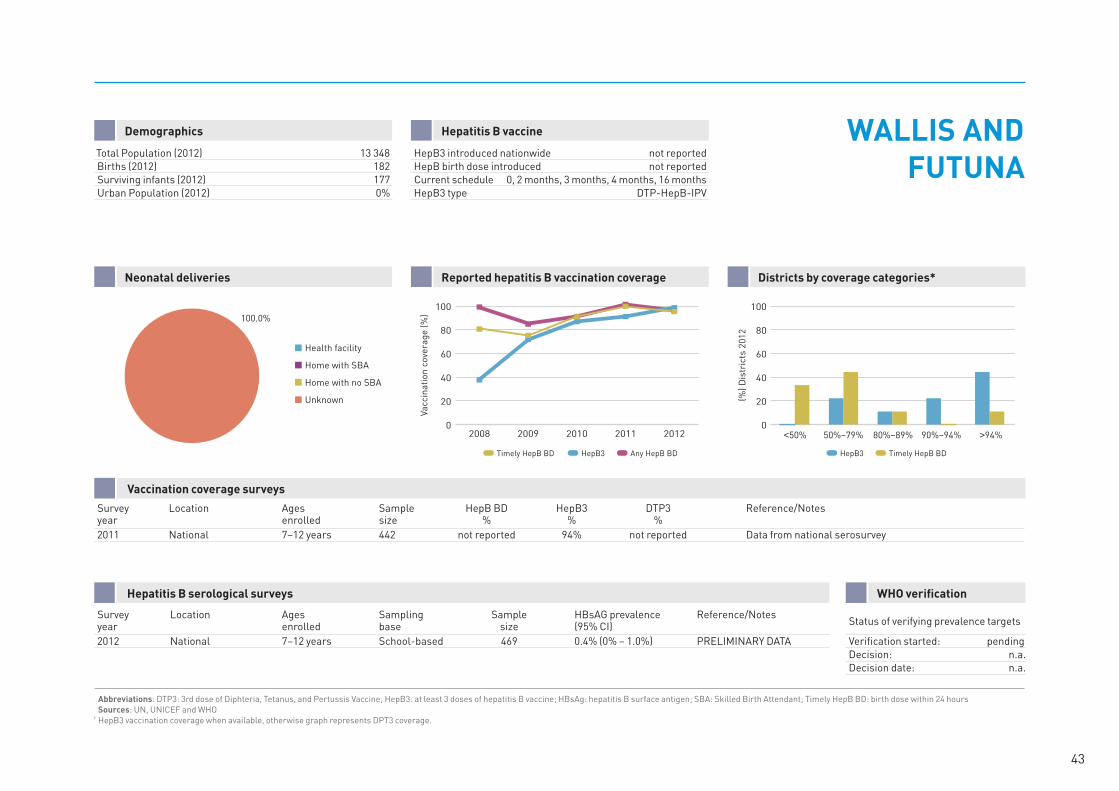
Health facility
Home with SBA
Home with no SBA
Unknown
100.0%
Vacc
inat
ion
cove
rage
(%)
0
20
40
60
80
100
20122011201020092008
Timely HepB BD HepB3 Any HepB BD
(%) D
istr
icts
201
2
0
20
40
60
80
100
Timely HepB BDHepB3
>94%90%–94%80%–89%50%–79%<50%
Abbreviations: DTP3: 3rd dose of Diphteria, Tetanus, and Pertussis Vaccine; HepB3: at least 3 doses of hepatitis B vaccine; HBsAg: hepatitis B surface antigen; SBA: Skilled Birth Attendant; Timely HepB BD: birth dose within 24 hours Sources: UN, UNICEF and WHO* HepB3 vaccination coverage when available, otherwise graph represents DPT3 coverage.
Demographics WALLIS AND FUTUNA
Hepatitis B vaccine
Total Population (2012) 13 348Births (2012) 182Surviving infants (2012) 177Urban Population (2012) 0%
HepB3 introduced nationwide not reportedHepB birth dose introduced not reportedCurrent schedule 0, 2 months, 3 months, 4 months, 16 monthsHepB3 type DTP-HepB-IPV
Neonatal deliveries Reported hepatitis B vaccination coverage Districts by coverage categories*
Vaccination coverage surveys
Survey Location Ages Sample HepB BD HepB3 DTP3 Reference/Notes year enrolled size % % % 2011 National 7–12 years 442 not reported 94% not reported Data from national serosurvey
Hepatitis B serological surveys
Survey Location Ages Sampling Sample HBsAG prevalence Reference/Notes year enrolled base size (95% CI) 2012 National 7–12 years School-based 469 0.4% (0% – 1.0%) PRELIMINARY DATA
WHO verification
Status of verifying prevalence targets
Verification started: pendingDecision: n.a.Decision date: n.a.
43


Expanded Programme on Immunization Regional Office for the Western Pacific World Health Organization P.O. Box 2932, 1000 Manila, Philippines Tel. no. (+63 2) 5288001 Fax no. (+63 2) 5211036, 5260279 [email protected]
Top Related