


Languages
Pages
Legal

Annual Report 2011

HEAD N.V. AND SUBSIDIARIES
FINANCIAL STATEMENTS
For the Year Ended December 31, 2011
SUPERVISORY BOARD Jürgen Hintz Viktor Klima Franz Klammer (appointed on September 26, 2011) Richard Hurowitz (resigned on March 29, 2011) MANAGEMENT BOARD Johan Eliasch Günter Hagspiel Ralf Bernhart George Nicolai
HEAD N.V. FINANCIAL STATEMENTS FOR THE PERIOD ENDED DECEMBER 31, 2011
CONTENTS Directors’ Report ............................................................................................ 1
Supervisory Board Report .............................................................................. 34 Consolidated Statement of Financial Position .................................................... 36
Consolidated Statement of Comprehensive Income ........................................... 37 Consolidated Statement of Changes in Equity ................................................... 38 Consolidated Statement of Cash Flows ............................................................ 39
Notes to the Consolidated Financial Statement ................................................. 40 Note 1 General Information ......................................................................................... 40 Note 2 Summary of Significant Accounting Policies .......................................................... 40 Note 3 Financial Risk Management ................................................................................ 52 Note 4 Critical Accounting Estimates and Judgements ...................................................... 56 Note 5 Segment Information ........................................................................................ 59 Note 6 Property, Plant and Equipment ........................................................................... 61 Note 7 Goodwill and Intangible Assets ........................................................................... 62 Note 8 Inventories ...................................................................................................... 63 Note 9 Trade and Other Receivables .............................................................................. 64 Note 10 Available-for-Sale Financial Assets .................................................................... 67 Note 11 Derivative Financial Instruments ....................................................................... 68 Note 12 Equity ........................................................................................................... 69 Note 13 Trade and Other Payables ................................................................................ 71 Note 14 Provisions ...................................................................................................... 71 Note 15 Borrowings .................................................................................................... 73 Note 16 Additional Disclosures on Financial Instruments .................................................. 81 Note 17 Other Long-Term Liabilities .............................................................................. 83 Note 18 Employee Benefits .......................................................................................... 85 Note 19 Operating Leases ............................................................................................ 88 Note 20 Fair Value and Other Reserves Including Cumulative Translation Adjustment ........... 88 Note 21 Income Taxes ................................................................................................ 89 Note 22 Related Party Transactions ............................................................................... 93 Note 23 Stock Option Plans .......................................................................................... 94 Note 24 Average Number of Employees ......................................................................... 98 Note 25 Expenses by Nature ........................................................................................ 98 Note 26 Employee benefit expense................................................................................ 98 Note 27 List of (direct and indirect) Participations as of December 31, 2011 ........................ 99 Note 28 Cash and cash equivalents ............................................................................... 99 Note 29 Earnings per Share – Basic and Diluted ............................................................ 100 Note 30 Principal Accountant Fees and Services ............................................................ 100
Company Statement of Financial Position ...................................................... 102
Company Statement of Comprehensive Income .............................................. 103 Company Statement of Changes in Equity ..................................................... 104 Company Statement of Cash Flows ............................................................... 105
Notes to the Company Financial Statements .................................................. 106 Other Information ....................................................................................... 113
Auditor’s Report ......................................................................................... 114 Release by the Management Board ............................................................... 116

HEAD N.V. AND SUBSIDIARIES DIRECTORS’ REPORT
1
Business and Strategy
The Company: The Company is a leading global manufacturer and marketer of branded sporting goods serving the skiing, tennis and diving markets. The Company has created or acquired a portfolio of brands – Head (principally alpine skis, ski bindings, ski boots, snowboard and protection products, tennis, racquetball and squash racquets, tennis balls and tennis footwear and sportswear), Penn (tennis balls and racquetball balls), Tyrolia (ski bindings), Mares (diving equipment). The Company’s key products have attained leading market positions based on sales and reputation and have gained high visibility through their use by many of today’s top athletes.
With a broad product offering marketed mainly from middle to high price points, the Company supplies sporting equipment and accessories to all major distribution channels in the skiing, tennis and diving markets, including pro shops, specialty sporting goods stores and mass merchants. Head N.V.’s products are sold through some 37,000 customers in over 85 countries and target sports enthusiasts of varying levels of ability and interest ranging from the novice to the professional athlete. The Company’s strongest presence has traditionally been in Europe. The United States is the next largest market for the Company’s products after Europe.
The Company generates revenues in its principal markets by selling goods directly to retail stores and to a lesser extent, by selling to distributors. It also receives licensing and royalty income. Winter Sports goods are shipped during a specific period of the year, the Company experiences highly seasonal revenue streams. Following industry practice, the Company begins to receive orders from its customers in the Winter Sports division from March until June, during which time the Company books approximately three quarters of its orders for the year. The Company will typically begin shipment of skis, boots and bindings in July and August, with the peak shipping period occurring in October and November. At this time, the Company will begin to receive re-orders from customers, which constitute the remaining quarter of its yearly orders. This re-orders inflow may last, depending on the course of weather into the first quarter of the next year. Racquet Sports and Diving product revenues experience almost no seasonality. Revenue from sales is recognized at the time of shipment.
Strategy: Over the last six decades, the Company has become one of the world’s most widely recognized developers, manufacturers and marketers of innovative, high-quality and technologically advanced sporting equipment. The Company’s focus continues to be its core products of skiing, racquet sports and diving equipment. In order to expand market share and maximize profitability, the Company’s strategy includes an emphasis on marketing and new product development, leveraging further its brands, global distribution network and traditional strength in manufacturing and the Company continuously seeks means for reducing its fixed costs. Expand Market Share. The Company continues to focus on expanding its market share, by developing innovative products such as the Head KERS (Kinetic Energy Recovery System) skis and Head ERA 3 (Evolutionary Rocker Architecture) skis, Head Adaptive Fit Skiboots, Head Youtek racquets and strong-selling products such as the Mares Liquid Skin mask. The Company also looks to expand into new product segments, such as it recently introduced its own apparel lines. Rapidly Develop and Launch New Products. The Company intends to continue its tradition of product innovation and development by identifying new product opportunities and moving quickly to launch these products successfully. After the Company identifies a new product
HEAD N.V. AND SUBSIDIARIES DIRECTORS’ REPORT
2
opportunity, the Company relies on its in-house research and development department and the manufacturing facilities available to produce the desired product concept. Thereafter, through a combination of the integrated marketing program, high brand awareness and global distribution organization efficiency the Company is able to introduce the new products to the market rapidly. In order to succeed in the European Sportswear market, the Company will invest in people and strengthen the organization to achieve a competitive supply chain. Product Management positions for Winter and Summer as well as Communication/PR-Management will be recruited. We will further reinforce the Development-Team and establish an in-house Quality Control system. London will be the main–hub of the Sportswear Division, because we believe that Head´s technical, innovation driven product philosophy combined with the inspirations of a mega trend city like London will create great product and help us to differentiate from the competition.
Continued cost management. In 2009, the Company finalized the transfer of parts of the ski production from its site in Kennelbach, Austria, to its site in České Budejovice, Czech Republic, to benefit from lower personnel costs. Since 2010, approximately 80% of all skis were manufactured in this new facility. After shifting tennis ball production from the U.S. to China in 2008, it was decided to shut-down the U.S. tennis ball factory in 2009. In 2008, the Company completed a new factory in Bulgaria, and transferred some diving production from Italy to this facility. Furthermore, the Company outsourced parts of the production for diving equipment and closed a diving equipment production facility in Italy to gain flexibility and reduce fixed costs. The Company is investigating additional cost savings. Where the Company is confident that quality and proprietary technology will not be compromised, the Company intends to look for and secure further arrangements to manufacture its products in low-cost regions. The Company aims to decrease overhead costs and implements new measures, such as additional relocation of production plants and outsourcing arrangements. Sales and Distribution: The Company’s products are sold in over 85 countries to approximately 37,000 accounts by its worldwide sales force. In addition, the Company utilizes sales representatives and independent distributors to serve specialized markets and related distribution channels. Europe
Sales to customers within Europe accounted for 60.1% of the Company’s 2011 sales. The Company centralized its European distribution organizations for Winter Sports and Racquet Sports products so that Head International GmbH operates as a single distribution company for several key markets. Head International invoices and ships products to the Company’s customers in Switzerland, Germany, Italy and Austria. As a result, all of the Company’s invoicing to customers in these markets, and to third-party distributors worldwide, occurs from Head International. The distribution companies in these countries function as sales agencies. North America
Sales to customers in North America accounted for 25.2% of the Company’s 2011 sales. The Company distributes Head, Tyrolia, Penn and Mares through its subsidiaries Head USA and Head Canada. In the U.S., Winter Sports, Racquet Sports and Diving have separate sales/marketing organizations and sales forces but share all administrative and logistical functions. The goal is to improve distribution and to increase penetration in North America.
HEAD N.V. AND SUBSIDIARIES DIRECTORS’ REPORT
3
To leverage our quality and innovation consumer recognition we attempt to balance our sales and distribution efforts towards both the specialty and mass markets. While we offer our premium racquet products exclusively towards the quality segment of the market, our lower priced racquet and ball products are also available in mass market distribution channels. Asia Sales to customers in Asia accounted for 10.0% of the Company’s 2011 sales. In Japan, the Company’s largest market in Asia, its Winter Sports and Racquet Sports products are distributed by its own subsidiary distribution unit. In 2011, the Company signed a joint venture agreement to set up a distribution company for Diving products in Japan. For snowboard and protection products, the Company has established a successful cooperation between its subsidiary and USP, a marketing and sales specialist in the action sport market. Racquets Sports and Diving products in Hong Kong are served through the Company’s subsidiary in Hong Kong. For the rest of Asia the Company’s products are sold only to independent importers or distributors on a wholesale basis. Other Markets
Sales to customers in other markets accounted for 4.7% of the Company’s 2011 sales. These markets mainly consist of Latin America, Africa and Australia. Diving customers in Australia and New Zealand are served through local branches of the Company’s subsidiary in Hong Kong. The Company believes the number of countries in these markets in which sales were made exceeded 50 in 2011. Sales of products in these regions are made by independent importers/distributors. Industry overview: Winter sports market The Company defines the winter sports market as the market for alpine skis, ski boots and bindings, snowboard equipment and protection equipment. The Company estimates that there are approximately 50 million skiers and 8 million snowboarders active worldwide and that the market for winter sports equipment in 2011 was approximately €900 million at the wholesale level, consisting of €310 million for skis, €150 million for bindings, €230 million for boots and €210 million for snowboard equipment. The ski market consists predominantly of Europe, North America and Asia, with Europe constituting approximately 65% of the world market in 2011, the United States and Canada approximately 26% and Japan approximately 9%. The snowboard market is led by North America, followed by Europe and then Japan. Ski sales have traditionally been the primary component of the winter sports market, with trends in ski sales directly affecting sales of bindings, ski boots and other ski accessories. The market for skis, however, has undergone a transformation in the past 15 to 20 years by declining from an estimated 6.5 million pairs sold per year worldwide in the late 1980's to approximately 4.1 million pairs sold in 2006. In 2011, approximately 3.2 million pairs were sold. The reduction in ski sales resulted primarily from a shift in preference among some consumers from skiing to snowboarding in the early 1990's, an absence of significant product innovation, except for the introduction of the carving ski in 1996, and the severe decline in the Japanese market. A dramatic decline in 2007 resulted from the very bad snow conditions worldwide during the 2006/2007 season, since then the market did not recover. Also the 2011/2012 season had a very slow start with warm weather in most parts of Europe. In the last years, the snowboard market developed into a new form of winter sport, and the market increased from 0.8 million boards sold in 1995 to a peak of 1.6 million in 2000 and decreased
HEAD N.V. AND SUBSIDIARIES DIRECTORS’ REPORT
4
to 0.9 million in 2011 as a result of a further decline of the North American market. The ski bindings market declined from approximately 5.9 million pairs sold per year in the early 1990's to approximately 3.2 million in 2010. The ski boot market increased from 3.6 million pairs sold in 2003 to 4.0 million pairs in 2006. In 2007, the market collapsed to 2.8 million pairs of ski boots and since then improved back to 3.6 million pairs sold in 2011. Racquet sports market The Company defines the racquet sports market as the market for tennis, squash and racquetball racquets, accessories and footwear and for tennis balls and racquetball balls. Based on information currently available but also including internal estimates we assume that the market for tennis racquets in 2011 was approximately 8.4 million units at a wholesale value of approximately € 300 million. We estimate a market decline in 2011 compared to 2010 of 5% and 6% in units and value, respectively mostly driven by declining markets in the United States and Japan. The Company estimates that worldwide sales of tennis balls were approximately 23.1 million dozens at a wholesale value of approximately €195 million. While the unit volume remained unchanged since 2010, the value of all products sold was slightly higher in 2011. Diving market The Company defines the diving market as the market for diving masks, fins, suits, BCDs (Buoyancy Control Devices), regulators, computers and diving accessories. The Company estimates the worldwide wholesale market in 2011 was approximately €400 million. The Company believes that the diving market was declining in 2011 in EMEA (Europe, the Middle East and Africa), flat in Asia and growing by around 5% in the United States. The worldwide economic crisis and political turbulences in the Middle East made the diving industry one of the most affected sporting good categories, as the sport is expensive and requires travelling. The diving industry is fragmented with well over 30 brands. While there are various companies which produce a number of diving products, Mares is the only company that designs and manufactures a complete line of products under one trademark. Sportswear market The Company defines its sportswear market as the market for tennis- and skiwear and it is limited to Europe. In other countries outside Europe, Head sportswear is a licensed business. The license agreement for sportswear in Europe expired in 2010 and 2011 is the first year that tennis- and skiwear was launched in Europe. The distribution of sportswear is fully integrated into the Company´s distribution units. While the tennis apparel market is dominated by large international brands like Nike and Adidas with smaller brands having local importance, the skiwear market is regionally very much fragmented. Business development:
Winter Sports The 2011/2012 winter season started very slow with warm weather and no snow in Europe and in most parts of the United States of America. The situation in Japan is still somewhat unclear as we do not know how consumers will react after the Tsunami and the nuclear power plant disaster in March 2011. Retailers in Europe reported significantly lower sales in the period
HEAD N.V. AND SUBSIDIARIES DIRECTORS’ REPORT
5
November/December 2011 compared to 2010 as a result of this warm weather. Ski sales in the US started well in October/November but slowed down in December also due to poor snow conditions. Now at the end of the year 2011 and at the beginning of 2012 snow has arrived in many parts of Europe and the situation in most ski resorts is better than last year. To which extent this will boost the retail business and will help recovering from the slow start cannot be judged yet. Racquet Sports The tennis market was not able to recover from the decline in 2010 and contracted further for different reasons in the various regions. The North American market declined significantly driven by poor weather conditions in a critical period of the tennis season but also as consumers were not willing to commit to new purchases given increasing economic uncertainty. The decline in Europe was more moderate driven by the economic issues that surfaced in the Southern European markets. The natural disaster in Japan and the subsequent nuclear event hit the Japanese tennis market hard and the market has declined by double digits. Diving Worldwide diving markets were flat in 2011 with European markets declining slightly while the United States market was growing. The worldwide economic crisis accelerated the lowering of global consumer demand, with dealers and some distributors getting in financial difficulties. Nevertheless, the Company believes Mares could increase its market shares in most markets as a result of new advanced products and improved operations. Mares further strengthened its presence in the Asia Pacific region by opening Mares Japan (Joint Venture) of which the company holds 50%. Sportswear
Initial bookings for tennis apparel were within the Company´s expectations. Anticipated re-orders did not materialize as projected due to sourcing problems with one of the Company´s suppliers. Skiwear initial orders were also within expectations. The unseasonal warm weather conditions in November and December unfavourably impacted sales and the anticipated reorder business did not take place.
HEAD N.V. AND SUBSIDIARIES DIRECTORS’ REPORT
6
Profitability
Income statement:
Total net revenues decreased by €4.6 million, or 1.3%, to €339.1 million from €343.7 million in the comparable 2010 period. All divisions, except for Sportswear, reported declines in sales.
Winter Sports revenues decreased by €5.1 million, or 3.0%, to €164.6 million from €169.7 million in the comparable 2010 period. This was mainly caused by poor snow during the critical pre-Christmas sales period and corresponding lower sales in the last quarter. The decrease in the sales volume was only partly offset by a better product mix for all our product categories.
Racquet Sports revenues decreased by €2.2 million, or 1.7%, to €126.4 million from €128.6 million in the comparable 2010 period. This decline is mainly due to the weakening of the U.S. dollar against the euro, an unfavourable product mix for racquets and a lower sales volume for balls, partly offset by significantly higher volumes for racquets.
Diving revenues decreased by €0.2 million, or 0.5%, to €48.5 million from €48.7 million in the comparable 2010 period. This small decline is mainly due to an unfavourable development of exchange rates.
Sportswear revenues increased by €4.3 million to €5.6 million from €1.3 million in the comparable 2010 period, which was the first and starting year for the Sportswear division.
Licensing revenues decreased by €0.6 million, or 10.5%, to €4.8 million from €5.4 million in the comparable 2010 period.
Sales deductions consist of sales incentives, which are earned by the Company’s customers subsequent to delivery of its product, including cash discounts, volume rebates and other than cash consideration. Sales deductions increased by €0.8 million, or 7.6%, to €10.8 million from €10.0 million in the comparable 2010 period.
Cost of Sales. Cost of Sales increased by €0.6 million, or 0.3%, to €200.3 million from €199.8 million in 2010. This increase was mainly due to higher raw material prices and an increase of inventory provision.
• Variable production costs increased by €2.3 million, or 1.4%, to €171.6 from €169.2 million in 2010 mainly due to higher purchase costs, higher personnel expenses and increase in inventory provision.
• Fixed production costs decreased by €1.6 million, or 7.2%, to €20.1 million from €21.6 million in 2010 due to lower depreciation and savings in other areas.
• Research and development expenses decreased by €0.2 million, or 2.4%, to €8.7 million from €8.9 million in 2010 despite slightly higher personnel expenses.
Gross Profit. Gross profit decreased by €5.1 million, or 3.6%, to €138.8 million from €143.9 million in the comparable 2010 period. Gross margin decreased to €40.9% in 2011 from 41.9% in the comparable 2010 period mainly driven by higher raw material prices and sourcing costs.
Selling and Marketing Expense. Selling and marketing expense increased by €3.8 million, or 4.1%, to €96.9 million from €93.0 million in the comparable 2010 period. Main drivers were higher departmental selling costs and an increase of bad debt provision, partly offset by lower advertising costs.
General and Administrative Expense. General and administrative expense decreased by €0.7 million, or 2.4%, to €27.3 million from €28.0 million in the comparable 2010 period. This decrease was mainly due to lower business unit administration costs.
HEAD N.V. AND SUBSIDIARIES DIRECTORS’ REPORT
7
Share-Based Compensation Expense/Income. In 2011, the Company recorded an expense of €0.4 million relating to the Stock Option Plans which was mainly due to an increase in the share price in 2011. In 2010, the Company recorded an income of €3.1 million relating to the Stock Option Plans which was mainly due to the decrease of share price over the period.
Other Operating Expense, net. In 2011 and 2010, the Company recorded other operating expense, net of €0.2 million.
Operating Profit. As a result of the foregoing, an operating profit of €14.0 million was recorded in 2011 compared to an operating profit of €25.9 million in the comparable 2010 period.
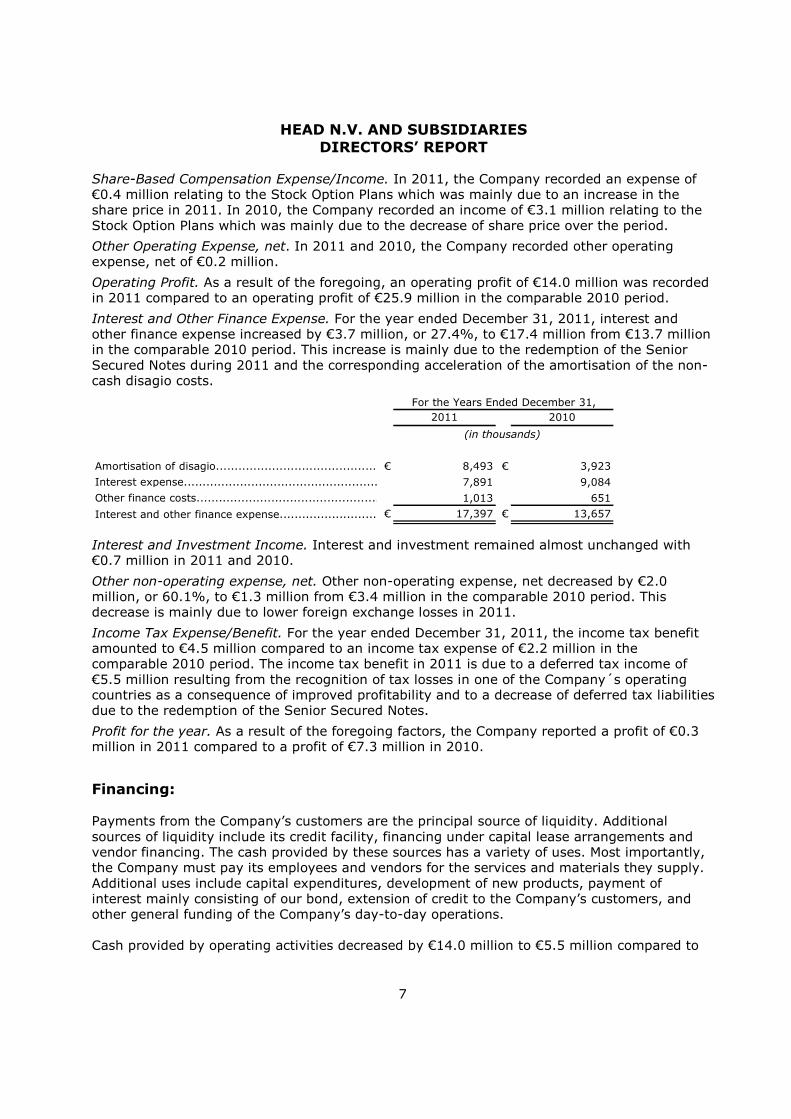
Interest and Other Finance Expense. For the year ended December 31, 2011, interest and other finance expense increased by €3.7 million, or 27.4%, to €17.4 million from €13.7 million in the comparable 2010 period. This increase is mainly due to the redemption of the Senior Secured Notes during 2011 and the corresponding acceleration of the amortisation of the non-cash disagio costs.
2011 2010
Amortisation of disagio.....................................................................................................................................................................................€ 8,493 € 3,923
Interest expense...................................................................................7,891 9,084
Other finance costs...................................................................................1,013 651
Interest and other finance expense.....................................................................................................................................................................................€ 17,397 € 13,657
For the Years Ended December 31,
(in thousands)
Interest and Investment Income. Interest and investment remained almost unchanged with €0.7 million in 2011 and 2010.
Other non-operating expense, net. Other non-operating expense, net decreased by €2.0 million, or 60.1%, to €1.3 million from €3.4 million in the comparable 2010 period. This decrease is mainly due to lower foreign exchange losses in 2011.
Income Tax Expense/Benefit. For the year ended December 31, 2011, the income tax benefit amounted to €4.5 million compared to an income tax expense of €2.2 million in the comparable 2010 period. The income tax benefit in 2011 is due to a deferred tax income of €5.5 million resulting from the recognition of tax losses in one of the Company´s operating countries as a consequence of improved profitability and to a decrease of deferred tax liabilities due to the redemption of the Senior Secured Notes.
Profit for the year. As a result of the foregoing factors, the Company reported a profit of €0.3 million in 2011 compared to a profit of €7.3 million in 2010.
Financing: Payments from the Company’s customers are the principal source of liquidity. Additional sources of liquidity include its credit facility, financing under capital lease arrangements and vendor financing. The cash provided by these sources has a variety of uses. Most importantly, the Company must pay its employees and vendors for the services and materials they supply. Additional uses include capital expenditures, development of new products, payment of interest mainly consisting of our bond, extension of credit to the Company’s customers, and other general funding of the Company’s day-to-day operations. Cash provided by operating activities decreased by €14.0 million to €5.5 million compared to
HEAD N.V. AND SUBSIDIARIES DIRECTORS’ REPORT
8
€19.5 million in the comparable 2010 period. The reduced cash generation was mainly due to lower profitability and increases in working capital which have mainly arisen due to higher winter sports inventory. Cash used for investing activities in 2011 was €6.5 million and remained almost unchanged compared to 2010. Purchases of property, plant and equipment increased by €2.3 million compared to previous year, while proceeds from the sale of available-for-sale financial assets amounted to €2.3 million in 2011 (no sale in 2010). As of December 31, 2011, the Company had €101.9 million of total debt, consisting of €27.4 million Senior Notes due 2014, €9.4 million long-term obligations under a sale-leaseback agreement, €10.3 million consisting of three mortgage agreements due 2018 at the latest, a liability against a Company´s venture partner of €2.8 million and €25.2 million other long-term debt comprising of loans in Italy, Japan, USA and Austria. In addition, the Company used lines of credit with several banks in Austria, Japan and France of €26.9 million. During 2011, the Company early redeemed their Senior Secured Notes. As of December 31, 2011, the Company had €21.1 million cash on hand and €3.8 million restricted cash and €4.9 million available-for-sale financial securities (money market funds) which are restricted. The Company believes that its current level of cash on hand, future cash flows from operations, and its Senior Notes and other facilities are sufficient to meet the operating needs for the foreseeable future.
Research and Development
The Company believes that it is an industry leader in the development of innovative and technologically advanced sports equipment. Its research and development groups identify consumer needs and shifts in consumer preferences in order to develop new product ideas and concepts to satisfy such needs or preferences. The Company believes that its high level of expertise is evident in all its product lines. The Company incurred research and development costs amounting to €8.7 million and €8.9 million for the year ended December 31, 2011 and 2010, respectively.
Capital Expenditures
A significant amount of the Company’s annual capital expenditure is invested for the maintenance of current facilities including the moulds, tools and equipment. Some product lines change annually as new products are introduced, while others are in use for several years. In 2007, the Company announced the transfer of parts of the ski production from its site in Kennelbach, Austria, to its site in České Budejovice, Czech Republic. The Company largely completed the program during 2009. In addition, the Company began the construction of a new diving manufacturing plant in Bulgaria, which was completed by the middle of 2008. In 2011 and 2010, the Company spent approximately €8.8 million and €6.5 million, respectively, on facilities and equipment maintenance (upkeep, replacement and/or improvement). The Company expects to spend approximately €29.5 million on investment in property, plant and equipment, including expenditures for maintenance of the Company’s facilities and equipment, and €33.2 million on research and development, in the 2012 to 2014 period. The Company expects that these expenses will be financed through its operating cash flow. These expenses will be primarily for the design and manufacturing of products that are
HEAD N.V. AND SUBSIDIARIES DIRECTORS’ REPORT
9
scheduled to be introduced and existing products which the Company expects to continue selling during the period.
Employees
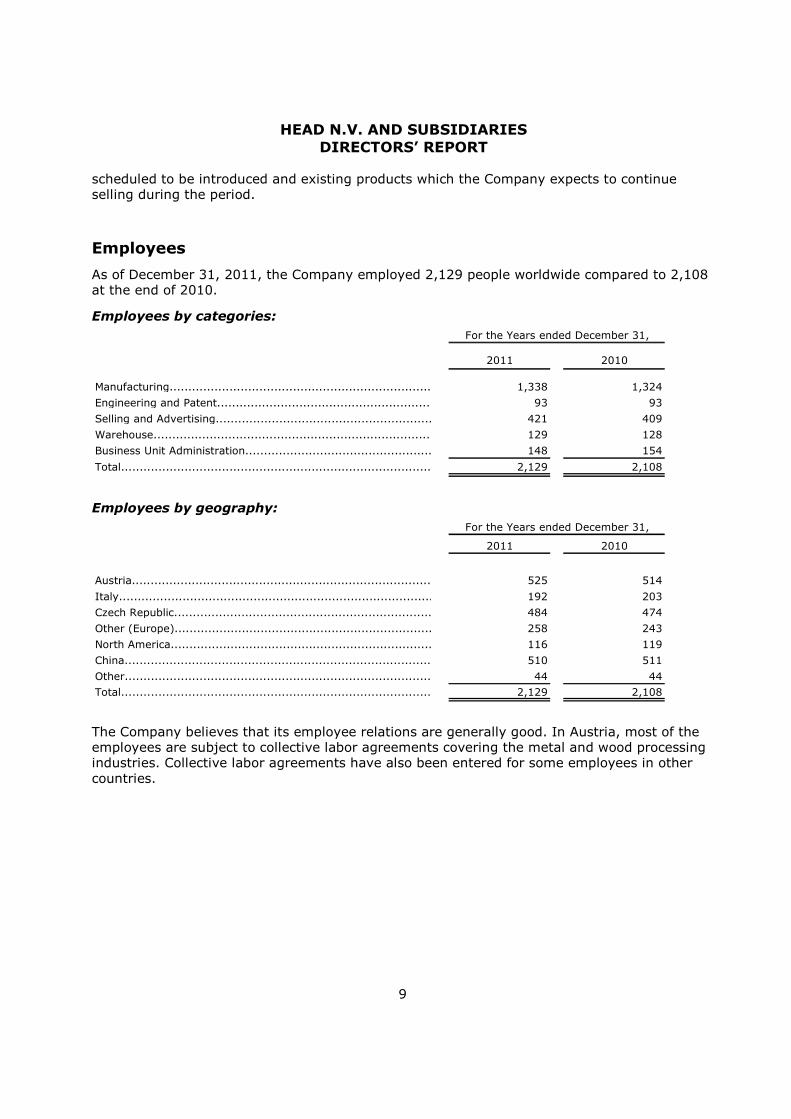
As of December 31, 2011, the Company employed 2,129 people worldwide compared to 2,108 at the end of 2010.
Employees by categories:
2011 2010
Manufacturing............................................................................................................... 1,338 1,324
Engineering and Patent............................................................................................................... 93 93
Selling and Advertising............................................................................................................... 421 409
Warehouse............................................................................................................... 129 128
Business Unit Administration................................................................................................................... 148 154
Total......................................................................................................... 2,129 2,108
For the Years ended December 31,
Employees by geography:
2011 2010
Austria............................................................................................................... 525 514
Italy............................................................................................................... 192 203
Czech Republic....................................................................................................... 484 474
Other (Europe)............................................................................................................... 258 243
North America............................................................................................................... 116 119
China............................................................................................................... 510 511
Other................................................................................................................... 44 44
Total......................................................................................................... 2,129 2,108
For the Years ended December 31,
The Company believes that its employee relations are generally good. In Austria, most of the employees are subject to collective labor agreements covering the metal and wood processing industries. Collective labor agreements have also been entered for some employees in other countries.

HEAD N.V. AND SUBSIDIARIES DIRECTORS’ REPORT
10
Outlook
Product Outlook: Winter Sports In Winter Sports the Company sees a continued trend towards the development of specific new segments, such as Freeride Skis with Rocker technology and Freestyle - Park & Pipe skis. The Company still experiences a more pronounced negative impact in general on the sales of low-end equipment as well as a continued trend towards rental equipment, while high-end models, such as the Supershape models or Worldcup Race Skis sold well. For 2012, following the success of the Company’s sponsored race team in the last two World Cup seasons, at the Olympic winter games in Vancouver and the World Championships in Garmisch-Partenkirchen, the Company will still focus on improving product mix, especially with the new Worldcup Race and Supershape KERS models. Additionally the Company has developed two complete new ranges of ERA 3 skis featuring an advanced “Rocker” technology in order to match the demand for Allmountain skis and match better the needs of the North American markets. The Company will continue to offer a range of Big Mountain skis called Motörhead with Rocker technology.
Because most skis are offered as pre-defined sets including a binding, the Company offers all Head skis with bindings well-coordinated in function and design. The new Power Rail system allows easy boot size adjustment and pre-mounting in the shop. The Lite Rail system offers the same features for junior and kid bindings. Both are systems that can be used for retail, rental and demo, a system that is designed according to the new market requirements. In 2012 the company will introduce a new Freeride binding with a walk mechanism.
For the free market on skis the Company will continue to offer “Peak” branded bindings and also the new developed freeride binding.
In 2011, the Company introduced a completely new Ski boot concept called “Adaptive Fit Technology” with the new Edge model. Edge has been the most successful model range of the Head Ski boot line and with this new technology which allows for width adjustment in the forefoot area the Company expects to gain additional market share in the upper segment of performance boots. For 2012 the company will introduce the new Cube boots, a three buckle boot that combines the comfort of a rear entry boot with the performance of an overlap boot.
In snowboards, the Company has upgraded the top of the line “Intelligence” boards with KERS. The Company is introducing a compact, theme driven “ROCKA” line and a unique total auto open binding technology. On helmets, the Company has developed for 2012 the new Crest and Carma helmets with conehead sandwich core technology and an exclusive hybrid shell construction. The company has also developed new ABS race helmets as well as a completely new rental helmet together with a unique helmet storage system. Racquet Sports Further Youtek line extension tennis racquets were launched by the Racquet Sports Division during 2011. Also new products in Squash, Racquetball and Tennis Accessories have been introduced during the year. At the end of 2011, Head announced that the company will exit the Badminton category in the first quarter of 2012. For 2012, to leverage the success of our players on the Pro Tour, the Company will introduce more Youtek tennis products throughout the year.
HEAD N.V. AND SUBSIDIARIES DIRECTORS’ REPORT
11
Diving The Diving division launched a range of product innovations with a focus on performance and comfort. The Diving division’s latest product launches were a new watch type dive computer and a new regulator technology called Instinct. Furthermore Mares developed a range of performance swim-products and entered competitive swimming under the brand name Head in July 2011 at the Shanghai World-Championships. Sportswear Our vision is to combine the strength of our brand´s heritage of world class performance with the inspiration and insights of our athletes. Together with quality and innovation of superior materials we develop technical solutions, more style and attention to design and detail. We need to focus on product optimization, creating lead styles and identifying margin drivers in order to create significant, but healthy growth for the Company. Environmental Matters: The Company’s operations are subject to European Union, federal, state and local laws, regulations and ordinances relating to the operation and removal of underground storage tanks and the storage, handling, generation, treatment, emission, release, discharge and disposal of various materials, substances and wastes. The nature of the Company’s operations exposes it to the risk of claims with respect to environmental matters and the Company cannot assure you that material costs or liabilities will not be incurred in connection with such claims. Based on the Company’s experience to date, the Company believes that future cost of compliance with environmental laws, regulations and ordinances, or exposure to liability for environmental claims, will not have a material adverse effect on the Company’s business, operations, financial position or liquidity. However, future events, such as changes in existing laws and regulations, or unknown contamination of sites owned or operated by us (including contamination caused by prior owners and operators of such sites), may give rise to additional compliance costs which could have an adverse effect on the Company’s operating results and financial condition. Circumstances affecting future turnover and profitability: As a manufacturer and distributor of branded sporting goods, the Company’s revenues are affected by the overall economic trends of the Company’s principal geographic markets, mainly Europe, but also the United States and Japan, and related changes in consumer spending on leisure goods. Weather can also affect the Company’s revenues. For example, a lack of snow in a particular area in a particular season will result in fewer purchases of skiing and snowboarding equipment and poor weather at a diving location may reduce interest in the sport and related equipment purchases. The Company believes its global geographic penetration and diversification of sports products help to mitigate any localized adverse impacts from weather. Other factors that can affect its revenues are consumer preferences for renting versus purchasing equipment or based on technical innovations, and the general level of interest in the sports for which the Company produces equipment. In addition, the rate of leisure travel can affect its revenues as purchases of its equipment are often related to customers travelling to ski and diving destinations. Most of the Company’s revenues are denominated in euro, the functional currency of its European operations, and in 2011, approximately 30% was denominated in U.S. dollars. The
HEAD N.V. AND SUBSIDIARIES DIRECTORS’ REPORT
12
Company’s revenues are thus affected by movements in the exchange rate of the U.S. dollar and other currencies against the euro. The Company’s revenues are also affected by fluctuations in the value of the currency in which the products are sold relative to the value of the currencies in which production expenses are incurred. For example, appreciation of the U.S. dollar against the euro may adversely affect margins from its products manufactured on an U.S. dollar-cost basis and sold in Europe.
Factors Affecting Expenses
The Company separates its principal expenses into: • cost of sales; • selling and marketing expenses; • general and administrative expenses; and • interest expense. The major components of cost of sales are raw materials, cost of third party manufacturers, payroll and energy expenses related to the manufacturing of the Company’s products. Depreciation of the Company’s manufacturing equipment and production sites, as well as research and development expenses associated with the development of the Company’s products, are also included in this category. Selling and marketing expenses are comprised primarily of advertising expenses (including the sponsorship of professional athletes) and payroll expenses related to the selling department. Also included in this category are commission payments to sales teams. General and administration expenses include warehousing expenses and various administrative costs. Approximately 90% of the Company’s annual capital expenditures are for maintenance and replacement of the Company’s facilities and equipment, including molds and tools. Some product lines change annually as new products are introduced, while others are in use for several years. In 2011 and 2010, the Company spent approximately €8.8 million and €6.5 million, respectively, on facilities and equipment maintenance. Historically, these expenditures were financed through its operating cash flow. The Company expects its annual capital expenditures to remain stable during the next three years due to the fact that most of its restructuring programs and production outsourcing were finalized in 2010. In connection with ordinary share options granted to officers, the Company has recorded share-based compensation expense of €0.4 million and income of €3.1 million in 2011 and 2010, respectively. As of December 31, 2011, other long-term liabilities with regards to the Company’s stock options amounted to €0.6 million. The increase compared to December 31, 2010 (€0.2 million) is mainly due to the increase in the share price in 2011. The change in fair value will be recognized as income or expense over the remaining life of the cash-settled options. Any further stock option grants will result in additional expense being recognized. The Company’s expenses, as reported in euro, are also affected by movements in the exchange rate of the euro against the currencies of the countries in which the Company operates. Of the Company’s cost of goods sold and other operating expenses, approximately 59% is recorded in euro whereas approximately 33% is recorded in U.S. dollars. Because a portion of the Company’s U.S. dollar revenues are generated from products manufactured on a euro-cost basis, the appreciation of the euro against the U.S. dollar has decreased the Company’s revenues when translated into euro.
HEAD N.V. AND SUBSIDIARIES DIRECTORS’ REPORT
13
Risk Report
Some of the risks described below are beyond the Company’s control and cannot be quantified nor can the likelihood be expressed. Management seeks to keep the harm limited by following the strategy of diversification of products and geographic locations. For those risks assessable management tends to define the Company’s strategy by focus on risk minimization. When defining the Company’s strategy management evaluates risks and balance with the potential return. Management is willing to take calculable risks in reaching Company’s objectives.
Industry and business risks: The sporting goods industry is highly competitive and includes many regional, national and international companies, some of which have achieved substantial market share. The Company competes primarily on the basis of product features, brand recognition, quality and price, and the failure to remain competitive could adversely affect its results of operations and financial condition. Some of the Company’s competitors offer types of sports products that the Company does not sell, and some of its competitors are larger and may have greater financial and other resources than the Company has. The Company’s success also depends partly on its ability to anticipate and respond quickly to changing merchandise trends, consumer taste and consumer preferences. Any failure in responding could adversely affect consumer acceptance of the Company’s brand names and product lines and could harm its business.
The Company mitigates these risks by employing experts in the industries in which it operates, constantly reviewing the behavior of the Company’s competitors and customers and having dedicated proficient research and development teams designing consumer driven products.
The Company’s production is dependent on the timely availability of certain raw materials whose prices are driven by the commodity price development on the world market. In manufacturing, we use, among other items, plastic components for bindings, ski boots and diving fins, carbon fibers for racquets, rubber and felt for tennis balls and metal parts for binding components and ski edges. Changing raw material prices historically have had a material impact on the Company’s earnings and cash flows, and are likely to continue to have a significant impact on earnings and cash flows in future periods. To minimize the risk of possible raw material price increases (mainly rubber), the Company entered into non-material supply contracts over the next six months.
Historically, the Company has generally not been able to pass on to the Company’s customers all increases in costs resulting from raw material and energy prices, and has sought other means, particularly through the restructuring of the Company’s production processes, to maintain operating margins. The Company maintains relations with at least two suppliers for each of the core raw materials and enters into price negotiations at least yearly. A yearly supplier evaluation process assures that suppliers meet the Company’s targets.
The Company outsources a substantial portion of its manufacturing to third parties in Europe, such as Czech Republic (binding assembly) and Bulgaria (diving products), and in Asia, such as in China and Thailand, (tennis racquets, accessories, snowboard and protection products, sportswear and diving products). As a result of this outsourcing, the Company is dependent in part on the performance of third-party suppliers in order to deliver quality products in a timely manner. The Company is also increasingly subject to risks relating to the local economic and political conditions in those countries to which the Company outsources its manufacturing operations.

HEAD N.V. AND SUBSIDIARIES DIRECTORS’ REPORT
14
The Company maintains good relations with its third-party suppliers as a professional cooperation is essential to generate high quality products. Third-party suppliers are integrated in the Company’s quality management and internal control framework.
Economic conditions, weather and other factors beyond the Company’s control: The Company and the sporting goods industry in general are dependent on the economies in which the products are sold, and in particular on levels of consumer spending. Economic conditions affect not only the ultimate consumer, but also retailers, the Company’s primary direct customers. As a result, the Company’s results may be adversely affected by downward trends in the economies in which its products are sold. Adverse weather also can cause a significant decline in the Company’s sales, as in 2007 when the poor snow conditions globally during the 2006/2007 season substantially reduced revenues for its Winter Sports products and negatively impacted the consolidated operating results. In addition, the occurrence of events that adversely affect economies or international tourism, such as terrorism, regional instability or natural disasters like the Tsunami in Japan, continue to adversely affect leisure travel and related discretionary consumer spending, which can have a particularly negative impact on the Company’s diving business.
The Company has mitigated these risks where possible by having counter seasonal products and by operating globally so the results are not unduly influenced by the economy of one country.
Legal and tax risks: As of December 31, 2011, the Company recognized €53.1 million of deferred tax assets, mainly on Austrian tax losses carried forwards. The Company believes it is probable that these deferred tax assets will be realized. Austria and some other countries allow an unlimited carryover of net operating losses. However, a change in income tax law lowering the applicable tax rate or limiting of carryover, requiring the Company to write down a portion of its deferred tax assets, would cause a significant income tax expense and negatively affect the Company’s net income and reduce total assets.
The Company closely monitors any development in local tax legislations and is in permanent contact with its external tax consultants to evaluate actions that could be taken and effect on Company’s results.
Some of the Company’s products are used in relatively high-risk recreational settings, and from time to time the Company is named as a defendant in lawsuits asserting product liability claims relating to its sporting goods products. To date, none of these lawsuits has had a material adverse effect on the Company, and the Company does not believe that any lawsuit now pending could reasonably be expected to have such an effect. The Company maintains product liability and general liability insurance coverage. No assurance can be given that such insurance will continue to be available at an acceptable cost or that such coverage will be sufficient to cover one or more large claims, or that the insurers will not successfully disclaim coverage as to a pending or future claim.
The Company follows up on product returns, permanently researches to offer high quality products and has established high product quality standards permanently examined by the Company’s quality management.
The Company holds several hundred patents and trademarks, several of which are filed in multiple jurisdictions, including Europe, the United States and Asia. The Company’s major trademarks are registered in its key markets and numerous other countries. The Company

HEAD N.V. AND SUBSIDIARIES DIRECTORS’ REPORT
15
believes its patents and trademarks to be among its most valuable marketing assets and generally seeks protection for them in countries where significant existing or potential markets for the Company’s products exist. The Company believes it has taken adequate measures to protect its proprietary information, trade names and trademarks in all its major markets. Litigation may be necessary to defend against claims of infringement, to enforce the Company’s patents or trademarks, or to protect trade secrets and could result in substantial costs for the Company.
The Company’s operations are subject to European Union, United States, Chinese and other national and local laws governing, among other things, water pollution, air pollution, noise pollution and hazardous substance discharges. The Company believes that its business, operations and facilities have been and are being operated in compliance in all material respects with applicable environmental and health and safety laws. However, the operation of manufacturing plants entails risks in these areas. As a result, the Company cannot assure that it will not incur material costs or liabilities. In addition, the Company could incur significant costs in order to comply with any future European Union, national or local environmental and health and safety laws that may be adopted, or to respond to stricter interpretations or stricter enforcement of existing laws in the future.
Quality management issues, trademark and patent rights protection and the observance and compliance with the respective national and local laws are supported by dedicated quality management, legal, and patent and trademark departments.
Other risks: Head Sports Holdings N.V. and its affiliates, directly and indirectly, controlled approximately 66.28% of the Company’s issued ordinary shares, as of December 31, 2011. Head Sports Holdings N.V., a Netherlands Antilles corporation, and its shareholders are controlled by Mr. Johan Eliasch, the Company’s CEO and his family members. Head Sports Holdings N.V. has the power to approve the nominations of the Company’s executive officers, the Supervisory and Management Boards, change the Company’s core business, cause us to engage in transactions with affiliated companies, cause or restrict the sale of the Company’s assets, control the Company’s dividend policy and make other fundamental corporate decisions.
Under the Company’s articles of association, a Dutch foundation called Stichting Head Option Plan (“the Stichting”) has the power to nominate all members of the Management Board, appoint one-third of the members of the Supervisory Board and nominate the remaining members of the Supervisory Board. The Board of the Stichting is controlled by Head Sports Holdings N.V.
The special power of the Stichting ceases when Mr. Johan Eliasch or his affiliates or family members cease to control the Stichting or cease to beneficially hold any of the Company’s ordinary shares. In general, a two-thirds majority of shareholders voting at a general meeting of shareholders may remove members of the Management and Supervisory Board, and the articles of association, including the rights of the Stichting, also may be amended (at proposal of the Management Board and with approval of the Supervisory Board) by a two-thirds majority of shareholders. Therefore, as a result of his control over the Stichting, Mr. Johan Eliasch with his family members will retain the power to nominate and essentially control the election of the Management and Supervisory Board members and other executive officers so long as Mr. Johan Eliasch holds any of the Company’s ordinary shares or until there is an amendment to the articles of association impairing the rights of the Stichting.
HEAD N.V. AND SUBSIDIARIES DIRECTORS’ REPORT
16
Financial risks: The Company’s activities expose it to a variety of financial risks: market risk (including currency risk, fair value interest rate risk, cash flow interest rate risk and price risk), credit risk and liquidity risk. The Company’s overall risk management program focuses on the unpredictability of financial markets and seeks to minimize potential adverse effects on the Company’s financial performance. The Company uses derivative financial instruments to hedge certain risk exposures. For further description of the financial risks, it is referred to Note 3 of the consolidated financial statements.
Risk management and internal control system: The Management Board is responsible for designing, implementing and maintaining adequate internal controls over financial reporting and other management information suitable for running the business.
The Company’s main features of internal control systems are as follows:
� Lean organizational structure and clear defined authority and accountability
� Frequent reporting and analysis against approved budget and monitoring of business risks
� Appropriate infrastructure, systems, controls and staff
� Code of Conduct is established
Assurance on the functioning of the internal control systems, and on their effectiveness, is obtained through management reviews, internal testing of certain aspects of the internal financial control systems and control self assessment.
The Company’s chief executive officer and chief financial officer have evaluated the effectiveness of the Company’s internal control and risk management system for the financial year ended December 31, 2011. As part of this, the Company applies criteria established under the “Internal Control - Integrated Framework” of the Committee of Sponsoring Organizations of the Treadway Commission (COSO).
The objective of these systems is to manage, rather than eliminate, the risk of failure to achieve business objectives. Accordingly, they can only provide reasonable, but not absolute, assurance against material misstatement or loss.
On basis of the foregoing and the explanations contained in the Risk Report section in this annual report, the Management Board has confirmed that to its knowledge:
� The Company’s internal risk management and control systems provide a reasonable assurance that the Company’s financial reporting does not contain any material inaccuracies; and
� the Company’s risk management and control systems functioned properly in 2011.
HEAD N.V. AND SUBSIDIARIES DIRECTORS’ REPORT
17
The Management Board Our Management Board currently has four members, whose names, functions and biographies are set forth below.
Name Age Title Mr. Johan Eliasch 50 Chairman of the Management Board and Chief Executive Officer Mr. Ralf Bernhart 60 Member of the Management Board and Deputy Chairman of the
Management Board Mr. Günter Hagspiel 48 Member of the Management Board and Chief Financial Officer Mr. Georg F. Nicolai 59 Member of the Management Board
Mr. Johan Eliasch has served as Chairman of the Management Board of Head N.V. and Group Chief Executive Officer since September 1995. He is Chairman of Equity Partners, London Films, Co-Chairman of Cool Earth, President of Global Strategy Forum, non-executive Chairman of Investcorp Europe, non-executive director of IMG and CV Starr Underwriting Agents, advisory board member of Brasilinvest, Société du Louvre, Centre for Social Justice, the British Olympic Association, and member of the Mayor of London’s and Rome’s International Business Advisory Council. He is patron of the Stockholm University and a trustee of Kew Foundation. He is the former Special Representative of the Prime Minister of the United Kingdom (2007-2010). He is actively involved in preservation of Rainforest in the Amazonas.
Mr. Ralf Bernhart has served as the Chief Financial Officer of Head N.V. since October 2000 until May 2009. He was a member of the HTM Supervisory Board in 1995 prior to becoming a member of the HTM Management Board in 1996. Prior to joining Head N.V., from 1990 to 1995, Mr. Bernhart was a member of the Executive Board of Hafslund Nycomed Pharma AG, Austria, a leading pharmaceutical company. On May 28, 2009, Mr. Bernhart resigned from his position as Chief Financial Officer of Head N.V. Since May 2009, Mr. Bernhart is serving as the Deputy Chairman of our Management Board.
Mr. Günter Hagspiel joined Head Sport GmbH in May 1996. After working in Controlling for two years in Austria, he went on an international assignment to the U.S. to become the Controller of Head USA, Inc. In 2001, Mr. Hagspiel was promoted to CFO and COO of the U.S. Company. Since August 2005, he has served as Vice President Finance & Controlling in Austria and was appointed Managing Director of Head Sport GmbH. Prior to joining Head, Mr. Hagspiel was working as a Management Consultant at the Management Zentrum St. Gallen (MZSG) and as Manager at IBM in Vienna. Since May 2009, Mr. Hagspiel is serving as a member of the Management Board and the Chief Financial Officer of Head N.V.
Mr. George F. Nicolai was a member of the management team of Intertrust Netherlands from 1989 until 2003, and continues to act as a non-executive director. After finishing his law degree at the University of Utrecht, he joined Pierson Heldring & Pierson which became Mees Pierson and later was part of Fortis Bank and now privately owned by Private Equity Group Waterland serving in a variety of executive positions, both in The Netherlands and abroad. He currently also serves as a member of the board of directors of several Dutch subsidiaries of international companies such as Rothschilds, Pearson Plc, Pirelli and KFC and as chairman-member of several foundations. The members of the Management Board are collectively responsible for the management of the Company. Notwithstanding the collective responsibility within the Management Board, certain tasks and responsibilities have been assigned to individual members.
HEAD N.V. AND SUBSIDIARIES DIRECTORS’ REPORT
18
Information pursuant to Decree Article 10 Takeover Directive (Besluit artikel 10 Overnamerichtlijn) and Section 392 paragraph 1 sub-paragraph e Book 2 Dutch Civil Code a) Structure of the capital:
The total nominal value of the Company’s issued share capital amounts to €921,748 and the Company’s issued share capital consists of 92,174,778 ordinary shares of €0.01 nominal, each.
The Company’s shares have been listed on the New York Stock Exchange and the Vienna Stock Exchange effective from September 28, 2000 in connection with the initial public offering. Effective from March 31, 2008, the Company’s shares have been delisted from the New York Stock Exchange.
As of June 4, 2009, the termination of the Company’s registration and reporting obligations under the United States Securities Exchange Act of 1934, as amended (the “Exchange Act”) became effective, 90 days after the filing of a Form 15F with the United States Securities and Exchange Commission.
As per December 31, 2011, out of 43,324,611 listed shares, 42,599,907 shares are bearer shares and 724,704 shares are in registered form.
b) Restrictions on the transfer of securities:
The shares are freely transferable.
c) Significant direct and indirect shareholders:
Pursuant to the Dutch Financial Markets Supervision Act (Wet op het financieel toezicht), the Authority Financial Markets has been notified about the following substantial shareholdings:
Head Sports Holdings N.V., a Netherlands Antilles corporation and its shareholders, controlled by Mr. Johan Eliasch and his family members, holds 61,089,243 shares, or approximately 66.28%, of Head N.V.'s issued shares as of December 31, 2011.
As per December 31, 2011, no other person is known to us to hold 5% or more of the Company’s issued shares.
d) Holders of any securities with special control rights:
All shares carry equal rights. None of the shares carry special control rights.
e) System of control of employee share scheme:
In August 2000, the Company's Management Board adopted the Head N.V. Executive Stock Option Plan 2000, but that plan has not been implemented.
Plan 2001 In September 2001, the Company adopted the Head N.V. Executive Stock Option Plan 2001 (“Plan 2001”). The Plan 2001 provides for grants of stock options to officers and employees of the Company and its subsidiaries. In accordance with IFRS 2 the Plan 2001 is treated as cash-settled share-based plan, as participants have no right to receive shares. On September 28,
HEAD N.V. AND SUBSIDIARIES DIRECTORS’ REPORT
19
2001, a total of 3,982,068 options were granted under the terms of the Plan 2001. During 2011, the Stock Option Plan 2001 expired as options had a maximum term of 10 years. The exercise price for all stock options granted under the Plan was fixed at inception of the Plan 2001. The vesting period varied from 0 to 6 years. The Chairman and Chief Executive Officer received 1,426,470 options under this grant, which vested immediately. In addition, he had received further options in the amount of 564,564, which did not vest to other participants. Plan 2005 In May 2005, at the Annual General Meeting the shareholders approved the Head N.V. Executive Stock Option Plan 2005 (“Plan 2005”). The Plan 2005 provides for grants of 3,874,691 stock options to certain officers and key employees of the Company and its subsidiaries. In accordance with IFRS 2 the Plan 2005 is treated as cash-settled share-based plan, as participants have no right to receive shares. As of December 31, 2011, a total of 3,669,346 options were granted under the terms of the Plan 2005. The exercise price for all stock options granted under the Plan 2005 was fixed at inception of the Plan 2005. Options generally vest over a period of 4 years. The Chairman and Chief Executive Officer received 1,937,346 options under this grant. Options have a maximum term of 10 years. As at December 31, 2011, 205,345 options were available for grant under the Plan 2005 and 3,311,346 options are currently exercisable. Plans 2009 At the Annual General Meeting of shareholders, held on May 28, 2009, the Stock Option Plan 2009 (“Plan 2009”) was approved. The Plan 2009 calls for the grant of options to the Stichting for members of Management of the Company’s subsidiaries, or such affiliates as the managers may request and provides for issuance of a maximum aggregate number of 5,800,000 options. The options vest on granting. The life of the plan is 10 years from the date the options are granted. Options issued under the Plan 2009 are administered by the Stichting Head Option Plan.
On July 27, 2009, the Board of Management approved the settlement of these options to be in cash in the amount of share price less option price on the date of exercise. On December 30, 2009, all options under the Plan 2009 have been granted to the CEO of the Company.
On December 1, 2010, the Management Board resolved that the Stock Option Plan will be equity-settled. In September 2009, the Supervisory Board approved a second Stock Option Plan. The maximum aggregate number of options issued is 7,047,179 settled in cash. The options vest on granting and the life of the plan is 10 years from the date the options are granted. On December 30, 2009, all options under the second Plan 2009 have been granted to the CEO of the Company. On December 1, 2010, the Management Board resolved that the Stock Option Plan will be equity-settled. In March 2011, Head Sports Holdings N.V. (a Netherlands Antilles corporation, and its shareholders are controlled by the CEO of the Company Mr. Johan Eliasch and his family

HEAD N.V. AND SUBSIDIARIES DIRECTORS’ REPORT
20
members) exercised the options granted under the May and September 2009 Stock Option Plans. In total these amounted to 12,847,179 options. These options have been satisfied by the transfer of 8,876,431 shares in Head N.V. held by the Company in March 2011 as treasury shares (see Note 12), and the issuance by Head N.V. of 3,970,748 new shares. As a result, the total number of issued shares in Head N.V. increased from 88,204,030 to 92,174,778. For further information regarding the Stock Option Plans it is referred to Note 23. f) Restrictions on voting rights:
There are no restrictions on voting rights.
g) Agreements between shareholders known to the company and which may result in restrictions on the transfer of securities and/or voting rights:
As far as known to Head N.V., there is no agreement involving a shareholder of Head N.V. that could lead to a restriction of the transferability of shares or of voting rights on shares.
h) Rules governing the appointment and replacement of board members and the amendment of articles of association:
The Company has established a Dutch foundation, Stichting Head Option Plan (the "Stichting"), the Board of which is controlled by Head Sports Holdings N.V. and Mr. Johan Eliasch jointly. Head Sports Holdings N.V. is an entity that is controlled by Mr. Johan Eliasch and his family members. The Stichting's sole corporate body is its Board; it does not have any members or shareholders. The Stichting has the power to nominate all members of the Management Board of the Company, to appoint one-third of the members of the Supervisory Board and nominate the remaining members of the Supervisory Board. Two third of the members of the Supervisory Board are appointed by the general meeting of shareholders from a list of nominees drawn up by the Stichting. The members of the Management Board are also appointed by the general meeting of shareholders from a list of nominees drawn up by the Stichting. A Supervisory Director appointed by the Stichting may be suspended or removed by the Stichting at any time and the Supervisory Director appointed by the general shareholders’ meeting may be suspended or removed at any time by a majority vote of the general meeting of shareholders. However, any suspension or removal not proposed by the Stichting may only be adopted by the general meeting of shareholders by the affirmative vote of at least two-thirds of the votes cast. A resolution of the general meeting of shareholders to amend the Company’s articles of association can only be adopted upon a proposal of the Management Board, after approval of the Supervisory Board, and requires a special majority (two-thirds majority vote), provided that a resolution to amend the articles of association with respect to article 4 shall only require an affirmative vote of an absolute majority of the votes cast.
i) Power of Members of the Management Board, in particular to issue or buy back shares:
As a two-tier public limited company organized under the laws of The Netherlands, the Company’s business is carried out primarily by a Management Board and by executive officers appointed by the Company’s Management Board.
The Company’s Management Board is overseen by a Supervisory Board consisting of at least three members, which also oversees the more general course of the Company’s business. The Company’s Supervisory Board may agree, with the approval of the Management Board, that specific Management Board resolutions are subject to the Supervisory Board’s approval. No
HEAD N.V. AND SUBSIDIARIES DIRECTORS’ REPORT
21
resolutions are specified in the Company’s articles of association that require Supervisory Board approval or have been otherwise agreed.
On May 26, 2011, the Management Board was granted the authority by the Company’s general shareholder’s meeting (i) to repurchase shares representing up to 50% of the Company’s issued share capital during a period of 18 months (until November 26, 2012) and (ii) to issue shares and/or grant rights to subscribe for shares as well as to limit or exclude the right of pre-emption in relation to such shares being used or rights being granted (until May 26, 2016), up to a maximum of shares/rights as the authorised capital permits.
j) Significant agreements to which the Company is a party and which alter or terminate upon a change of control of the Company:
In September 2011, one of the Company´s subsidiaries entered into an asset backed revolving credit agreement with an US-bank providing a maximum of USD 40.0 million dependent on the level, and secured by, eligible US inventories and receivables. The agreement covers five years. In the event of a) borrower’s parent company ceasing to own at least 100% of the outstanding voting equity interests of the borrower or (b) Company ceasing to own, directly or indirectly, at least 100% of the outstanding voting equity interests of borrower’s parent company or (c) the occupation of a majority of the seats on the board of directors of the borrower by persons who were neither (i) nominated by the board of directors of the borrower nor (ii) appointed by directors so nominated; or (d) the occupation of a majority of the seats on the board of directors of the borrower’s parent company by persons who were neither (i) nominated or elected by the board of directors of borrowers parent company nor (ii) appointed by directors so nominated or elected, then, at the request of the lenders, the following actions may take place: (i) termination of the commitments, and (ii) declaration of the principal of the loans then outstanding together with accrued interest thereon and all fees and obligations of the borrower accrued to be due and payable in whole or in part. k) Agreements between the Company and its board members or employees providing for compensation if they resign or are made redundant without valid reason or if their employment ceases because of a take over bid:
There are no agreements between Head N.V. and its board members or other employees providing for compensation in case of resignation or redundancy without valid reason or in consequence of a take over bid.
HEAD N.V. AND SUBSIDIARIES DIRECTORS’ REPORT
22
HEAD’S Corporate Governance Rules – Dutch/Austrian Corporate Governance Code – Explanations
Head’s general corporate governance framework and its development
As a Dutch company listed on the Vienna Stock Exchange and until March 2008 on the New York Stock Exchange (NYSE) and registered with the U.S. Securities and Exchange Commission (SEC) until June 2009, the Company has had to consider different corporate governance systems established by the Dutch, Austrian and U.S. jurisdictions respectively.
With regard to The Netherlands, on December 9, 2003 a corporate governance code (the Dutch Corporate Governance Code) was presented which became effective for all Dutch listed companies for the financial year beginning on or after January 1, 2004. This Code was amended with an effective date of January 1, 2009 to bring it in line with corporate governance developments and to reflect the recent changes in Dutch and EU legislation, inter alia in connection with the implementation of the European Transparency Directive.
In Austria, a self-regulatory Code of Corporate Governance was drafted in October 2002 and provides corporations with a framework for the management and control of enterprises. This Austrian Code of Corporate Governance recommended that Austrian stock listed companies adhere to such Code or parts of it. The Austrian Code was amended as of January 1, 2010 to take into account recent changes of the Austrian Stock Corporation Act and the recommendation given by the European Commission on Director’s remuneration.
Since Head N.V. is a Dutch company, not listed in The Netherlands but listed on the Vienna Stock Exchange and, until 2008, listed on the NYSE, it seemed appropriate to focus on rules developed by the respective exchanges. At the Company’s annual general meeting in 2004, Head N.V. asked its shareholders to approve that Head N.V. apply the NYSE and SEC rules of corporate governance and not specifically the rules of the Dutch Corporate Governance Code since Head N.V. had a considerable U.S. shareholder base. The shareholders of Head N.V. approved that proposal, pursuant to which, until 2008, the Company focused on rules of corporate governance established by the NYSE and the SEC.
Since March 2008, the Company is no longer listed on the NYSE, and since June 2009 is no longer registered with the SEC. The Company, however, continues to be listed on the Vienna Stock Exchange and continues to have particularly strong connections to Austria. In particular, a number of the Company’s most important subsidiaries with many employees are incorporated in Austria, some of the Company’s production sites and key officers are based in Austria, and finally, one of the Company’s Austrian subsidiaries, HTM Sport GmbH, issued two bonds – the Senior Notes are still listed on a European stock exchange whereas the Senior Secured Notes were fully redeemed during 2011. It therefore seemed appropriate to focus specifically on the Austrian rules regarding corporate governance.
In addition, since shareholders made their investment knowing that the Company is listed on the Vienna Stock Exchange, the Company believes they expect the Company to comply with all the applicable capital market related rules and recommendations of that particular Stock Exchange. Therefore, in order to avoid the application of different sets of rules within the Group and to ensure that those corporate governance standards are being followed which have been developed for the Vienna Stock Exchange, at the annual general meeting in 2008 the shareholders of the Company were asked to approve the application of the Austrian Code of

HEAD N.V. AND SUBSIDIARIES DIRECTORS’ REPORT
23
Corporate Governance. Head N.V.'s shareholders approved such proposal and the Company therefore primarily follows the Austrian Code of Corporate Governance since June 2008, which was updated to reflect advancements in corporate governance practice in Europe as of January 1, 2010. A copy of the Austrian Code of Corporate Governance valid as of 2010 is available on the Company's website (www.head.com).
The Austrian Corporate Governance Code
According to the Austrian Code of Corporate Governance, a company needs to declare once a year that the Code’s Rules and recommendations have been and are being complied with or which of the Code’s recommendations have not been and are not being applied.
Certain of the rules mentioned in the Austrian Code of Corporate Governance, the so called “L” rules, refer to legal requirements under either the Austrian Stock Exchange or Capital Markets Act or to the Austrian Stock Corporation Act. Insofar as the Code refers to the Austrian Stock Corporation Act, the Company will explain the applicable rules for the Company under the Dutch Civil Code, if they are different than what is described under Austrian law.
Based on these reservations the Company has decided to comply with the Rules of the Austrian Code with the following exceptions.
Rule 3 (an “L” rule” which therefore refers to Austrian law applicable to Austrian companies):
Acceptance or rejection of takeover bids shall be decided solely by the shareholders. The management board and the supervisory board are required to present a balanced analysis of the opportunities and risks of an offer to the persons addressed by the takeover bid.
The price of a mandatory bid or of a voluntary bid with the purpose of attaining a controlling interest pursuant to the Takeover Act shall not be below the highest monetary consideration
paid or agreed-upon by the offeror or a party acting in concert with the offeror within the past twelve months prior to the announcement of the bid for the shares of the target company. Furthermore, the price must correspond at least to the average market price weighted by the
respective trading volumes for the shares over the past six months prior to the day of the announcement of the intention to make a bid.
The first paragraph applies under Dutch law as well, but only in respect of a mandatory bid (article 5.80a of the Dutch Financial Supervision Act (Wet FinancieelToezicht), and not in respect of a voluntary bid. The second paragraph does not exist under Dutch law.
Rule 4 (an “L” rule” which therefore refers to Austrian law applicable to Austrian companies): A general meeting must be convened at the latest on the 28th day before the ordinary general
meeting, otherwise by the latest on the 21st day before the general meeting by an official announcement unless the by-laws prescribe other longer deadlines. The announcement convening the general meeting and the information stipulated by the Companies Act must be
made available on the company‘s website as of the 21st day prior to the general meeting.
Under Dutch law the deadlines to convene a general meeting are longer. The requirements to convene a general shareholder’s meeting are therefore as follows: Notice of shareholders' meetings is given on our website (www.head.com) and by advertisement in a Dutch national newspaper and an Austrian national newspaper. The notice includes the requirements for
HEAD N.V. AND SUBSIDIARIES DIRECTORS’ REPORT
24
admission to the meeting. Such notice is to be given not later than the forty-second day prior to the day of the meeting and is to state the place and time of the general meeting, the subjects to be considered, the procedure for participating by written proxy, the procedure for participating and exercising voting rights by electronic means, the website address of the Company, the applicable record date and, if relevant, that documents containing the subjects to be considered may be inspected at the Company’s offices.
Rule 5 (an “L” rule” which therefore refers to Austrian law applicable to Austrian companies): The candidates for the supervisory board elections including all declarations according to the
Companies Act must be disclosed by the company at the latest on the 5th workday prior to the general meeting on the website of the company; otherwise the persons concerned shall not be included in the elections.
According to our Articles of Association and in accordance with Dutch law, one third of our Supervisory Directors will be appointed by the Stichting and will therefore not be elected by the general meeting. The other Supervisory Directors will be appointed by the general meeting from a list of nominees, to be drawn up by the Stichting. The details about the Supervisory Board candidates to be elected by the general meeting are to be disclosed in the explanatory notes to the agenda for the respective general meeting of shareholders. The explanatory notes to the agenda form part of the Notice and Convocation of a General Meetings that needs to be disclosed on the Company’s website 42 days prior to the day of the General Meeting. Rule 6 (an “L” rule” which therefore refers to Austrian law applicable to Austrian companies): The resolutions passed at the general meeting and the information required by the Companies
Act shall be disclosed on the company’s website at the latest on the 2nd workday after the general meeting.
Under Dutch law, there is no such requirement, but the Company has disclosed in the past the resolutions passed at the General Meeting as soon as they were available after the General Meeting.
Rule 8 (an “L” rule” which therefore refers to Austrian law applicable to Austrian companies): The general meeting has the right to authorize the management board for a period not
exceeding thirty months to buy back the company‘s own shares up to a maximum of 10% of the share capital in those cases permitted by law. The resolution and authorization for the buyback are to be published immediately before execution. The resolution and immediately
before implementation the execution of this buyback authorization shall be disclosed.
According to Head N.V.’s Articles of Association, the Company shall be entitled to acquire fully paid-up shares in its own capital or depository receipts in respect thereof, provided either the no valuable consideration is given or provided that a) the distributable part of the net assets is at least equal to the purchase price and b) the nominal value of the shares or the depository receipts in respect thereof which the Company acquires, holds or holds in pledge or which are held by a subsidiary does not exceed half of the issued capital. The Management Board shall require the authorisation of the general meeting for an acquisition for valuable consideration. This authorisation may be given for a maximum of 18 months. At the time of granting such authorisation, the general meeting must determine how many shares or depository receipts thereof may be acquired and between which limits the price must be (see also Note 12).
Rule 24 (an “L” rule” which therefore refers to Austrian law applicable to Austrian companies): All transactions between the company or a group company and the members of the
HEAD N.V. AND SUBSIDIARIES DIRECTORS’ REPORT
25
management board or any persons or companies with whom the management board members have a close relationship must be in line with common business practice. The transactions and their conditions must be approved in advance by the supervisory board with the exception of
routine daily business transactions.
With regard to Rule 24 the following can be noted: The Company complies with Dutch law by having provided in the Company's articles of association that in the event of a conflict of interest between the Company and a member of the management board, the Company shall be represented by such member of the management board or a member of the supervisory board, such person to be designated for this purpose by the supervisory board and the management board jointly. The member concerned shall be an independent/disinterested member.
Rule 27: When concluding management board contracts, the following principles shall be observed: The remuneration of the management board shall be oriented on the management board member’s scope of work, responsibility and personal performance as well as on the
attainment of the corporate goals, the size and the economic situation of the company. The remuneration contains fixed and variable components. The variable remuneration components shall be linked, above all, to sustainable, long-term and multi-year performance criteria, shall
also include non-financial criteria and shall not entice persons to take unreasonable risks. For the variable remuneration components, measurable performance criteria shall be fixed in advance as well as maximum limits for amounts or as percentage of the fixed remuneration
components. Precautions shall be taken to ensure that the company can reclaim variable remuneration components if it becomes clear that these were paid out only on the basis of obviously false data.
Rule 28: If a stock option programme or a programme for the preferential transfer of stocks is proposed for management board members, then such programmes shall be linked to
measurable, long-term and sustainable criteria. It shall not be possible to change the criteria afterwards. For the duration of such programmes, but at the latest until the end of the management board member’s function on the management board, the management board
member shall hold an appropriate volume of shares in the own company. In the case of a stock option programme, a waiting period of at least three years must be fixed. A waiting and/or holding period of a total of at least three years shall be defined in stock transfer programmes.
The general meeting shall pass any resolutions and/or changes to stock option schemes and stock transfer programmes for management board members.
Rule 29: The number and distribution of the options granted, the exercise prices and the respective estimated values at the time they are issued and upon exercise shall be reported in the annual report. The total remuneration of the management board for a business year must
be reported in the notes to the financial statements.
Rule 30: In addition to the information required by law (L-Rule 29), the Corporate Governance
Report shall contain the following information:
• The principles applied by the company for granting the management board variable
remuneration, especially to which performance criteria the variable remuneration components are linked pursuant to C-Rule 27; the methods according to which the fulfilment of the performance criteria is determined; the maximum limits determined for the variable
remuneration; the shares held in the own company and periods planned pursuant to C-Rule 28; moreover, any major changes versus the previous year must also be reported.

HEAD N.V. AND SUBSIDIARIES DIRECTORS’ REPORT
26
• The ratio of the fixed components to the variable components of the total compensation of the management board.
• The principles of the company retirement plan for the management board and the conditions.
• The principles applicable to eligibility and claims of the management board of the company in
the event of termination of the function.
• The existence of a D&O insurance, if the costs are borne by the company.
Rule 31: The fixed and variable performance-linked annual remunerations of each individual management board member are to be disclosed in the Corporate Governance Report for each
financial year. This shall also apply if the remuneration is paid through a management company.
Rule 43: The supervisory board shall set up a remuneration committee and the chairperson of this committee shall always be the chairperson of the supervisory board. Where supervisory boards have not more than six members (including employees’ representatives) this function
may be assumed jointly by all members. The remuneration committee shall deal with the contents of employment contracts with management board members, it shall ensure the implementation of the C-Rules 27, 27a and 28, and shall regularly review the remuneration
policy applicable to management board members. At least one member of the remuneration committee shall be required to have knowledge and experience in the area of remuneration policy. If the remuneration committee uses the services of a consultant, it must be ensured
that said consultant does not at the same time provide services to the management board in matters relating to remuneration. In the case of supervisory boards that do not have more than six members (including employees’ representatives), this function may be assumed jointly by
all members. The remuneration committee may be identical with the nomination committee. The chairperson of supervisory board shall inform the general meeting once a year of the principles of the remuneration system.
Rule 27 to 31 and Rule 43: Whilst the Company adheres to the above mentioned Rules on remuneration in general, due to the small size of the Company and limited number of management personnel the Company does not follow all of Rules, in particular it does not follow the variable or stock option component laid down in these Rules. The details of the Company’s remuneration policy are set out under the Remuneration Policy as disclosed in the Corporate Governance Report (see also Note 9 of the Company accounts).
Rule 33 (an “L” rule” which therefore refers to Austrian law applicable to Austrian companies):
The supervisory board appoints the members of the management board and has the right to terminate their employment.
Under Dutch law the members of the management board are appointed by the general meeting. It is however possible to have the board members be appointed by the general meeting by nomination of a different party if included in the articles of association (article 2:133 of the Dutch Civil Code). This was done for Head N.V. (article 16 of the articles of association as posted on our website). The same applies for the termination of their position.
Rule 35 (an “L” rule” which therefore refers to Austrian law applicable to Austrian companies): In accordance with the Austrian Stock Corporation Act, the supervisory board shall formulate in concrete terms a list of business transactions that are subject to its approval, and depending

HEAD N.V. AND SUBSIDIARIES DIRECTORS’ REPORT
27
on the size of the enterprise, shall define the appropriate limits on amounts; this shall also apply to any major transactions concluded by subsidiaries that are of relevance to the group.
Under Dutch law there is no legal requirement for a list of transactions that require prior approval by the supervisory board. There is a similar rule for the general meeting (article 2:107a of the Dutch Civil Code). According to article 21 paragraph 1 of the articles of association of Head N.V., the supervisory board can subject resolutions made by the management board to its approval, but this is a more general stipulation than in the Austrian Code.
Rule 36: The statutory provisions according to which the supervisory board must meet at least once every three months shall be understood as a minimum requirement. Additional meetings
must be held as required. If necessary, the items on the agenda may be discussed and decided by the supervisory board and its committees without the participation of the management board members. The number of meetings of the supervisory board must be reported in the
Corporate Governance Report. The supervisory board shall discuss the efficiency of its activities annually, in particular, its organization and work procedures (self-evaluation). There is no statutory requirement under Dutch law which sets out a certain minimum amount of meetings to be held during a year. In 2011, we had four Supervisory Board meetings and six audit committee meetings. Given the small size of the Supervisory board and the Management Board, the Boards have agreed that meetings can also be held by phone or video conference, which is in line with Dutch law.
Rule 38: The supervisory board shall define a profile for the management board members that takes into account the enterprise’s business focus and its situation, and shall use this profile to appoint the management board members in line with a predefined appointment procedure. The
supervisory board shall take care that no member of the management board has been convicted by law for a criminal act that would compromise the professional reliability as a management board member. Furthermore, the supervisory board shall also give due attention
to the issue of successor planning.
The appointment and succession policy with regard to our management board are laid down in our Articles of Association and our Corporate Governance Guidelines posted on our website. Head N.V. has not foreseen an age limit for our management board.
Rule 39: The supervisory board shall set up expert committees from among its members depending on the specific circumstances of the enterprise and the number of supervisory board members. These committees shall serve to improve the efficiency of the work of the
supervisory board and shall deal with complex issues. However, the supervisory board may discuss the issues of the committees with the entire supervisory board at its discretion. Each chairperson of a committee shall report periodically to the supervisory board on the work of the
committee. The supervisory board shall ensure that a committee has the authorisation to take decisions in urgent cases. The majority of the committee members shall meet the criteria for independence of the C-Rule 53. The Corporate Governance Report shall state the names of the
committee members and the name of the chairperson. The Corporate Governance Report must disclose the number of meetings of the committees and discuss the activities of the committees.
Other than an audit committee, there is no other committee currently installed at the company. Given the small size of the supervisory board, all issues are dealt with by the entire
HEAD N.V. AND SUBSIDIARIES DIRECTORS’ REPORT
28
board and the installation of separate committees for different issues would not increase efficiency.
Rule 40 (an “L” rule” which therefore refers to Austrian law applicable to Austrian companies): Irrespective of the size of the supervisory board, it shall set up an audit committee in the case of exchange-listed companies. The audit committee shall be responsible for monitoring the
preparations for the accounting procedures; for monitoring the work of the auditor; for the audit and preparation of the confirmation of the financial statements, of the proposal for the distribution of the profit, and of the report of the management board. The audit committee
shall also monitor the group accounting procedures, audit any consolidated financial statements and prepare a proposal for the selection of an auditor for the financial statements and shall report on this to the supervisory board. Furthermore, the audit committee shall
monitor the effectiveness of the company-wide internal control system, if given, of the internal audit system and of the risk management system of the company. At least one person with special knowledge meeting the company’s requirements and practical experience in the area of
finance and accounting and reporting must belong to the audit committee (financial expert). The chairperson of the audit committee or financial expert may not be a person who in the past three years has served as a member of the management board or as management-level staff
or auditor of the company or has signed an auditor’s opinion or for any other reason is not independent and free of prejudice.
It is not a legal requirement under Dutch law to nominate a financial expert that forms part of the Audit Committee. However, the Supervisory Board considers that the Audit Committee members as a group possess adequate skills and expertise to fulfil the tasks entrusted to the Audit Committee.
Rule 51: The remuneration for the financial year to supervisory board members is to be
reported in the Corporate Governance Report for each individual member of the supervisory board. Generally, there are no stock option plans for members of supervisory boards. Should stock option plans be granted in exceptional cases, then these must be decided in every detail
by the general meeting.
The remuneration paid to the supervisory board is disclosed in the Annual Report and determined by the general meeting of shareholders. Given the unchanged and small size of our Supervisory Board in 2011, no separate remuneration schedule for our Supervisory Board has been published in the Annual Report.
Rule 59 (an “L” rule” which therefore refers to Austrian law applicable to Austrian companies): The co-determination rights of employees’ representatives on the supervisory board form part
of the statutory Austrian system of corporate governance in addition to the co-determination rights at the operational level in the form of works councils. The employees’ representatives are entitled to appoint to the supervisory board of a stock corporation one member from among
their ranks for every two members appointed by the general meeting (but not external members from the trade union). (Statutory one-third parity rule). If the number of shareholder representatives is an odd number, then one more member is appointed as an
employee representative. The one-third parity representation rule also applies to all committees of the supervisory board, except for meetings and votes relating to the relationship between the company and the management board members with the exception of resolutions
on the appointment or revocation of an appointment of a member of the management board and on the granting of options on stocks of the company. Employees’ representatives shall exercise their functions on an honorary basis and their appointment may be terminated at any

HEAD N.V. AND SUBSIDIARIES DIRECTORS’ REPORT
29
time only by the works council (central works council). The rights and obligations of employees’ representatives shall be the same as those of shareholders’ representatives; this shall apply, in particular, to the right to receive information and to monitoring rights, to the obligation to act
with due diligence and to maintain secrecy and to their liability for failure to comply. In the event of personal conflicts of interest, employees’ representatives shall abstain from voting, the same being applicable to shareholders’ representatives.
Under Dutch law, there is no such stipulation for entities like Head N.V.
Rule 63 (an “L” rule” which therefore refers to Austrian law applicable to Austrian companies): The company shall disclose – as soon as it gains knowledge thereof – any changes in the shareholder structure, if, as a consequence of the acquisition or disposal of shares in the
company, the percentage of shares representing voting rights held by a shareholder reaches, exceeds or falls below the thresholds of 5 percent, 10 percent, 15 percent, 20 percent, 25 percent, 30 percent, 35 percent, 40 percent, 45 percent, 50 percent, 75 percent or 90 percent.
Under Dutch law it is the obligation of the shareholder - and not the company - to disclose certain percentages to the AFM. The percentages are slightly different from the Austrian Code (5, 10, 15, 20, 25, 30, 40, 50, 60, 75 or 95 percent) (article 5.38 of the Dutch Financial Supervision Act).
Rule 68: The company shall publish annual financial reports, half-yearly financial reports and any other interim reports in English and German language, and shall make these available on the company’s website. If the annual financial report contains consolidated financial
statements, the financial statements prepared under business law contained in the annual report need to be published and made available only in German language.
In accordance with the Austrian Stock Exchange rules, the Company, as a foreign issuer, is only obliged to submit the quarterly results in English.
Rule 73: The management board shall immediately post any director’s Dealing (Article 48d par. 4 Stock Exchange Act) reported on the company’s website and shall keep such information on the website for at least three months. The announcement can also be done by making a
reference to the corresponding website of the Financial Market Authority.
§ 48d) Abs 4 of the Austrian Stock Exchange Act is only applicable for issuers that are incorporated in Austria.
HEAD N.V. AND SUBSIDIARIES DIRECTORS’ REPORT
30
The Dutch Corporate Governance Code
General:
Notwithstanding the above, however, the Company also takes into account the provisions of the Dutch Corporate Governance Code. Although compliance with the Austrian Code of Corporate Governance implies certain deviations from the Dutch Corporate Governance Code, according to the Dutch Corporate Governance Code, departures may be justified in certain circumstances, in particular if supported by the shareholders’ approval as is the case for Head N.V. In addition, similar to the Dutch Corporate Governance Code, also the Austrian Code of Corporate Governance provides for rules to be followed with regard to at least the following topics:
Rules on the composition and duties of the management board, Rules on the Remuneration of the management board, Rules on the Issuance of Stock Option Plans, Rules on Conflict of Interests for management and supervisory board, Rules on the composition and duties of the supervisory board, Rules on the Composition and Duties of the Shareholder Meetings, Rules on Financial Reporting requirements, Rules on Transparency and Auditing, Rules on the Duties of the External Auditor, Rules on Investor Relations and Rules on the Interaction between the supervisory board and the management board.
The differences between the Dutch Corporate Governance Code on the one hand and the Austrian Code of Corporate Governance on the other hand are therefore not as substantial. This is even more true since both Codes have been recently amended to reflect the changes resulting from the European Transparency Directive applicable to all European countries.
In this regard the Dutch Corporate Governance Code Monitoring Committee declared that the existing “comply or explain” rule provides sufficient scope for the Dutch companies listed abroad to comply with the Dutch Code by applying a foreign corporate governance code. The Company has additionally decided to provide explanations in a general form with regard to deviations by the Company from the Dutch Corporate Governance as follows: Principles and best practice provisions:
II.1 The Management Board
The Company’s articles of association provide for a Management Board that is responsible for managing the Company under the general supervision of the Supervisory Board. The Management Board is responsible for complying with all legislations, managing the risks associated with the Company’s activities and for financing the Company.
The members of the Management Board are appointed by the general meeting. Each member of the Management Board may also be suspended or removed at anytime at a general meeting by an affirmative vote of two thirds of the votes cast.
It is not in line with the Company's corporate culture and core values nor is it always in the commercial interests of the Company to limit the length of the contract of the members of the Management Board to four years. The current members of the Management Board have therefore been appointed for an indefinite period of time. Some members of the Management Board have come from the Company’s own ranks or have already been with the Company for a
HEAD N.V. AND SUBSIDIARIES DIRECTORS’ REPORT
31
longer period of time under other employment terms. In these cases, it does not seem to be appropriate to limit the appointment to a four years period. The general meeting should have the flexibility to decide on a case by case basis the length of term for particular members of the Management Board as they deem it appropriate.
According to the Company’s articles of association, the Supervisory Board may agree, with the approval of the Management Board that specific Management Board resolutions are made subject to the Supervisory Board’s approval. No resolutions are specified in the Company’s articles of association that require Supervisory Board approval, nor have any such resolutions been otherwise agreed between the Supervisory Board and the Management Board of the Company.
II.2 Remuneration
Whilst the Company adheres to the principles of the Dutch Corporate Governance Code on remuneration, due to the small size of the Company and limited number of management personnel the Company does not follow all of the best practice provisions. The details of the Company’s remuneration policy are set out under the Remuneration Policy as disclosed in the Corporate Governance Report.
II.3 Conflicts of interest
Mr. Johan Eliasch, who acts as a managing director, is not an independent director given that he, together with his family members, has a beneficial interest in Head Sports Holdings N.V., which indirectly controls Head N.V. All related party transactions between Head N.V. and Mr. Eliasch and/or entities controlled by him and his family members are set out in the section headed Related Party Transactions (see Note 22).
Other than this, there are no potential conflicts of interest between the duties of the members of the Supervisory Board, the members of the Management Board and the executive officers of Head N.V. and their private interests or other duties.
In addition, the Company’s articles of association state that in the event of a conflict of interest between Head N.V. and a member of the Management Board, the company shall be represented by such member of the Management Board or of the Supervisory Board as the Management Board and the Supervisory Board jointly designate for this purpose, which shall be an independent/disinterested member.
III. Supervisory Board
The Supervisory Board does not formally draw up a profile as recommended in the best practice provisions. Due to the size and low complexity of the Company, the size of the Supervisory Board and the close connection between the Supervisory Board and the Management Board this is not deemed necessary.
HEAD N.V. AND SUBSIDIARIES DIRECTORS’ REPORT
32
There is no formal induction program. However, the members of the Supervisory Board are presented to by the Management Board and have access to any information they require and can tour any facility within the Company on request. Key executive officers are available at meetings to discuss any specific functions of the business with the members of the Supervisory Board.
The Supervisory Board does not have direct contact with the works council. Any issues will be brought to the attention of the Supervisory Board by the Management Board.
Both the Supervisory Board and Management Board of the Company are small and have remained broadly unchanged for many years. The rules governing the appointment and replacement of Board Members is set out in the Company’s articles of association and are also summarized in the Supervisory Board report.
IV. The Shareholders and the General Meeting of Shareholders
Preference shares may be issued as a preventive measure against unfriendly takeover bids. The minimum amount required to be paid on the preference shares upon issuance is 25% of the nominal amount issued. In the event of a hostile takeover bid, preference shares may be issued to a legal entity charged with caring for the Company’s interests and preventing influences that may threaten the Company’s continuity, independence or identity. Holders of preference shares do not share in the Company’s reserves and such shares are not listed. The preference shares will be registered shares and share certificates will not be issued. Preference shares can be issued in the same way as ordinary shares, but carry no preemptive rights. Preference shares and ordinary shares have equal voting rights at a general meeting of shareholders. Holders of preference shares will be paid a cumulative annual dividend calculated on the basis of the deposit interest rate of the European Central Bank to the paid up part of their nominal value. To the extent there are distributable profits, the preferential dividend shall be paid first. An allocation of profits to the reserves or the payment of a dividend to holders of ordinary shares may only be effected from the remaining distributable profits.
Authorised but unissued preference shares may be issued by the Management Board, which is also authorised to grant rights to subscribe for such preference shares. Unless extended by the amendment of the Company’s articles of association or by resolution of the shareholders for a period of five years in each instance, these authorisations will end on May 26, 2016, five years after the date of the last annual general meeting of Head N.V. when the authority of the Management Board was extended by resolution of the shareholders.
The Company has not formulated or published a policy on bilateral contracts with shareholders. Due to the small size of the Company, the Company does not deem this necessary. The Company is deemed to comply with the Dutch Corporate Governance Code.
HEAD N.V. AND SUBSIDIARIES DIRECTORS’ REPORT
33
Functioning of the General Meeting of Shareholders
The main powers of the general meeting of shareholders of Head N.V. relate to:
- appointment, suspension and dismissal of members of the Management Board and Supervisory Board;
- adoption of the annual accounts; - release of liability of the members of the Management Board and Supervisory Board; - extension of the authorization of the Management Board to issue shares or grant rights to
subscribe for shares, to restrict or exclude pre-emption rights of shareholders and the authorization of the Management Board to repurchase own shares;
- cancellation of shares; - amendment of the Company’s articles of association; - approval of decisions of the Management Board that would entail a significant change in the
identity or character of the Company or its business. - determination of the remuneration of the members of the Supervisory Board; - approval of stock option plans.
Each shareholder is entitled to attend shareholders' meetings of the Company, address the meeting and to exercise his voting rights either directly or through a proxy. All details of how the shareholder can attend, address and vote at the meeting are included in the convocation. Each share confers the right to cast one vote.
Except where the law or the Articles of Association of the Company otherwise require, all resolutions are adopted by an absolute majority of the votes cast regardless of the percentage of the Company’s issued share capital present or represented at the meeting.
The Management Board of the Company may determine that the right to attend shareholders' meetings may also be exercised by electronic means of communication. As a minimum requirement, the person entitled to attend the meeting via electronic means of communication must be identifiable, he must be able to directly take note of the proceedings of the meeting and, if entitled, to exercise his voting rights. The Management Board may set as additional requirement that persons entitled to attend the meeting can also participate in the deliberation by electronic means of communications. The Management Board may set further conditions to the use of electronic means of communication. Those conditions shall be disclosed with the notice of the meeting.
Amsterdam, April 9, 2012 Johan Eliasch Günter Hagspiel Chief Executive Officer Chief Financial Officer Ralf Bernhart George Nicolai Managing Director Managing Director
HEAD N.V. AND SUBSIDIARIES SUPERVISORY BOARD REPORT
34
Supervisory Board Report
The Supervisory Board is responsible for overseeing the Company’s Management Board and the general course of affairs of the Company’s business. The Company’s Supervisory Board may agree, with the approval of the Management Board, that specific Management Board resolutions be subject to the Supervisory Board’s approval. No resolutions are specified in the Company’s articles of association that require Supervisory Board approval.
The Supervisory Board had three members as of December 31, 2011, whose names and details are set forth below.
Name Age Nationality Title Mr. Jürgen Hintz 69 US Chairman of the Supervisory Board Mr. Viktor Klima 64 Austria Member of the Supervisory Board Mr. Franz Klammer 58 Austria Member of the Supervisory Board
Mr. Jürgen Hintz has been a Member of the Supervisory Board of Head N.V. since May 2003 and was reappointed at the shareholders’ meeting in May 2008 for another four years. In December 2004, Mr. Hintz retired as Group Chief Executive Officer of Novar plc, an international group with core activities in Intelligent Building Systems, Aluminum Extrusion Solutions, and Security Printing Services with an annual turnover of £1.5 billion. Prior to this, he was President and Chief Executive of Carnaud/Metalbox until October 1995, Executive Vice-President and member of the main Board of Procter & Gamble Company and non-Executive Director of Inchcape plc and Apple Computers Inc.
Mr. Viktor Klima has been a member of the Supervisory Board of Head N.V. since October 2000 and was reappointed at the shareholders’ meeting in May 2008 for another four years. He served as Chancellor of the Republic of Austria from January 1997 until his resignation February 2000. In this capacity, Mr. Klima held the Presidency of the European Union in the second half of 1998. Prior to serving as Chancellor, he served as Minister of Finance 1996-97 and Minister of Public Economy and Transport 1992-96. Prior to his political career, he was a member of the management board of the OMV oil company, responsible for finance, capital markets and acquisitions. Prior to this position, he held various management positions within OMV. Mr. Klima took up a senior management position with Volkswagen in October 2000.
Mr. Franz Klammer was appointed as a member of the Supervisory Board of Head N.V. in September 2011. Mr. Franz Klammer ranks as one of the best downhill skiers of all time, overwhelmingly dominating the downhill event for four consecutive World Cup seasons winning 25 World Cup downhill events and a gold medal at the 1976 Winter Olympics. Mr. Klammer was Sportsman of the Year in Austria three times. After retiring from skiing, Mr. Klammer took up tour car racing and in 1990 won the prestigious European Tour Car Championship. Mr. Klammer has established the Franz Klammer foundation to help seriously injured athletes, is ambassador for the United Nations and has chaired the 2014 Salzburg bid for the Winter Olympics. In 2001, one of the Company´s subsidiaries and the Franz Klammer GmbH entered into an agency agreement committing Mr. Franz Klammer to use and promote some of the Company´s products.
Mr. Richard Hurowitz, who joined the Supervisory Board of Head H.V. in May 2010, resigned on March 29, 2011.
All members of the Supervisory Board are “independent” pursuant to the best practice provision of the Austrian and Dutch Corporate Governance Code. None of the Supervisory
HEAD N.V. AND SUBSIDIARIES SUPERVISORY BOARD REPORT
35
Board members are employees of the Company, have received any material direct compensation or have any other material relationship with the Company. The members of the Supervisory Board perform their duties without a mandate and independently of the subsidiary interests connected with the Company.
In 2011, the Supervisory Board performed all duties assigned to it by law and by the Company’s Articles of Association. During the year, four meetings were held with the Management Board. The main topics of discussion were strategy, targets, financing, risk management and annual budgeting. In addition, the Management Board regularly informed the Supervisory Board about the course of business and the financial situation of the Company. None of the members of the Supervisory Board were frequently absent from meetings.
Audit Committee
In 2011, the Audit Committee, which comprises of Mr. Hintz and Mr. Klima held meetings six times in carrying out the audit committee activities. All meetings were attended by the CFO. The Audit Committee discussed quarterly and full year results. Two meetings were attended by the external auditor. The Audit Committee discussed with the Company’s external auditor 2010 annual results. The audit plan 2011 was discussed with the external auditor and the audit fee proposal for 2011 was approved. The Audit Committee also reviewed press releases and quarterly reports as well as management’s assessment of internal control over financial reporting. On a yearly basis, the Audit Committee evaluates its performance and reviews and assesses the adequacy of the Audit Committee charter.
In 2011, the Supervisory Board concluded that due to the small size of the Company, the low complexity of the business and the established internal control structure no internal audit function is required.
Remuneration Policy
Any remuneration paid to the Supervisory Board is determined by the general meeting of shareholders.
Remuneration and further conditions of employment for members of the Management Board are determined by the Supervisory Board in consultation with the Chairman of the Management Board. Remuneration can comprise of a fixed contribution and a variable element. The variable element, when used, is based on the profitability of the Company as reported in its audited financial statements and is based on targets that are set individually with each member of the Management Board. Any grants of options to members of the Management Board will be submitted to the Supervisory Board for their approval. For detailed information on remuneration and stock options see Note 6 of the Company accounts.
The Supervisory Board conducts an annual self-evaluation to determine whether it and the Management Board are functioning effectively. Amsterdam, April 9, 2012 Viktor Klima Jürgen Hintz Franz Klammer Supervisory Board Member Supervisory Board Member Supervisory Board Member
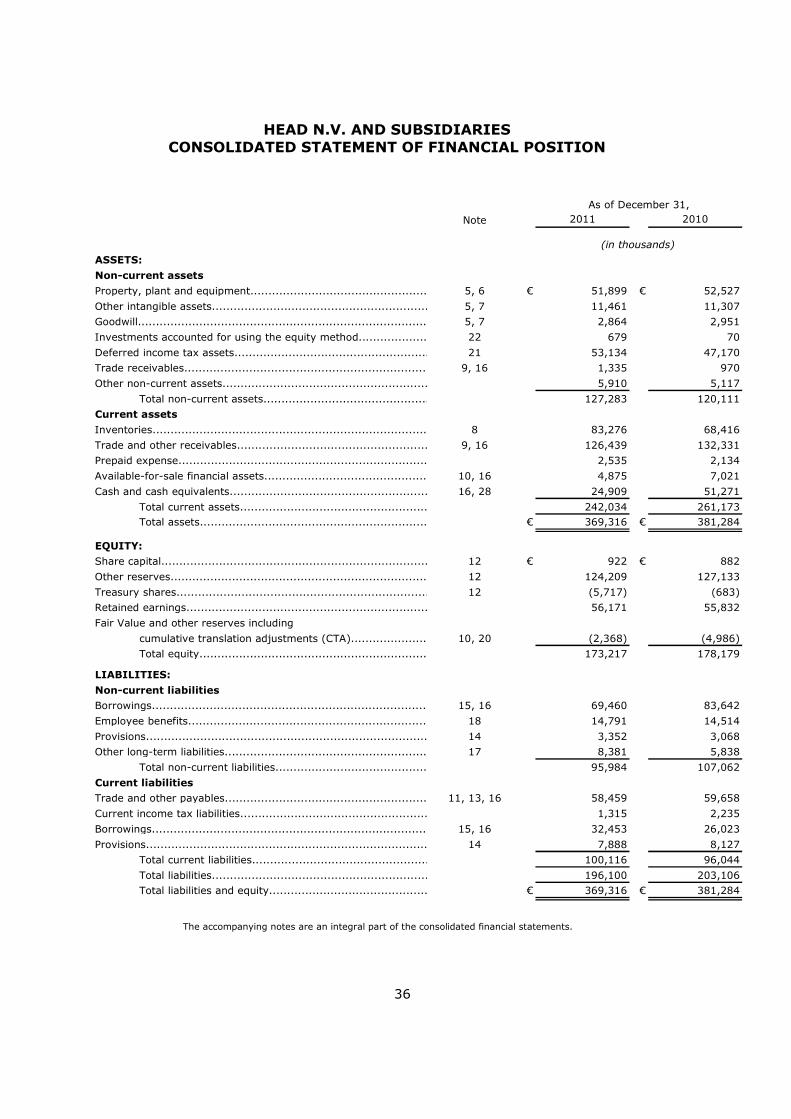
HEAD N.V. AND SUBSIDIARIES CONSOLIDATED STATEMENT OF FINANCIAL POSITION
36
Note 2011 2010
ASSETS:
Non-current assets
Property, plant and equipment................................................................................................5, 6 € 51,899 € 52,527
Other intangible assets..........................................................................................................5, 7 11,461 11,307
Goodwill................................................................................................................................................................................................................5, 7 2,864 2,951
Investments accounted for using the equity method........................................................................................................22 679 70
Deferred income tax assets........................................................................................................21 53,134 47,170
Trade receivables....................................................................................................9, 16 1,335 970
Other non-current assets.................................................................................................... 5,910 5,117
Total non-current assets....................................................................................................... 127,283 120,111
Current assets
Inventories..................................................................................................................8 83,276 68,416
Trade and other receivables....................................................................................................9, 16 126,439 132,331
Prepaid expense................................................................................... 2,535 2,134
Available-for-sale financial assets........................................................................................................10, 16 4,875 7,021
Cash and cash equivalents.............................................................................................16, 28 24,909 51,271
Total current assets....................................................................................................... 242,034 261,173Total assets..............................................................................................................€ 369,316 € 381,284
EQUITY:
Share capital...........................................................................................................12 € 922 € 882
Other reserves.....................................................................................................................12 124,209 127,133
Treasury shares.....................................................................................................................................12 (5,717) (683)
Retained earnings........................................................................................................................ 56,171 55,832
Fair Value and other reserves including
cumulative translation adjustments (CTA).......................................................................................................10, 20 (2,368) (4,986)
Total equity................................................................................................................ 173,217 178,179
LIABILITIES:
Non-current liabilities
Borrowings..................................................................................................................15, 16 69,460 83,642
Employee benefits.............................................................................................................18 14,791 14,514
Provisions......................................................................................................................................................14 3,352 3,068
Other long-term liabilities.............................................................................................................17 8,381 5,838
Total non-current liabilities....................................................................................................... 95,984 107,062
Current liabilities
Trade and other payables.........................................................................................................11, 13, 16 58,459 59,658
Current income tax liabilities....................................................................................................1,315 2,235
Borrowings............................................................................................................15, 16 32,453 26,023
Provisions......................................................................................................................................................14 7,888 8,127
Total current liabilities...................................................................................................... 100,116 96,044
Total liabilities....................................................................................................................... 196,100 203,106
Total liabilities and equity..................................................................................€ 369,316 € 381,284
(in thousands)
As of December 31,
The accompanying notes are an integral part of the consolidated financial statements.
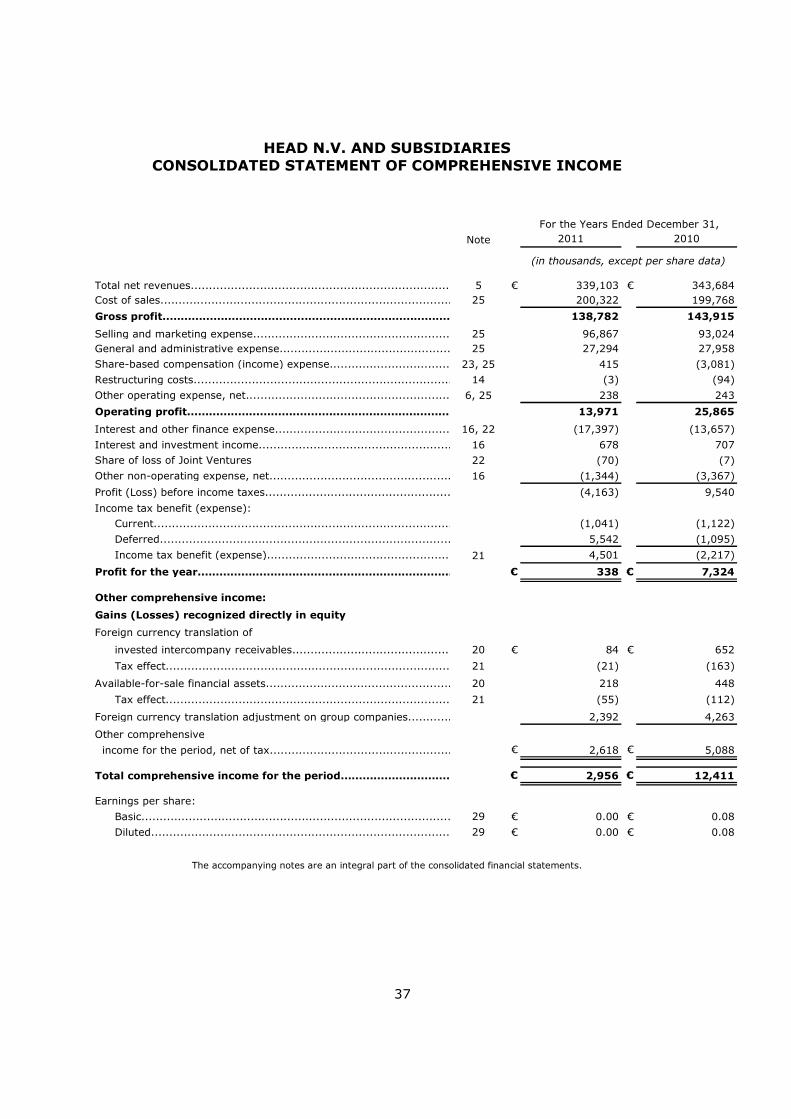
HEAD N.V. AND SUBSIDIARIES CONSOLIDATED STATEMENT OF COMPREHENSIVE INCOME
37
Note 2011 2010
Total net revenues.......................................................................................................................................................................................................................................................................................................5 € 339,103 € 343,684Cost of sales...........................................................................................................25 200,322 199,768
Gross profit.....................................................................................................................................................................................138,782 143,915
Selling and marketing expense.....................................................................................................................................................................................25 96,867 93,024General and administrative expense...........................................................................................................................................................................25 27,294 27,958
Share-based compensation (income) expense..............................................................................................................................23, 25 415 (3,081)
Restructuring costs...........................................................................................................14 (3) (94)
Other operating expense, net...........................................................................................................6, 25 238 243
Operating profit.....................................................................................................................................................................................13,971 25,865
Interest and other finance expense.....................................................................................................................................................................................16, 22 (17,397) (13,657)
Interest and investment income.....................................................................................................................................................................................16 678 707
Share of loss of Joint Ventures 22 (70) (7)
Other non-operating expense, net.....................................................................................................................................................................................16 (1,344) (3,367)
Profit (Loss) before income taxes................................................................................... (4,163) 9,540
Income tax benefit (expense):
Current..................................................................................................................................................................................................(1,041) (1,122)
Deferred..................................................................................................................................................................................................5,542 (1,095)
Income tax benefit (expense).......................................................................................................................................................................................21 4,501 (2,217)
Profit for the year.....................................................................................................................................................................................€ 338 € 7,324
Other comprehensive income:
Gains (Losses) recognized directly in equity
Foreign currency translation of
invested intercompany receivables........................................................................................................20 € 84 € 652
Tax effect..............................................................................................21 (21) (163)
Available-for-sale financial assets........................................................................................................20 218 448
Tax effect..............................................................................................21 (55) (112)
Foreign currency translation adjustment on group companies..................................................2,392 4,263
Other comprehensive
income for the period, net of tax............................................................... € 2,618 € 5,088
Total comprehensive income for the period.........................................................€ 2,956 € 12,411
Earnings per share:
Basic............................................................................................29 € 0.00 € 0.08
Diluted............................................................................................29 € 0.00 € 0.08
(in thousands, except per share data)
For the Years Ended December 31,
The accompanying notes are an integral part of the consolidated financial statements.

HEAD N.V. AND SUBSIDIARIES CONSOLIDATED STATEMENT OF CHANGES IN EQUITY
38
Total
Note Equity
Fair Value
and Other
Other Treasury Retained Reserves/Shares1 Share Capital Reserves Shares Earnings CTA
Balance at January 1, 2010...........................................................................................................................87,944,008 € 882 € 120,944 € (683) € 48,509 € (10,073) € 159,578
Stock option plan, equity settled.......................................................................................................................................................................................23 -- -- 6,189 -- -- -- 6,189
Profit for the year.......................................................................................................................................................................................-- -- -- -- 7,324 -- 7,324
Changes in fair value and other
including CTA reserves..........................................................................................................................................................................10, 20 -- -- -- -- -- 5,088 5,088
Total comprehensive income in 2010...............................................................-- -- -- -- -- -- 12,411
Balance at December 31, 2010...........................................................................................................................87,944,008 € 882 € 127,133 € (683) € 55,832 € (4,986) € 178,179
Share Buy Back March 2011...............................................................12 (8,876,431) -- -- (4,169) -- -- (4,169)
Capital Increase and Exercise of
Stock Option Plans 2009...............................................................12, 23 3,970,748 40 357 -- -- -- 397
Exercise of Stock Option Plans 2009...............................................................23 8,876,431 -- (3,281) 4,169 -- -- 888
Share Buy Backs September 2011...............................................................12 (7,395,483) -- -- (4,314) -- -- (4,314)
Share Buy Back November 2011...............................................................12 (607,207) -- -- (425) -- -- (425)
Share Buy Back December 2011...............................................................12 (393,558) -- -- (295) -- -- (295)
Profit for the year............................................................... -- -- -- -- 338 -- 338
Changes in fair value and other
including CTA reserves..........................................................10, 20 -- -- -- -- -- 2,618 2,618Total comprehensive income in 2011...............................................................-- -- -- -- -- -- 2,956Balance at December 31, 2011...........................................................................................................................83,518,508 € 922 € 124,209 € (5,717) € 56,171 € (2,368) 173,217
1 As of December 31, 2011 treasury shares amounting to 8,656,270 are deducted from the number of shares (2010: 260,022)
Ordinary Shares
(in thousands, except share data)
Attributable to equity holders of the Company
The accompanying notes are an integral part of the consolidated financial statements.

HEAD N.V. AND SUBSIDIARIES CONSOLIDATED STATEMENT OF CASH FLOWS
39
Note 2011 2010
OPERATING ACTIVITIES:
Profit for the year..................................................................................................................................................................................... € 338 € 7,324
Adjustments to reconcile net profit
to net cash provided by operating activities:
Depreciation and amortization..........................................................................................................6, 7 9,742 10,513
Amortization and write-off of debt issuance cost
and bond discount......................................................................................................15 8,590 3,998
Release for leaving indemnity and pension benefits..........................................................................................................18 242 88
Restructuring.............................................................................................14 (3) (94)
Loss on sale of availabe-for-sale financial assets.......................................................................................................................10 98 --
Loss on sale of property, plant and equipment...............................................................................................6 79 42
Share-based compensation (income) expense.............................................................................................................23 415 (3,081)
Deferred income.............................................................................................................17 589 622
Finance costs..........................................................................................................16 7,891 9,057
Interest income..........................................................................................................16 (776) (707)
Income tax expense..........................................................................................................21 1,041 1,122
Deferred tax (benefit) expense.......................................................................................21 (5,542) 1,095
Changes in operating assets and liabilities:
Accounts receivable..........................................................................................................9 7,231 (5,628)
Inventories.........................................................................................................................8 (13,314) (3,864)
Prepaid expense and other assets.......................................................................................................... (903) (730)
Accounts payable, accrued expenses and other liabilities..........................................................................................................13, 14 414 9,544
Interest paid.......................................................................................................... (8,695) (8,909)
Income tax paid.......................................................................................................... (1,903) (891)
Net cash provided by operating activities.................................................................... 5,532 19,501
INVESTING ACTIVITIES:
Purchase of property, plant and equipment...............................................................6 (8,788) (6,536)
Proceeds from sale of property, plant and equipment..............................................6 33 31
Formation of associate................................................................................................................22 (679) --
Proceeds from sale of available-for-sale financial assets.................................................................................10 2,266 --
Interest received.......................................................................................................... 651 185
Net cash used for investing activities.......................................................................... (6,517) (6,321)
FINANCING ACTIVITIES:
Increase in short-term borrowings...............................................................................................................15 4,047 904
Proceeds from long-term debt....................................................................................................................15 22,375 1,813
Payments on long-term debt....................................................................................................................15 (46,174) (1,791)
Share Buy Back...................................................................................................................12 (9,203) --
Exercise of Stock Option Plans 2009/Capital Increase....................................................................................................................12, 23 1,285 --
Change in restricted cash..................................................................................28 (1,822) (1,051)
Net cash used for financing activities.......................................................................... (29,492) (126)
Effect of exchange rate changes on cash and cash equivalents............................. 2,288 231
Net increase (decrease) in cash and cash equivalents..................................................................................................... (28,189) 13,285
Cash and cash equivalents, unrestricted at beginning of period.......................................................................49,309 36,024Cash and cash equivalents, unrestricted at end of period................................................................................€ 21,120 € 49,309
For the Years Ended December 31,
(in thousands)
The accompanying notes are an integral part of the consolidated financial statements.

HEAD N.V. AND SUBSIDIARIES NOTES TO THE CONSOLIDATED FINANCIAL STATEMENTS
40
Note 1 – General information
Head N.V. ("Head" or the "Company") was incorporated in Rotterdam, The Netherlands, on August 24, 1998. The address of its registered office is Prins Bernhardplein 200, 1097 JB Amsterdam, The Netherlands. The Company’s ordinary shares are listed on the Vienna Stock Exchange (“HEAD”). The Company is a leading global manufacturer and marketer of branded sporting goods serving the skiing, tennis and diving markets. The Company has created or acquired a portfolio of brands – Head (principally alpine skis, ski bindings, ski boots, snowboard and protection products, tennis, racquetball and squash racquets, tennis balls and tennis footwear and sportswear), Penn (tennis balls and racquetball balls), Tyrolia (ski bindings), Mares (diving equipment). Head conducts business in Europe (primarily in Austria, Italy, Germany, France, Switzerland, The Netherlands, Spain and the United Kingdom), North America, and Asia.
These consolidated financial statements are authorized for issuance by the Board of Directors as of April 9, 2012 and will be presented to the General Meeting of Shareholders on May 24, 2012.
Note 2 - Summary of Significant Accounting Policies
The principal accounting policies applied in the preparation of these consolidated financial statements are set out below. These policies have been consistently applied to all the years presented, unless otherwise stated. Basis of Presentation The Company and its subsidiaries maintain their accounting records in accordance with their local regulations and have made certain adjustments to these records to present the accompanying financial statements in conformity with International Financial Reporting Standards as adopted by the European Union (“IFRS”). The consolidated financial statements have been prepared under the historical cost convention and fair value accounting for available-for-sale financial assets and derivatives. Percentages and some amounts contained herein have been rounded for ease of presentation, and some amounts may not total due to this rounding. New and amended standards adopted by the group There are no IFRSs or IFRIC interpretations that are effective for the first time for the financial year beginning on or after January 1, 2011 that would be expected to have a material impact on the group.
HEAD N.V. AND SUBSIDIARIES NOTES TO THE CONSOLIDATED FINANCIAL STATEMENTS
41
New standards, amendments and interpretations issued but not effective for the financial year beginning January 1, 2011 and not early adopted Amendments to IFRS 7 “Financial instruments: Disclosures” on derecognition (effective July 1, 2011; endorsed by the EU in November 2011):
This amendment will promote transparency in the reporting of transfer transactions and improve users’ understanding of the risk exposures relating to transfers of financial assets and the effect of those risks on an entity’s financial position, particularly those involving securitisation of financial assets. The group is yet to assess the full impact of the amendments. Amendment to IAS 1 “Financial Statement Presentation” regarding other comprehensive
income (effective July 1, 2012; endorsement by the EU planned in first quarter 2012): The main change resulting from these amendments is a requirement to group items presented in “other comprehensive income (OCI)” on the basis of whether they are potentially reclassifiable to profit or loss subsequently (reclassification adjustments). The amendments do not address which items are presented in OCI. The group is yet to assess the full impact of the amendments. IAS 19 “Employee benefits” (effective January 1, 2013; endorsement by the EU planned in first quarter 2012): The impact on the group will be as follows: to eliminate the corridor approach and recognize all actuarial gains and losses in OCI as they occur; to immediately recognize all past service costs; and to replace interest cost and expected return on plan assets with a net interest amount that is calculated by applying the discount rate to the net defined benefit liability (asset). The group is yet to assess the full impact of the amendments. IFRS 9 “Financial Instruments” (effective January 1, 2015, endorsement by the EU still to be discussed): IFRS 9 is the first standard issued as part of a wider project to replace IAS 39. IFRS 9 retains but simplifies the mixed measurement model and establishes two primary measurement categories for financial assets: amortized cost and fair value. The basis of classification depends on the entity’s business model and the contractual cash flow characteristics of the financial asset. The guidance in IAS 39 on impairment of financial assets and hedge accounting continues to apply. The group is yet to assess the full impact of the amendments. IFRS 10 “Consolidated financial statements” (effective January 1, 2013; endorsement by the EU planned in the third quarter 2012): The objective of IFRS 10 is to establish principles for the presentation and preparation of consolidated financial statements when an entity controls one or more other entities. The new standard defines the principle of control and establishes controls as the basis for consolidation and sets out how to apply the principle of control to identify whether an investor controls an investee and therefore must consolidate the investee as well as the accounting requirements for the preparation of consolidated financial statements. The group is yet to assess the full impact of the amendments. IFRS 11 “Joint arrangements” (effective January 1, 2013; endorsement by the EU planned in the third quarter 2012):
IFRS 11 is a more realistic reflection of joint arrangements by focusing on the rights and obligations of the arrangement rather than its legal form. There are two types of joint arrangement: joint operations and joint ventures. Joint operations arise where a joint operator
HEAD N.V. AND SUBSIDIARIES NOTES TO THE CONSOLIDATED FINANCIAL STATEMENTS
42
has rights to the assets and obligations relating to the arrangement and hence accounts for its interest in assets, liabilities, revenue and expenses. Joint ventures arise where the joint operator has rights to the net assets of the arrangement and hence equity accounts for its interest. Proportional consolidation of joint ventures is no longer allowed. The group is yet to assess the full impact of the amendments. IFRS 12 “Disclosures of interests in other entities” (effective January 1, 2013; endorsement by the EU planned in the third quarter 2012):
IFRS 12 includes the disclosure requirements for all forms of interests in other entities, including joint arrangements, associates, special purpose vehicles and other off balance sheet vehicles. The group is yet to assess the full impact of the amendments. IFRS 13 “Fair value measurement” (effective January 1, 2013; endorsement by the EU planned in the third quarter 2012):
IFRS 13 aims to improve consistency and reduce complexity by providing a precise definition of fair value and a single source of fair value measurement and disclosure requirements for use across IFRSs. The requirements, which are largely aligned between IFRSs and US GAAP, do not extend the use of fair value accounting but provide guidance on how it should be applied where its use is already required or permitted by other standards within IFRSs or US GAAP. The group is yet to assess the full impact of the amendments. IAS 27 (revised 2011) “Separate financial statements” (effective January 1, 2013; endorsement by the EU planned in the third quarter 2012):
IAS 27 (revised 2011) includes the provisions on separate financial statements that are left after the control provisions of IAS 27 have been included in the new IFRS 10. The group is yet to assess the full impact of the amendments. IAS 28 (revised 2011) “Associates and joint ventures” (effective January 1, 2013; endorsement by the EU planned in the third quarter 2012):
IAS 28 (revised 2011) includes the requirements for joint ventures, as well as associates, to be equity accounted following the issue of IFRS 11. The group is yet to assess the full impact of the amendments. There are no other IFRSs or IFRIC interpretations that are not yet effective that would be expected to have a material impact on the group. Consolidation a) Subsidiaries The consolidated financial statements of Head include the financial statements of all majority-owned subsidiaries and entities over which the Company has financial and operating control and special purpose entities. Subsidiaries are fully consolidated from the date on which control is transferred to the Company. They are de-consolidated from the date that control ceases. The acquisition method of accounting is used to account for business combinations by the Company. The consideration transferred for the acquisition of a subsidiary is the fair values of the assets transferred, the liabilities incurred and the equity interests issued by the Company. The consideration transferred includes the fair value of any asset or liability resulting from a contingent consideration arrangement. Acquisition-related costs are expensed as incurred. Identifiable assets acquired and liabilities and contingent liabilities assumed in a business
HEAD N.V. AND SUBSIDIARIES NOTES TO THE CONSOLIDATED FINANCIAL STATEMENTS
43
combination are measured initially at their fair values at the acquisition date. On an acquisition-by-acquisition basis, the Company recognizes any non-controlling interest in the acquiree either at fair value or at the non-controlling interest’s proportionate share of the acquiree’s net assets. The excess of the consideration transferred, the amount of any non-controlling interest in the acquiree and the acquisition-date fair value of any previous equity interest in the acquiree over the fair value of the Company’s share of the identifiable net assets acquired is recorded as goodwill. If this is less than the fair value of the net assets of the subsidiary acquired in the case of a bargain purchase, the difference is recognized directly in the statement of comprehensive income. Intercompany transactions, balances and unrealized gains on transactions between group companies are eliminated. Unrealized losses are also eliminated. Accounting policies of subsidiaries have been changed where necessary to ensure consistency with the policies adopted by the Company. b) Joint Ventures The group’s interests in jointly controlled entities are accounted for using the equity method of accounting. The Company’s share of its Joint Venture post-acquisition profit or loss is recognized in the income statement. When the Company’s share of loss in a Joint Venture equals or exceeds its interest in the Joint Venture, the Company does not recognize further losses, unless it has incurred obligations or made payments on behalf of the Joint Venture. Segment Reporting An operating segment is consistent with the internal reporting provided to the chief operating decision-maker, the Company’s Chief Executive Officer. Decisions regarding strategy, resources, financing, capital investments and insurance are made on the basis of the Company’s performance based on its consolidated operating results and consolidated balance sheet; and liquidity planning is based on the Company’s consolidated cash flows. Based on similar characteristics, the operating segments are aggregated into one reporting segment. Foreign Currency Translation a) Functional and presentation currency Items included in the financial statements of each of the Company’s entities are measured using the currency of the primary economic environment in which the entity operates (“the functional currency”). The consolidated financial statements are presented in euros, which is the Company’s functional and presentation currency. b) Transactions and balances Foreign currency transactions are translated into the functional currency using the exchange rates prevailing on the dates of the transactions. Foreign exchange gains and losses resulting from the settlement of such transactions and from the translation at year end exchange rates of monetary assets and liabilities denominated in foreign currencies are recognized in the income statement. The effect of exchange rate changes on intercompany transactions of a long-term investment nature are recognized in other comprehensive income as a component of fair value and other reserves/CTA. Foreign exchange gains and losses that result from financing and investing activities are presented in the income statement within “Other non-operating income/expense, net”. All other

HEAD N.V. AND SUBSIDIARIES NOTES TO THE CONSOLIDATED FINANCIAL STATEMENTS
44
foreign exchange gains and losses are presented in the income statement within “Other operating income/expense, net”. c) Group companies The results and financial position of all the group entities (none of which has the currency of a hyperinflationary economy) that have a functional currency different from the presentation currency are translated into the presentation currency as follows: - Assets and liabilities for each balance sheet presented are translated at the closing
exchange rate at the date of that balance sheet. - Income and expenses for each income statement are translated at average exchange rates
prevailing during the year. - All resulting exchange differences are recognized in other comprehensive income. Goodwill and fair value adjustments arising on the acquisition of a foreign entity are treated as assets and liabilities of the foreign entity and translated at the closing rate. Property, Plant and Equipment Property, plant and equipment are recorded at cost less accumulated depreciation and impairment losses. Additions and improvements that extend the useful lives of the plant and equipment and replacements, major renewals, and betterments are capitalized and depreciated over the remaining useful life of the asset. The cost of maintenance, repair and minor renewals are expensed as incurred. When plant and equipment is retired or otherwise disposed, the cost and related accumulated depreciation and impairment losses are removed from the related accounts, and any gain or loss on disposition is recognized in earnings. Depreciation is calculated using the straight-line method over the estimated useful lives of the assets. The Company’s buildings are depreciated over a period of 30-50 years, building improvements are depreciated over a period of 10-25 years and machinery and equipment is depreciated over a period of 2-20 years. The assets’ residual values and useful lives are reviewed, and adjusted if appropriate, at each balance sheet date. An asset’s carrying amount is written down immediately to its recoverable amount if the asset’s carrying amount is greater than its estimated recoverable amount (see Note 6). Goodwill and Other Intangible Assets Goodwill represents the excess of the cost of an acquisition over the fair value of the Company’s share of the net identifiable assets of the acquired subsidiary at the date of acquisition. Gains and losses on the disposal of an entity include the carrying amount of goodwill relating to the entity sold. Other intangible assets comprise of trademarks with an indefinite useful life which are carried at cost less accumulated impairment losses and land use rights with a useful life of 50 years, which are carried at cost less accumulated amortization and impairment losses. Amortization of land use rights is calculated using the straight-line method. Goodwill and other intangible assets with an indefinite useful life are allocated to cash generating units for the purpose of impairment testing. The allocation is made to those cash
HEAD N.V. AND SUBSIDIARIES NOTES TO THE CONSOLIDATED FINANCIAL STATEMENTS
45
generating units or groups of cash generating units that are expected to benefit from the business combination in which trademarks and goodwill arose. Impairment of Non-Financial Assets
Assets that have an indefinite useful life are not subject to amortization and are tested annually for impairment and whenever there is an indication that the asset may be impaired. Impairment losses on goodwill are not reversed. Assets that are subject to amortization are reviewed for impairment whenever events or changes in circumstances indicate that the carrying amount may not be recoverable. An impairment is recognized for the amount by which the asset’s carrying amount exceeds its recoverable amount. The recoverable amount is the higher of an asset’s fair value less costs to sell and value in use. For the purposes of assessing impairment, assets are grouped at the lowest levels for which there are separately identifiable cash flows (cash generating units). Non financial assets other than goodwill that suffered an impairment are reviewed for possible reversal of the impairment at each reporting date. Offsetting of Financial Instruments Financial assets and liabilities are offset and the net amount reported in the balance sheet when there is a legally enforceable right to offset the recognized amounts and there is an intention to settle on a net basis, or realise the asset and settle the liability simultaneously. Financial Assets The Company classifies its financial assets in the following categories: financial assets at fair value through profit or loss, loans and receivables, and available-for-sale. The classification depends on the purpose for which the financial assets were acquired. Financial assets are recognized at trade date. Management determines the classification of its financial assets at initial recognition and reevaluates this designation at every reporting date. a) Financial assets at fair value through profit or loss Derivatives are categorized as held for trading unless they are designated as hedges. Assets in this category are classified as current assets if they are either held for trading or are expected to be realized within 12 months of the balance sheet date. b) Loans and receivables Loans and receivables are non-derivative financial assets with fixed or determinable payments that are not quoted in an active market. They are included in current assets, except for those with maturities greater than 12 months after the balance sheet date. These are classified as non-current assets (“Other non-current assets”). Loans and receivables are classified as “trade and other receivables” and “cash and cash equivalents” in the balance sheet (see Note 9). c) Available-for-sale financial assets Available-for-sale financial assets are non-derivatives that are either designated in this category or not classified in any of the other categories. They are included in non-current assets unless management intends to dispose of the investment within 12 months of the balance sheet date.
HEAD N.V. AND SUBSIDIARIES NOTES TO THE CONSOLIDATED FINANCIAL STATEMENTS
46
Available-for-sale financial assets are initially recognized at fair value including any transaction costs. Transaction costs of financial assets carried at fair value through profit or loss are expensed in the income statement. Financial assets are derecognized when the rights to receive cash flows from the investments have expired or have been transferred and the Company has transferred substantially all risks and rewards of ownership. Available-for-sale financial assets and financial assets at fair value through profit or loss are subsequently carried at fair value. Loans and receivables are initially recognized at fair value and subsequently carried at amortized cost using the effective interest method. Changes in the fair value of available-for-sale financial assets are recognized in other comprehensive income. When financial assets classified as available-for-sale are sold or impaired, the accumulated fair value adjustments recognized in equity are included in the income statement as “Interest and investment income”. The Company assesses at each balance sheet date whether there is objective evidence that a financial asset or a group of financial assets is impaired. If any such evidence exists for available-for-sale financial assets, the cumulative loss, measured as the difference between the acquisition cost and the current fair value, less any impairment loss on that financial asset previously recognized in profit or loss, is removed from equity and recognized in the income statement. The accounting policy for trade and other receivables follows. Derivative Financial Instruments and Hedging Activities The Company records all derivatives on the balance sheet at fair value. The Company uses derivative instruments, specifically foreign exchange forward and option contracts, to hedge the foreign exchange risk related to forecasted foreign currency denominated cash flows. However, derivatives are not designated as hedging instruments as part of formal hedge relationship qualifying for hedge accounting under IAS 39. The full fair value of a derivative instrument is classified as a non-current asset or liability when the remaining maturity of the hedged item is more than 12 months, and as a current asset or liability when the remaining maturity of the hedged item is less than 12 months. The Company enters into hedging relationships to limit the foreign exchange rate risk for periods generally not to exceed one year. The Company recognized all changes in the fair value of the instruments in the income statement (“Other non-operating income/expense, net”). The Company does not utilize financial instruments for trading or speculative purposes. Inventories Inventories are stated at the lower of cost and net realizable value. Cost being determined on a first-in first-out basis (“FIFO”). The cost of finished goods and work in progress comprises raw materials, direct labour, other direct costs and related production overheads (based on normal operating capacity). Borrowing costs are not included in the costs of finished goods and work in progress. Net realizable value is the estimated selling price in the ordinary course of business, less applicable variable selling expenses.
HEAD N.V. AND SUBSIDIARIES NOTES TO THE CONSOLIDATED FINANCIAL STATEMENTS
47
Trade and Other Receivables Trade receivables are recognized initially at fair value and subsequently measured at amortized cost using the effective interest method, less any provision for impairment. A provision for impairment of trade receivables is established when there is objective evidence that the Company will not be able to collect all amounts due according to the original terms of receivables. Significant financial difficulties of the debtor, probability that the debtor will enter bankruptcy or financial reorganization, and default or delinquency in payments are considered indicators that the trade receivable is impaired. The amount of the provision is the difference between the asset’s carrying amount and the present value of estimated future cash flows, discounted at the effective interest rate. The carrying amount of the asset is reduced through the use of a provision account, and the amount of the loss is recognized in the income statement within selling and marketing costs. When a trade receivable is uncollectible, it is written off against the provision account for trade receivables. Subsequent recoveries of amounts previously written off are credited against selling and marketing costs in the income statement. Payment terms differ depending on the customer (large distributors, small shops), product line (winter sports is a very seasonal business, whereas racquet sports and diving products experience almost no seasonality), country (payment terms vary in accordance with local practices throughout the world) and past experiences with customers. It is the Company’s normal procedure to agree terms of transactions, including payment terms (60 to 180 days), with customers in advance. In the rental business the Company may have to agree to payment terms over one year and classifies those long-term trade receivables as non-current assets in the consolidated balance sheet.
Cash and Cash Equivalents Cash and cash equivalents comprise of cash and short-term, highly liquid investments with an original maturity of three months or less. Bank overdrafts are shown within “Borrowings” in current liabilities on the balance sheet. Restricted Cash Restricted cash comprises of deposits pledged as collateral. The amounts are collateralized with several financial institutions and earn interest while in deposit. Share Capital Ordinary shares are classified as equity (see Note 12). Where any group company purchases the Company’s equity share capital (treasury shares), the consideration paid, including any directly attributable incremental costs (net of income taxes) is deducted from equity attributable to the Company’s equity holders until the shares are cancelled or reissued. Where such shares are subsequently reissued, any consideration received, net of any directly attributable incremental transaction costs and the related income tax effects, is included in equity attributable to the Company’s equity holders.
HEAD N.V. AND SUBSIDIARIES NOTES TO THE CONSOLIDATED FINANCIAL STATEMENTS
48
Trade and other Payables Trade payables are obligations to pay for goods or services that have been acquired in the ordinary course of business from suppliers. Accounts payable are classified as current liabilities if payment is due within one year or less (or in the normal operating cycle of the business if longer). If not, they are presented as non-current liabilities. Trade and other payables are recognized initially at fair value and subsequently measured at amortized cost using the effective interest method. Borrowings Borrowings are recognized initially at fair value, net of transaction costs incurred. Borrowings are subsequently carried at amortized cost; any difference between the proceeds (net of transaction costs) and the redemption value is recognized in the income statement over the period of the borrowings using the effective interest method. Borrowings are classified as current liabilities unless the Company has an unconditional right to defer settlement of the liability for at least 12 months after the balance sheet date. Current and Deferred Income Tax The tax expense for the period comprises current and deferred tax. Tax is recognized in the income statement, except to the extent that it relates to items recognized directly in other comprehensive income. In this case, the tax is also recognized in other comprehensive income. The current income tax charge is calculated on the basis of the tax laws enacted in the countries where the company’s subsidiaries operate and generate taxable income. Management periodically evaluates positions taken in tax returns with respect to situations in which applicable tax regulation is subject to interpretation. It establishes provisions where appropriate on the basis of amounts expected to be paid to the tax authorities. The Company utilizes the liability method of accounting for deferred income taxes whereby deferred tax assets and liabilities are recognized to reflect the future tax consequences attributable to temporary differences between the financial reporting bases of existing assets and liabilities and their respective tax bases. However, deferred tax liabilities are not recognized if they arise from the initial recognition of goodwill; deferred income tax is not accounted for if it arises from initial recognition of an asset or liability in a transaction other than a business combination that at the time of the transaction affects neither accounting nor taxable profit or loss. With the exception of Head Holding Unternehmensbeteiligung GmbH, all of the Company’s Austrian subsidiaries are included in a consolidated Austrian federal income tax return. Separate provisions for income taxes have been prepared for the Company’s other subsidiaries. Deferred taxes are calculated by using the tax rates that are expected to apply to the period when the asset is realized or the liability is settled. Deferred income tax assets are recognized for tax loss carry-forwards to the extent that the realization of the related tax benefits through future taxable profits is probable. Deferred income tax assets and liabilities are offset when there is a legally enforceable right to offset current tax assets against current tax liabilities and when the deferred income tax assets and liabilities relate to income taxes levied by the same taxation authority on either the same
HEAD N.V. AND SUBSIDIARIES NOTES TO THE CONSOLIDATED FINANCIAL STATEMENTS
49
taxable entity or different taxable entities where there is an intention to settle the balances on a net basis. Employee Benefits
(a) Retirement benefit obligations The Company operates various pensions and other employee benefits schemes. The schemes are partly funded through payments to insurance companies, determined by periodic actuarial calculations. The Company has both defined benefit and defined contribution plans. A defined contribution plan is a plan under which the Company pays fixed contributions into a separate entity. The Company has no legal or constructive obligations to pay further contributions if the fund does not hold sufficient assets to pay all employees’ benefits relating to employee service in the current and prior periods. A defined benefit plan is a plan that is not a defined contribution plan. Typically, defined benefit plans define an amount of benefit that an employee will receive on retirement, usually dependent on one or more factors such as age, years of service and compensation. The liability recognized in the balance sheet in respect of defined benefit pension plans is the present value of the defined benefit obligation at the balance sheet date less the fair value of plan assets, together with adjustments for unrecognized actuarial gains or losses and past service costs. The defined benefit obligation is calculated annually by independent actuaries using the projected unit credit method. The present value of the defined benefit obligation is determined by discounting the estimated future cash outflows using interest rates of high-quality corporate bonds that are denominated in the currency in which the benefits will be paid and that have terms to maturity approximating to the terms of the related pension liability. Actuarial gains and losses arising from experience adjustments and changes in actuarial assumptions in excess of the greater of 10% of the fair value of plan assets or 10% of the defined benefit obligation, except in Italy, are charged or credited to income over the employees’ expected average remaining working lives.
For defined contribution plans, the Company pays contributions to publicly or privately administered insurance plans on a mandatory, contractual or voluntary basis. The Company has no further payment obligations once the contributions have been paid. The contributions are recognized as employee benefit expense when they are due. (b) Termination benefits Termination benefits are payable when employment is terminated by the Company before the normal retirement date, or whenever an employee accepts voluntary redundancy in exchange for these benefits. The Company recognizes termination benefits when it is demonstrably committed to either: terminating the employment of current employees according to a detailed formal plan without possibility of withdrawal; or providing termination benefits as a result of an offer made to encourage voluntary redundancy. Benefits falling due more than 12 months after the balance sheet date are discounted to present value.
HEAD N.V. AND SUBSIDIARIES NOTES TO THE CONSOLIDATED FINANCIAL STATEMENTS
50
(c) Share-based compensation The Company has operated a number of share-based compensation plans. The plans are treated either as equity-settled or cash-settled. The change in fair value of the employee services received in exchange for the grant of the options is recognized in share based compensation expense. The total amount to be expensed over the vesting period is determined by reference to the fair value of the options granted. Non-market vesting conditions are included in assumptions about the number of options that are expected to vest. Provisions Provision for restructuring costs and legal claims are recognized when the Company has a present legal or constructive obligation as a result of past events, it is probable that an outflow of resources will be required to settle the obligation and the amount has been reliably estimated. Restructuring provisions consist mainly of employee termination payments. Provisions are not recognized for future operating losses. The Company provides for the estimated cost of product warranties and product returns at the time revenue is recognized and the Company has a constructive obligation. Warranty provision is established based on the Company’s best estimates of the amounts necessary to settle future and existing claims on products sold as of the balance sheet date. Product return provisions are based on the Company’s historical experiences. Provisions are measured at the present value of the expenditures expected to be required to settle the obligation using a pre-tax rate that reflects current market assessments of the time value of money and the risks specific to the obligation. Revenue Recognition The Company recognizes revenue from the sale of goods, net of VAT, when significant risks and rewards of ownership of the goods are transferred to the buyer. These criteria are generally met when finished products are shipped to the customers and both title and the risks and rewards of ownership are transferred. Revenues from licensing agreements are recognized over the license term for the fixed license revenue portion and based on underlying customer sales once minimum contractual sales volumes are met for the variable license revenue portion. Prepayments received on long-term licensing agreements are recognized in other long-term liabilities. Provisions based on accumulated experience are recorded for estimated product returns at the time revenues are recognized. Sales deductions The Company accrues for customer discounts based upon estimated refund obligations and classifies all sales incentives, which are earned by the Company’s customers subsequent to delivery of its product, including cash discounts, volume rebates other than cash consideration, such as credits that the Company’s customer can use against trade amounts owed, as sales deductions.
HEAD N.V. AND SUBSIDIARIES NOTES TO THE CONSOLIDATED FINANCIAL STATEMENTS
51
Interest Income Interest income is recognized on a time-proportion basis using the effective interest method. When a receivable is impaired, the carrying amount is reduced to its recoverable amount, being the estimated future cash flow discounted at the original effective interest rate of the instrument, and continues unwinding the discount as interest income. Interest income on impaired loans is recognized using the original effective interest rate. Leases Leases in which a significant portion of the risks and rewards of ownership are retained by the lessor are classified as operating leases. Payments made under operating leases (net of any incentives received from the lessor) are charged to the income statement on a straight-line basis over the period of the lease.
The Company leases certain property, plant and equipment. Leases of property, plant and equipment where the Company has substantially all the risks and rewards of ownership are classified as finance leases. Finance leases are capitalized at the lease’s commencement at the lower of the fair value of the leased property or the present value of the minimum lease payments. Each lease payment is allocated between the liability and finance charges. The corresponding rental obligations, net of finance charges, are included in non-current borrowings. The interest element of the finance cost is charged to the income statement over the lease period. The property, plant and equipment acquired under finance leases is depreciated over the shorter of the useful life of the asset or the lease term.
Research and Development Costs Research costs are recognized as costs when incurred. Development costs for changes in design are short term and recognized as cost when they are incurred. Development cost for new products are capitalized if they meet the criteria for recognition as an intangible asset. The Company did not capitalize any development costs. Earnings per share (a) Basic Basic earnings per share are calculated by dividing the profit attributable to equity holders of the Company by the weighted average number of ordinary shares in issue during the year, excluding ordinary shares purchased by the Company and held as treasury shares (see Note 12). (b) Diluted Diluted earnings per share is calculated by adjusting the weighted average number of ordinary shares outstanding to assume conversion of all dilutive potential ordinary shares. In 2010, the Company had one category of dilutive potential ordinary shares: share options, equity-settled under the Plans 2009 (see Note 23). For the share options, a calculation is done to determine the number of shares that could have been acquired at fair value (determined as the average annual market share price of the Company’s shares) based on the monetary value of the

HEAD N.V. AND SUBSIDIARIES NOTES TO THE CONSOLIDATED FINANCIAL STATEMENTS
52
subscription rights attached to outstanding share options. The number of shares calculated as above is compared with the number of shares that would have been issued assuming the exercise of the share options. Note 3 – Financial Risk Management
Financial Risk Factors The Company’s activities expose it to a variety of financial risks: market risk (including currency risk, fair value interest rate risk, cash flow interest rate risk and price risk), credit risk and liquidity risk. The Company’s overall risk management program focuses on the unpredictability of financial markets and seeks to minimize potential adverse effects on the Company’s financial performance. The Company uses derivative financial instruments to hedge certain risk exposures. a) Market Risk Foreign Exchange Risk
The Company operates in a multi-currency environment in which a portion of its revenues and expenses are denominated in currencies other than the euro. The Company is, as a result, subject to currency translation risk and, to a lesser extent, currency transaction risk. Currency translation risk arises because the Company measures and records the financial condition and results of operations of each of its subsidiaries in their functional currency and then translates these amounts into the reporting currency, the euro. The Company incurs transaction risk when one of its subsidiaries enters into a transaction using a currency other than its functional currency, although the Company reduces this risk by seeking, when possible, to match its revenues and costs in each currency. The Company also hedges part of its planned sales to Japan, Switzerland, United Kingdom and Canada through forward contracts and options with Austrian and Italian banks. Shifts in currency exchange rates, particularly between the euro and the U.S. dollar, may affect the Company’s results of operations, e.g. a strengthening of the U.S. dollar would negatively influence the Company’s results. The table below shows the European Central Bank exchange rates for euro for those currencies that mainly influence the Company’s results:
1 Euro = 2011 2010
USD..........................................................................................1.2939 1.3362
CHF..........................................................................................1.2156 1.2504
GBP..........................................................................................0.8353 0.8608
JPY..........................................................................................100.2000 108.6500
CAD..........................................................................................1.3215 1.3322
CZK..........................................................................................25.7870 25.0610
BGN..........................................................................................1.9558 1.9558
CNY..........................................................................................8.1588 8.8220
HKD..........................................................................................10.0510 10.3856
As of December 31,
Due to the marginal foreign currency risk arising from financial instruments the Company does not disclose any further sensitivity analysis.
HEAD N.V. AND SUBSIDIARIES NOTES TO THE CONSOLIDATED FINANCIAL STATEMENTS
53
Price Risk The Company is exposed to marketable securities price risk because of marketable securities held by the Company and classified on the consolidated balance sheet as available-for-sale. To manage its price risk arising from marketable securities, the Company diversifies its portfolio. Due to the marginal price risk the Company does not disclose further sensitivities.
Cash flow and fair value interest rate risk As the Company has no significant interest-bearing assets – except cash – the Company’s income and operating cash flows are substantially independent of changes in market interest rates. Due to relatively low interest rates for cash deposits, the Company does not disclose further sensitivities. The Company operates with several international banks and does not have a lead bank. The Company’s interest rate risk arises from long-term borrowings. Borrowings issued at fixed rates expose the Company to fair value interest rate risk. The Company’s main external financial source arises from its 8.5% Senior Notes and other long-term financial agreements. Borrowings issued at variable rates expose the Company to cash flow interest rate risk. During 2011, the Company’s borrowings at variable rate were denominated in euro, U.S. dollar, Chinese yuan and Japanese yen, during 2010 the Company’s borrowings at variable rate were denominated in euro, Japanese yen and Chinese yuan. Due to the fact that the majority of the borrowings are issued at fixed rates, the Company does not disclose further sensitivities (see Note 15). b) Credit Risk Financial instruments which potentially subject the Company to significant concentrations of credit risk consist primarily of cash, cash equivalents, restricted cash, marketable securities and accounts receivable. The Company places cash with high quality financial institutions. The Company’s customers are concentrated in the retail industry. However, concentrations of credit risk with respect to trade accounts receivable are limited due to the large number of customers and their dispersion across many geographic areas. The Company generally performs credit reviews and sometimes obtains credit insurance before extending credit. The maximum credit risk of financial assets is the carrying amount. c) Liquidity Risk
The Company’s liquidity needs arise principally from working capital requirements, capital expenditures and the semi-annual interest payment on its 8.5% Senior Notes in January and July as well as interest payments on other long-term debt. Given the nature of Winter Sports, and to a lesser extent Racquet Sports and Diving, the Company’s operating cash flow and working capital needs are highly seasonal. The Company’s need for cash is greater in the third and fourth quarters when cash generated from operating activities, together with draw downs from the Company’s bank lines and proceeds from sales of marketable securities, are invested in inventories and receivables. Historically, the Company’s primary sources of liquidity have been cash provided from operating activities, proceeds from the issuance of debt and equity securities and borrowings under various credit facilities available to the Company’s subsidiaries. Cash flow forecasting is performed in the operating entities of the Company and aggregated on group level. Management monitors rolling forecasts of the Company’s liquidity requirements to
HEAD N.V. AND SUBSIDIARIES NOTES TO THE CONSOLIDATED FINANCIAL STATEMENTS
54
ensure it has sufficient cash to meet operational needs while maintaining sufficient headroom on unused lines of credit (see Note 15) at all times so that the group does not breach borrowing limits or covenants (where applicable) on any of its borrowing facilities. Such forecasting takes into consideration the Company’s debt financing plans, covenant compliance, and compliance with internal balance sheet ratio targets. Surplus cash held by the operating entities over and above balance required for working capital management is transferred to the group treasury. Group treasury invests surplus cash in interest bearing current accounts, time deposits, money market deposits and marketable securities, choosing instruments with appropriate maturities or sufficient liquidity to provide sufficient headroom as determined by the above-mentioned forecasts. At December 31, 2011 the Company held money market funds of €4.9 million (2010: €6.8 million) and no other liquid assets (2010: €0.2 million) that are expected to readily generate cash inflows for managing liquidity risk. The table below provides a maturity analysis of the Company’s material contractual obligations as of December 31, 2011 (in thousands):
Contractual Obligations
Less than
1 year 1 - 3 years 3 - 5 years
After 5
years Total
Borrowings, non-current8.50% Senior Notes due 2014 (nominal value).........................................................................€ -- € 27,602 € -- € -- € 27,602Mortgages......................................................................... 4,584 1,969 2,196 1,537 10,285Other Long-Term Debt.........................................................................797 1,664 22,755 2,782 27,997Sale-Leaseback.........................................................................186 412 472 8,288 9,358
Operating Leases.........................................................................4,347 4,385 2,190 1,183 12,106Borrowings, current.........................................................................26,887 -- -- -- 26,887Derivative financial instruments.........................................................................671 -- -- -- 671Trade and other payables.........................................................................41,452 -- -- -- 41,452
Other long-term liabilities.............................................................................................................-- -- -- 166 166
For further details concerning the Company’s interest obligations see Note 15. The table below provides a maturity analysis of the Company’s material contractual obligations as of December 31, 2010 (in thousands):
Contractual Obligations
Less than
1 year 1 - 3 years 3 - 5 years
After 5
years Total
Borrowings, non-current8.50% Senior Notes due 2014 (nominal value).........................................................................€ -- € -- € 28,102 € -- € 28,10210.0% Senior Notes due 2012 (nominal value).........................................................................-- 43,738 -- -- 43,738Mortgages......................................................................... 2,853 1,342 635 669 5,499Other Long-Term Debt.........................................................................649 636 542 7,328 9,155Sale-Leaseback.........................................................................174 386 441 8,531 9,532
Operating Leases.........................................................................4,199 5,114 2,079 274 11,666Borrowings, current.........................................................................22,347 -- -- -- 22,347Derivative financial instruments.........................................................................1,546 -- -- -- 1,546Trade and other payables.........................................................................41,998 -- -- -- 41,998
The Company uses major international banks to deposit its cash and cash equivalents.
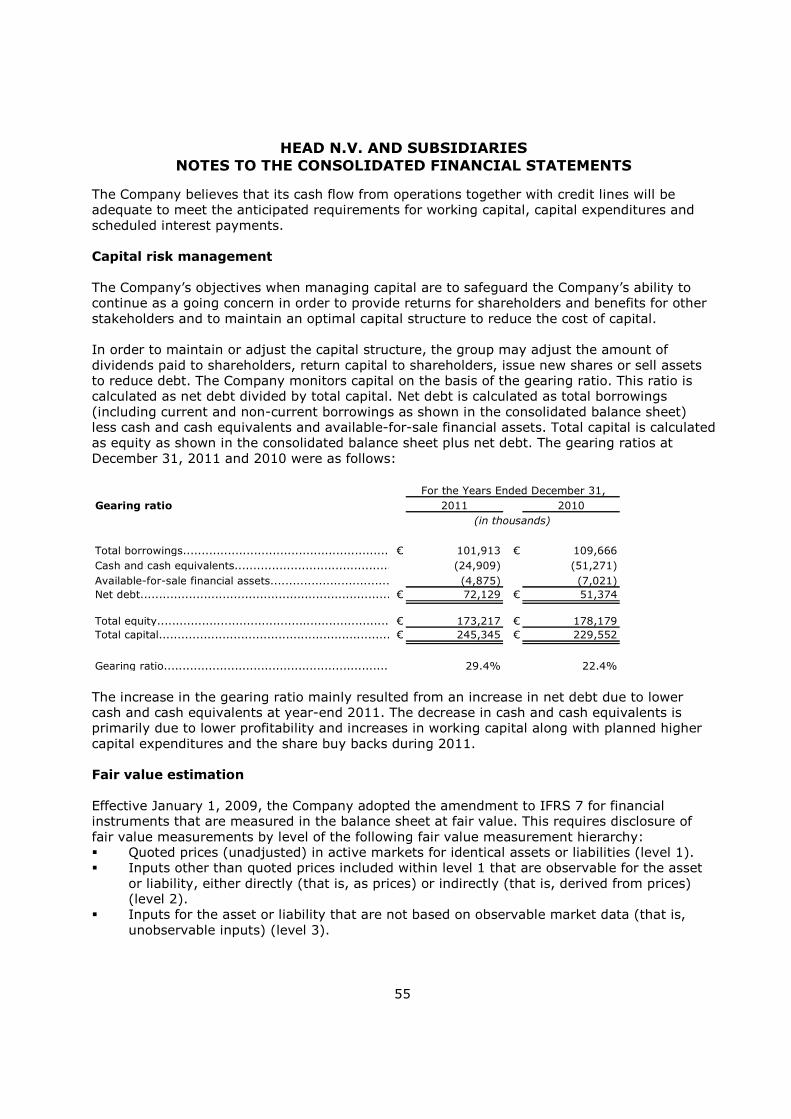
HEAD N.V. AND SUBSIDIARIES NOTES TO THE CONSOLIDATED FINANCIAL STATEMENTS
55
The Company believes that its cash flow from operations together with credit lines will be adequate to meet the anticipated requirements for working capital, capital expenditures and scheduled interest payments. Capital risk management The Company’s objectives when managing capital are to safeguard the Company’s ability to continue as a going concern in order to provide returns for shareholders and benefits for other stakeholders and to maintain an optimal capital structure to reduce the cost of capital. In order to maintain or adjust the capital structure, the group may adjust the amount of dividends paid to shareholders, return capital to shareholders, issue new shares or sell assets to reduce debt. The Company monitors capital on the basis of the gearing ratio. This ratio is calculated as net debt divided by total capital. Net debt is calculated as total borrowings (including current and non-current borrowings as shown in the consolidated balance sheet) less cash and cash equivalents and available-for-sale financial assets. Total capital is calculated as equity as shown in the consolidated balance sheet plus net debt. The gearing ratios at December 31, 2011 and 2010 were as follows:
Gearing ratio 2011 2010
Total borrowings..................................................................................€ 101,913 € 109,666Cash and cash equivalents..................................................................................(24,909) (51,271)Available-for-sale financial assets..................................................................................(4,875) (7,021)Net debt..................................................................................€ 72,129 € 51,374
Total equity..................................................................................€ 173,217 € 178,179Total capital..................................................................................€ 245,345 € 229,552
Gearing ratio..................................................................................29.4% 22.4%
For the Years Ended December 31,
(in thousands)
The increase in the gearing ratio mainly resulted from an increase in net debt due to lower cash and cash equivalents at year-end 2011. The decrease in cash and cash equivalents is primarily due to lower profitability and increases in working capital along with planned higher capital expenditures and the share buy backs during 2011. Fair value estimation Effective January 1, 2009, the Company adopted the amendment to IFRS 7 for financial instruments that are measured in the balance sheet at fair value. This requires disclosure of fair value measurements by level of the following fair value measurement hierarchy: � Quoted prices (unadjusted) in active markets for identical assets or liabilities (level 1). � Inputs other than quoted prices included within level 1 that are observable for the asset
or liability, either directly (that is, as prices) or indirectly (that is, derived from prices) (level 2).
� Inputs for the asset or liability that are not based on observable market data (that is, unobservable inputs) (level 3).
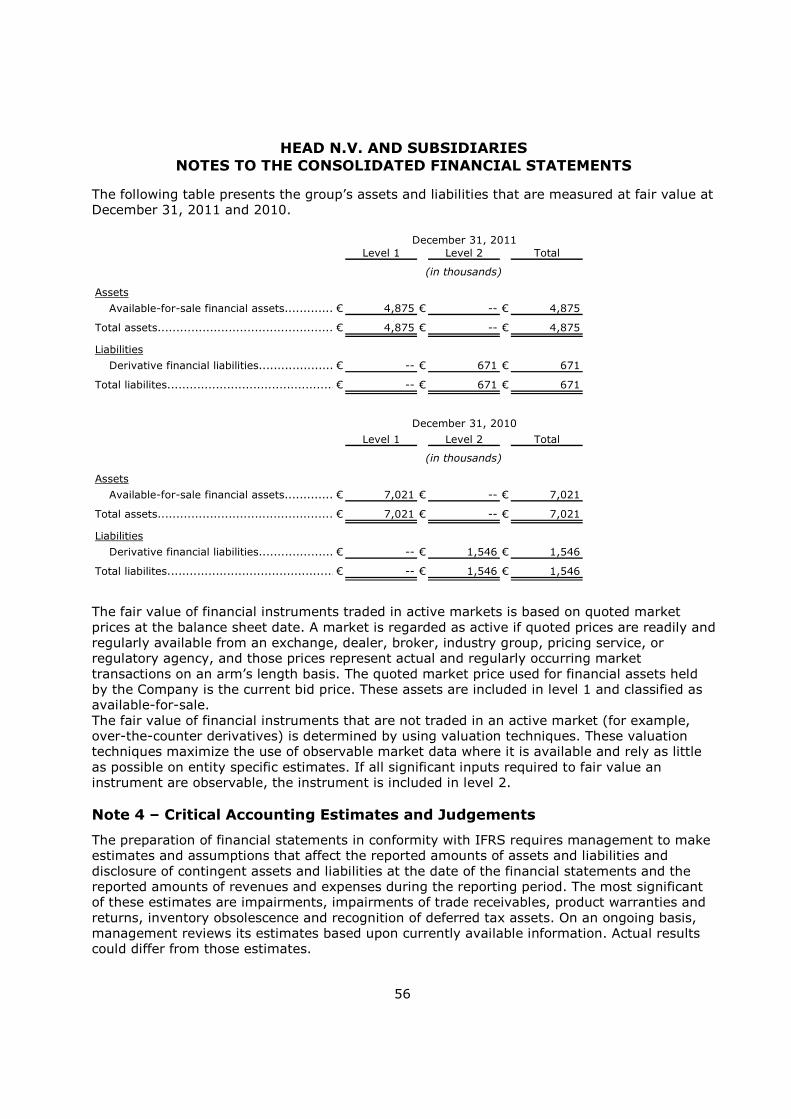
HEAD N.V. AND SUBSIDIARIES NOTES TO THE CONSOLIDATED FINANCIAL STATEMENTS
56
The following table presents the group’s assets and liabilities that are measured at fair value at December 31, 2011 and 2010.
Level 1 Level 2 Total
Assets
Available-for-sale financial assets.........................................................................€ 4,875 € -- € 4,875
Total assets.........................................................................€ 4,875 € -- € 4,875
Liabilities
Derivative financial liabilities.........................................................................€ -- € 671 € 671
Total liabilites.........................................................................€ -- € 671 € 671
December 31, 2011
(in thousands)
Level 1 Level 2 Total
Assets
Available-for-sale financial assets.........................................................................€ 7,021 € -- € 7,021
Total assets.........................................................................€ 7,021 € -- € 7,021
Liabilities
Derivative financial liabilities.........................................................................€ -- € 1,546 € 1,546
Total liabilites.........................................................................€ -- € 1,546 € 1,546
December 31, 2010
(in thousands)
The fair value of financial instruments traded in active markets is based on quoted market prices at the balance sheet date. A market is regarded as active if quoted prices are readily and regularly available from an exchange, dealer, broker, industry group, pricing service, or regulatory agency, and those prices represent actual and regularly occurring market transactions on an arm’s length basis. The quoted market price used for financial assets held by the Company is the current bid price. These assets are included in level 1 and classified as available-for-sale. The fair value of financial instruments that are not traded in an active market (for example, over-the-counter derivatives) is determined by using valuation techniques. These valuation techniques maximize the use of observable market data where it is available and rely as little as possible on entity specific estimates. If all significant inputs required to fair value an instrument are observable, the instrument is included in level 2. Note 4 – Critical Accounting Estimates and Judgements
The preparation of financial statements in conformity with IFRS requires management to make estimates and assumptions that affect the reported amounts of assets and liabilities and disclosure of contingent assets and liabilities at the date of the financial statements and the reported amounts of revenues and expenses during the reporting period. The most significant of these estimates are impairments, impairments of trade receivables, product warranties and returns, inventory obsolescence and recognition of deferred tax assets. On an ongoing basis, management reviews its estimates based upon currently available information. Actual results could differ from those estimates.
HEAD N.V. AND SUBSIDIARIES NOTES TO THE CONSOLIDATED FINANCIAL STATEMENTS
57
Estimated impairment of trademark and goodwill
The Company tests annually whether trademarks with an indefinite useful life and goodwill amounting to €13.6 million have suffered any impairment, in accordance with the accounting policy stated in Note 2. The recoverable amounts of cash-generating units have been determined based on value-in-use calculations. These calculations require the use of estimates (Note 7). No impairment charge was booked in 2011. If the estimated discount rate applied to the discounted cash flows had been 10% higher than management’s estimates, the recoverable amount would be lower by €7.1 million, if the estimated discount rate had been 10% lower than management’s estimates, the recoverable amount would be higher by €8.9 million. These assumptions still do not lead to an impairment. Impairment of trade receivables The Company recorded an impairment of trade receivables for incurred losses amounting to €2.9 million in 2011 resulting from the inability of its customers to make required payments. If the financial condition of the Company’s customers were to deteriorate, resulting in an impairment of their ability to make payments, additional provisions may be required. The Company specifically analyzes accounts receivables and evaluates historical bad debt, customer concentrations, customer creditworthiness, current economic trends and changes in the Company’s customer payment terms when evaluating the adequacy of the impairment of trade receivables. These estimations are continually reviewed. If estimations relating to the percentage of uncollected accounts receivable were increased by 10%, the Company would recognize an additional provision of €0.3 million. Impairment of Long Lived Assets
Property, plant and equipment with a carrying amount of €51.9 million are initially stated at cost. Depreciation on property, plant and equipment is computed using the straight-line method over their estimated useful lives. The Company has determined useful lives of property, plant and equipment after consideration of historical results and anticipated results based on the Company’s current plans. The estimated useful lives represent the period the asset remains in service assuming normal routine maintenance. The Company reviews the estimated useful lives assigned to property, plant and equipment when the business experience suggests that they do not properly reflect the consumption of the economic benefits embodied in the property, plant or equipment nor result in the appropriate matching of cost against revenue. Factors that lead to such a conclusion may include physical observation of asset usage, examination of realized gains and losses on asset disposals and consideration of market trends such as technological obsolescence or change in market demand. When events or changes in circumstances indicate that the carrying amount may not be recoverable, property, plant and equipment are reviewed for impairment. When such assets’ carrying value is greater than the recoverable amount, an impairment loss is recognized. According to IAS 36.12 (d) the Company conducted an impairment test for long lived assets. No impairment charge was booked in 2011. Management determined budgeted gross margin

HEAD N.V. AND SUBSIDIARIES NOTES TO THE CONSOLIDATED FINANCIAL STATEMENTS
58
based on past performance and expected market development. The pre-tax discount rate 2011 is 7.8% (2010: 8.1%) and reflects specific risks relating to the Company’s business. If the estimated discount rate applied to the discounted cash flows had been 10% higher than management’s estimates, the recoverable amount would be lower by €27.4 million, if the estimated discount rate had been 10% lower than management’s estimates, the recoverable amount would be higher by €34.6 million. These assumptions still do not lead to an impairment. Provision for Product Warranties The Company provides for the estimated cost of product warranties and product returns at the time revenue is recognized. The warranty provision amounting to €3.8 million is established based on the Company’s best estimates of the amounts necessary to settle future and existing claims on products sold as of the balance sheet date. Product return provisions are based on historical experiences. While the Company believes that its warranty and product return provisions are adequate and that the judgment applied is appropriate, such amounts estimated to be due and payable could differ materially from what will actually transpire in the future. The Company updates these estimated charges periodically. The actual product performance and/or field expense profiles may differ, and in those cases the Company adjusts its warranty reserves accordingly. Future warranty expenses may exceed the Company’s estimates, which could lead to an increase in cost of sales. Significant differences from estimates did not occur in the past. If revenues and claims were to increase by 10%, the Company would have to recognize an additional provision of €0.4 million. Inventory Obsolescence The Company’s chosen markets are competitive and subject to fluctuations in demand and technological obsolescence. The Company periodically reviews its inventory for obsolescence and declines in market value below cost. Estimated obsolescence or unmarketable inventory led to write-downs amounting to €2.6 million of the Company’s inventory to the estimated market value based upon assumptions about future demand and market conditions. If actual future demand or market conditions were less favourable than those projected by the Company, additional inventory write-downs may be required. Tax Loss Carry Forwards
The Company recognizes deferred tax assets on tax loss carry forwards amounting to €66.5 million for which it is probable that they will be realized. The Company has considered future taxable income and ongoing prudent and feasible tax planning strategies. In the event that the Company was to determine that it would not be able to realize all or part of its net deferred tax assets in the future, an adjustment to the deferred tax assets would be charged to income in the period such determination was made. Changes in local income tax rates may also affect deferred tax assets.

HEAD N.V. AND SUBSIDIARIES NOTES TO THE CONSOLIDATED FINANCIAL STATEMENTS
59
Note 5 - Segment Information
The Company’s business is organized into five divisions for which certain discrete financial information exists. However, the Company’s nature of products and production processes are similar, the customers largely the same and also the distribution channels the Company uses are the same for all products. This and similar long-term average gross margins of the segments implicate their similar economic characteristic. In addition, essential decisions of Company’s chief decision maker, Mr. Johan Eliasch (CEO), regarding strategy, resources, financing, capital investments and insurance are made on the basis of the Company’s performance based on its consolidated operating results and consolidated balance sheet; and liquidity planning is based on the Company’s consolidated cash flows. This fulfils the requirements of IFRS 8.12 for aggregation of more operating segments into one reporting segment. The tables below show net revenues from external customers and long-lived assets by geographic region based on the location of the Company’s subsidiaries:
2011 2010
Revenues from External Customers:
Austria.................................................................................................................€ 152,416 € 149,280
Italy.............................................................................................................................. 32,296 31,336
Other (Europe)................................................................................................................. 44,175 48,433
Asia............................................................................................................... 26,243 27,322
North America................................................................................................................. 83,973 87,314
Total Net Revenues..........................................................................................................€ 339,103 € 343,684
For the Years Ended December 31,
(in thousands)
Although the Company’s homeland is The Netherlands, the Company’s economic domestic market is Austria. The Company has no major customers but a large number of customers who disperse across many geographic areas.
2011 2010
Long-lived assets:
Austria.................................................................................................................€ 19,748 € 19,292
Italy.............................................................................................................................. 7,999 8,355
Other (Europe)................................................................................................................. 19,395 19,865
Asia............................................................................................................... 12,069 12,192
North America................................................................................................................. 7,013 7,081
Total segment assets..........................................................................................................€ 66,225 € 66,785
As of December 31,
(in thousands)
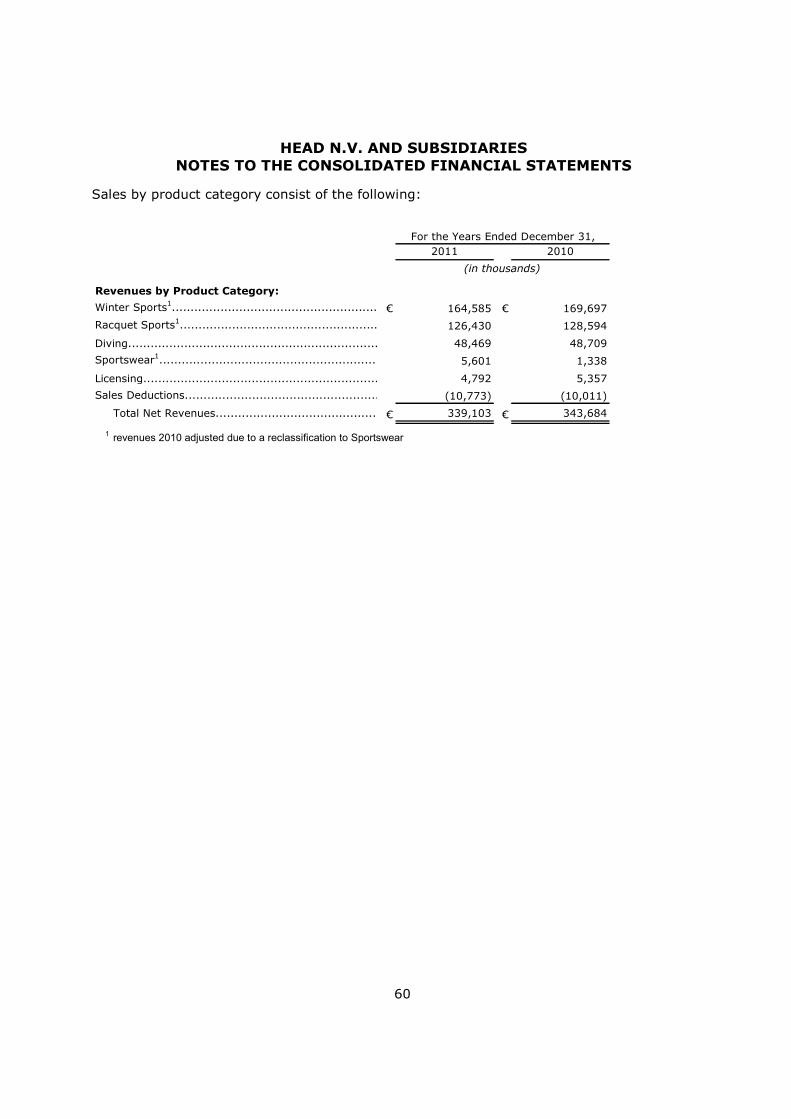
HEAD N.V. AND SUBSIDIARIES NOTES TO THE CONSOLIDATED FINANCIAL STATEMENTS
60
Sales by product category consist of the following:
2011 2010
Revenues by Product Category:
Winter Sports1....................................................................................................................€ 164,585 € 169,697
Racquet Sports1................................................................................................................. 126,430 128,594
Diving.............................................................................................................................. 48,469 48,709
Sportswear1.............................................................................................................................. 5,601 1,338
Licensing......................................................................................................................... 4,792 5,357
Sales Deductions.......................................................................................................... (10,773) (10,011)
Total Net Revenues..........................................................................................................€ 339,103 € 343,684
1revenues 2010 adjusted due to a reclassification to Sportswear
For the Years Ended December 31,
(in thousands)
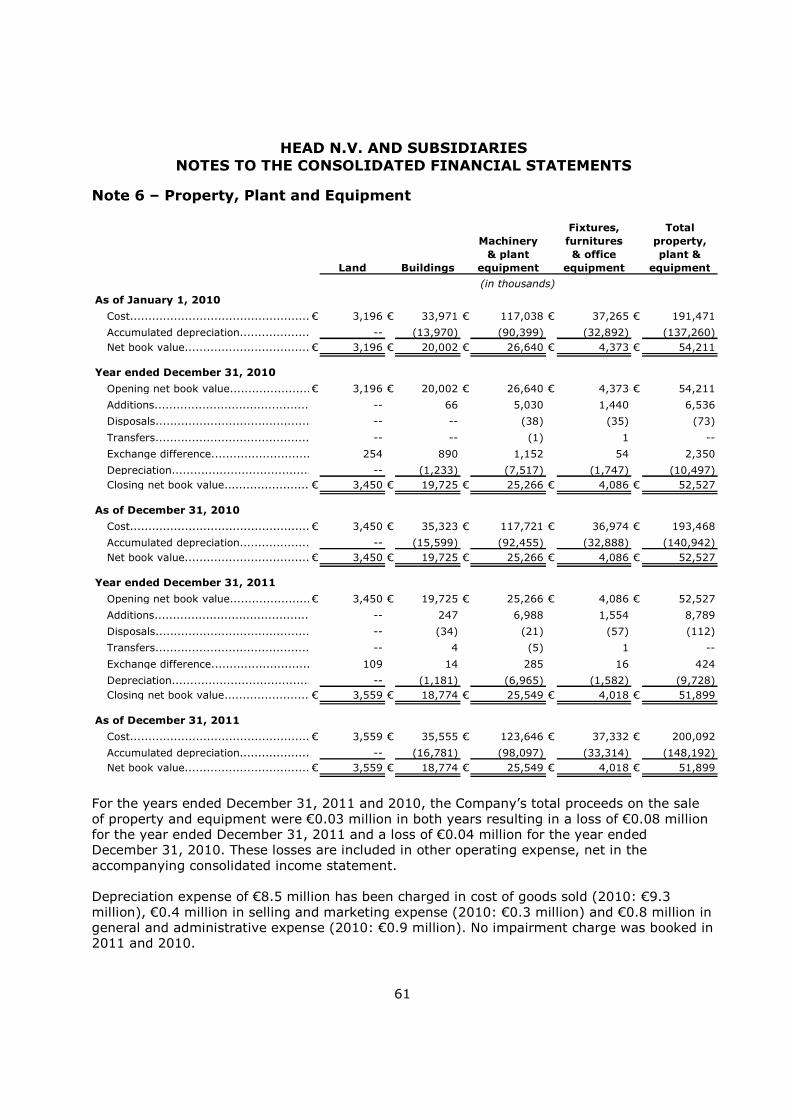
HEAD N.V. AND SUBSIDIARIES NOTES TO THE CONSOLIDATED FINANCIAL STATEMENTS
61
Note 6 – Property, Plant and Equipment
Land Buildings
Machinery
& plant
equipment
Fixtures,
furnitures
& office
equipment
Total
property,
plant &
equipment
As of January 1, 2010
Cost..................................................................................................€ 3,196 € 33,971 € 117,038 € 37,265 € 191,471
Accumulated depreciation..................................................................................................-- (13,970) (90,399) (32,892) (137,260)Net book value...................................................................................................€ 3,196 € 20,002 € 26,640 € 4,373 € 54,211
Year ended December 31, 2010
Opening net book value..................................................................................................€ 3,196 € 20,002 € 26,640 € 4,373 € 54,211
Additions..................................................................................................-- 66 5,030 1,440 6,536
Disposals..................................................................................................-- -- (38) (35) (73)
Transfers..................................................................................................-- -- (1) 1 --
Exchange difference..................................................................................................254 890 1,152 54 2,350
Depreciation..................................................................................................-- (1,233) (7,517) (1,747) (10,497)Closing net book value..................................................................................................€ 3,450 € 19,725 € 25,266 € 4,086 € 52,527
As of December 31, 2010
Cost..................................................................................................€ 3,450 € 35,323 € 117,721 € 36,974 € 193,468
Accumulated depreciation..................................................................................................-- (15,599) (92,455) (32,888) (140,942)Net book value...................................................................................................€ 3,450 € 19,725 € 25,266 € 4,086 € 52,527
Year ended December 31, 2011
Opening net book value..................................................................................................€ 3,450 € 19,725 € 25,266 € 4,086 € 52,527
Additions..................................................................................................-- 247 6,988 1,554 8,789
Disposals..................................................................................................-- (34) (21) (57) (112)
Transfers..................................................................................................-- 4 (5) 1 --
Exchange difference..................................................................................................109 14 285 16 424
Depreciation..................................................................................................-- (1,181) (6,965) (1,582) (9,728)Closing net book value..................................................................................................€ 3,559 € 18,774 € 25,549 € 4,018 € 51,899
As of December 31, 2011
Cost..................................................................................................€ 3,559 € 35,555 € 123,646 € 37,332 € 200,092
Accumulated depreciation..................................................................................................-- (16,781) (98,097) (33,314) (148,192)Net book value...................................................................................................€ 3,559 € 18,774 € 25,549 € 4,018 € 51,899
(in thousands)
For the years ended December 31, 2011 and 2010, the Company’s total proceeds on the sale of property and equipment were €0.03 million in both years resulting in a loss of €0.08 million for the year ended December 31, 2011 and a loss of €0.04 million for the year ended December 31, 2010. These losses are included in other operating expense, net in the accompanying consolidated income statement. Depreciation expense of €8.5 million has been charged in cost of goods sold (2010: €9.3 million), €0.4 million in selling and marketing expense (2010: €0.3 million) and €0.8 million in general and administrative expense (2010: €0.9 million). No impairment charge was booked in 2011 and 2010.

HEAD N.V. AND SUBSIDIARIES NOTES TO THE CONSOLIDATED FINANCIAL STATEMENTS
62
Land and buildings with a carrying value of €9.8 million and €10.0 million as of December 31, 2011 and 2010, respectively, are used to secure loans (see Note 15). Note 7 – Goodwill and Intangible Assets
Goodwill Trademarks Other Total
(in thousands)
As of January 1, 2010
Gross..............................................................................€ 2,744 € 10,564 € 651 € 11,215
Accumulated amortization and
impairment............................................................................ -- (168) (52) (220)
Net book value..............................................................................€ 2,744 € 10,396 € 599 € 10,995
Year ended December 31, 2010
Opening net book value.....................................................................................................€ 2,744 € 10,396 € 599 € 10,995
Exchange difference..................................................................................................... 207 258 68 326
Amortisation......................................................................................... -- -- (14) (14)
Closing net book value.....................................................................................................€ 2,951 € 10,654 € 653 € 11,307
As of December 31, 2010
Gross..............................................................................€ 2,951 € 10,836 € 725 € 11,561
Accumulated amortization and
impairment............................................................................ -- (181) (73) (254)
Net book value..............................................................................€ 2,951 € 10,654 € 653 € 11,307
Year ended December 31, 2011
Opening net book value.....................................................................................................€ 2,951 € 10,654 € 653 € 11,307
Exchange difference..................................................................................................... (86) 116 51 168
Amortisation......................................................................................... -- -- (14) (14)
Closing net book value.....................................................................................................€ 2,864 € 10,770 € 690 € 11,461
As of December 31, 2011
Gross..............................................................................€ 2,864 10,993 784 11,777
Accumulated amortization and
impairment............................................................................ -- (222) (94) (316)
Net book value..............................................................................€ 2,864 € 10,770 € 690 € 11,461
(in thousands)
Intangible Assets
Amortization of €0.01 million (2010: €0.01 million) is included in “Cost of sales” in the consolidated income statement. The Company has determined an indefinite useful life for trademarks as the economic benefit is not limited to a certain period of time. Impairment test for trademarks and goodwill
The Company completed the annual impairment test, in the fourth quarter of 2011 and 2010. Trademarks and goodwill are allocated to the Company’s cash-generating units (“CGUs”) identified according to country of operation and product category.

HEAD N.V. AND SUBSIDIARIES NOTES TO THE CONSOLIDATED FINANCIAL STATEMENTS
63
The following table provides information with regards to the allocation of trademark and goodwill to the CGU:
Racquet Sports Diving
Racquet Sports Diving
Trademark...........................................................................................€ 10,770 € -- € 10,654 € --
Goodwill...........................................................................................€ 1,173 € 1,692 € 1,138 € 1,813
20102011
As of December 31,
(in thousands) (in thousands)
In the impairment test on the trademarks and goodwill, the difference was calculated between the carrying value of the CGU which benefits from the business combination in which trademarks and goodwill arose and its recoverable amount. The recoverable amount of a CGU is determined based on value-in-use calculation. These calculations use cash flow projections based on financial budgets approved by management covering a three-year period. Cash flows beyond the three-year period are extrapolated based on the price increase expected. Management determined budgeted gross margin based on past performance and expected market development. The pre-tax discount rate 2011 is between 7.8% and 8.1% (2010: 8.1%) and reflects specific risks relating to the Company’s business. Note 8 – Inventories
Inventories consist of the following:
2011 2010
Raw materials and supplies.............................................................................................€ 19,124 € 14,756
Work in progress................................................................................................................. 6,317 6,886
Finished goods.................................................................................................................. 69,093 56,257
Provisions....................................................................................................................... (11,258) (9,484)
Total inventories, net.......................................................................................................€ 83,276 € 68,416
As of December 31,
(in thousands)
The cost of inventories recognized as expense and included in “Cost of sales” amounted to €135.4 million and €133.8 million for the year ended December 31, 2011 and 2010, respectively. The Company recognized an addition to the provision of €2.6 million and €0.4 million for impairment of inventories during the year ended December 31, 2011 and 2010, respectively. The Company used a provision for impaired inventories of €0.6 million and €0.9 million for the year ended December 31, 2011 and 2010, respectively.

HEAD N.V. AND SUBSIDIARIES NOTES TO THE CONSOLIDATED FINANCIAL STATEMENTS
64
Note 9 – Trade and Other Receivables
Accounts receivable consist of the following:
2011 2010
Trade debtors...........................................................................................................................€ 131,494 € 134,798
Other receivables................................................................................................................. 7,561 9,168
Allowance for doubtful accounts....................................................................................................................... (11,281) (10,665)
Total accounts receivable, net............................................................................................€ 127,773 € 133,300
Less: long-term portion................................................................................... (1,335) (970)
Short-term portion.......................................................................................................€ 126,439 € 132,331
As of December 31,
(in thousands)
As of December 31, 2011 and 2010, the nominal value of long-term trade receivables was €1.4 million and €1.0 million, respectively. The average interest rate used for discounting was 5.9% and 5.2% for the year ended December 31, 2011 and 2010, respectively. For the Company’s accounts receivable trade there is no credit rating available. As of December 31, 2011 and 2010, for trade receivables that are neither impaired nor past due, there are no indicators that the debtors will not meet their payment obligations. There is no concentration of credit risk with respect to trade receivables, as the Company has a large number of customers, internationally dispersed. Other receivables do not contain impaired assets.

HEAD N.V. AND SUBSIDIARIES NOTES TO THE CONSOLIDATED FINANCIAL STATEMENTS
65
gross reserve net
Accounts Receivable Trade not overdue, not impaired................................................................................................................€ 99,354 € -- € 99,354
Accounts Receivable Trade overdue, not impaired
1 - 30 days..........................................................................................................€ 4,609 € -- € 4,609
31 - 60 days..........................................................................................................523 -- 523
61 - 90 days..........................................................................................................72 -- 72
over 90 days..........................................................................................................249 -- 249
€ 5,453 € -- € 5,453
Accounts Receivable Trade impaired
not overdue..........................................................................................................€ 16,981 5,227 11,754
overdue 1 - 30 days..........................................................................................................940 302 638
overdue 31 - 60 days..........................................................................................................1,612 327 1,285
overdue 61 - 90 days..........................................................................................................856 299 557
overdue over 90 days..........................................................................................................3,507 2,710 797
legal accounts..........................................................................................................2,791 2,416 375
€ 26,687 € 11,281 € 15,406
Accounts Receivable Trade total................................................................................................................€ 131,494 € 11,281 € 120,212
As of December 31, 2011
(in thousands)
gross reserve net
Accounts Receivable Trade not overdue, not impaired................................................................................................................€ 99,731 € -- € 99,731
Accounts Receivable Trade overdue, not impaired
1 - 30 days..........................................................................................................€ 4,942 € -- € 4,942
31 - 60 days..........................................................................................................666 -- 666
61 - 90 days..........................................................................................................188 -- 188
over 90 days..........................................................................................................508 -- 508
€ 6,304 € -- € 6,304
Accounts Receivable Trade impaired
not overdue..........................................................................................................€ 19,485 4,995 14,490
overdue 1 - 30 days..........................................................................................................1,672 558 1,114
overdue 31 - 60 days..........................................................................................................1,353 340 1,013
overdue 61 - 90 days..........................................................................................................356 176 180
overdue over 90 days..........................................................................................................3,199 2,382 817
legal accounts..........................................................................................................2,695 2,214 481
€ 28,762 € 10,665 € 18,097
Accounts Receivable Trade total................................................................................................................€ 134,798 € 10,665 € 124,132
As of December 31, 2010
(in thousands)
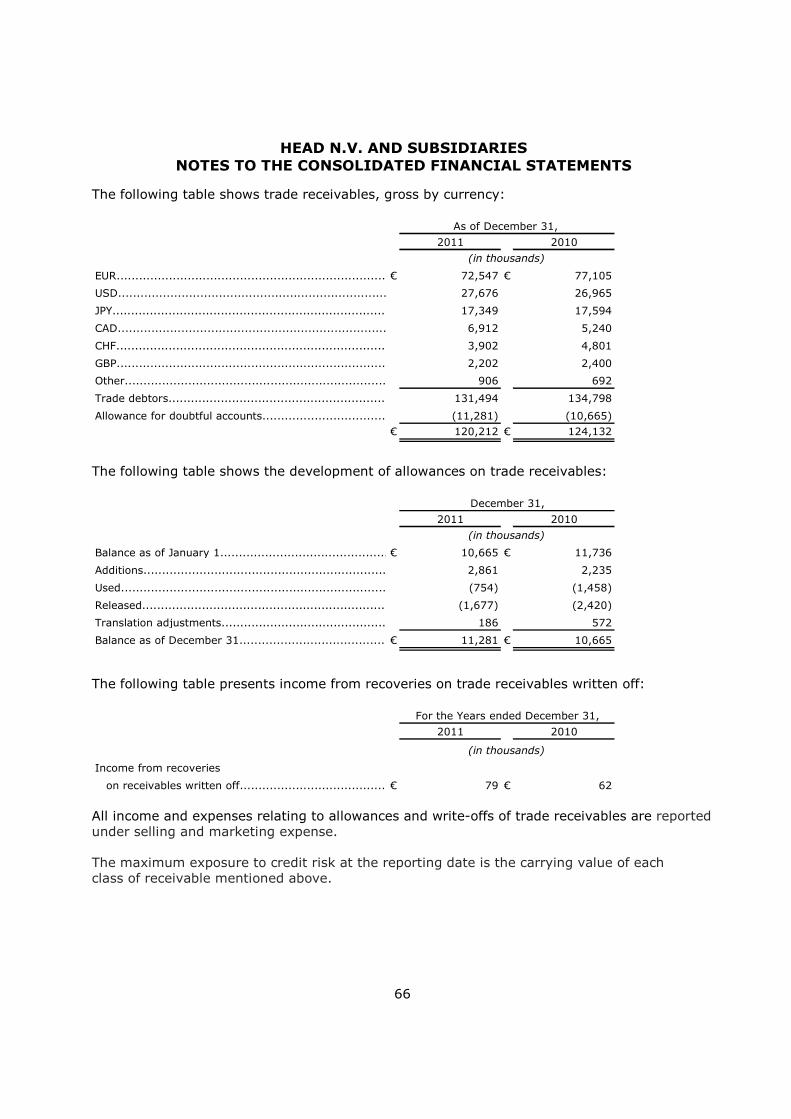
HEAD N.V. AND SUBSIDIARIES NOTES TO THE CONSOLIDATED FINANCIAL STATEMENTS
66
The following table shows trade receivables, gross by currency:
2011 2010
EUR..........................................................................................................€ 72,547 € 77,105
USD..........................................................................................................27,676 26,965
JPY..........................................................................................................17,349 17,594
CAD..........................................................................................................6,912 5,240
CHF..........................................................................................................3,902 4,801
GBP..........................................................................................................2,202 2,400
Other..........................................................................................................906 692
Trade debtors.......................................................................................................131,494 134,798
Allowance for doubtful accounts.......................................................................................................................(11,281) (10,665)€ 120,212 € 124,132
As of December 31,
(in thousands)
The following table shows the development of allowances on trade receivables:
2011 2010
Balance as of January 1................................................................................................................€ 10,665 € 11,736
Additions................................................................................................................2,861 2,235
Used................................................................................................................(754) (1,458)
Released................................................................................................................(1,677) (2,420)
Translation adjustments................................................................................................................186 572
Balance as of December 31................................................................................................................€ 11,281 € 10,665
December 31,
(in thousands)
The following table presents income from recoveries on trade receivables written off:
2011 2010
Income from recoveries
on receivables written off.....................................................................................................€ 79 € 62
(in thousands)
For the Years ended December 31,
All income and expenses relating to allowances and write-offs of trade receivables are reported under selling and marketing expense. The maximum exposure to credit risk at the reporting date is the carrying value of each class of receivable mentioned above.
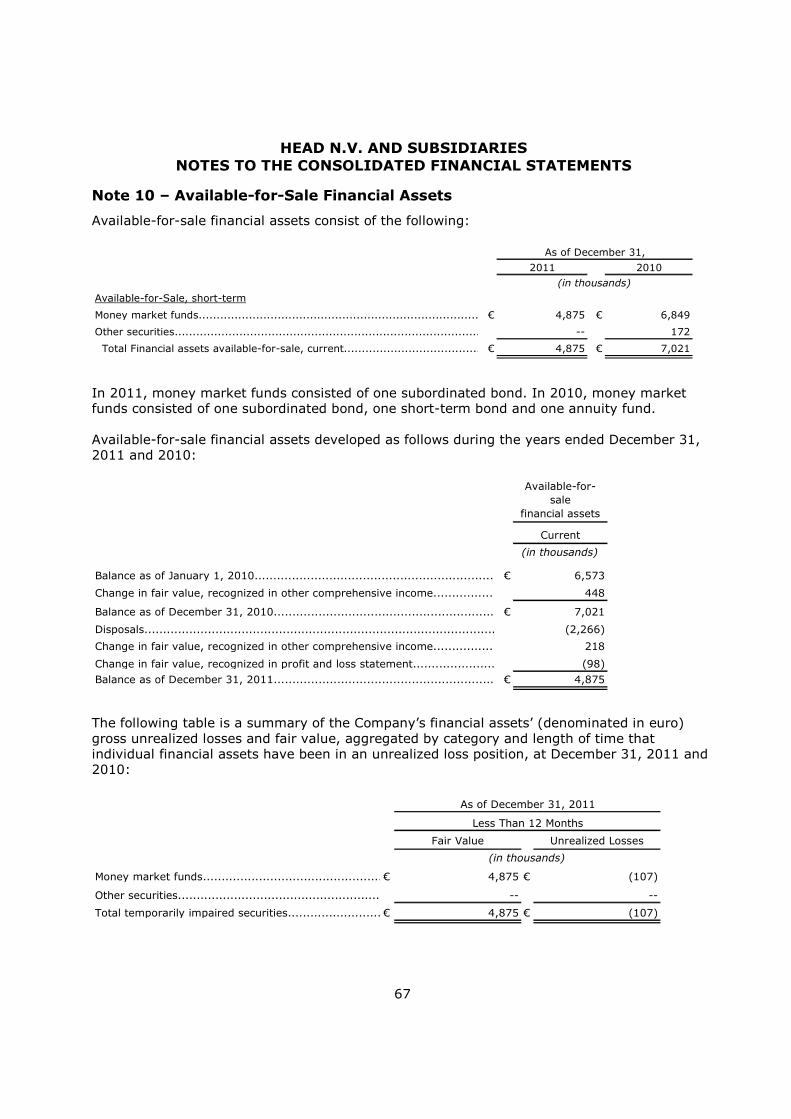
HEAD N.V. AND SUBSIDIARIES NOTES TO THE CONSOLIDATED FINANCIAL STATEMENTS
67
Note 10 – Available-for-Sale Financial Assets
Available-for-sale financial assets consist of the following:
2011 2010
Available-for-Sale, short-term
Money market funds................................................................................................................€ 4,875 € 6,849
Other securities................................................................................................................-- 172
Total Financial assets available-for-sale, current................................................................................................................€ 4,875 € 7,021
As of December 31,
(in thousands)
In 2011, money market funds consisted of one subordinated bond. In 2010, money market funds consisted of one subordinated bond, one short-term bond and one annuity fund. Available-for-sale financial assets developed as follows during the years ended December 31, 2011 and 2010:
Available-for-sale
financial assets
Current
(in thousands)
Balance as of January 1, 2010...............................................................................................€ 6,573
Change in fair value, recognized in other comprehensive income........................................................................448
Balance as of December 31, 2010...........................................................................€ 7,021
Disposals.........................................................................................................................(2,266)
Change in fair value, recognized in other comprehensive income........................................................................218
Change in fair value, recognized in profit and loss statement........................................................................(98)Balance as of December 31, 2011...............................................................................................€ 4,875
The following table is a summary of the Company’s financial assets’ (denominated in euro) gross unrealized losses and fair value, aggregated by category and length of time that individual financial assets have been in an unrealized loss position, at December 31, 2011 and 2010:
Fair Value Unrealized Losses
Money market funds................................................................................................................€ 4,875 € (107)
Other securities...............................................................................................................-- --
Total temporarily impaired securities.........................................€ 4,875 € (107)
(in thousands)
Less Than 12 Months
As of December 31, 2011

HEAD N.V. AND SUBSIDIARIES NOTES TO THE CONSOLIDATED FINANCIAL STATEMENTS
68
Fair Value Unrealized Losses
Money market funds................................................................................................................€ 4,983 € (26)
Other securities...............................................................................................................172 (23)
Total temporarily impaired securities.........................................€ 5,155 € (49)
As of December 31, 2010
Less Than 12 Months
(in thousands)
The Company considers money market funds to be almost cash. None of these financial assets are either past due or impaired. Note 11 - Derivative Financial Instruments
The Company uses derivative instruments, specifically foreign exchange forward and option contracts, to hedge the foreign exchange risk related to its forecasted foreign currency denominated cash flows. The following table provides information regarding the Company’s foreign exchange forward and option contracts as of December 31, 2011 and 2010. The fair value of the foreign currency contracts represent the amount the Company would receive or pay to terminate the contracts, considering first, quoted market prices of comparable agreements, or in the absence of quoted market prices, such factors as interest rates, currency exchange rates and remaining maturity.
in euro
Local currency converted into euro
Carrying value Fair value
Foreign exchange forward contracts...........................................................................................€ 39,461 € 38,732 € (688) € (688)
Foreign exchange option contracts...........................................................................................€ 1,864 € 1,749 € 18 € 18
Notional Principal
As of December 31, 2011
(in thousands)
in euro
Local currency converted into euro
Carrying value Fair value
Foreign exchange forward contracts...........................................................................................€ 42,210 € 40,701 € (1,538) € (1,538)
Foreign exchange option contracts...........................................................................................€ 404 € 378 € (8) € (8)
Notional Principal
(in thousands)
As of December 31, 2010
The counterparties to the foreign currency contracts are major international banks. Such contracts are generally for one year or less. Foreign exchange contracts are recorded in trade and other receivables or trade and other payables according to their fair value.
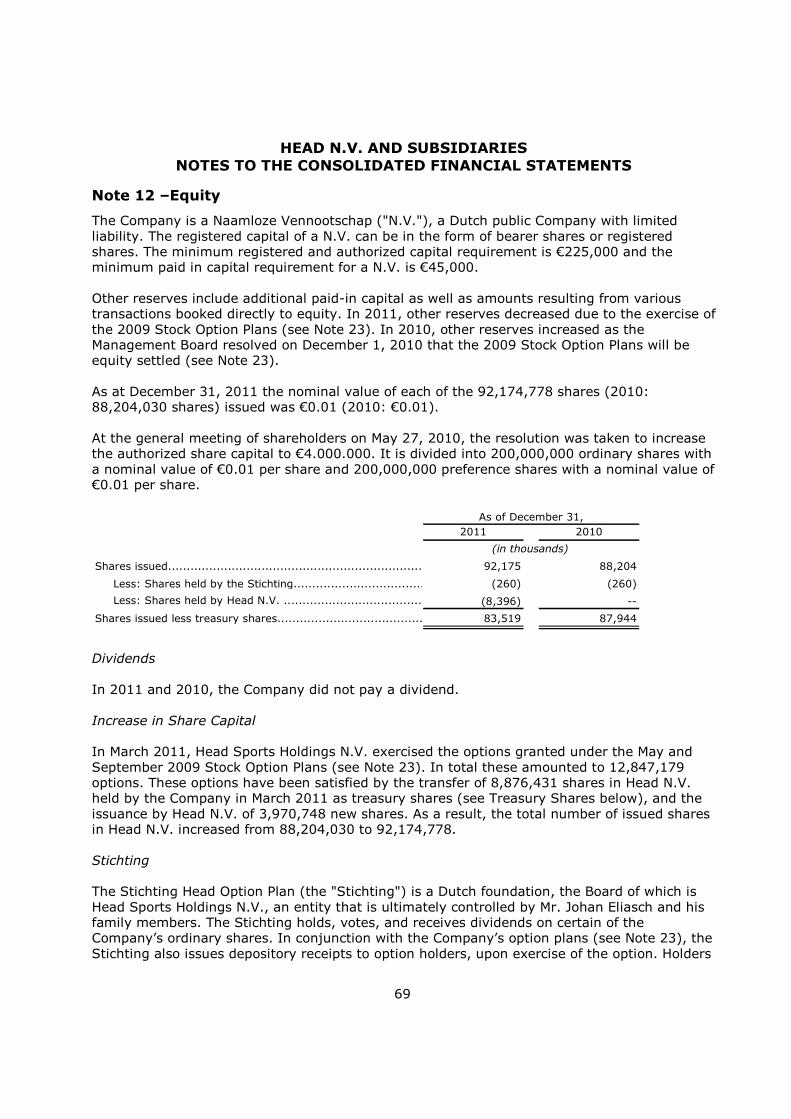
HEAD N.V. AND SUBSIDIARIES NOTES TO THE CONSOLIDATED FINANCIAL STATEMENTS
69
Note 12 –Equity
The Company is a Naamloze Vennootschap ("N.V."), a Dutch public Company with limited liability. The registered capital of a N.V. can be in the form of bearer shares or registered shares. The minimum registered and authorized capital requirement is €225,000 and the minimum paid in capital requirement for a N.V. is €45,000. Other reserves include additional paid-in capital as well as amounts resulting from various transactions booked directly to equity. In 2011, other reserves decreased due to the exercise of the 2009 Stock Option Plans (see Note 23). In 2010, other reserves increased as the Management Board resolved on December 1, 2010 that the 2009 Stock Option Plans will be equity settled (see Note 23). As at December 31, 2011 the nominal value of each of the 92,174,778 shares (2010: 88,204,030 shares) issued was €0.01 (2010: €0.01). At the general meeting of shareholders on May 27, 2010, the resolution was taken to increase the authorized share capital to €4.000.000. It is divided into 200,000,000 ordinary shares with a nominal value of €0.01 per share and 200,000,000 preference shares with a nominal value of €0.01 per share.
2011 2010
Shares issued.............................................................................................92,175 88,204
Less: Shares held by the Stichting.................................................................................................................(260) (260)
Less: Shares held by Head N.V. ...................................................................................(8,396) --
Shares issued less treasury shares.......................................................................................................83,519 87,944
As of December 31,
(in thousands)
Dividends
In 2011 and 2010, the Company did not pay a dividend.
Increase in Share Capital In March 2011, Head Sports Holdings N.V. exercised the options granted under the May and September 2009 Stock Option Plans (see Note 23). In total these amounted to 12,847,179 options. These options have been satisfied by the transfer of 8,876,431 shares in Head N.V. held by the Company in March 2011 as treasury shares (see Treasury Shares below), and the issuance by Head N.V. of 3,970,748 new shares. As a result, the total number of issued shares in Head N.V. increased from 88,204,030 to 92,174,778. Stichting The Stichting Head Option Plan (the "Stichting") is a Dutch foundation, the Board of which is Head Sports Holdings N.V., an entity that is ultimately controlled by Mr. Johan Eliasch and his family members. The Stichting holds, votes, and receives dividends on certain of the Company’s ordinary shares. In conjunction with the Company’s option plans (see Note 23), the Stichting also issues depository receipts to option holders, upon exercise of the option. Holders

HEAD N.V. AND SUBSIDIARIES NOTES TO THE CONSOLIDATED FINANCIAL STATEMENTS
70
of depository receipts are entitled to dividends paid on the Company’s shares and to proceeds on the sales of their shares upon request to the Stichting. However, such holders have no voting rights. As of January 1, 2004, in accordance with SIC 12 “Consolidation – Special Purpose Entity” the Company consolidated the Stichting, as the Company was considered the main beneficiary of the Stichting. As a result of consolidating the Stichting shares held by the Stichting are presented as treasury shares in the consolidated balance sheets. Treasury Shares Pursuant to resolutions which were approved on May 26, 2011 the Board of Management is authorized to buy back a maximum of 50% of the Company’s issued share capital during a period of 18 months. The following table provides information about the movement of the number of treasury shares:
2011 2010
Number of shares as of January 1................................................................................................................260 260
Transfer of treasury shares.................................................................................................................8,396 --
Number of shares as of December 31................................................................................................................8,656 260
As of December 31,
(in thousands)
In March 2011, the Company bought back 8,876,431 ordinary listed shares in Head N.V.. The shares were bought by Head N.V. at a cost of €4,169,119. These shares were used to fulfil Head N.V.´s outstanding obligations under its stock option programs (see Increase in Share Capital above and Note 23). In September 2011, the Company bought back 7,395,483 ordinary listed shares in Head N.V.. These shares were bought by Head N.V. at a cost of €4,314,118. In November 2011, the Company bought back 607,207 ordinary listed shares in Head N.V.. These shares were bought by Head N.V. at a cost of €424,745. In December 2011, the Company bought back 393,558 ordinary listed shares in Head N.V.. These shares were bought by Head N.V. at a cost of €295,169. As of December 31, 2011 the Company owned 8,656,270 shares of treasury shares. 260,022 shares were held by the Stichting, 8,396,248 shares were held by Head N.V.. As of December 31, 2010 the Company owned 260,022 shares of treasury shares, respectively which were held by the Stichting at December 31, 2010. Majority Shareholder Head Sports Holdings N.V and its shareholders controlled 61,089,243 shares, or approximately 66.28% of the Company’s issued shares, as of December 31, 2011. Head Sports Holdings N.V., a Netherlands Antilles corporation, and its shareholders are controlled by Mr. Johan Eliasch and
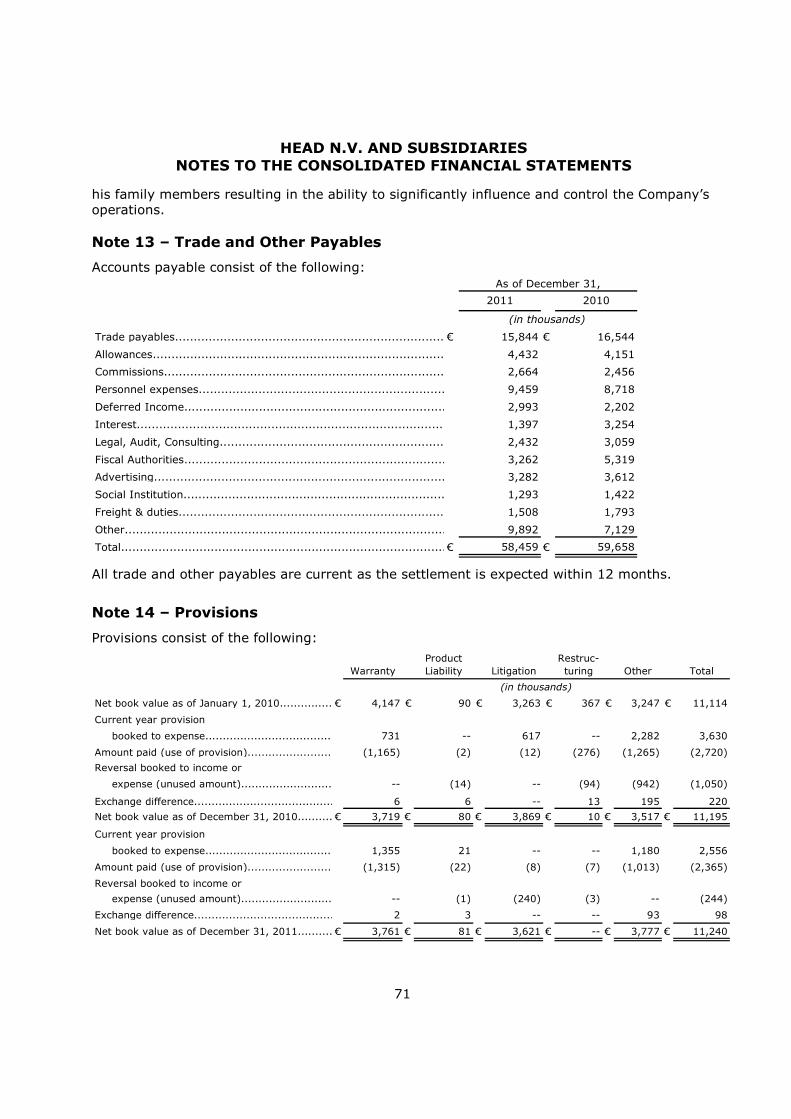
HEAD N.V. AND SUBSIDIARIES NOTES TO THE CONSOLIDATED FINANCIAL STATEMENTS
71
his family members resulting in the ability to significantly influence and control the Company’s operations. Note 13 – Trade and Other Payables
Accounts payable consist of the following:
2011 2010
Trade payables......................................................................................................€ 15,844 € 16,544
Allowances...................................................................................................... 4,432 4,151
Commissions......................................................................................................2,664 2,456
Personnel expenses...................................................................................................... 9,459 8,718
Deferred Income...................................................................................................... 2,993 2,202
Interest............................................................................................................................................................................................................ 1,397 3,254
Legal, Audit, Consulting...................................................................................................... 2,432 3,059
Fiscal Authorities...................................................................................................... 3,262 5,319
Advertising...................................................................................................... 3,282 3,612
Social Institution...................................................................................................... 1,293 1,422
Freight & duties...................................................................................................... 1,508 1,793
Other...................................................................................................... 9,892 7,129
Total......................................................................................................€ 58,459 € 59,658
As of December 31,
(in thousands)
All trade and other payables are current as the settlement is expected within 12 months.
Note 14 – Provisions
Provisions consist of the following:
WarrantyProduct Liability Litigation
Restruc-turing Other Total
Net book value as of January 1, 2010......................................................................................................€ 4,147 € 90 € 3,263 € 367 € 3,247 € 11,114
Current year provision
booked to expense...................................................................................................... 731 -- 617 -- 2,282 3,630
Amount paid (use of provision)...................................................................................................... (1,165) (2) (12) (276) (1,265) (2,720)
Reversal booked to income or
expense (unused amount)...................................................................................................... -- (14) -- (94) (942) (1,050)
Exchange difference...................................................................................................... 6 6 -- 13 195 220
Net book value as of December 31, 2010......................................................................................................€ 3,719 € 80 € 3,869 € 10 € 3,517 € 11,195
Current year provision
booked to expense...................................................................................................... 1,355 21 -- -- 1,180 2,556
Amount paid (use of provision)...................................................................................................... (1,315) (22) (8) (7) (1,013) (2,365)
Reversal booked to income or
expense (unused amount)...................................................................................................... -- (1) (240) (3) -- (244)
Exchange difference...................................................................................................... 2 3 -- -- 93 98
Net book value as of December 31, 2011......................................................................................................€ 3,761 € 81 € 3,621 € -- € 3,777 € 11,240
(in thousands)

HEAD N.V. AND SUBSIDIARIES NOTES TO THE CONSOLIDATED FINANCIAL STATEMENTS
72
2011 2010
Non-current......................................................................................................€ 3,352 € 3,068
Current...................................................................................................... 7,888 8,127
€ 11,240 € 11,195
As of December 31,
(in thousands)
Based on the nature of our business and the liabilities involved, most of our provisions are materially considered current, based on the criteria in IAS 1.69. Warranty
The Company sells certain of its products to customers with a product warranty that provides free of cost repairs or the issuance of credit notes to the customer. The length of the warranty term varies from one to two years and depends on the product being sold. The Company accrues its estimated exposure to warranty claims based upon historical warranty claim costs as a percentage of sales multiplied by prior sales still under warranty at the end of any period. In 2011, the Company classified €2.4 million (2010: €2.1 million) as non-current warranty provision where the outflow of resources occurs after 12 months. Product Liability Some of the Company’s products are used in relatively high-risk recreational settings, and from time to time the Company is named as a defendant in lawsuits asserting product liability claims relating to the Company’s sporting goods products. The Company maintains product liability based on past experiences and taking into account the coverage of the Company’s product liability insurance. Management regularly reviews any cases and adjusts its estimations. Litigation From time to time the Company and its subsidiaries are involved in legal proceedings, claims and lawsuits arising in the ordinary course of business such as suits with several parties including competitors, customers for past receipts, former employees, suppliers and licensees. However, management believes that the resolution of these matters will not materially affect the Company’s financial position.
Restructuring
Reorganization of ski production: In October 2007, the Company announced the transfer of parts of the ski production from its site in Kennelbach, Austria to its site in České Budejovice, Czech Republic to reduce fixed cost. As of December 31, 2007, the Company recognized €1.6 million relating to this program mainly consisting of €1.0 million employee severance cost, €0.5 million cost for deconstruction and €0.1 million engineering cost. As of December 31, 2008, the Company used €0.3 million, €0.3 million of severance cost was released and additional cost of €0.9 million in relation to scrapping and writing off fixed assets and €0.2 million of termination benefits incurred.

HEAD N.V. AND SUBSIDIARIES NOTES TO THE CONSOLIDATED FINANCIAL STATEMENTS
73
In 2009, the Company paid €0.9 million of the accrual. Additional €0.8 million of transfer cost and production inefficiency incurred. The Company largely completed the program during 2009. In 2010, the Company paid €0.3 million of the accrual. Other The Company’s requirements in respect of product return risk in various markets depend on the relationship with the customers and is based on a constructive obligation (IAS 37.10) deriving from a long-term co-operation. Although each and every individual product return is not considered probable, such product return provision is not based on individual considerations, but based on a large population of items, in line with the requirements of providing for warranties and in accordance with the requirements of IAS 37.39. Considering the constructive obligation for product return and the element of a large population of items this does result in a probable outflow of resources. Historically, the actual use of this provision supports the existence of a liability. A provision of €1.0 million was recorded in relation to an environmental matter and was classified as non-current in 2011 and 2010. Note 15 – Borrowings
TotalLess than 1
year 1 - 3 years 3 - 5 years After 5 years
Lines of credit......................................................................................................€ 26,887 € 26,887 € -- € -- € --
Senior notes......................................................................................................27,386 -- 27,386 -- --
Sale-leaseback transaction......................................................................................................9,358 186 412 472 8,288
Mortgages......................................................................................................10,285 4,584 1,969 2,196 1,537
Liabilities against venture partner......................................................................................................2,782 -- -- -- 2,782
Other borrowings, non-current......................................................................................................25,216 797 1,664 22,755 --
€ 101,913 € 32,453 € 31,431 € 25,423 € 12,607
(in thousands)
As of December 31, 2011 (at amortized costs)
TotalLess than 1
year 1 - 3 years 3 - 5 years After 5 years
Lines of credit......................................................................................................€ 22,347 € 22,347 € -- € -- € --
Senior notes......................................................................................................27,790 -- -- 27,790 --
Senior secured notes......................................................................................................35,341 -- 35,341 -- --
Sale-leaseback transaction......................................................................................................9,532 174 386 441 8,531
Mortgages......................................................................................................5,499 2,853 1,342 635 669
Liabilities against venture partner......................................................................................................2,694 -- -- -- 2,694
Other borrowings, non-current......................................................................................................6,462 649 636 542 4,634
€ 109,666 € 26,024 € 37,705 € 29,407 € 16,530
As of December 31, 2010 (at amortized costs)
(in thousands)
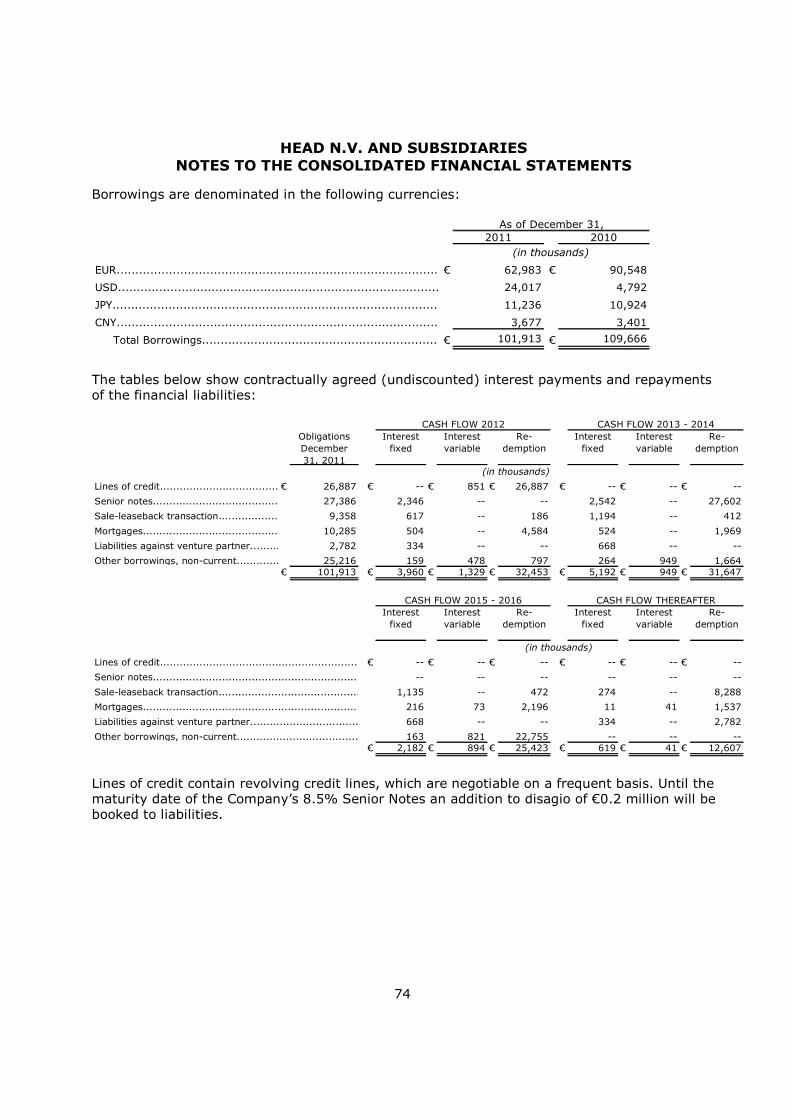
HEAD N.V. AND SUBSIDIARIES NOTES TO THE CONSOLIDATED FINANCIAL STATEMENTS
74
Borrowings are denominated in the following currencies:
2011 2010
EUR.................................................................................................................€ 62,983 € 90,548
USD..................................................................................................................24,017 4,792
JPY..................................................................................................................11,236 10,924
CNY..................................................................................................................3,677 3,401
Total Borrowings..........................................................................................€ 101,913 € 109,666
As of December 31,
(in thousands)
The tables below show contractually agreed (undiscounted) interest payments and repayments of the financial liabilities:
Obligations December 31, 2011
Interest fixed
Interest variable
Re-demption
Interest fixed
Interest variable
Re-demption
Lines of credit......................................................................................................€ 26,887 € -- € 851 € 26,887 € -- € -- € --
Senior notes......................................................................................................27,386 2,346 -- -- 2,542 -- 27,602
Sale-leaseback transaction......................................................................................................9,358 617 -- 186 1,194 -- 412
Mortgages......................................................................................................10,285 504 -- 4,584 524 -- 1,969
Liabilities against venture partner......................................................................................................2,782 334 -- -- 668 -- --
Other borrowings, non-current......................................................................................................25,216 159 478 797 264 949 1,664€ 101,913 € 3,960 € 1,329 € 32,453 € 5,192 € 949 € 31,647
Interest fixed
Interest variable
Re-demption
Interest fixed
Interest variable
Re-demption
Lines of credit......................................................................................................€ -- € -- € -- € -- € -- € --
Senior notes......................................................................................................-- -- -- -- -- --
Sale-leaseback transaction......................................................................................................1,135 -- 472 274 -- 8,288
Mortgages......................................................................................................216 73 2,196 11 41 1,537
Liabilities against venture partner......................................................................................................668 -- -- 334 -- 2,782
Other borrowings, non-current......................................................................................................163 821 22,755 -- -- --€ 2,182 € 894 € 25,423 € 619 € 41 € 12,607
CASH FLOW 2012 CASH FLOW 2013 - 2014
(in thousands)
CASH FLOW 2015 - 2016 CASH FLOW THEREAFTER
(in thousands)
Lines of credit contain revolving credit lines, which are negotiable on a frequent basis. Until the maturity date of the Company’s 8.5% Senior Notes an addition to disagio of €0.2 million will be booked to liabilities.
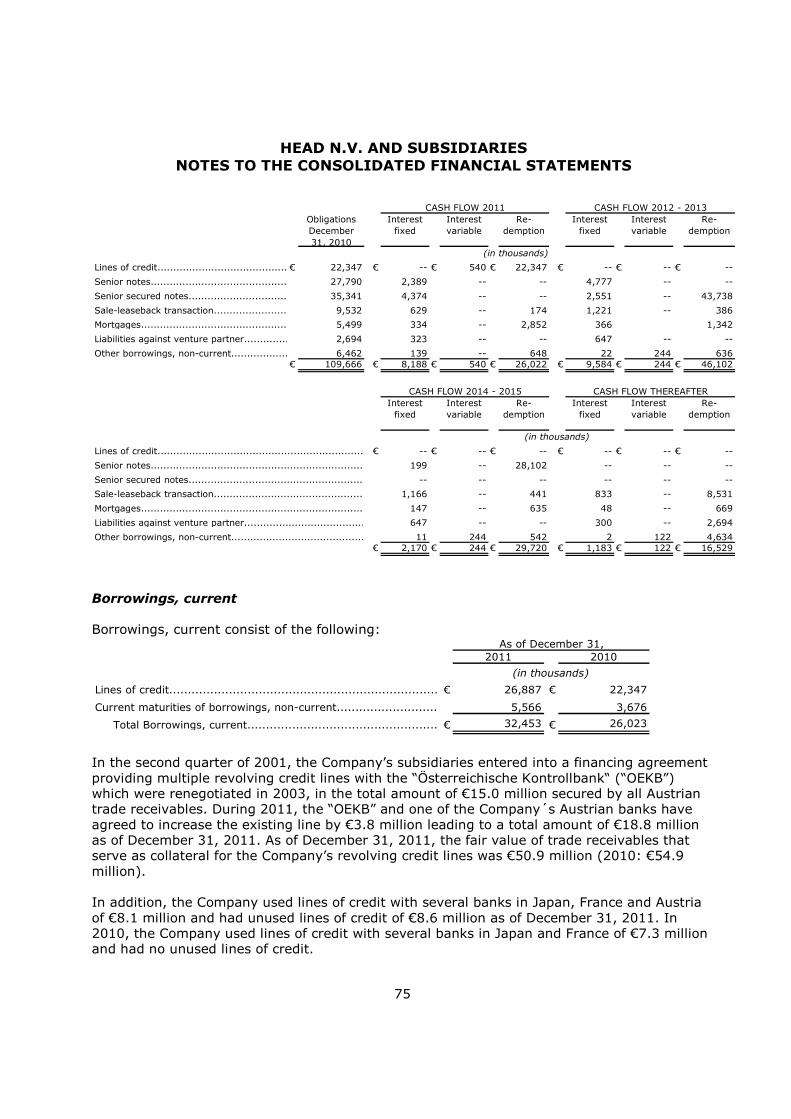
HEAD N.V. AND SUBSIDIARIES NOTES TO THE CONSOLIDATED FINANCIAL STATEMENTS
75
Obligations December 31, 2010
Interest fixed
Interest variable
Re-demption
Interest fixed
Interest variable
Re-demption
Lines of credit......................................................................................................€ 22,347 € -- € 540 € 22,347 € -- € -- € --
Senior notes......................................................................................................27,790 2,389 -- -- 4,777 -- --
Senior secured notes......................................................................................................35,341 4,374 -- -- 2,551 -- 43,738
Sale-leaseback transaction......................................................................................................9,532 629 -- 174 1,221 -- 386
Mortgages......................................................................................................5,499 334 -- 2,852 366 1,342
Liabilities against venture partner......................................................................................................2,694 323 -- -- 647 -- --
Other borrowings, non-current......................................................................................................6,462 139 -- 648 22 244 636€ 109,666 € 8,188 € 540 € 26,022 € 9,584 € 244 € 46,102
Interest fixed
Interest variable
Re-demption
Interest fixed
Interest variable
Re-demption
Lines of credit......................................................................................................€ -- € -- € -- € -- € -- € --
Senior notes......................................................................................................199 -- 28,102 -- -- --
Senior secured notes......................................................................................................-- -- -- -- -- --
Sale-leaseback transaction......................................................................................................1,166 -- 441 833 -- 8,531
Mortgages......................................................................................................147 -- 635 48 -- 669
Liabilities against venture partner......................................................................................................647 -- -- 300 -- 2,694
Other borrowings, non-current......................................................................................................11 244 542 2 122 4,634€ 2,170 € 244 € 29,720 € 1,183 € 122 € 16,529
CASH FLOW 2011 CASH FLOW 2012 - 2013
(in thousands)
CASH FLOW 2014 - 2015 CASH FLOW THEREAFTER
(in thousands)
Borrowings, current Borrowings, current consist of the following:
2011 2010
Lines of credit......................................................................................................€ 26,887 € 22,347
Current maturities of borrowings, non-current......................................................................................................5,566 3,676
Total Borrowings, current......................................................................................................€ 32,453 € 26,023
(in thousands)
As of December 31,
In the second quarter of 2001, the Company’s subsidiaries entered into a financing agreement providing multiple revolving credit lines with the “Österreichische Kontrollbank“ (“OEKB”) which were renegotiated in 2003, in the total amount of €15.0 million secured by all Austrian trade receivables. During 2011, the “OEKB” and one of the Company´s Austrian banks have agreed to increase the existing line by €3.8 million leading to a total amount of €18.8 million as of December 31, 2011. As of December 31, 2011, the fair value of trade receivables that serve as collateral for the Company’s revolving credit lines was €50.9 million (2010: €54.9 million). In addition, the Company used lines of credit with several banks in Japan, France and Austria of €8.1 million and had unused lines of credit of €8.6 million as of December 31, 2011. In 2010, the Company used lines of credit with several banks in Japan and France of €7.3 million and had no unused lines of credit.
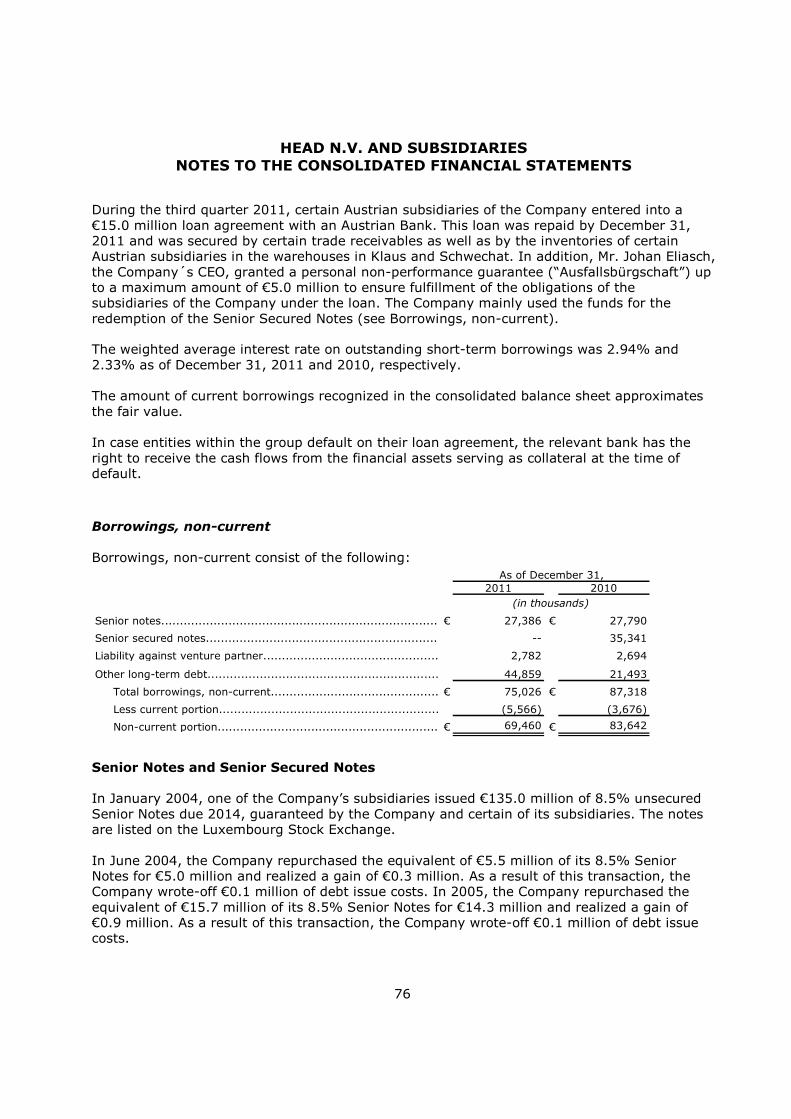
HEAD N.V. AND SUBSIDIARIES NOTES TO THE CONSOLIDATED FINANCIAL STATEMENTS
76
During the third quarter 2011, certain Austrian subsidiaries of the Company entered into a €15.0 million loan agreement with an Austrian Bank. This loan was repaid by December 31, 2011 and was secured by certain trade receivables as well as by the inventories of certain Austrian subsidiaries in the warehouses in Klaus and Schwechat. In addition, Mr. Johan Eliasch, the Company´s CEO, granted a personal non-performance guarantee (“Ausfallsbürgschaft”) up to a maximum amount of €5.0 million to ensure fulfillment of the obligations of the subsidiaries of the Company under the loan. The Company mainly used the funds for the redemption of the Senior Secured Notes (see Borrowings, non-current).
The weighted average interest rate on outstanding short-term borrowings was 2.94% and 2.33% as of December 31, 2011 and 2010, respectively. The amount of current borrowings recognized in the consolidated balance sheet approximates the fair value. In case entities within the group default on their loan agreement, the relevant bank has the right to receive the cash flows from the financial assets serving as collateral at the time of default. Borrowings, non-current Borrowings, non-current consist of the following:
2011 2010
Senior notes......................................................................................................€ 27,386 € 27,790
Senior secured notes......................................................................................................-- 35,341
Liability against venture partner......................................................................................................2,782 2,694
Other long-term debt...................................................................................................... 44,859 21,493
Total borrowings, non-current......................................................................................................€ 75,026 € 87,318
Less current portion......................................................................................................(5,566) (3,676)
Non-current portion......................................................................................................€ 69,460 € 83,642
As of December 31,
(in thousands)
Senior Notes and Senior Secured Notes In January 2004, one of the Company’s subsidiaries issued €135.0 million of 8.5% unsecured Senior Notes due 2014, guaranteed by the Company and certain of its subsidiaries. The notes are listed on the Luxembourg Stock Exchange. In June 2004, the Company repurchased the equivalent of €5.5 million of its 8.5% Senior Notes for €5.0 million and realized a gain of €0.3 million. As a result of this transaction, the Company wrote-off €0.1 million of debt issue costs. In 2005, the Company repurchased the equivalent of €15.7 million of its 8.5% Senior Notes for €14.3 million and realized a gain of €0.9 million. As a result of this transaction, the Company wrote-off €0.1 million of debt issue costs.

HEAD N.V. AND SUBSIDIARIES NOTES TO THE CONSOLIDATED FINANCIAL STATEMENTS
77
On April 21, 2009, the Company announced a private exchange offer to exchange its outstanding €135.0 million 8.5 % Senior Notes due 2014. On July 30, 2009, after negotiations with a group of major bondholders, the Company announced the improved terms of the exchange offer put forward by the Company in order to guarantee the success of the exchange and safeguard the Company’s economic survival. The offer consisted of €510.625 aggregate principal amount of newly issued secured notes (Senior Secured Notes) and 262,372 ordinary shares for each €1,000 principal amount of existing notes exchanged. As of the expiration date, €85,723,000 in principal amount of existing notes had been validly tendered (75.3% taking into account the cancellation of €21.2 million 8.5% Senior Notes held by a subsidiary) and were accepted for exchange into approximately €43,738,000 in aggregate principal amount of Senior Secured Notes and 22,491,278 shares newly issued to the note holders. Redemption of the Senior Secured Notes In March 2011 and in August 2011, HTM Sport GmbH, one of the Company’s subsidiaries, bought back €14,405,000 and €571,000, respectively, of par value of the Senior Secured Notes to reduce the Company’s cost of capital. On September 21, 2011, the Company announced the redemption in full of their outstanding Senior Secured Notes due 2012. The aggregate redemption price for the Notes to be redeemed was €29,409,145, which comprises 100.00% of the principal amount of €28,762,000 and accrued and unpaid interest to the redemption date of €647,145. The redemption date was October 21, 2011. The redemption price was paid from excess cash generated by the Company and new financing agreements as described within this note. The redemption led to an acceleration of the amortization of the non-cash disagio costs. The amortization (in total) for the Senior Secured Notes amounted to €8.4 million for 2011. Buy Back Senior Notes In October 2011, HTM Sport GmbH, one of the Company´s subsidiaries, bought back €500,000 of par value of the Senior Notes to reduce the Company´s cost of capital. These notes are cancelled. At December 31, 2011, the Company had €27.4 million (2010: €27.8 million) of Senior Notes outstanding. At December 31, 2010, the Company had €35.3 million of Senior Secured Notes outstanding. The effective interest rate for the Senior Notes in 2011 was 8.6%. Liability against venture partner In July 2005, the Company signed an agreement for the establishment of a company in the British Virgin Islands. The business venture was established to found a Chinese company which manufactures tennis balls for exclusive sale to the Company. The Company and its venture partner have a 83% and 17% interest in the newly formed company, respectively. This venture qualifies as a special purpose entity due to the fact that the Chinese company was formed to
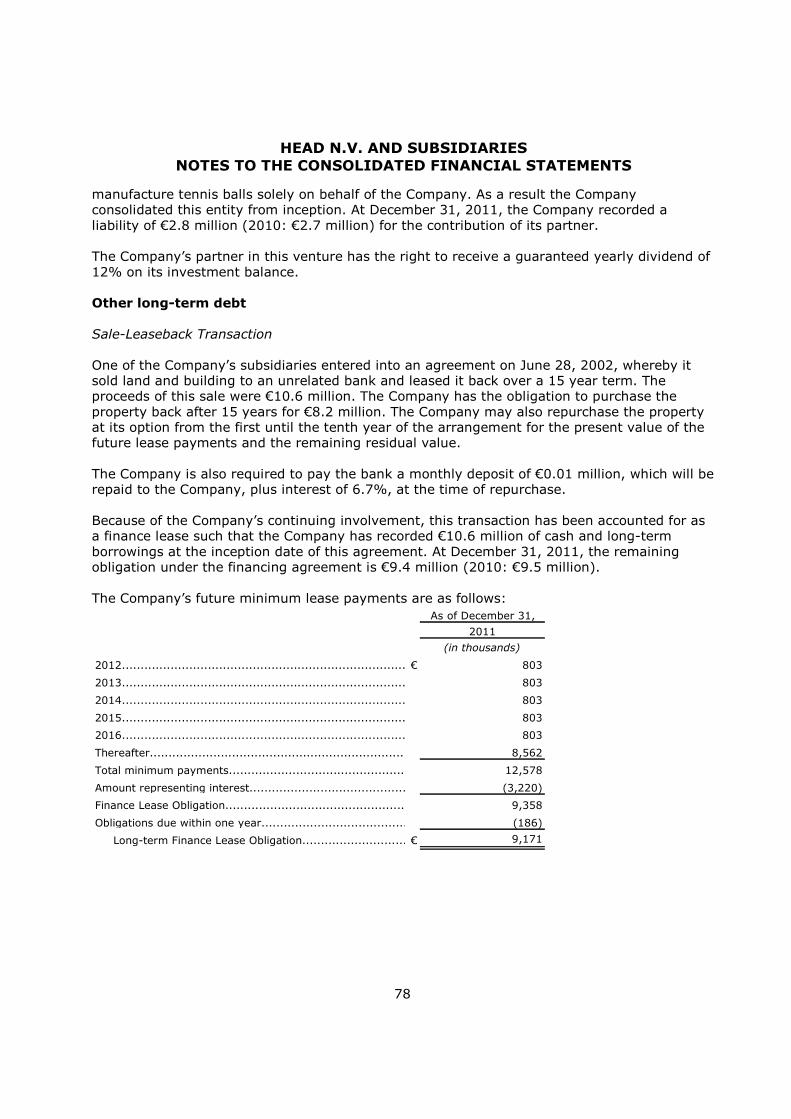
HEAD N.V. AND SUBSIDIARIES NOTES TO THE CONSOLIDATED FINANCIAL STATEMENTS
78
manufacture tennis balls solely on behalf of the Company. As a result the Company consolidated this entity from inception. At December 31, 2011, the Company recorded a liability of €2.8 million (2010: €2.7 million) for the contribution of its partner. The Company’s partner in this venture has the right to receive a guaranteed yearly dividend of 12% on its investment balance. Other long-term debt Sale-Leaseback Transaction One of the Company’s subsidiaries entered into an agreement on June 28, 2002, whereby it sold land and building to an unrelated bank and leased it back over a 15 year term. The proceeds of this sale were €10.6 million. The Company has the obligation to purchase the property back after 15 years for €8.2 million. The Company may also repurchase the property at its option from the first until the tenth year of the arrangement for the present value of the future lease payments and the remaining residual value. The Company is also required to pay the bank a monthly deposit of €0.01 million, which will be repaid to the Company, plus interest of 6.7%, at the time of repurchase. Because of the Company’s continuing involvement, this transaction has been accounted for as a finance lease such that the Company has recorded €10.6 million of cash and long-term borrowings at the inception date of this agreement. At December 31, 2011, the remaining obligation under the financing agreement is €9.4 million (2010: €9.5 million). The Company’s future minimum lease payments are as follows:
As of December 31,
2011
(in thousands)
2012..........................................................................................................€ 803
2013.......................................................................................................... 803
2014.......................................................................................................... 803
2015.......................................................................................................... 803
2016.......................................................................................................... 803
Thereafter.....................................................................................................8,562
Total minimum payments............................................................................................................12,578
Amount representing interest............................................... (3,220)
Finance Lease Obligation.................................................. 9,358
Obligations due within one year.................................................. (186)
Long-term Finance Lease Obligation...............................................................€ 9,171
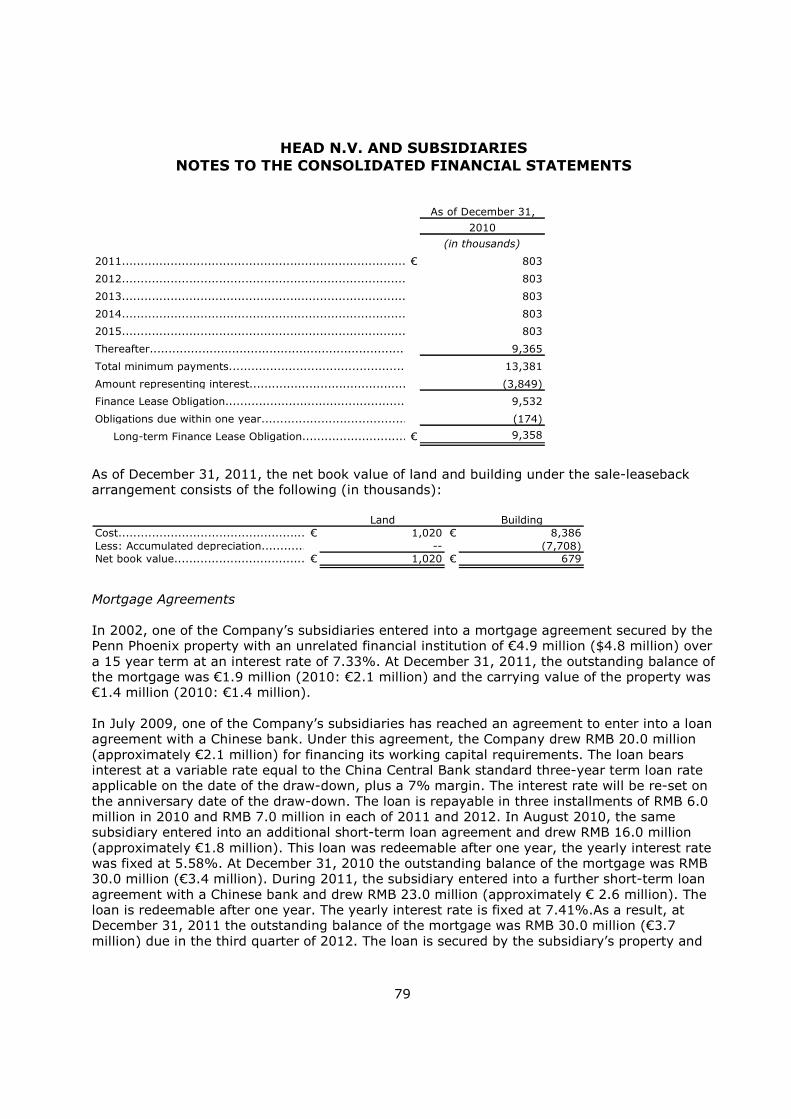
HEAD N.V. AND SUBSIDIARIES NOTES TO THE CONSOLIDATED FINANCIAL STATEMENTS
79
As of December 31,
2010
(in thousands)
2011..........................................................................................................€ 803
2012.......................................................................................................... 803
2013.......................................................................................................... 803
2014.......................................................................................................... 803
2015.......................................................................................................... 803
Thereafter.....................................................................................................9,365
Total minimum payments............................................................................................................13,381
Amount representing interest............................................... (3,849)
Finance Lease Obligation.................................................. 9,532
Obligations due within one year.................................................. (174)
Long-term Finance Lease Obligation...............................................................€ 9,358
As of December 31, 2011, the net book value of land and building under the sale-leaseback arrangement consists of the following (in thousands):
Land BuildingCost..........................................................................................................€ 1,020 € 8,386Less: Accumulated depreciation..........................................................................................................-- (7,708)Net book value..........................................................................................................€ 1,020 € 679
Mortgage Agreements In 2002, one of the Company’s subsidiaries entered into a mortgage agreement secured by the Penn Phoenix property with an unrelated financial institution of €4.9 million ($4.8 million) over a 15 year term at an interest rate of 7.33%. At December 31, 2011, the outstanding balance of the mortgage was €1.9 million (2010: €2.1 million) and the carrying value of the property was €1.4 million (2010: €1.4 million). In July 2009, one of the Company’s subsidiaries has reached an agreement to enter into a loan agreement with a Chinese bank. Under this agreement, the Company drew RMB 20.0 million (approximately €2.1 million) for financing its working capital requirements. The loan bears interest at a variable rate equal to the China Central Bank standard three-year term loan rate applicable on the date of the draw-down, plus a 7% margin. The interest rate will be re-set on the anniversary date of the draw-down. The loan is repayable in three installments of RMB 6.0 million in 2010 and RMB 7.0 million in each of 2011 and 2012. In August 2010, the same subsidiary entered into an additional short-term loan agreement and drew RMB 16.0 million (approximately €1.8 million). This loan was redeemable after one year, the yearly interest rate was fixed at 5.58%. At December 31, 2010 the outstanding balance of the mortgage was RMB 30.0 million (€3.4 million). During 2011, the subsidiary entered into a further short-term loan agreement with a Chinese bank and drew RMB 23.0 million (approximately € 2.6 million). The loan is redeemable after one year. The yearly interest rate is fixed at 7.41%.As a result, at December 31, 2011 the outstanding balance of the mortgage was RMB 30.0 million (€3.7 million) due in the third quarter of 2012. The loan is secured by the subsidiary’s property and

HEAD N.V. AND SUBSIDIARIES NOTES TO THE CONSOLIDATED FINANCIAL STATEMENTS
80
building. At December 31, 2011 the carrying value of the property was €2.9 million (2010: €2.8 million). The Company is already renegotiating the agreement and expects an extension. In April 2011, the Company secured a new long term loan in Italy with Mares S.p.A. The loan amounts to €5.0 million with a seven-year term. For the first five years the interest rate is fixed at 4.66% while for the last two years the interest rate is variable based on the six-month Euribor plus a 1.90% margin. The loan is secured by the Rapallo and partly Casarza property of Mares S.p.A. At December 31, 2011 the outstanding balance of the loan was €4.7 million and the carrying value of the property was €3.8 million. Other long-term debt
In August 2006, the Company renegotiated the terms of its outstanding credit lines of Japanese Yen (“JPY“) 1,382.9 million (€8.8 million) with a Japanese bank and agreed a semi-annual prepayment of JPY 24.5 million (€0.2 million) for five years. As a consequence the Company reclassified €4.5 million from bank overdraft to long-term debt and €0.2 million to current maturities of long-term debt. The agreement as described above ended in September 2011. The Company renegotiated the terms during 2011 and secured a new long term agreement until 2016. At December 31, 2011 the outstanding balance of the loan was €4.4 million at a fixed interest rate of 3.95%. In September 2011, one of the Company´s subsidiaries entered into an asset backed revolving credit agreement with an US-bank providing a maximum of USD 40.0 million dependent on the level, and secured by, eligible US inventories and receivables. As of December 31, 2011, eligible US inventories and receivables amounted to USD 20.6 million and USD 20.7 million, respectively. The agreement covers five years, the interest rate is variable. At December 31, 2011 the Company used USD 25.0 million (€ 19.3 million) of this facility at an interest rate of 2.31%. Other long-term debt comprises a loan in Italy and two small loans in Austria with an outstanding balance of €1.5 million in total at December 31, 2011. The weighted average interest rate on other long-term debt was 2.71% and 2.82% as of December 31, 2011 and 2010, respectively. Borrowings mature at various dates through 2016. In case entities within the group default on their loan agreement, the relevant bank has the right to receive the cash flows from the financial assets serving as collateral at the time of default.
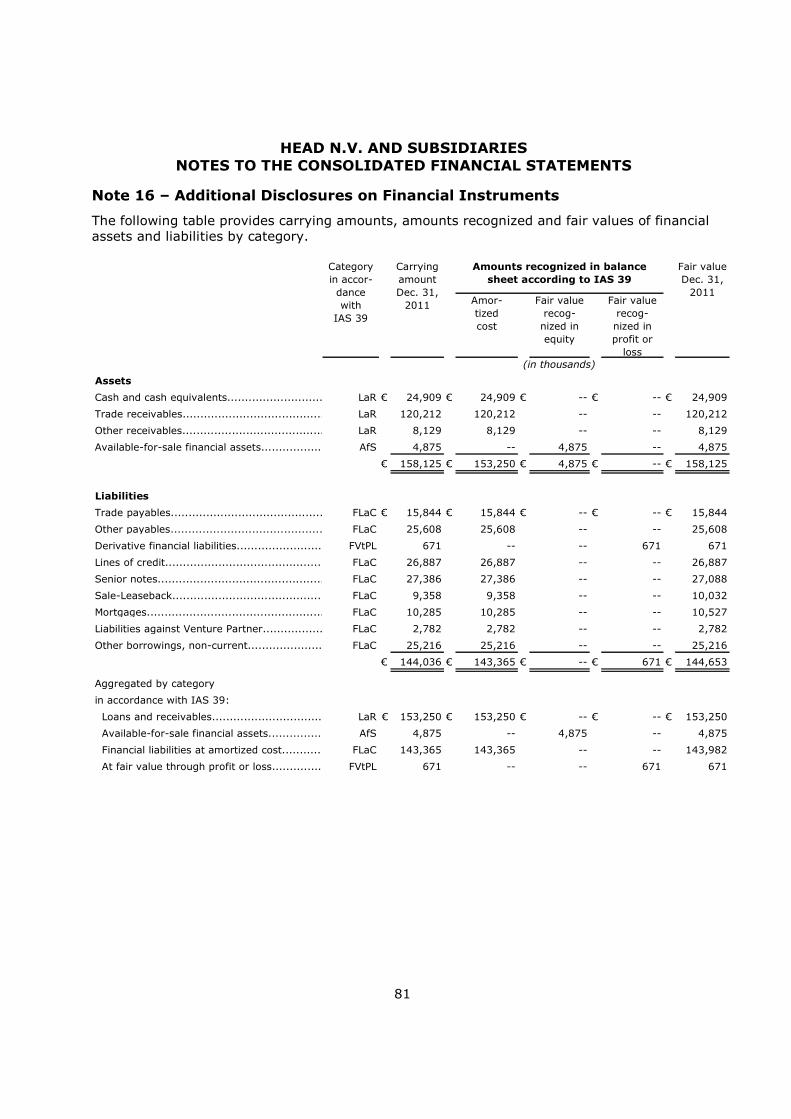
HEAD N.V. AND SUBSIDIARIES NOTES TO THE CONSOLIDATED FINANCIAL STATEMENTS
81
Note 16 – Additional Disclosures on Financial Instruments
The following table provides carrying amounts, amounts recognized and fair values of financial assets and liabilities by category.
Amor-tized cost
Fair value recog-nized in equity
Fair value recog-nized in profit or
loss
Assets
Cash and cash equivalents.................................................................................................LaR € 24,909 € 24,909 € -- € -- € 24,909
Trade receivables.................................................................................................LaR 120,212 120,212 -- -- 120,212
Other receivables.................................................................................................LaR 8,129 8,129 -- -- 8,129
Available-for-sale financial assets.................................................................................................AfS 4,875 -- 4,875 -- 4,875
€ 158,125 € 153,250 € 4,875 € -- € 158,125
Liabilities
Trade payables.................................................................................................FLaC € 15,844 € 15,844 € -- € -- € 15,844
Other payables.................................................................................................FLaC 25,608 25,608 -- -- 25,608
Derivative financial liabilities..............................................................................................FVtPL 671 -- -- 671 671
Lines of credit.................................................................................................FLaC 26,887 26,887 -- -- 26,887
Senior notes.................................................................................................FLaC 27,386 27,386 -- -- 27,088
Sale-Leaseback.................................................................................................FLaC 9,358 9,358 -- -- 10,032
Mortgages.................................................................................................FLaC 10,285 10,285 -- -- 10,527
Liabilities against Venture Partner.................................................................................................FLaC 2,782 2,782 -- -- 2,782
Other borrowings, non-current.................................................................................................FLaC 25,216 25,216 -- -- 25,216
€ 144,036 € 143,365 € -- € 671 € 144,653
Aggregated by category
in accordance with IAS 39:
Loans and receivables................................................................LaR € 153,250 € 153,250 € -- € -- € 153,250
Available-for-sale financial assets................................................................AfS 4,875 -- 4,875 -- 4,875
Financial liabilities at amortized cost................................................................FLaC 143,365 143,365 -- -- 143,982
At fair value through profit or loss................................................................FVtPL 671 -- -- 671 671
(in thousands)
Fair value Dec. 31,
2011
Category in accor-dance with
IAS 39
Carrying amount Dec. 31,
2011
Amounts recognized in balance
sheet according to IAS 39
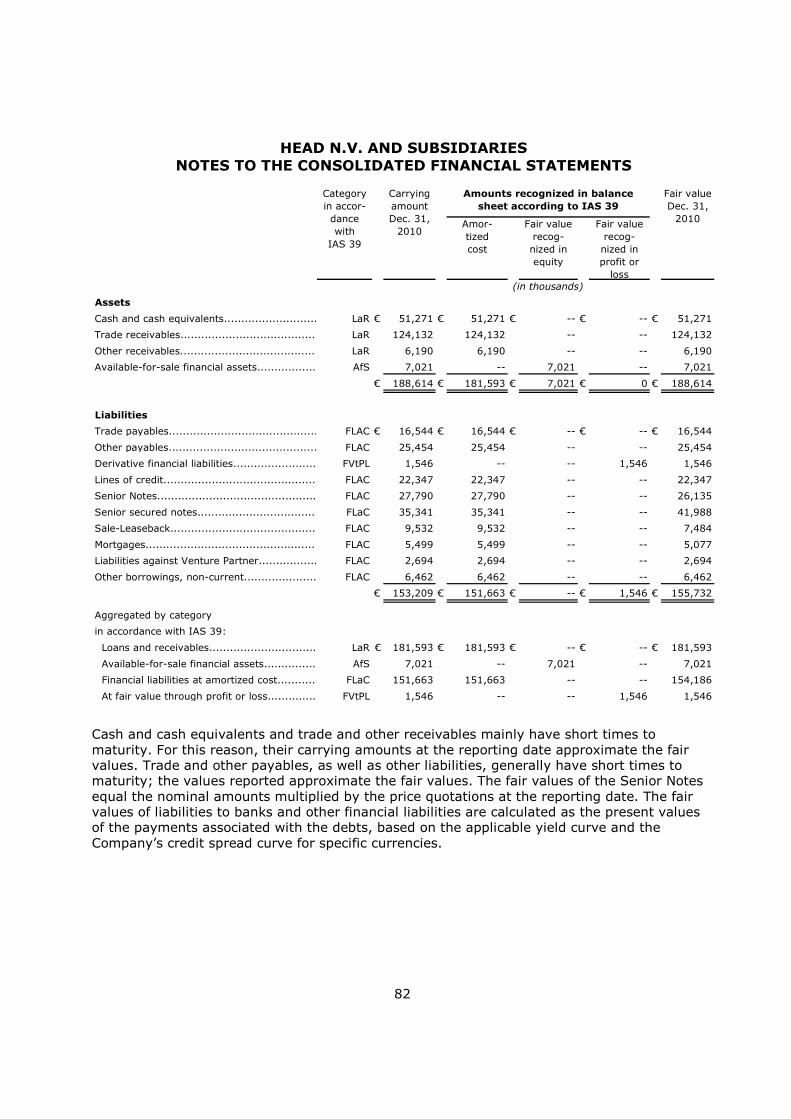
HEAD N.V. AND SUBSIDIARIES NOTES TO THE CONSOLIDATED FINANCIAL STATEMENTS
82
Amor-tized cost
Fair value recog-nized in equity
Fair value recog-nized in profit or
loss
Assets
Cash and cash equivalents.................................................................................................LaR € 51,271 € 51,271 € -- € -- € 51,271
Trade receivables.................................................................................................LaR 124,132 124,132 -- -- 124,132
Other receivables.................................................................................................LaR 6,190 6,190 -- -- 6,190
Available-for-sale financial assets.................................................................................................AfS 7,021 -- 7,021 -- 7,021
€ 188,614 € 181,593 € 7,021 € 0 € 188,614
Liabilities
Trade payables.................................................................................................FLAC € 16,544 € 16,544 € -- € -- € 16,544
Other payables.................................................................................................FLAC 25,454 25,454 -- -- 25,454
Derivative financial liabilities..............................................................................................FVtPL 1,546 -- -- 1,546 1,546
Lines of credit.................................................................................................FLAC 22,347 22,347 -- -- 22,347
Senior Notes.................................................................................................FLAC 27,790 27,790 -- -- 26,135
Senior secured notes.................................................................................................FLaC 35,341 35,341 -- -- 41,988
Sale-Leaseback.................................................................................................FLAC 9,532 9,532 -- -- 7,484
Mortgages.................................................................................................FLAC 5,499 5,499 -- -- 5,077
Liabilities against Venture Partner.................................................................................................FLAC 2,694 2,694 -- -- 2,694
Other borrowings, non-current.................................................................................................FLAC 6,462 6,462 -- -- 6,462
€ 153,209 € 151,663 € -- € 1,546 € 155,732
Aggregated by category
in accordance with IAS 39:
Loans and receivables................................................................LaR € 181,593 € 181,593 € -- € -- € 181,593
Available-for-sale financial assets................................................................AfS 7,021 -- 7,021 -- 7,021
Financial liabilities at amortized cost................................................................FLaC 151,663 151,663 -- -- 154,186
At fair value through profit or loss................................................................FVtPL 1,546 -- -- 1,546 1,546
Category in accor-dance with
IAS 39
Carrying amount Dec. 31,
2010
Amounts recognized in balance
sheet according to IAS 39
Fair value Dec. 31,
2010
(in thousands)
Cash and cash equivalents and trade and other receivables mainly have short times to maturity. For this reason, their carrying amounts at the reporting date approximate the fair values. Trade and other payables, as well as other liabilities, generally have short times to maturity; the values reported approximate the fair values. The fair values of the Senior Notes equal the nominal amounts multiplied by the price quotations at the reporting date. The fair values of liabilities to banks and other financial liabilities are calculated as the present values of the payments associated with the debts, based on the applicable yield curve and the Company’s credit spread curve for specific currencies.
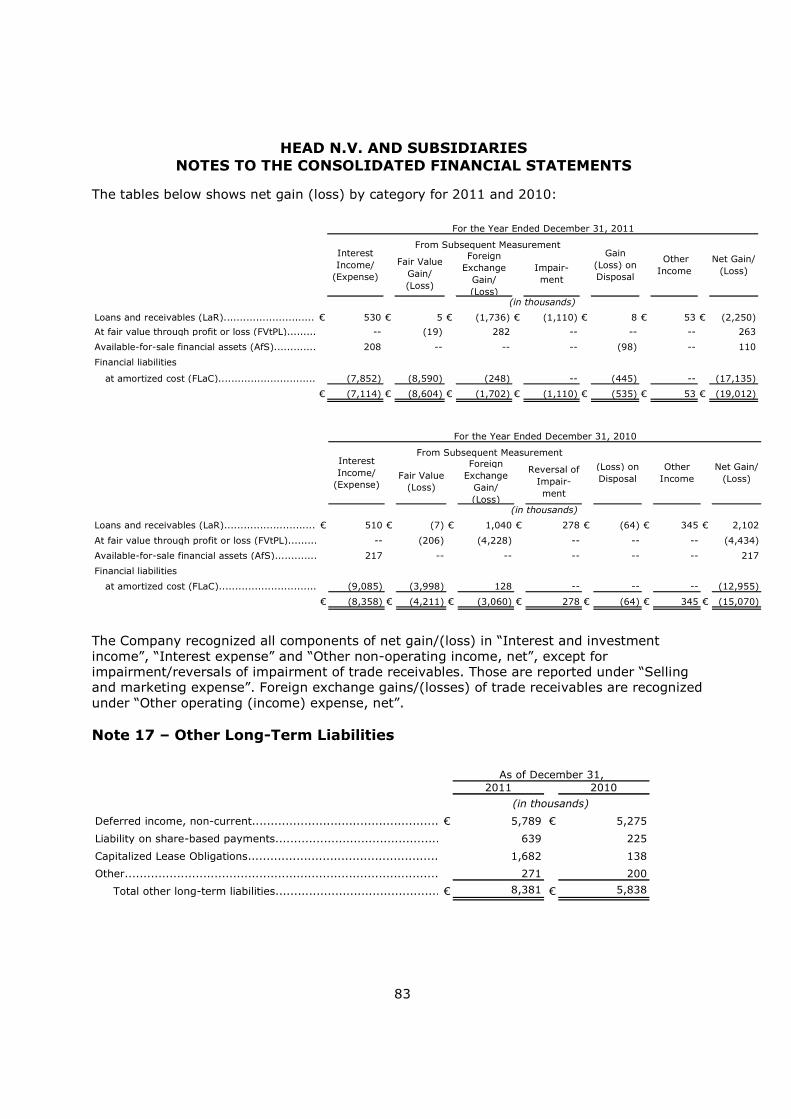
HEAD N.V. AND SUBSIDIARIES NOTES TO THE CONSOLIDATED FINANCIAL STATEMENTS
83
The tables below shows net gain (loss) by category for 2011 and 2010:
Fair Value Gain/(Loss)
Foreign Exchange
Gain/(Loss)
Impair-ment
Loans and receivables (LaR).............................................................................................€ 530 € 5 € (1,736) € (1,110) € 8 € 53 € (2,250)
At fair value through profit or loss (FVtPL)................................................................-- (19) 282 -- -- -- 263
Available-for-sale financial assets (AfS).............................................................................................208 -- -- -- (98) -- 110
Financial liabilities
at amortized cost (FLaC)......................................................(7,852) (8,590) (248) -- (445) -- (17,135)
€ (7,114) € (8,604) € (1,702) € (1,110) € (535) € 53 € (19,012)
For the Year Ended December 31, 2011
Interest Income/
(Expense)
From Subsequent MeasurementGain
(Loss) on Disposal
Net Gain/(Loss)
Other Income
(in thousands)
Fair Value (Loss)
Foreign Exchange
Gain/(Loss)
Reversal of Impair-ment
Loans and receivables (LaR).............................................................................................€ 510 € (7) € 1,040 € 278 € (64) € 345 € 2,102
At fair value through profit or loss (FVtPL)................................................................-- (206) (4,228) -- -- -- (4,434)
Available-for-sale financial assets (AfS).............................................................................................217 -- -- -- -- -- 217
Financial liabilities
at amortized cost (FLaC)......................................................(9,085) (3,998) 128 -- -- -- (12,955)
€ (8,358) € (4,211) € (3,060) € 278 € (64) € 345 € (15,070)
For the Year Ended December 31, 2010
(in thousands)
Interest Income/
(Expense)
From Subsequent Measurement
(Loss) on Disposal
Net Gain/(Loss)
Other Income
The Company recognized all components of net gain/(loss) in “Interest and investment income”, “Interest expense” and “Other non-operating income, net”, except for impairment/reversals of impairment of trade receivables. Those are reported under “Selling and marketing expense”. Foreign exchange gains/(losses) of trade receivables are recognized under “Other operating (income) expense, net”. Note 17 – Other Long-Term Liabilities
2011 2010
Deferred income, non-current......................................................................................................€ 5,789 € 5,275
Liability on share-based payments......................................................................................................639 225
Capitalized Lease Obligations......................................................................................................1,682 138
Other...................................................................................................... 271 200
Total other long-term liabilities......................................................................................................€ 8,381 € 5,838
As of December 31,
(in thousands)

HEAD N.V. AND SUBSIDIARIES NOTES TO THE CONSOLIDATED FINANCIAL STATEMENTS
84
Deferred income, non-current Other long-term liabilities include a long-term portion of deferred income from long-term licensing agreements. In July 2005, the Company agreed to extend an existing long-term licensing agreement started on April 1, 2005 for a further 10 years until 2019 and has received a prepayment in the amount of €4.9 million for the extended period. Additionally, the payment terms of the original agreement have been amended and it was agreed that the prepayment of €4.1 million received in November 2004 represents a one time fee with no future royalty payments. The prepayments were recorded as deferred income in the consolidated balance sheet and are recognized over the contract period. In 2010, the Company entered into another long-term licensing agreement. The prepayments amounted to €1.4 million as of December 31, 2010. In January 2011, the Company received the residual amount of the agreed prepayment of €1.4 million. The prepayments were recorded as deferred income in the consolidated balance sheet and are recognized over the contract period. At December 31, 2011, the deferred income balance (non-current portion) associated with all long-term licensing agreements was €5.8 million (2010: €5.3 million). The Company recognized the short-term portion of the long-term licensing agreements of €1.1 million (2010: €1.1 million) in trade and other payables. Liability on share-based payments The Company records liabilities on share-based payments in relation to its stock option plans (see Note 23). The increase of the liability is mainly due to the increase of the share price at December 31, 2011 compared to December 31, 2010. Capitalized Lease Obligations During 2011, some of the Company´s subsidiaries in Austria and the subsidiaries in the Czech Republic entered into new finance lease agreements which resulted in an increase of the capitalized lease obligations by €1.5 million. Other
In 2010, the Company converted a funded defined benefit plan into a defined contribution plan over a transition period until 2012. Additional payments of €0.1 million as of December 31, 2011 to be made are recorded within “Other long-term liabilities”. In October 2011, the Company signed a joint venture agreement to set up a distribution company in Japan in which it holds 50%. According to the agreement, the Company booked a long term liability of €0.2 million regarding an agreed exit option (see Note 22).

HEAD N.V. AND SUBSIDIARIES NOTES TO THE CONSOLIDATED FINANCIAL STATEMENTS
85
Note 18 – Employee Benefits
The Company funds pension and other postretirement benefit plans paid to employees at some Austrian, other European and Japanese locations. The indemnities are based upon years of service and compensation levels and are generally payable upon retirement or dismissal in some circumstances, after a predetermined number of years of service. For the year ended December 31, 2011 and 2010 the only pension plan that includes plan assets is the French pension plan. The Company maintains sufficient assets to meet the minimum funding requirements set forth by the regulations in each country. The discount rate is based on the return of high quality corporate bonds at the reporting date. In 2010, one of the Company’s funded defined benefit plans was converted into a defined contribution plan, accordingly the obligation of €0.7 million and related plan assets of €0.4 million have been transferred to a third party. In 2011, the Company paid €0.1 million. In 2012, the Company has to pay another €0.1 million. This amount is recognized in “Other long-term liabilities” (see Note 17). Pension benefits and other postretirement benefit plans have developed as follows:
2011 2010
Beginning of the year...................................................................................................................€ 14,514 € 14,275
Charge to income...................................................................................................................1,335 1,172
Payments...................................................................................................................(1,115) (556)
Release...................................................................................................................-- (8)
Transfer...................................................................................................................15 (502)
Translation adjustment......................................................................................42 132End of the year...................................................................................................................€ 14,791 € 14,514
As of December 31,
(in thousands)
Other postretirement benefits include anniversary bonuses and severance obligations. The table below shows the obligations and unfunded status:
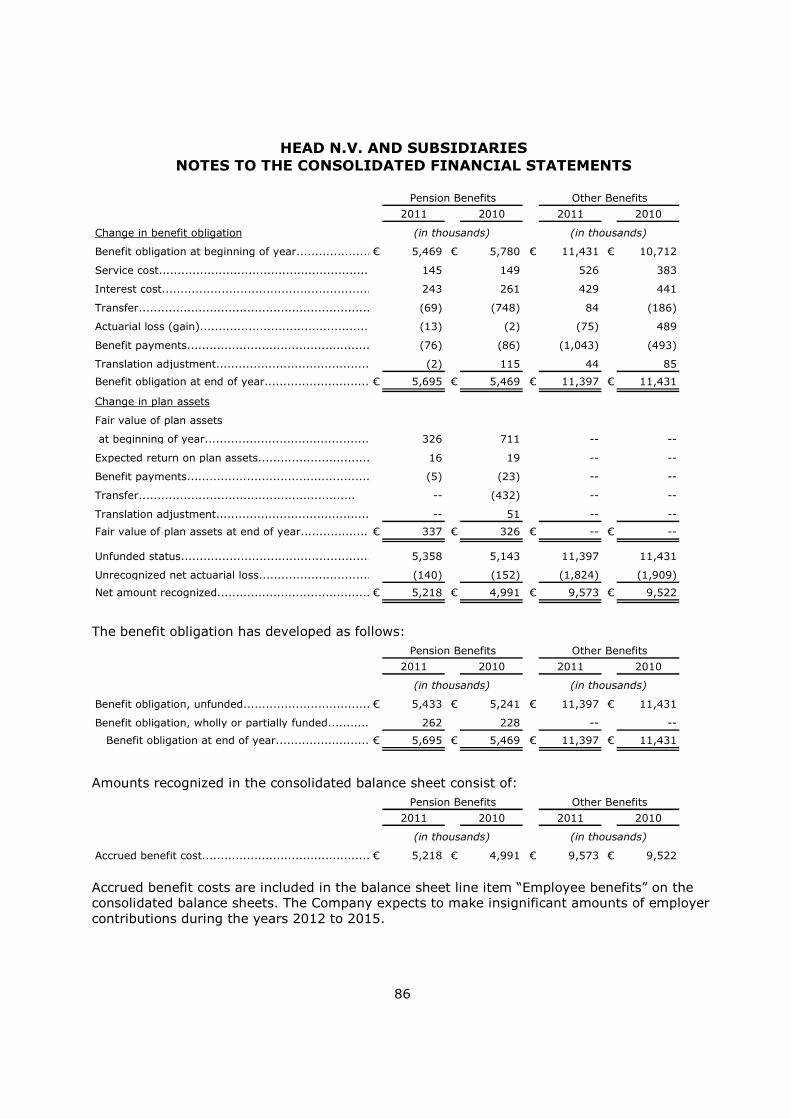
HEAD N.V. AND SUBSIDIARIES NOTES TO THE CONSOLIDATED FINANCIAL STATEMENTS
86
2011 2010 2011 2010
Change in benefit obligation
Benefit obligation at beginning of year................................................................................................................................€ 5,469 € 5,780 € 11,431 € 10,712
Service cost................................................................................................................................145 149 526 383
Interest cost................................................................................................................................243 261 429 441
Transfer................................................................................................................................(69) (748) 84 (186)
Actuarial loss (gain)................................................................................................................................(13) (2) (75) 489
Benefit payments................................................................................................................................(76) (86) (1,043) (493)
Translation adjustment......................................................................................(2) 115 44 85
Benefit obligation at end of year................................................................................................................................€ 5,695 € 5,469 € 11,397 € 11,431
Change in plan assets
Fair value of plan assets
at beginning of year..............................................................326 711 -- --
Expected return on plan assets................................................................................................16 19 -- --
Benefit payments................................................................................................................................(5) (23) -- --
Transfer.......................................................... -- (432) -- --
Translation adjustment......................................................................................-- 51 -- --
Fair value of plan assets at end of year........................€ 337 € 326 € -- € --
Unfunded status............................................................................................5,358 5,143 11,397 11,431
Unrecognized net actuarial loss................................................................................................(140) (152) (1,824) (1,909)
Net amount recognized................................................................................................€ 5,218 € 4,991 € 9,573 € 9,522
Pension Benefits Other Benefits
(in thousands) (in thousands)
The benefit obligation has developed as follows:
2011 2010 2011 2010
Benefit obligation, unfunded................................................................................................................................€ 5,433 € 5,241 € 11,397 € 11,431
Benefit obligation, wholly or partially funded................................................................................................................................262 228 -- --
Benefit obligation at end of year................................................................................................................................€ 5,695 € 5,469 € 11,397 € 11,431
Pension Benefits Other Benefits
(in thousands) (in thousands)
Amounts recognized in the consolidated balance sheet consist of:
2011 2010 2011 2010
Accrued benefit cost................................................................................................€ 5,218 € 4,991 € 9,573 € 9,522
(in thousands) (in thousands)
Pension Benefits Other Benefits
Accrued benefit costs are included in the balance sheet line item “Employee benefits” on the consolidated balance sheets. The Company expects to make insignificant amounts of employer contributions during the years 2012 to 2015.

HEAD N.V. AND SUBSIDIARIES NOTES TO THE CONSOLIDATED FINANCIAL STATEMENTS
87
The contribution for defined contribution plans for the year ended December 31, 2011 amounted to €0.8 million (2010: €0.7 million). The components of net periodic benefit costs consist of the following:
2011 2010 2011 2010
Service cost................................................................................................................................€ 145 € 149 € 526 € 383
Interest cost................................................................................................................................243 261 429 441
Expected return on plan assets................................................................................................(16) (19) -- --
Recognized actuarial (gain) loss..........................................................................(2) 27 10 (70)
Net periodic benefit cost................................................................................................€ 370 € 418 € 965 € 754
Pension Benefits Other Benefits
(in thousands) (in thousands)
The unrecognized actuarial gains/losses have developed as follows:
2011 2010 2011 2010
Opening unrecognized actuarial gain (loss)................................€ (152) € (167) € (1,909) € (1,350)
Gain (loss) for the period................................ 13 2 75 (489)
Recognized actuarial (gain) loss..........................................................................(2) 27 10 (70)
Translation adjustment......................................................................................-- (14) -- --Closing unrecognized actuarial loss................................€ (140) € (152) € (1,824) € (1,909)
Other Benefits
(in thousands) (in thousands)
Pension Benefits
The weighted average assumptions used to determine benefit obligations are as follows:
2011 2010 2011 2010
Discount rate................................................................................................................................4.5% 4.5% 4.4% 4.4%
Rate of compensation increase................................................................................................................................2.5% 2.5% 2.9% 2.9%
Expected return on plan assets................................................................................................................................5.0% 5.0% -- --
Pension Benefits Other Benefits
The plan assets of the Japanese pension plan consisted of equity funds at December 31, 2009. In 2010 those plan assets in the amount of €0.4 million have been transferred to a third party in accordance with a transfer agreement to convert a defined benefit plan into a defined contribution plan. The plan assets of the French pension plan consist of an insurance contract.
2011 2010 2009 2008 2007
Present value of defined benefit obligations................................................................................................................................€ 17,092 € 16,900 € 16,492 € 16,119 € 17,168
Fair Value of plan assets................................................................................................................................337 326 711 792 334Deficit.................................................................................................€ 16,755 € 16,575 € 15,781 € 15,327 € 16,835
Experience adjustments on plan liabilities.................................................................................................€ 88 € (487) € (70) € (939) € (771)
Experience adjustments on plan assets.................................................................................................€ -- € -- € -- € 7 € 8
As of December 31,
(in thousands)
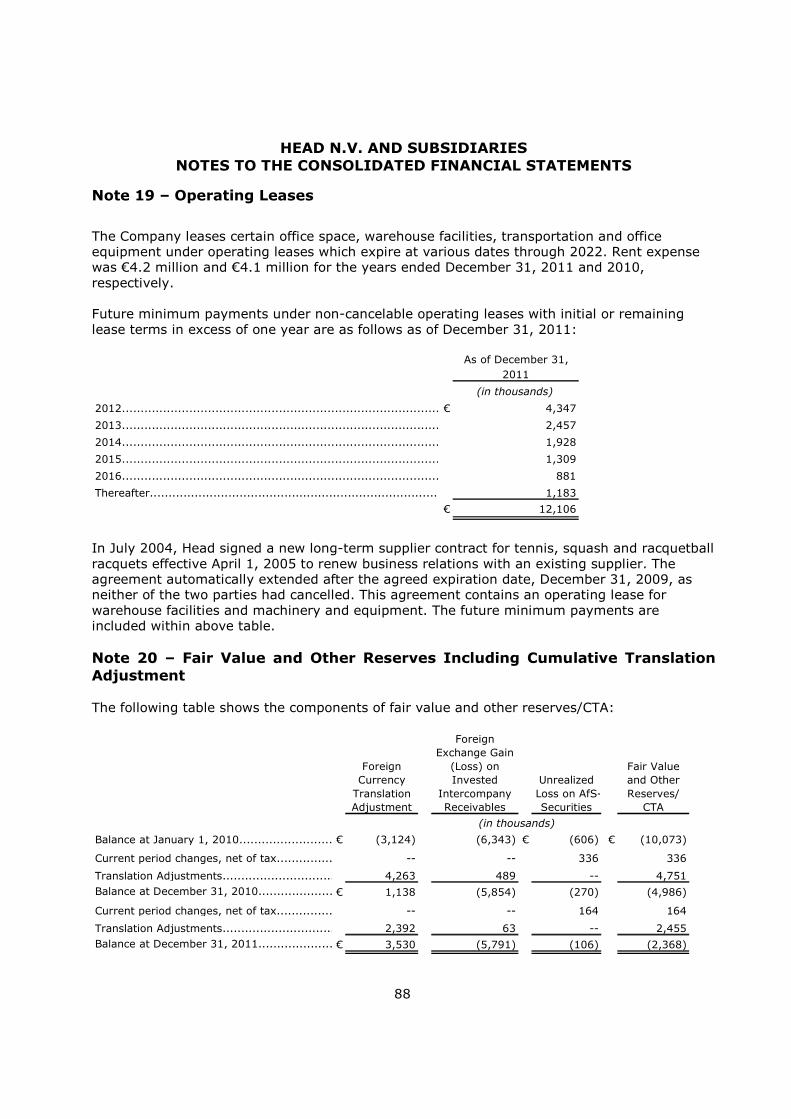
HEAD N.V. AND SUBSIDIARIES NOTES TO THE CONSOLIDATED FINANCIAL STATEMENTS
88
Note 19 – Operating Leases
The Company leases certain office space, warehouse facilities, transportation and office equipment under operating leases which expire at various dates through 2022. Rent expense was €4.2 million and €4.1 million for the years ended December 31, 2011 and 2010, respectively. Future minimum payments under non-cancelable operating leases with initial or remaining lease terms in excess of one year are as follows as of December 31, 2011:
As of December 31,2011
(in thousands)
2012..........................................................................................................................................................................€ 4,347
2013.......................................................................................................................................................................... 2,457
2014.......................................................................................................................................................................... 1,928
2015.......................................................................................................................................................................... 1,309
2016.......................................................................................................................................................................... 881
Thereafter...................................................................................................................................1,183
€ 12,106
In July 2004, Head signed a new long-term supplier contract for tennis, squash and racquetball racquets effective April 1, 2005 to renew business relations with an existing supplier. The agreement automatically extended after the agreed expiration date, December 31, 2009, as neither of the two parties had cancelled. This agreement contains an operating lease for warehouse facilities and machinery and equipment. The future minimum payments are included within above table. Note 20 – Fair Value and Other Reserves Including Cumulative Translation Adjustment The following table shows the components of fair value and other reserves/CTA:
Foreign Currency
Translation Adjustment
Foreign Exchange Gain
(Loss) on Invested
Intercompany Receivables
Unrealized Loss on AfS-Securities
Fair Value and Other Reserves/
CTA
Balance at January 1, 2010...........................................................................................................................€ (3,124) (6,343) € (606) € (10,073)
Current period changes, net of tax.................................. -- -- 336 336
Translation Adjustments...........................................................................................................................4,263 489 -- 4,751Balance at December 31, 2010...........................................................................................................................€ 1,138 (5,854) (270) (4,986)
Current period changes, net of tax.................................. -- -- 164 164
Translation Adjustments...........................................................................................................................2,392 63 -- 2,455Balance at December 31, 2011...........................................................................................................................€ 3,530 (5,791) (106) (2,368)
(in thousands)
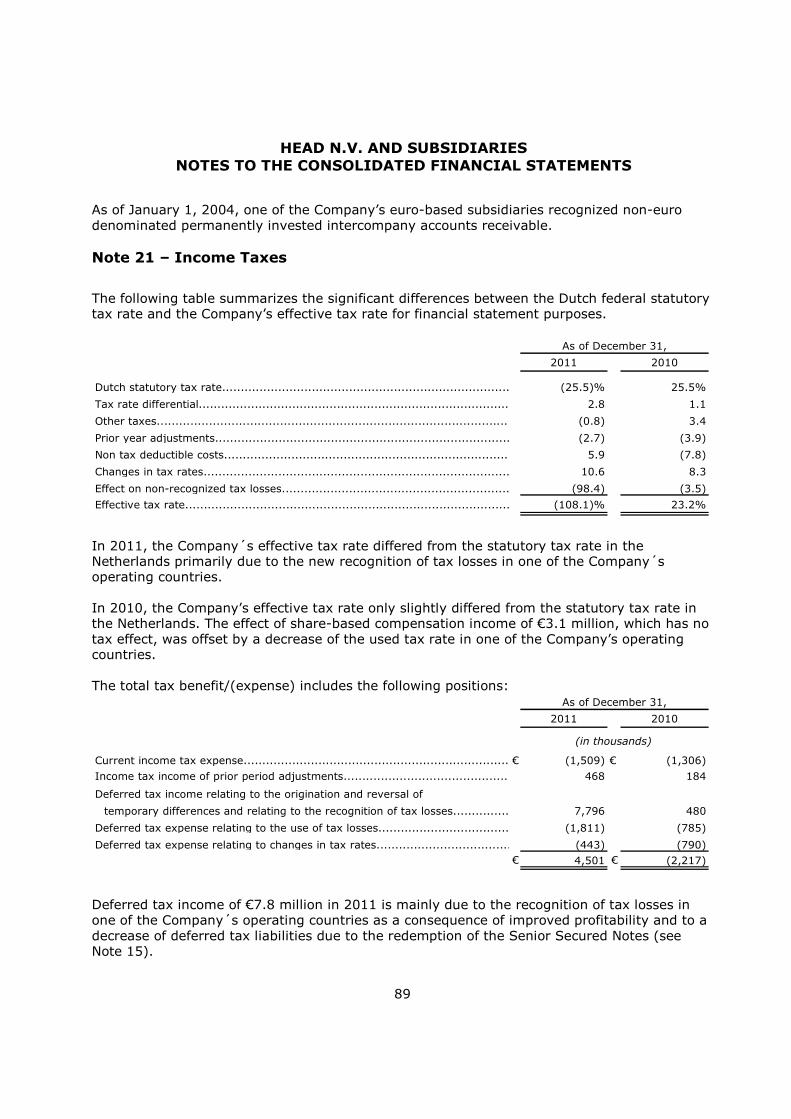
HEAD N.V. AND SUBSIDIARIES NOTES TO THE CONSOLIDATED FINANCIAL STATEMENTS
89
As of January 1, 2004, one of the Company’s euro-based subsidiaries recognized non-euro denominated permanently invested intercompany accounts receivable. Note 21 – Income Taxes
The following table summarizes the significant differences between the Dutch federal statutory tax rate and the Company’s effective tax rate for financial statement purposes.
2011 2010
Dutch statutory tax rate.............................................................................. (25.5)% 25.5%
Tax rate differential............................................................................................................................ 2.8 1.1
Other taxes............................................................................................................. (0.8) 3.4
Prior year adjustments.............................................................................................................(2.7) (3.9)
Non tax deductible costs............................................................................................. 5.9 (7.8)
Changes in tax rates.......................................................................................... 10.6 8.3
Effect on non-recognized tax losses........................................................................................ (98.4) (3.5)
Effective tax rate................................................................................................................. (108.1)% 23.2%
As of December 31,
In 2011, the Company´s effective tax rate differed from the statutory tax rate in the Netherlands primarily due to the new recognition of tax losses in one of the Company´s operating countries. In 2010, the Company’s effective tax rate only slightly differed from the statutory tax rate in the Netherlands. The effect of share-based compensation income of €3.1 million, which has no tax effect, was offset by a decrease of the used tax rate in one of the Company’s operating countries. The total tax benefit/(expense) includes the following positions:
2011 2010
Current income tax expense.........................................................................................................................................€ (1,509) € (1,306)
Income tax income of prior period adjustments......................................................................................................................................... 468 184
Deferred tax income relating to the origination and reversal of
temporary differences and relating to the recognition of tax losses..........................................................7,796 480
Deferred tax expense relating to the use of tax losses...............................................................................................................................(1,811) (785)
Deferred tax expense relating to changes in tax rates....................................................................................................................................(443) (790)€ 4,501 € (2,217)
As of December 31,
(in thousands)
Deferred tax income of €7.8 million in 2011 is mainly due to the recognition of tax losses in one of the Company´s operating countries as a consequence of improved profitability and to a decrease of deferred tax liabilities due to the redemption of the Senior Secured Notes (see Note 15).

HEAD N.V. AND SUBSIDIARIES NOTES TO THE CONSOLIDATED FINANCIAL STATEMENTS
90
The movements in deferred tax assets and liabilities during the year ended December 31, 2011 are as follows:
December 31,
2011
(Charged)/creditedto income
(Charged)/creditedto OCI
Exchangedifferences
December 31,
2010
Short-term:
Deferred tax asset:
Tax loss carried forward...................................................................................................................................................€ 597 € (144) € -- € -- € 741Impairment of inventory................................................................................................................................................... 4,118 212 -- 11 3,895Impairment of accounts receivable................................................................................................................................................... 1,086 31 -- 55 1,000Provisions................................................................................................................................................... 1,459 (630) -- 34 2,055Other................................................................................................................................................... 392 (206) -- 13 585
Total Short-term deferred tax assets...................................................................................................................................................€ 7,651 € (737) € -- € 113 € 8,275
Deferred tax liabilities:
Liabilities...................................................................................................................................................€ (1,825) € 84 € -- € 0 € (1,909)Other...................................................................................................................................................(275) (68) (55) 0 (153)
Total Short-term deferred tax liability...................................................................................................................................................€ (2,100) € 16 € (55) € 0 € (2,062)
Total Short-term deferred tax asset, net...................................................................................................................................................€ 5,552 € (720) € (55) € 113 € 6,214
Long-term:
Deferred tax asset:
Tax loss carried forward..................................................................................€ 65,890 € 3,314 € -- € 376 € 62,200Fixed assets............................................................................................................ 155 (26) -- 4 177Other intangible assets...................................................................................... 17 (1) -- 1 17Provisions....................................................................................854 609 -- 0 245Employee benefits.................................................................................... 881 12 -- 17 851Investments.................................................................................... 868 (9) -- (22) 899Lease obligations............................................................................................................. 2,293 (47) -- 0 2,340Other..................................................................................................1,774 (198) (21) (6) 2,000
Total Long-term deferred tax assets..............................................................................................................€ 72,732 € 3,654 € (21) € 371 € 68,728
Deferred tax liabilities: Fixed assets...................................................................................................................................................€ (1,174) € (108) € -- € 14 € (1,080)Investments........................................................................................................................................ (23,530) (138) -- 0 (23,392)Senior Notes and Senior Secured Notes........................................................................................................................................(54) 2,123 -- -- (2,177)Other......................................................................................................................................... (392) 730 -- 0 (1,122)
Total Long-term deferred tax liability...................................................................................................................€ (25,149) € 2,608 € -- € 14 € (27,771)
Total Long-term deferred tax asset, net................................................................................................................................€ 47,582 € 6,262 € (21) € 385 € 40,956
Total deferred tax asset, net................................................................................................................................€ 53,134 € 5,542 € (76) € 498 € 47,170
(in thousands)
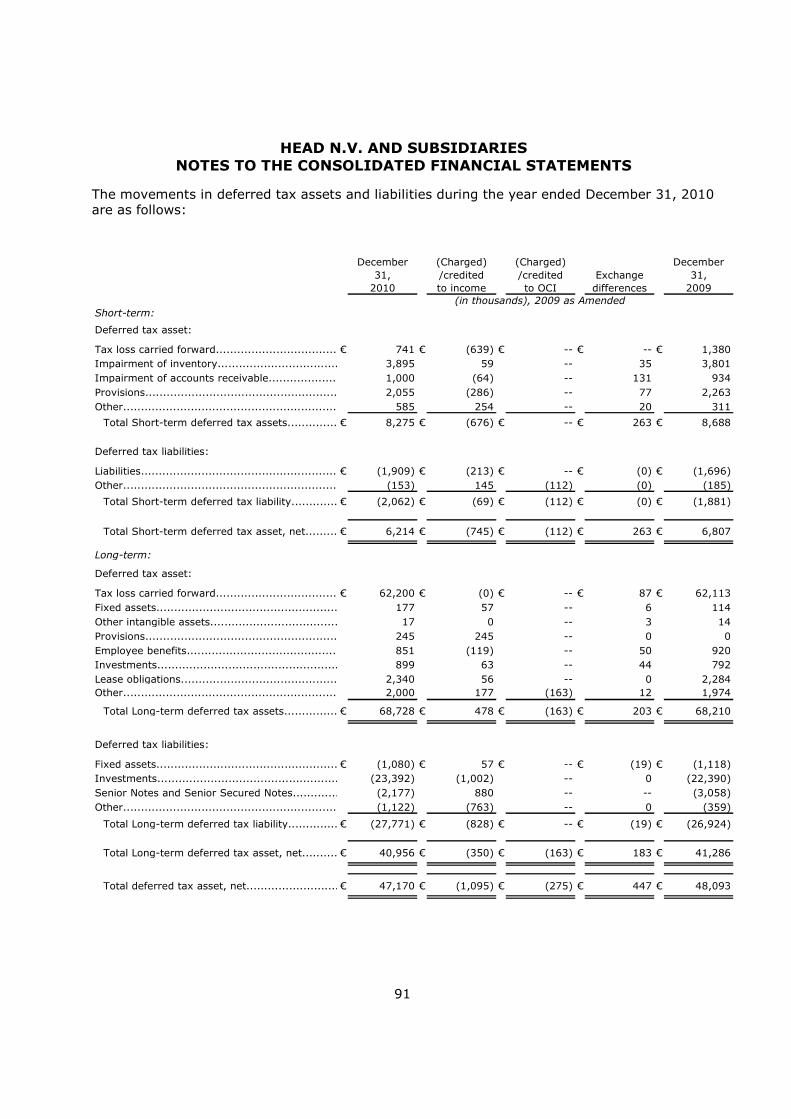
HEAD N.V. AND SUBSIDIARIES NOTES TO THE CONSOLIDATED FINANCIAL STATEMENTS
91
The movements in deferred tax assets and liabilities during the year ended December 31, 2010 are as follows:
December 31,
2010
(Charged)/creditedto income
(Charged)/creditedto OCI
Exchangedifferences
December 31,
2009
Short-term:
Deferred tax asset:
Tax loss carried forward...................................................................................................................................................€ 741 € (639) € -- € -- € 1,380Impairment of inventory................................................................................................................................................... 3,895 59 -- 35 3,801Impairment of accounts receivable................................................................................................................................................... 1,000 (64) -- 131 934Provisions................................................................................................................................................... 2,055 (286) -- 77 2,263Other................................................................................................................................................... 585 254 -- 20 311
Total Short-term deferred tax assets...................................................................................................................................................€ 8,275 € (676) € -- € 263 € 8,688
Deferred tax liabilities:
Liabilities...................................................................................................................................................€ (1,909) € (213) € -- € (0) € (1,696)Other...................................................................................................................................................(153) 145 (112) (0) (185)
Total Short-term deferred tax liability...................................................................................................................................................€ (2,062) € (69) € (112) € (0) € (1,881)
Total Short-term deferred tax asset, net...................................................................................................................................................€ 6,214 € (745) € (112) € 263 € 6,807
Long-term:
Deferred tax asset:
Tax loss carried forward..................................................................................€ 62,200 € (0) € -- € 87 € 62,113Fixed assets............................................................................................................ 177 57 -- 6 114Other intangible assets...................................................................................... 17 0 -- 3 14Provisions....................................................................................245 245 -- 0 0Employee benefits.................................................................................... 851 (119) -- 50 920Investments.................................................................................... 899 63 -- 44 792Lease obligations............................................................................................................. 2,340 56 -- 0 2,284Other..................................................................................................2,000 177 (163) 12 1,974
Total Long-term deferred tax assets..............................................................................................................€ 68,728 € 478 € (163) € 203 € 68,210
Deferred tax liabilities: Fixed assets...................................................................................................................................................€ (1,080) € 57 € -- € (19) € (1,118)Investments........................................................................................................................................ (23,392) (1,002) -- 0 (22,390)Senior Notes and Senior Secured Notes........................................................................................................................................(2,177) 880 -- -- (3,058)Other......................................................................................................................................... (1,122) (763) -- 0 (359)
Total Long-term deferred tax liability...................................................................................................................€ (27,771) € (828) € -- € (19) € (26,924)
Total Long-term deferred tax asset, net................................................................................................................................€ 40,956 € (350) € (163) € 183 € 41,286
Total deferred tax asset, net................................................................................................................................€ 47,170 € (1,095) € (275) € 447 € 48,093
(in thousands), 2009 as Amended
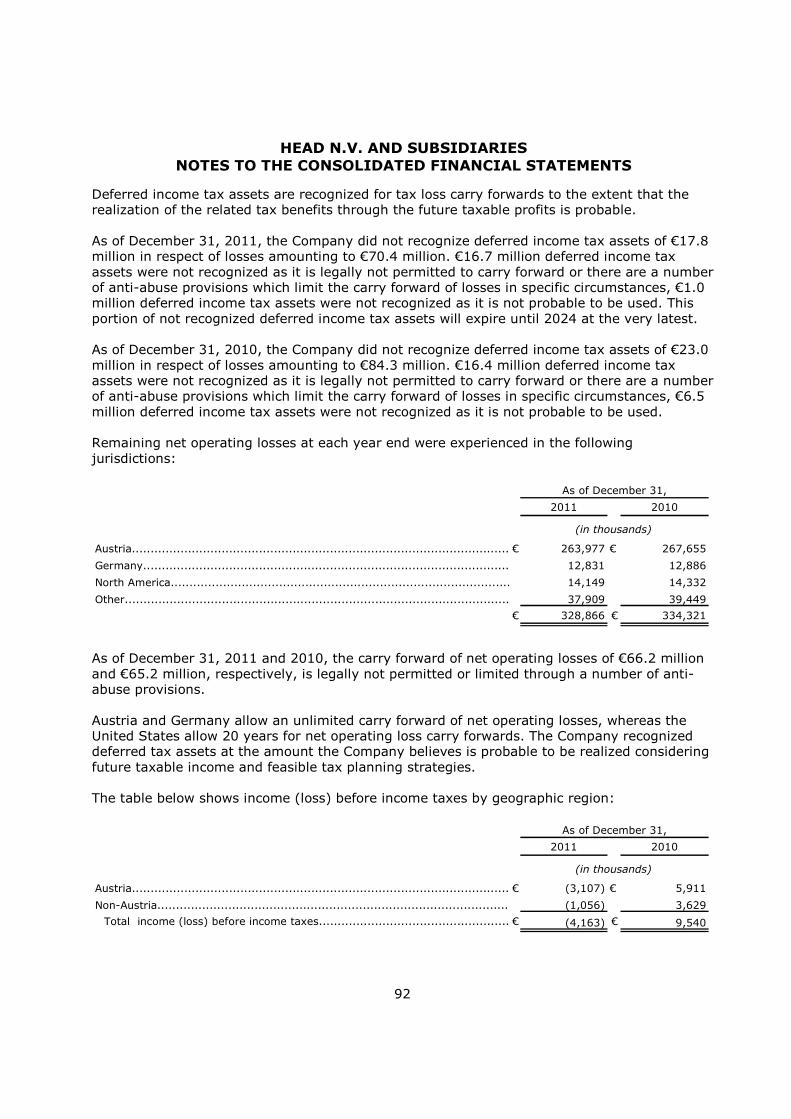
HEAD N.V. AND SUBSIDIARIES NOTES TO THE CONSOLIDATED FINANCIAL STATEMENTS
92
Deferred income tax assets are recognized for tax loss carry forwards to the extent that the realization of the related tax benefits through the future taxable profits is probable. As of December 31, 2011, the Company did not recognize deferred income tax assets of €17.8 million in respect of losses amounting to €70.4 million. €16.7 million deferred income tax assets were not recognized as it is legally not permitted to carry forward or there are a number of anti-abuse provisions which limit the carry forward of losses in specific circumstances, €1.0 million deferred income tax assets were not recognized as it is not probable to be used. This portion of not recognized deferred income tax assets will expire until 2024 at the very latest. As of December 31, 2010, the Company did not recognize deferred income tax assets of €23.0 million in respect of losses amounting to €84.3 million. €16.4 million deferred income tax assets were not recognized as it is legally not permitted to carry forward or there are a number of anti-abuse provisions which limit the carry forward of losses in specific circumstances, €6.5 million deferred income tax assets were not recognized as it is not probable to be used. Remaining net operating losses at each year end were experienced in the following jurisdictions:
2011 2010
Austria.........................................................................................................................................€ 263,977 € 267,655
Germany......................................................................................................................................... 12,831 12,886
North America......................................................................................................................................... 14,149 14,332
Other......................................................................................................................................... 37,909 39,449
€ 328,866 € 334,321
As of December 31,
(in thousands)
As of December 31, 2011 and 2010, the carry forward of net operating losses of €66.2 million and €65.2 million, respectively, is legally not permitted or limited through a number of anti-abuse provisions. Austria and Germany allow an unlimited carry forward of net operating losses, whereas the United States allow 20 years for net operating loss carry forwards. The Company recognized deferred tax assets at the amount the Company believes is probable to be realized considering future taxable income and feasible tax planning strategies. The table below shows income (loss) before income taxes by geographic region:
2011 2010
Austria.........................................................................................................................................€ (3,107) € 5,911
Non-Austria......................................................................................................................................... (1,056) 3,629
Total income (loss) before income taxes.........................................................................................................................................€ (4,163) € 9,540
(in thousands)
As of December 31,
HEAD N.V. AND SUBSIDIARIES NOTES TO THE CONSOLIDATED FINANCIAL STATEMENTS
93
Note 22 - Related Party Transactions
Head Sports Holdings N.V. and its shareholders controlled 61,089,243 (2010: 48,242,064) shares, or approximately 66.28% (2010: 54.69%) of the Company’s issued shares, as of December 31, 2011. Head Sports Holdings N.V., a Netherlands Antilles corporation, and its shareholders are controlled by Mr. Johan Eliasch and his family members resulting in the ability to significantly influence and control the Company’s operations. The Company receives administrative services from corporations which are ultimately owned by the principal shareholder of the Company. Administrative expenses amounted to approximately €4.6 million for the year ended December 31, 2011 and 2010, respectively. The related party provides consulting, corporate finance, investor relations and legal services. During the third quarter 2011, certain Austrian subsidiaries of the Company entered into a €15.0 million loan agreement with an Austrian Bank. This loan was repaid by December 31, 2011 and was secured by certain trade receivables as well as by the inventories of certain Austrian subsidiaries in the warehouses in Klaus and Schwechat. In addition, Mr. Johan Eliasch, the Company´s CEO, granted a personal non-performance guarantee (“Ausfallsbürgschaft”) up to a maximum amount of €5.0 million to ensure fulfillment of the obligations of the subsidiaries of the Company under the loan. In September 2011, Mr. Franz Klammer was appointed to the Supervisory Board of Head N.V. (see also Supervisory Board Report). In 2001, one of the Company´s subsidiaries and the Franz Klammer GmbH entered into an agency agreement committing Mr. Franz Klammer to use and promote some of the Company´s products. The agreement is limited until August 2013 with a yearly fee of €0.06 million. In 2007, the Company established a joint venture distribution company, Mares Benelux B.V., in The Netherlands in which it holds 50%. The Joint Venture operates as distributor of Mares products in the Benelux market. The investment of €0.01 million was accounted for using the equity method and is recognized in “Investments accounted for using the equity method”. The Company granted a loan of €0.6 million to the newly established company. It is planned that during 2012 Mares S.p.A. becomes 100% shareholder of Mares Benelux B.V. and takes over the diving distribution in the Benelux market and it is planned that the loan of €0.6 million will be repaid by end of 2012. At December 31, 2011, the loan was interest-free. In 2008, the Company signed a joint venture agreement to set up a distribution company in New Zealand in which it held 50%. This investment of €0.01 million was accounted for using the equity method and was recognized in “Investments accounted for using the equity method”. The Company granted a shareholder loan of €0.1 million to the newly established company. The annual interest rate amounted to 5% p.a.. Half of the loan was redeemable at December 31, 2009 but was extended. The second half of the loan would have been redeemable at December 31, 2010. The joint venture partner had the right to purchase, at any time after December 31, 2009 all shares for the paid in share capital at that time. Any outstanding shareholder loan given by the Company should have been reimbursed prior to the completion of the call option. In November 2010, an agreement was signed to terminate the joint venture. It was agreed that the joint venture company will settle the loan on March 31, 2011. The investment was written down to zero as of December 31, 2010, the Company recognized the expense in “share of profit (loss) of Joint Ventures”. In 2011, the Company was finally and officially liquidated.
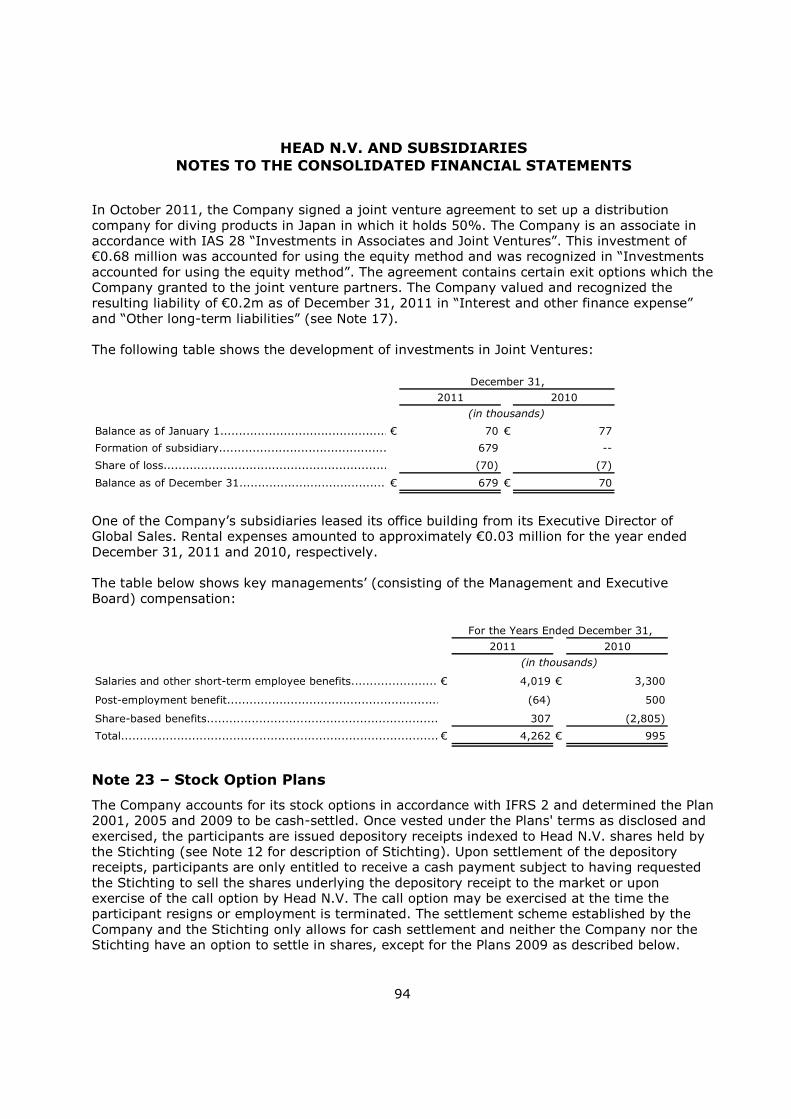
HEAD N.V. AND SUBSIDIARIES NOTES TO THE CONSOLIDATED FINANCIAL STATEMENTS
94
In October 2011, the Company signed a joint venture agreement to set up a distribution company for diving products in Japan in which it holds 50%. The Company is an associate in accordance with IAS 28 “Investments in Associates and Joint Ventures”. This investment of €0.68 million was accounted for using the equity method and was recognized in “Investments accounted for using the equity method”. The agreement contains certain exit options which the Company granted to the joint venture partners. The Company valued and recognized the resulting liability of €0.2m as of December 31, 2011 in “Interest and other finance expense” and “Other long-term liabilities” (see Note 17). The following table shows the development of investments in Joint Ventures:
2011 2010
Balance as of January 1................................................................................................................€ 70 € 77
Formation of subsidiary................................................................................................................679 --
Share of loss................................................................................................................(70) (7)
Balance as of December 31................................................................................................................€ 679 € 70
December 31,
(in thousands)
One of the Company’s subsidiaries leased its office building from its Executive Director of Global Sales. Rental expenses amounted to approximately €0.03 million for the year ended December 31, 2011 and 2010, respectively. The table below shows key managements’ (consisting of the Management and Executive Board) compensation:
2011 2010
Salaries and other short-term employee benefits...................................................................................................................€ 4,019 € 3,300
Post-employment benefit.......................................................................................... (64) 500
Share-based benefits........................................................................................................................ 307 (2,805)
Total.........................................................................................................€ 4,262 € 995
(in thousands)
For the Years Ended December 31,
Note 23 – Stock Option Plans
The Company accounts for its stock options in accordance with IFRS 2 and determined the Plan 2001, 2005 and 2009 to be cash-settled. Once vested under the Plans' terms as disclosed and exercised, the participants are issued depository receipts indexed to Head N.V. shares held by the Stichting (see Note 12 for description of Stichting). Upon settlement of the depository receipts, participants are only entitled to receive a cash payment subject to having requested the Stichting to sell the shares underlying the depository receipt to the market or upon exercise of the call option by Head N.V. The call option may be exercised at the time the participant resigns or employment is terminated. The settlement scheme established by the Company and the Stichting only allows for cash settlement and neither the Company nor the Stichting have an option to settle in shares, except for the Plans 2009 as described below.

HEAD N.V. AND SUBSIDIARIES NOTES TO THE CONSOLIDATED FINANCIAL STATEMENTS
95
The stock option plans resulted in a non-cash compensation expense of €0.4 million in 2011, mainly due to the increase in the share price in 2011, and non-cash compensation income of €3.1 million in 2010. On December 1, 2010, the Management Board resolved that the Stock Option Plans issued in 2009 and previously defined to be settled in cash, will be equity-settled. The Company accounted for it in accordance with IFRS 2 and recorded a non-cash compensation income of €1.7 million during the period ended November 30, 2010. As of December 1, 2010, the Company reclassified a liability of €6.2 million to equity. Plan 2001 In September 2001, the Company adopted the Head N.V. Executive Stock Option Plan 2001 (“Plan 2001”). The Plan 2001 provides for grants of stock options to officers and employees of the Company and its subsidiaries. In accordance with IFRS 2 the Plan 2001 is treated as cash-settled share-based plan, as participants have no right to receive shares. On September 28, 2001, a total of 3,982,068 options were granted under the terms of the Plan 2001. The Company records share-based compensation expense on each balance sheet date fair values of the stock options computed using the Black and Scholes option pricing model. As at December 31, 2010, the weighted-average fair value of the grant was zero, which was estimated using the following assumptions: no dividends, expected volatility of 45.48%, expected term of 0.7 years, share price of $0.55 and risk-free interest rate of 3.10%. The volatility was based on statistical analysis of daily share prices over the last year. As of December 31, 2010 the Company did not record a liability for this Plan. During 2011, the Stock Option Plan 2001 expired as options had a maximum term of 10 years. As of December 31, 2011 the Company did not record a liability for this Plan. The exercise price for all stock options granted under the Plan was fixed at inception of the Plan 2001. The vesting period varied from 0 to 6 years. The Chairman and Chief Executive Officer received 1,426,470 options under this grant, which vested immediately. In addition, he had received further options in the amount of 564,564, which did not vest to other participants. Options had a maximum term of 10 years. As of December 31, 2010, the total intrinsic value of the liability was zero. Number of Weighted average options exercise price Balance, December 31, 2009 ......................... 3,590,094 $ 4.31
Forfeiture during 2010 .................................. (50,004) $ 4.31
Balance, December 31, 2010 ......................... 3,540,090 $ 4.31
Expiring during 2011 .................................... (3,540,090) $ 4.31
Balance, December 31, 2011 ......................... -- - -- As at December 31, 2010, the weighted average remaining contractual life of the outstanding stock options was 0.7 years, and 3,540,090 options were vested and exercisable at a price of $4.31 per share.
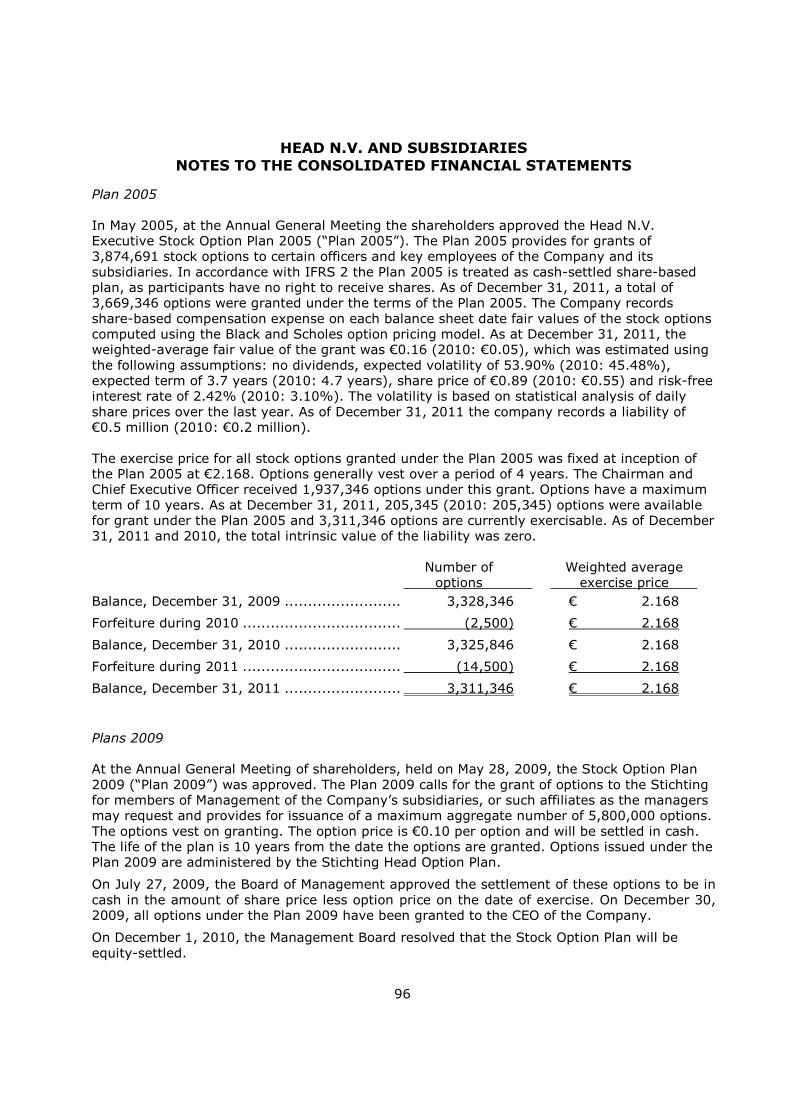
HEAD N.V. AND SUBSIDIARIES NOTES TO THE CONSOLIDATED FINANCIAL STATEMENTS
96
Plan 2005 In May 2005, at the Annual General Meeting the shareholders approved the Head N.V. Executive Stock Option Plan 2005 (“Plan 2005”). The Plan 2005 provides for grants of 3,874,691 stock options to certain officers and key employees of the Company and its subsidiaries. In accordance with IFRS 2 the Plan 2005 is treated as cash-settled share-based plan, as participants have no right to receive shares. As of December 31, 2011, a total of 3,669,346 options were granted under the terms of the Plan 2005. The Company records share-based compensation expense on each balance sheet date fair values of the stock options computed using the Black and Scholes option pricing model. As at December 31, 2011, the weighted-average fair value of the grant was €0.16 (2010: €0.05), which was estimated using the following assumptions: no dividends, expected volatility of 53.90% (2010: 45.48%), expected term of 3.7 years (2010: 4.7 years), share price of €0.89 (2010: €0.55) and risk-free interest rate of 2.42% (2010: 3.10%). The volatility is based on statistical analysis of daily share prices over the last year. As of December 31, 2011 the company records a liability of €0.5 million (2010: €0.2 million). The exercise price for all stock options granted under the Plan 2005 was fixed at inception of the Plan 2005 at €2.168. Options generally vest over a period of 4 years. The Chairman and Chief Executive Officer received 1,937,346 options under this grant. Options have a maximum term of 10 years. As at December 31, 2011, 205,345 (2010: 205,345) options were available for grant under the Plan 2005 and 3,311,346 options are currently exercisable. As of December 31, 2011 and 2010, the total intrinsic value of the liability was zero. Number of Weighted average options exercise price Balance, December 31, 2009 ......................... 3,328,346 € 2.168
Forfeiture during 2010 .................................. (2,500) € 2.168
Balance, December 31, 2010 ......................... 3,325,846 € 2.168
Forfeiture during 2011 .................................. (14,500) € 2.168
Balance, December 31, 2011 ......................... 3,311,346 € 2.168 Plans 2009 At the Annual General Meeting of shareholders, held on May 28, 2009, the Stock Option Plan 2009 (“Plan 2009”) was approved. The Plan 2009 calls for the grant of options to the Stichting for members of Management of the Company’s subsidiaries, or such affiliates as the managers may request and provides for issuance of a maximum aggregate number of 5,800,000 options. The options vest on granting. The option price is €0.10 per option and will be settled in cash. The life of the plan is 10 years from the date the options are granted. Options issued under the Plan 2009 are administered by the Stichting Head Option Plan.
On July 27, 2009, the Board of Management approved the settlement of these options to be in cash in the amount of share price less option price on the date of exercise. On December 30, 2009, all options under the Plan 2009 have been granted to the CEO of the Company.
On December 1, 2010, the Management Board resolved that the Stock Option Plan will be equity-settled.
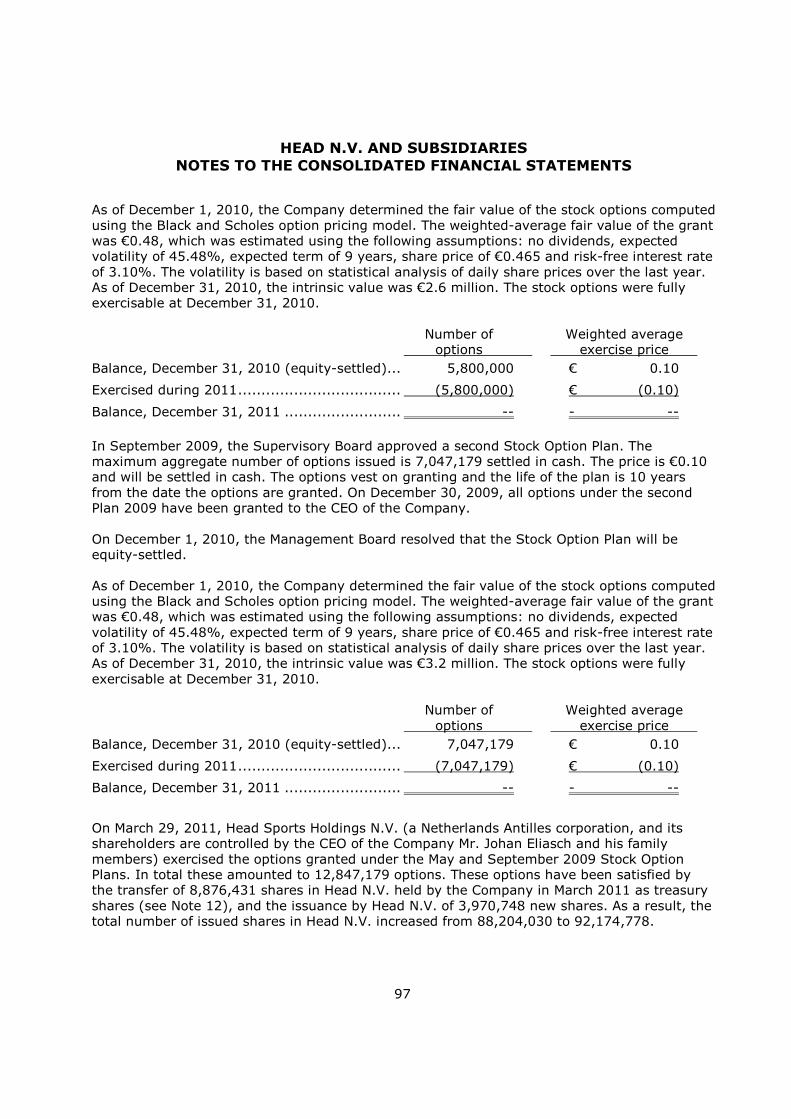
HEAD N.V. AND SUBSIDIARIES NOTES TO THE CONSOLIDATED FINANCIAL STATEMENTS
97
As of December 1, 2010, the Company determined the fair value of the stock options computed using the Black and Scholes option pricing model. The weighted-average fair value of the grant was €0.48, which was estimated using the following assumptions: no dividends, expected volatility of 45.48%, expected term of 9 years, share price of €0.465 and risk-free interest rate of 3.10%. The volatility is based on statistical analysis of daily share prices over the last year. As of December 31, 2010, the intrinsic value was €2.6 million. The stock options were fully exercisable at December 31, 2010. Number of Weighted average options exercise price Balance, December 31, 2010 (equity-settled)... 5,800,000 € 0.10
Exercised during 2011 ................................... (5,800,000) € (0.10)
Balance, December 31, 2011 ......................... -- - -- In September 2009, the Supervisory Board approved a second Stock Option Plan. The maximum aggregate number of options issued is 7,047,179 settled in cash. The price is €0.10 and will be settled in cash. The options vest on granting and the life of the plan is 10 years from the date the options are granted. On December 30, 2009, all options under the second Plan 2009 have been granted to the CEO of the Company. On December 1, 2010, the Management Board resolved that the Stock Option Plan will be equity-settled. As of December 1, 2010, the Company determined the fair value of the stock options computed using the Black and Scholes option pricing model. The weighted-average fair value of the grant was €0.48, which was estimated using the following assumptions: no dividends, expected volatility of 45.48%, expected term of 9 years, share price of €0.465 and risk-free interest rate of 3.10%. The volatility is based on statistical analysis of daily share prices over the last year. As of December 31, 2010, the intrinsic value was €3.2 million. The stock options were fully exercisable at December 31, 2010. Number of Weighted average options exercise price Balance, December 31, 2010 (equity-settled)... 7,047,179 € 0.10
Exercised during 2011 ................................... (7,047,179) € (0.10)
Balance, December 31, 2011 ......................... -- - --
On March 29, 2011, Head Sports Holdings N.V. (a Netherlands Antilles corporation, and its shareholders are controlled by the CEO of the Company Mr. Johan Eliasch and his family members) exercised the options granted under the May and September 2009 Stock Option Plans. In total these amounted to 12,847,179 options. These options have been satisfied by the transfer of 8,876,431 shares in Head N.V. held by the Company in March 2011 as treasury shares (see Note 12), and the issuance by Head N.V. of 3,970,748 new shares. As a result, the total number of issued shares in Head N.V. increased from 88,204,030 to 92,174,778.
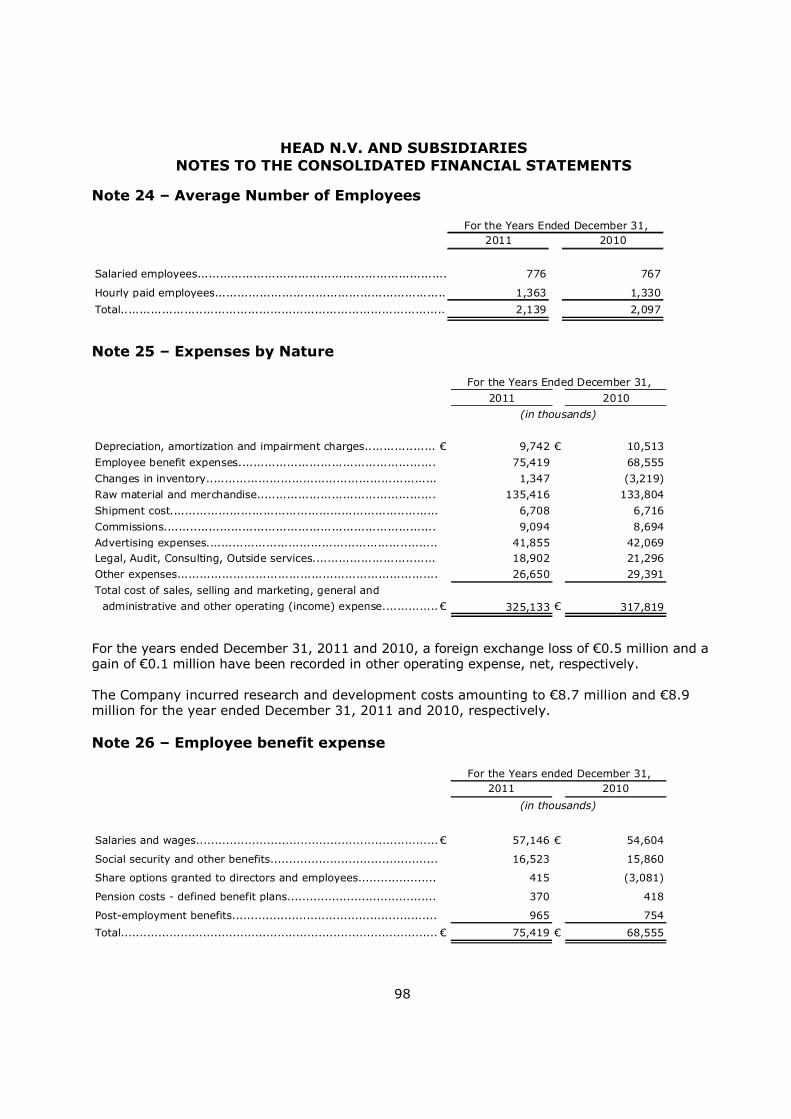
HEAD N.V. AND SUBSIDIARIES NOTES TO THE CONSOLIDATED FINANCIAL STATEMENTS
98
Note 24 – Average Number of Employees
2011 2010
Salaried employees....................................................................................................................776 767
Hourly paid employees.................................................................................................................1,363 1,330
Total......................................................................................................... 2,139 2,097
For the Years Ended December 31,
Note 25 – Expenses by Nature
2011 2010
Depreciation, amortization and impairment charges.....................................................................................................€ 9,742 € 10,513
Employee benefit expenses..................................................................................................... 75,419 68,555
Changes in inventory..................................................................................................... 1,347 (3,219)
Raw material and merchandise..................................................................................................... 135,416 133,804
Shipment cost..................................................................................................... 6,708 6,716
Commissions..................................................................................................... 9,094 8,694
Advertising expenses..................................................................................................... 41,855 42,069Legal, Audit, Consulting, Outside services..................................................................................................... 18,902 21,296
Other expenses..................................................................................................... 26,650 29,391
Total cost of sales, selling and marketing, general and
administrative and other operating (income) expense.....................................................................................................€ 325,133 € 317,819
(in thousands)
For the Years Ended December 31,
For the years ended December 31, 2011 and 2010, a foreign exchange loss of €0.5 million and a gain of €0.1 million have been recorded in other operating expense, net, respectively. The Company incurred research and development costs amounting to €8.7 million and €8.9 million for the year ended December 31, 2011 and 2010, respectively. Note 26 – Employee benefit expense
2011 2010
Salaries and wages....................................................................................................................€ 57,146 € 54,604
Social security and other benefits.......................................................................................... 16,523 15,860
Share options granted to directors and employees............................................................................ 415 (3,081)
Pension costs - defined benefit plans............................................................... 370 418
Post-employment benefits........................................................................................................................ 965 754
Total.........................................................................................................€ 75,419 € 68,555
For the Years ended December 31,
(in thousands)

HEAD N.V. AND SUBSIDIARIES NOTES TO THE CONSOLIDATED FINANCIAL STATEMENTS
99
Note 27 – List of (direct and indirect) Participations as of December 31, 2011
Proportion of Issued capital Domicile held Head Holding Unternehmensbeteiligung GmbH Austria 100.0% HTM Sport GmbH (former HTM Sport- und Freizeitgeräte AG) Austria 100.0% Head Sport GmbH (former Head Sport AG) Austria 100.0% Head International GmbH Austria 100.0% Head Technology GmbH Austria 100.0% Tyrolia Technology GmbH Austria 100.0% Head Austria GmbH Austria 100.0% Head Canada Inc. Canada 100.0% Head Sport s.r.o. Czech Republic 100.0% HTM Sport s.r.o. Czech Republic 100.0% HTM Bulgaria EOOD Bulgaria 100.0% Head France S.A.S. France 100.0% Head Germany GmbH Germany 100.0% Head UK Ltd England 100.0% Mares S.p.A. Italy 100.0% HTM Sports Japan KK Japan 100.0% Head Spain S.A. Spain 100.0% Head Switzerland AG Switzerland 100.0% HTM USA Holdings Inc. USA 100.0% Head USA Inc. USA 100.0% Head Sports Inc. USA 100.0% Penn Racquet Sports Inc. USA 100.0% Mares Asia Pacific Ltd. Hong Kong 100.0% Power Ahead Holding Ltd. British Virgin Islands 82.9% Head Sports (Hui Zhou) Corp. China 82.9% Mares Benelux B.V. The Netherlands 50.0% Mares Japan Co, Ltd. Japan 50.0% Note 28 – Cash and cash equivalents
As at December 31, 2011 and 2010, cash and cash equivalents contains cash of €21.1 million and €49.3 million, respectively and restricted cash of €3.8 million and €2.0 million, respectively representing deposits pledged as collateral.
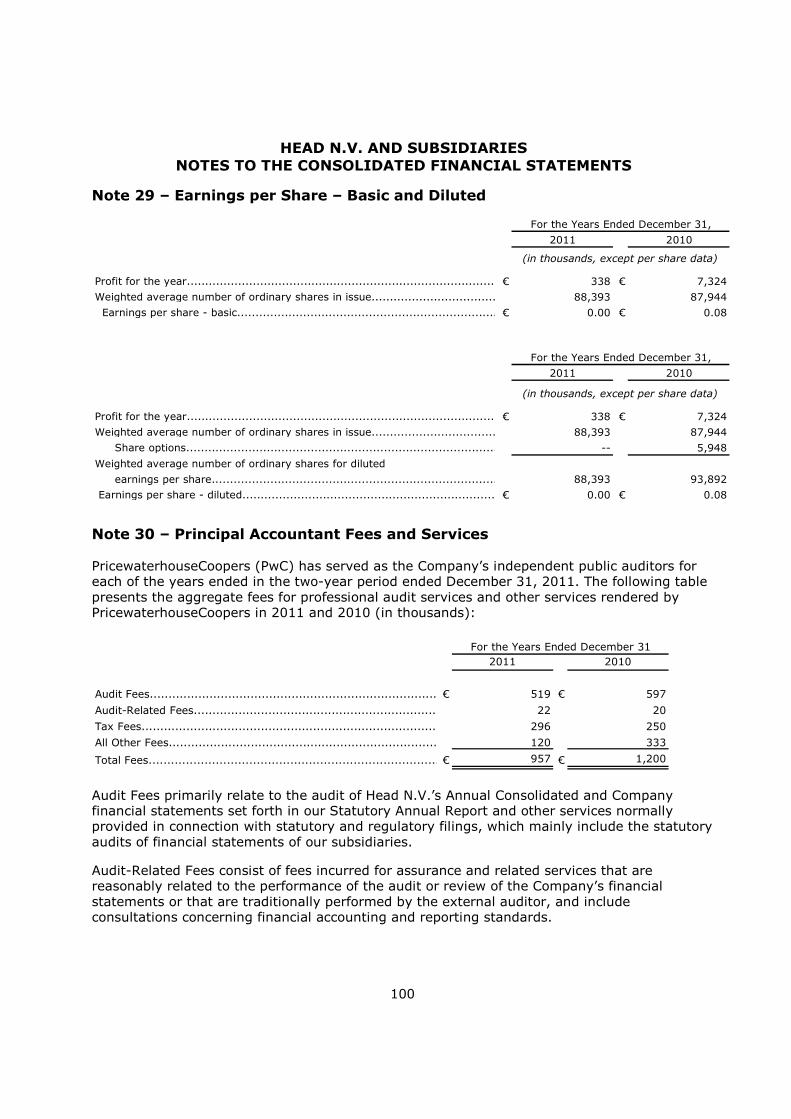
HEAD N.V. AND SUBSIDIARIES NOTES TO THE CONSOLIDATED FINANCIAL STATEMENTS
100
Note 29 – Earnings per Share – Basic and Diluted
2011 2010
Profit for the year.....................................................................................................................................................................................€ 338 € 7,324
Weighted average number of ordinary shares in issue....................................... 88,393 87,944
Earnings per share - basic.......................................................................................................................................................................................€ 0.00 € 0.08
For the Years Ended December 31,
(in thousands, except per share data)
2011 2010
Profit for the year.....................................................................................................................................................................................€ 338 € 7,324
Weighted average number of ordinary shares in issue....................................... 88,393 87,944
Share options........................................................................................................... -- 5,948
Weighted average number of ordinary shares for diluted
earnings per share......................................................................................................88,393 93,892
Earnings per share - diluted.......................................................................................................................................................................................€ 0.00 € 0.08
For the Years Ended December 31,
(in thousands, except per share data)
Note 30 – Principal Accountant Fees and Services
PricewaterhouseCoopers (PwC) has served as the Company’s independent public auditors for each of the years ended in the two-year period ended December 31, 2011. The following table presents the aggregate fees for professional audit services and other services rendered by PricewaterhouseCoopers in 2011 and 2010 (in thousands):
2011 2010
Audit Fees.............................................................................................................................€ 519 € 597
Audit-Related Fees..............................................................................................22 20
Tax Fees................................................................................................ 296 250
All Other Fees........................................................................................... 120 333
Total Fees....................................................................................€ 957 € 1,200
For the Years Ended December 31
Audit Fees primarily relate to the audit of Head N.V.’s Annual Consolidated and Company financial statements set forth in our Statutory Annual Report and other services normally provided in connection with statutory and regulatory filings, which mainly include the statutory audits of financial statements of our subsidiaries.
Audit-Related Fees consist of fees incurred for assurance and related services that are reasonably related to the performance of the audit or review of the Company’s financial statements or that are traditionally performed by the external auditor, and include consultations concerning financial accounting and reporting standards.

HEAD N.V. AND SUBSIDIARIES NOTES TO THE CONSOLIDATED FINANCIAL STATEMENTS
101
Tax Fees comprise tax services for corporate income tax compliance and other tax advisory services.
All Other Fees represent professional services provided for services not directly supporting financial statement audits. In 2011, it mainly includes expenses in connection with certain organization projects. In 2010, other fees include expenses incurred with the review of our accounts by the Netherlands Authority for the Financial Markets (the “AFM”) as well as fees for the finally withdrawn shares offering.
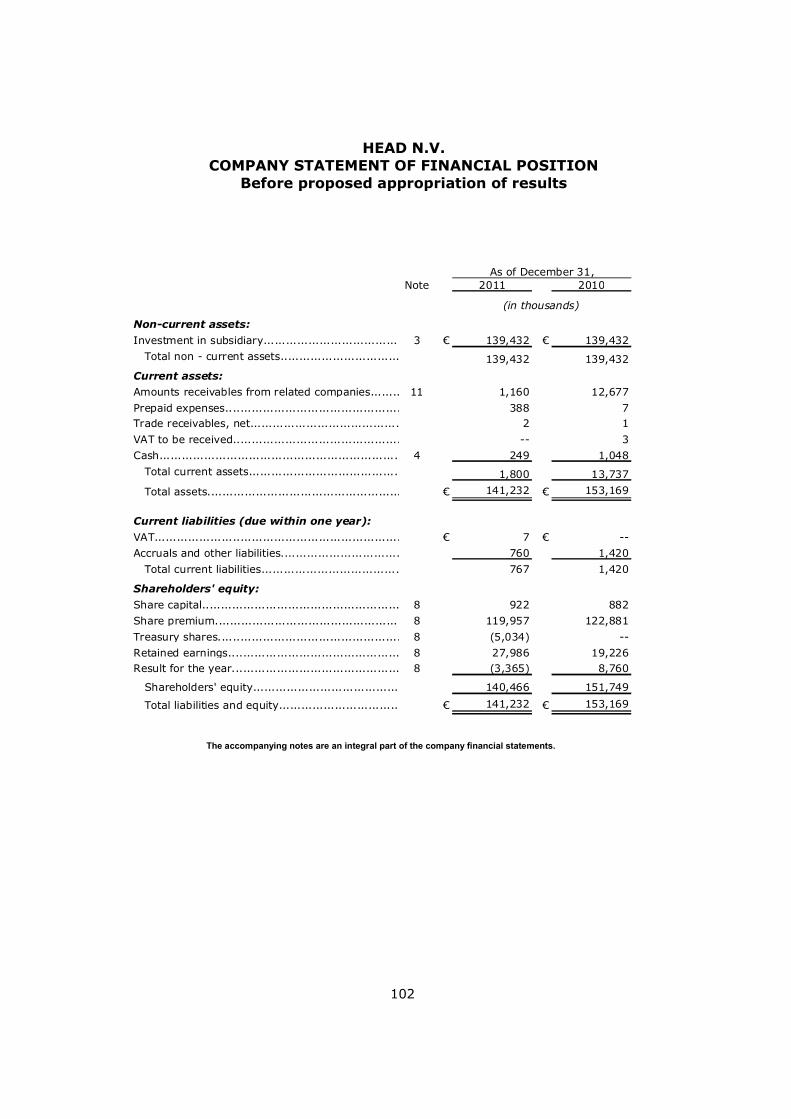
HEAD N.V. COMPANY STATEMENT OF FINANCIAL POSITION
Before proposed appropriation of results
102
Note 2011 2010
Non-current assets:
Investment in subsidiary......................................................................................................................3 € 139,432 € 139,432
Total non - current assets...................................................................................................................... 139,432 139,432
Current assets:
Amounts receivables from related companies......................................................................................................................11 1,160 12,677
Prepaid expenses...................................................................................................................... 388 7Trade receivables, net...................................................................................................................... 2 1
VAT to be received................................................................................................................. -- 3
Cash......................................................................................................................4 249 1,048
Total current assets...................................................................................................................... 1,800 13,737
Total assets.............................................................................................................................................................. € 141,232 € 153,169
Current liabilities (due within one year):
VAT...................................................................................................................... € 7 € --
Accruals and other liabilities...................................................................................................................... 760 1,420
Total current liabilities...................................................................................................................... 767 1,420
Shareholders' equity:
Share capital......................................................................................................................8 922 882
Share premium......................................................................................................................8 119,957 122,881
Treasury shares.....................................................................................................................................8 (5,034) --
Retained earnings......................................................................................................................8 27,986 19,226Result for the year......................................................................................................................8 (3,365) 8,760
Shareholders' equity............................................................................... 140,466 151,749
Total liabilities and equity...................................................................................................................... € 141,232 € 153,169
As of December 31,
(in thousands)
The accompanying notes are an integral part of the company financial statements.

HEAD N.V. COMPANY STATEMENT OF COMPREHENSIVE INCOME
103
2011 2010
Total net revenues.......................................................................................................................................................................................................................................................................................................€ 2,535 € 3,068
Cost of sales...........................................................................................................2,460 2,970
Gross profit.....................................................................................................................................................................................75 98
Selling and marketing expense.....................................................................................................................................................................................33 37
General and administrative expense...........................................................................................................................................................................3,271 3,824
Share-based compensation expense..............................................................................................................................-- (1,660)
Operating loss.....................................................................................................................................................................................(3,228) (2,102)
Interest income (loss) .....................................................................................................................................................................................39 (3)
Foreign exchange gain (loss).....................................................................................................................................................................................(177) (134)
Dividend income.......................................................................................................-- 11,000
Result for the year.......................................................................................................€ (3,365) € 8,760
(in thousands)
For the Years Ended December 31,
The accompanying notes are an integral part of the company financial statements.
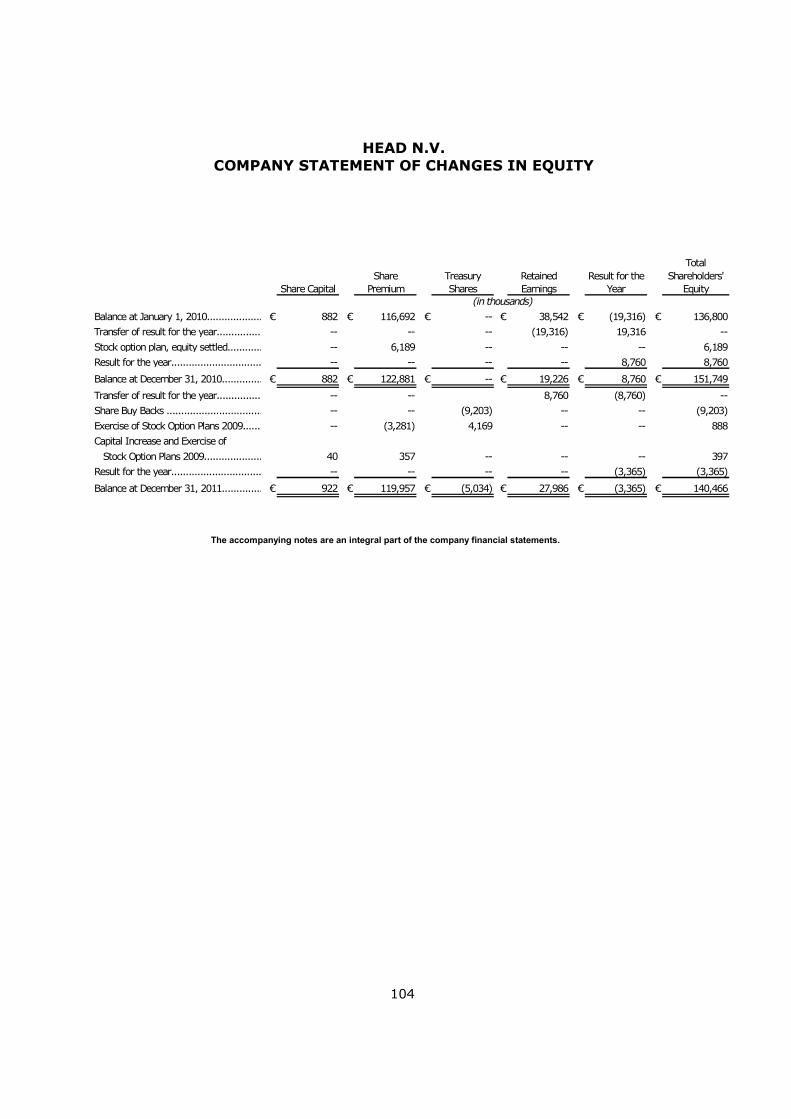
HEAD N.V. COMPANY STATEMENT OF CHANGES IN EQUITY
104
Share CapitalShare
PremiumTreasury Shares
Retained Earnings
Result for the Year
Total Shareholders'
Equity
Balance at January 1, 2010..........................................................................................................................................................€ 882 € 116,692 € -- € 38,542 € (19,316) € 136,800
Transfer of result for the year.......................................................................................................................................................... -- -- -- (19,316) 19,316 --
Stock option plan, equity settled.......................................................................................................................................................... -- 6,189 -- -- -- 6,189
Result for the year.......................................................................................................................................................... -- -- -- -- 8,760 8,760
Balance at December 31, 2010..........................................................................................................................................................€ 882 € 122,881 € -- € 19,226 € 8,760 € 151,749
Transfer of result for the year.......................................................................................................................................................... -- -- 8,760 (8,760) --
Share Buy Backs ............................................................... -- -- (9,203) -- -- (9,203)
Exercise of Stock Option Plans 2009.................. -- (3,281) 4,169 -- -- 888
Capital Increase and Exercise of
Stock Option Plans 2009............................................................... 40 357 -- -- -- 397
Result for the year.......................................................................................................................................................... -- -- -- -- (3,365) (3,365)
Balance at December 31, 2011..........................................................................................................................................................€ 922 € 119,957 € (5,034) € 27,986 € (3,365) € 140,466
(in thousands)
The accompanying notes are an integral part of the company financial statements.

HEAD N.V. COMPANY STATEMENT OF CASH FLOWS
105
Note 2011 2010
OPERATING ACTIVITIES:
Result for the year.......................................................................................................€ (3,365) € 8,760
Dividend received.......................................................................................................-- (11,000)
Share-based compensation expense............................................................................................................. -- (1,660)
Movement in accounts receivable.......................................................................................................... (1) 106
Movement in accounts receivable and payable,
intercompany.......................................................................................................... 11,517 3,775
Movement in prepaid expense and other assets.......................................................................................................... (381) 60
Movement in accounts payable, accrued expenses
and other liabilities.......................................................................................................... (650) 643
Net cash provided by operating activities 7,120 683
FINANCING ACTIVITIES:
Share Buy Back...................................................................................................................8 (9,203) --
Exercise of Stock Option Plans 2009....................................................................................................................6 1,245 --
Capital increase.......................................................................................................8 40 --Net cash used for financing activities.......................................................................... (7,918) --
Net increase (decrease) in cash and cash equivalents..................................................................................................... (798) 683
Cash and cash equivalents at beginning of period....................................................................... 1,048 364Cash and cash equivalents at end of period................................................................................€ 249 € 1,048
For the Years Ended December 31,
(in thousands)
The accompanying notes are an integral part of the company financial statements.
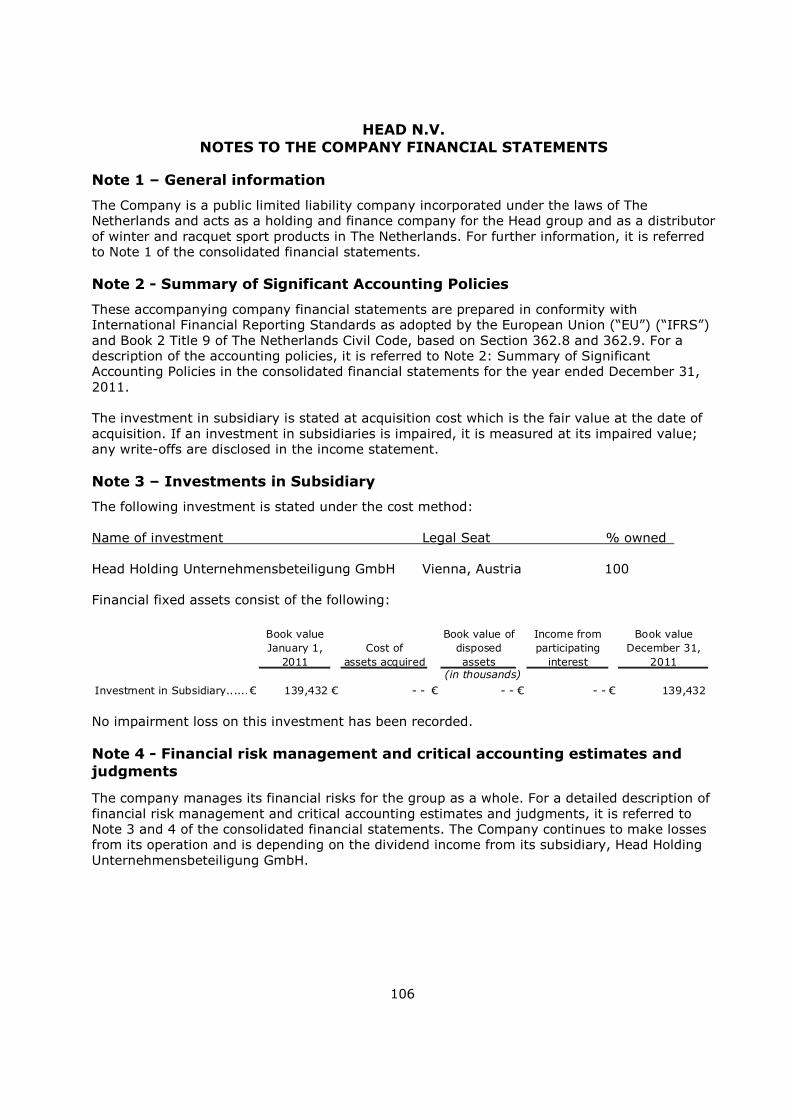
HEAD N.V. NOTES TO THE COMPANY FINANCIAL STATEMENTS
106
Note 1 – General information
The Company is a public limited liability company incorporated under the laws of The Netherlands and acts as a holding and finance company for the Head group and as a distributor of winter and racquet sport products in The Netherlands. For further information, it is referred to Note 1 of the consolidated financial statements. Note 2 - Summary of Significant Accounting Policies
These accompanying company financial statements are prepared in conformity with International Financial Reporting Standards as adopted by the European Union (“EU”) (“IFRS”) and Book 2 Title 9 of The Netherlands Civil Code, based on Section 362.8 and 362.9. For a description of the accounting policies, it is referred to Note 2: Summary of Significant Accounting Policies in the consolidated financial statements for the year ended December 31, 2011. The investment in subsidiary is stated at acquisition cost which is the fair value at the date of acquisition. If an investment in subsidiaries is impaired, it is measured at its impaired value; any write-offs are disclosed in the income statement. Note 3 – Investments in Subsidiary
The following investment is stated under the cost method: Name of investment Legal Seat % owned Head Holding Unternehmensbeteiligung GmbH Vienna, Austria 100 Financial fixed assets consist of the following:
Book value January 1,
2011Cost of
assets acquired
Book value of disposed assets
Income from participating
interest
Book value December 31,
2011
Investment in Subsidiary........................................................................................€ 139,432 € - - € - - € - - € 139,432
(in thousands)
No impairment loss on this investment has been recorded. Note 4 - Financial risk management and critical accounting estimates and judgments
The company manages its financial risks for the group as a whole. For a detailed description of financial risk management and critical accounting estimates and judgments, it is referred to Note 3 and 4 of the consolidated financial statements. The Company continues to make losses from its operation and is depending on the dividend income from its subsidiary, Head Holding Unternehmensbeteiligung GmbH.

HEAD N.V. NOTES TO THE COMPANY FINANCIAL STATEMENTS
107
Cash on hand as of December 31, 2011 and 2010 were as follows:
2011 2010
ABN AMRO Bank N.V. EUR...............................................................................................................................................................................€ 192 € 741
ABN AMRO Bank N.V. USD............................................................................................................................................................................... 17 295Morgan Stanley USD............................................................................................................................................................................... 4 8
Morgan Stanley EUR............................................................................................................................................................................... 8 4
Erste Bank..................................................................................................................................................................................... 28 --
€ 249 € 1,048
As of December 31,
(in thousands)
Note 5 – Accruals and Other Liabilities
Accrued expenses and other liabilities consist of the following:
2011 2010
Management and administration fee...............................................................................................................................................................................€ 83 € 88
Audit, consulting and legal fee............................................................................................................................................................................... 673 927Creditors.............................................................................................................................................................................. 4 369
Accrued expenses.............................................................................................................................................................................. 7 36
€ 767 € 1,420
As of December 31,
(in thousands)

HEAD N.V. NOTES TO THE COMPANY FINANCIAL STATEMENTS
108
Note 6 – Directors’ Remuneration
The Company had four managing directors and three supervisory board directors during the year. The table below shows the remuneration of the directors received from the group for the year ended December 31, 2011.
Periodic payments
Periodic expenses for
future payments
Accrued for future
payments
Share-based compensation
expense (income)
Management Board
Johan Eliasch.........................................................................................................................€ 545 € -- € -- € 218
Günter Hagspiel................................................................................................................ 406 187 195 8
Ralf Bernhart......................................................................................................................... 289 -- -- 49
George Nicolai......................................................................................................................... 10 -- -- --€ 1,250 € 187 € 195 € 275
Supervisory Board
Viktor Klima.........................................................................................................................€ 14 € -- € -- € --
Jürgen Hintz......................................................................................................................... 21 -- -- --
Richard Hurowitz (till March 29)......... -- -- -- --
Franz Klammer (from September 26)..... -- -- -- --
€ 36 € -- € -- € --
(in thousands)
The table below shows the remuneration of the directors received from the group for the year ended December 31, 2010.
Periodic payments
Periodic expenses for
future payments
Accrued for future
payments
Share-based compensation
expense (income)
Management BoardJohan Eliasch.........................................................................................................................€ 545 € -- € -- € (2,473)Günter Hagspiel................................................................................................................ 376 226 160 (26)Ralf Bernhart......................................................................................................................... 328 -- -- (41)George Nicolai......................................................................................................................... 10 -- -- --
€ 1,259 € 226 € 160 € (2,540)
Supervisory BoardViktor Klima.........................................................................................................................€ 15 € -- € -- € (9)Jürgen Hintz......................................................................................................................... 23 -- -- (9)
€ 38 € -- € -- € (18)
(in thousands)
The share-based compensation expense 2011 results from the increase in fair value of the liability for the already existing plans against option holders due to the increase of the company’s share price. None of our Management Board members or Supervisory Board members has service contracts that provide for benefits upon termination of employment. Except for Mr. Günter Hagspiel, there are no amounts accrued to provide members of the Management Board or the Supervisory Board with pension, retirement or similar benefits. As

HEAD N.V. NOTES TO THE COMPANY FINANCIAL STATEMENTS
109
reflected in the table above, the company incurred expenses of €0.2 million for future payments and had accrued severance benefits and bonus of €0.2 million as at December 31, 2011.
Under the Head N.V. Executive Stock Option Plan 2001 described the Company has issued options to purchase an aggregate of 2,428,044 depositary receipts representing ordinary shares to its Management Board and Supervisory Board members. For the year ended December 31, 2010, share-based compensation amounted to income of €0.2 million. The exercise price for all stock options granted under the 2001 Plan was fixed at inception of the Plan. During 2011, the Stock Option Plan 2001 expired as options had a maximum term of 10 years. As of December 31, 2011 the Company did not record a liability for this Plan.
Under the Head N.V. Executive Stock Option Plan 2005 described the Company has issued options to purchase an aggregate of 2,087,346 depositary receipts representing ordinary shares to its Management Board members. For the year ended December 31, 2011, share-based compensation expense amounted to €0.3 million (2010: income of €0.7 million). The exercise price for all stock options was fixed at inception of the Plan. The vesting period was four years.
Under the Head N.V. Executive Stock Option Plans 2009 described the Company has issued options to purchase an aggregate of 12,847,179 depositary receipts representing ordinary shares to its Chief Executive Officer. For the year ended December 31, 2010, share-based compensation income amounted to €1.7 million. The exercise price for all stock options granted under the 2009 Plan was fixed at inception of the Plans. The options vested at grant.
In March 2011, Head Sports Holdings N.V. (a Netherlands Antilles corporation, and its shareholders are controlled by the CEO of the Company Mr. Johan Eliasch and his family members) exercised the options granted under the May and September 2009 Stock Option Plans. In total these amounted to 12,847,179 options. These options have been satisfied by the transfer of 8,876,431 shares in Head N.V. held by the Company in March 2011 as treasury shares (see Note 12 of the consolidated financial statements), and the issuance by Head N.V. of 3,970,748 new shares. As a result, the total number of issued shares in Head N.V. increased from 88,204,030 to 92,174,778.
The table below shows the details of the Executive Option Plans for 2011:
Exercise price at the issuance
Number of non-exercised options at
beginning of the year
Number of written options
Number of exercised options Exercise price
Number of non-exercised
options at the end of the
year
Option Plan 2005
Johan Eliasch.........................................................................................................................€2.17 1,937,346 -- - - €2.17 1,937,346
Günter Hagspiel........................................................................................€2.17 75,000 -- - - €2.17 75,000
Ralf Bernhart.........................................................................................................................€2.17 75,000 -- - - €2.17 75,000
Option Plan 2009
Johan Eliasch.........................................................................................................................€0.10 12,847,179 -- (12,847,179) €0.10 --
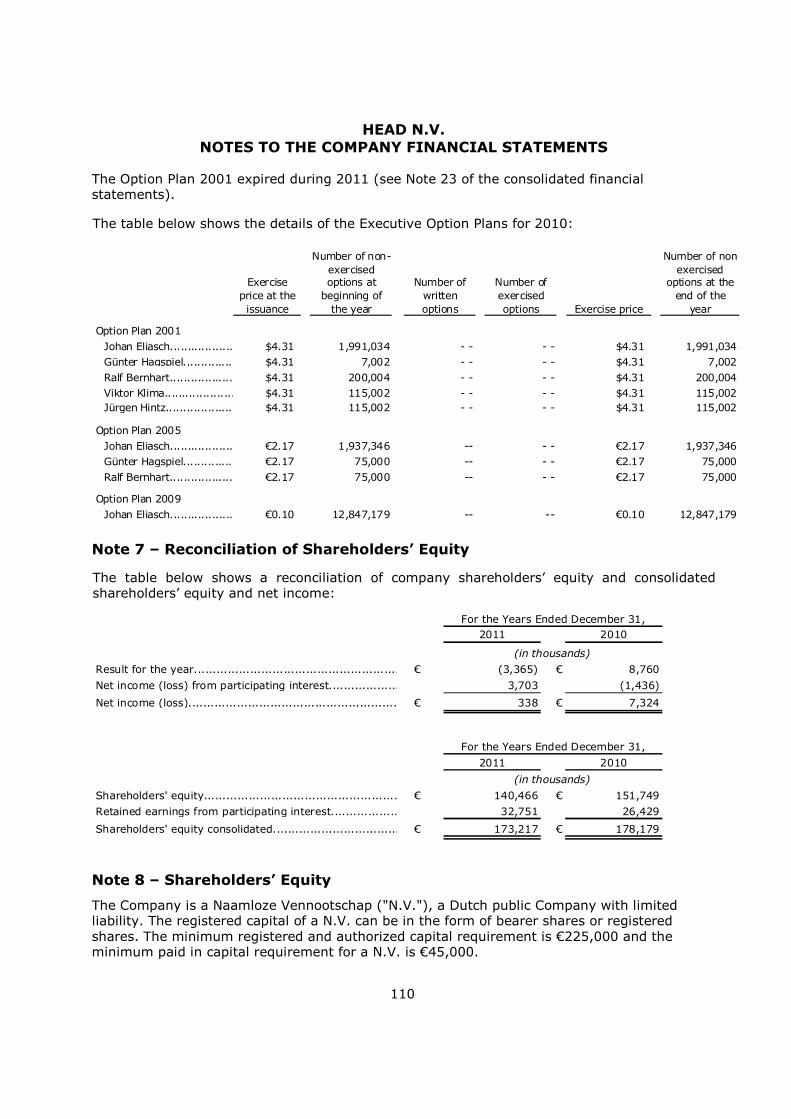
HEAD N.V. NOTES TO THE COMPANY FINANCIAL STATEMENTS
110
The Option Plan 2001 expired during 2011 (see Note 23 of the consolidated financial statements).
The table below shows the details of the Executive Option Plans for 2010:
Exercise price at the issuance
Number of non-exercised options at
beginning of the year
Number of written options
Number of exercised options Exercise price
Number of non-exercised
options at the end of the
year
Option Plan 2001
Johan Eliasch.........................................................................................................................$4.31 1,991,034 - - - - $4.31 1,991,034Günter Hagspiel........................................................................................$4.31 7,002 - - - - $4.31 7,002
Ralf Bernhart.........................................................................................................................$4.31 200,004 - - - - $4.31 200,004Viktor Klima.........................................................................................................................$4.31 115,002 - - - - $4.31 115,002Jürgen Hintz.........................................................................................................................$4.31 115,002 - - - - $4.31 115,002
Option Plan 2005
Johan Eliasch.........................................................................................................................€2.17 1,937,346 -- - - €2.17 1,937,346Günter Hagspiel........................................................................................€2.17 75,000 -- - - €2.17 75,000
Ralf Bernhart.........................................................................................................................€2.17 75,000 -- - - €2.17 75,000
Option Plan 2009
Johan Eliasch.........................................................................................................................€0.10 12,847,179 -- -- €0.10 12,847,179
Note 7 – Reconciliation of Shareholders’ Equity
The table below shows a reconciliation of company shareholders’ equity and consolidated shareholders’ equity and net income:
2011 2010
Result for the year......................................................................................................................................................................................€ (3,365) € 8,760
Net income (loss) from participating interest............................................................................................................................................................................................................................................ 3,703 (1,436)
Net income (loss)............................................................................................................................................................................................................................................€ 338 € 7,324
2011 2010
Shareholders' equity.................................................................................................................€ 140,466 € 151,749
Retained earnings from participating interest................................................................................................................. 32,751 26,429
Shareholders' equity consolidated.................................................................................................................€ 173,217 € 178,179
For the Years Ended December 31,
(in thousands)
For the Years Ended December 31,
(in thousands)
Note 8 – Shareholders’ Equity
The Company is a Naamloze Vennootschap ("N.V."), a Dutch public Company with limited liability. The registered capital of a N.V. can be in the form of bearer shares or registered shares. The minimum registered and authorized capital requirement is €225,000 and the minimum paid in capital requirement for a N.V. is €45,000.
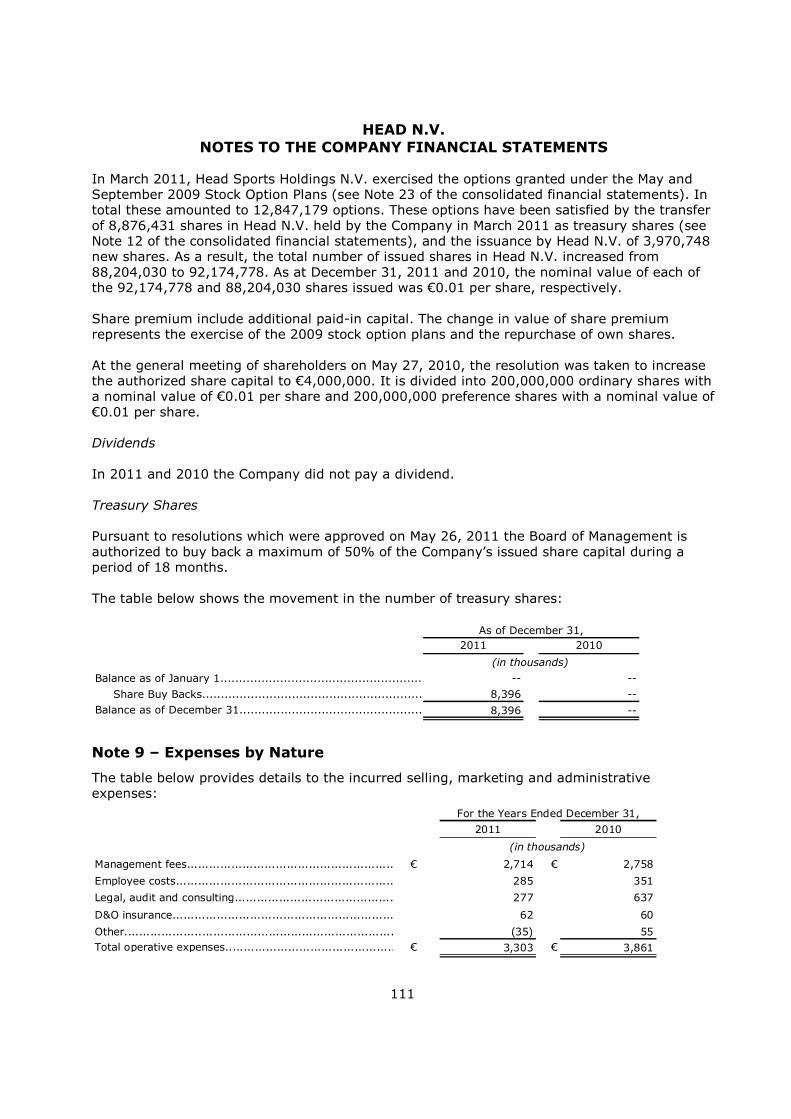
HEAD N.V. NOTES TO THE COMPANY FINANCIAL STATEMENTS
111
In March 2011, Head Sports Holdings N.V. exercised the options granted under the May and September 2009 Stock Option Plans (see Note 23 of the consolidated financial statements). In total these amounted to 12,847,179 options. These options have been satisfied by the transfer of 8,876,431 shares in Head N.V. held by the Company in March 2011 as treasury shares (see Note 12 of the consolidated financial statements), and the issuance by Head N.V. of 3,970,748 new shares. As a result, the total number of issued shares in Head N.V. increased from 88,204,030 to 92,174,778. As at December 31, 2011 and 2010, the nominal value of each of the 92,174,778 and 88,204,030 shares issued was €0.01 per share, respectively. Share premium include additional paid-in capital. The change in value of share premium represents the exercise of the 2009 stock option plans and the repurchase of own shares. At the general meeting of shareholders on May 27, 2010, the resolution was taken to increase the authorized share capital to €4,000,000. It is divided into 200,000,000 ordinary shares with a nominal value of €0.01 per share and 200,000,000 preference shares with a nominal value of €0.01 per share. Dividends
In 2011 and 2010 the Company did not pay a dividend. Treasury Shares Pursuant to resolutions which were approved on May 26, 2011 the Board of Management is authorized to buy back a maximum of 50% of the Company’s issued share capital during a period of 18 months. The table below shows the movement in the number of treasury shares:
2011 2010
Balance as of January 1................................................................................................................-- --
Share Buy Backs............................................................... 8,396 --Balance as of December 31................................................................................................................8,396 --
As of December 31,
(in thousands)
Note 9 – Expenses by Nature
The table below provides details to the incurred selling, marketing and administrative expenses:
2011 2010
Management fees.......................................................................................................€ 2,714 € 2,758
Employee costs....................................................................................................... 285 351
Legal, audit and consulting....................................................................................................... 277 637
D&O insurance............................................................ 62 60
Other....................................................................................................... (35) 55Total operative expenses.......................................................................................................€ 3,303 € 3,861
For the Years Ended December 31,
(in thousands)
HEAD N.V. NOTES TO THE COMPANY FINANCIAL STATEMENTS
112
Note 10 – Income tax
The total loss available for tax loss carry forward at the end of 2011 provided that the Dutch tax authorities agree with the 2009, 2010 and 2011 corporate income tax return is €31.5 million. The Company does not report any tax as it continuously incurs tax losses from 2000 and no deferred tax assets are recognized.
Note 11 – Related Party Transactions
Head Sports Holdings N.V. and its shareholders controlled 61,089,243 (2010: 48,242,064) shares, or approximately 66.28% (2010: 54.69%) of the Company’s issued shares, as of December 31, 2011. Head Sports Holdings N.V., a Netherlands Antilles corporation, and its shareholders are controlled by Mr. Johan Eliasch and his family members resulting in the ability to significantly influence and control the Company’s operations. The Company receives administrative services from corporations which are ultimately owned by the principal shareholder of the Company. Administrative expenses amounted to approximately €2.0 million for the year ended December 31, 2011 and 2010, respectively. The related party provides consulting, corporate finance, investor relations and legal services. The Company received product deliveries of €2.5 million (2010: €3.0 million) for the distribution in The Netherlands from a group company. As of December 31, 2011, the Company recorded a receivable of €1.2 million compared to €12.7 million as of December 31, 2010 due to deliveries of products and payment of shares bought back by group. The Company and some of its subsidiaries guarantee jointly and severally the Senior Notes on a senior unsecured basis. The Company has the obligation to provide own shares to the Stichting (see Note 12 for description of Stichting) in relation to the Company’s stock option plans. Amsterdam, April 9, 2012 Johan Eliasch Günter Hagspiel Chief Executive Officer Chief Financial Officer Ralf Bernhart George Nicolai Managing Director Managing Director Viktor Klima Jürgen Hintz Franz Klammer Supervisory Board Member Supervisory Board Member Supervisory Board Member
HEAD N.V. OTHER INFORMATION
113
Auditor’s Report The report of the auditor, PricewaterhouseCoopers Accountants N.V., is presented on page 114 of this report. Appropriation of Result – Provisions in Company’s Statutes
The Company’s articles of association provide that the appropriation of results is at the disposal of the Board of Management. Appropriation of Result The Board of Management is proposing with due observance of the Company's policy on additions to reserves and on distribution of profits to allocate the result for the year to retained earnings. This proposal is not yet reflected in the accounts.
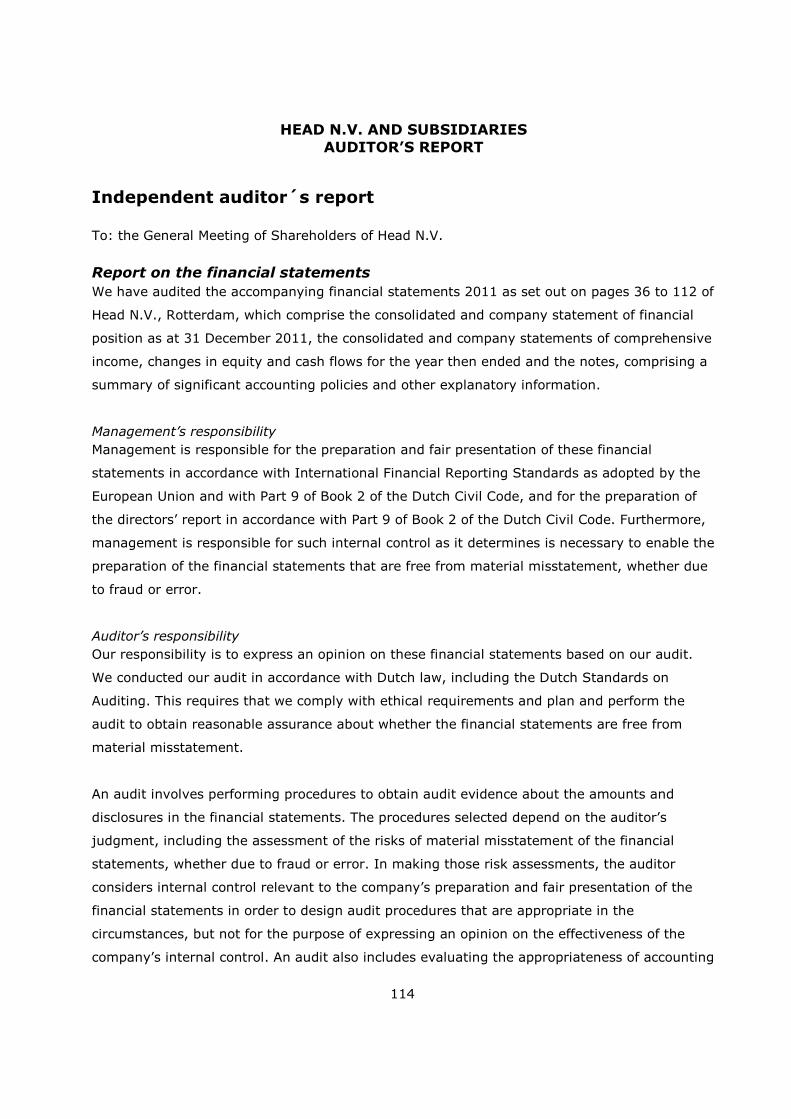
HEAD N.V. AND SUBSIDIARIES AUDITOR’S REPORT
114
Independent auditor´s report To: the General Meeting of Shareholders of Head N.V.
Report on the financial statements
We have audited the accompanying financial statements 2011 as set out on pages 36 to 112 of
Head N.V., Rotterdam, which comprise the consolidated and company statement of financial
position as at 31 December 2011, the consolidated and company statements of comprehensive
income, changes in equity and cash flows for the year then ended and the notes, comprising a
summary of significant accounting policies and other explanatory information.
Management’s responsibility
Management is responsible for the preparation and fair presentation of these financial
statements in accordance with International Financial Reporting Standards as adopted by the
European Union and with Part 9 of Book 2 of the Dutch Civil Code, and for the preparation of
the directors’ report in accordance with Part 9 of Book 2 of the Dutch Civil Code. Furthermore,
management is responsible for such internal control as it determines is necessary to enable the
preparation of the financial statements that are free from material misstatement, whether due
to fraud or error.
Auditor’s responsibility
Our responsibility is to express an opinion on these financial statements based on our audit.
We conducted our audit in accordance with Dutch law, including the Dutch Standards on
Auditing. This requires that we comply with ethical requirements and plan and perform the
audit to obtain reasonable assurance about whether the financial statements are free from
material misstatement.
An audit involves performing procedures to obtain audit evidence about the amounts and
disclosures in the financial statements. The procedures selected depend on the auditor’s
judgment, including the assessment of the risks of material misstatement of the financial
statements, whether due to fraud or error. In making those risk assessments, the auditor
considers internal control relevant to the company’s preparation and fair presentation of the
financial statements in order to design audit procedures that are appropriate in the
circumstances, but not for the purpose of expressing an opinion on the effectiveness of the
company’s internal control. An audit also includes evaluating the appropriateness of accounting
HEAD N.V. AND SUBSIDIARIES AUDITOR’S REPORT
115
policies used and the reasonableness of accounting estimates made by management, as well
as evaluating the overall presentation of the financial statements.
We believe that the audit evidence we have obtained is sufficient and appropriate to provide a
basis for our audit opinion.
Opinion
In our opinion, the financial statements give a true and fair view of the financial position of
Head N.V. as at 31 December 2011, and of its result and its cash flows for the year then ended
in accordance with International Financial Reporting Standards as adopted by the European
Union and with Part 9 of Book 2 of the Dutch Civil Code.
Report on other legal and regulatory requirements
Pursuant to the legal requirement under Section 2: 393 sub 5 at e and f of the Dutch Civil
Code, we have no deficiencies to report as a result of our examination whether the directors’
report, to the extent we can assess, has been prepared in accordance with Part 9 of Book 2 of
this Code, and whether the information as required under Section 2: 392 sub 1 at b-h has
been annexed. Further we report that the directors’ report, to the extent we can assess, is
consistent with the financial statements as required by Section 2: 391 sub 4 of the Dutch Civil
Code.
Amsterdam, April 11, 2012
PricewaterhouseCoopers Accountants N.V.
B. Koolstra RA
HEAD N.V. AND SUBSIDIARIES RELEASE BY THE MANAGEMENT BOARD
116
Statement by the Management Board according to the European Transparency Guideline (implemented in Section 5:25c Dutch Financial Supervision Act) We confirm to the best of our knowledge that the consolidated financial statements give a true and fair view of the assets, liabilities, financial position and profit or loss of the group as required by the applicable accounting standards and that the directors’ report gives a true and fair view of the development and performance of the business and the position of the group, together with a description of the principal risks and uncertainties the group faces. We confirm to the best of our knowledge that the separate financial statements give a true and fair view of the assets, liabilities, financial position and profit or loss of the parent company as required by the applicable accounting standards and that the directors’ report gives a true and fair view of the development and performance of the business and the position of the company, together with a description of the principal risks and uncertainties the company faces.
Amsterdam, April 9, 2012 Johan Eliasch Günter Hagspiel Chief Executive Officer Chief Financial Officer Ralf Bernhart George Nicolai Managing Director Managing Director
Top Related