


Languages
Pages
Legal


4/13/2021
1
HCCA REGIONAL CONFERENCE
LEAN SIX SIGMA TOOLS FOR PLANNING AND EXECUTION
David Cutri
Friday, April 30, 2021
AGENDA
• Introduction
• Twenty-First Century Healthcare Challenges
• Staggering Statistics
• How Can Lean Six Sigma Help?
• Pioneers in Healthcare
• Culture and Implementation
2
1
2

4/13/2021
2
Healthcare is a terminal illness for America’s governments and businesses. We are in big trouble.
-- CLAYTON M. CHRISTENSEN
Author, The Innovator’s Prescription: A Disruptive Solution for Health Care
3
ROOM FOR IMPROVEMENT …• Healthcare professionals are doing the best they can.
• Of the 3B prescriptions filled each year, 150M are filled incorrectly.
• 50 of 100 patients will suffer some form of preventable "harm".
• And patients aren't the only people affected by healthcare problems.
• The costs of healthcare threaten patients and their families.
• Common problems are the same across the industry.
4
3
4

4/13/2021
3
CONTINUOUS QUALITY IMPROVEMENT
A 2019 American Society for Quality of 77 hospitals found that …
• 53 percent use some form of Lean.
• Only 4 percent had fully implemented Lean.
• 42 percent had some form of Six Sigma.
• Only 8 percent had fully implemented Six Sigma.
• 11 percent were unfamiliar with either Lean or Six Sigma.
5
TWENTY-FIRST CENTURY HEALTHCARE CHALLENGES
6
1990 2000 2010 2015 2017 2019
Heathcare Costs $0.3 $0.7 $1.2 $1.8 $2.3 $2.5
Percent of GDP 0.9% 12.2% 13.5% 15.0% 16.0% 17.3%
0.0%
5.0%
10.0%
15.0%
20.0%
$0.0
$0.5
$1.0
$1.5
$2.0
$2.5
$3.0
1990 2000 2010 2015 2017 2019
Healthcare costs as a percent of GDP.
Heathcare Costs Percent of GDP
5
6

4/13/2021
4
A staggering 50 percent of healthcare consumed seems to be driven by physician and hospital supply, not patient need or demand.
-- CLAYTON M. CHRISTENSEN
7
TWENTY-FIRST CENTURY HEALTHCARE CHALLENGES
8
Hospital Care31%
Other23%
Physician Services21%
Pharmaceuticals10%
Nursing Homes8%
Diagnostic Laboratories7%
Healthcare spending.
7
8

4/13/2021
5
STAGGERING STATISTICS• 1/100 admitted to a hospital will die as a result of a medical mistake (To Err is Human,
National Academy Press 2010).
• Another 6/100 patients will be permanently disabled as a result of a medical mistake.
• The Institute for Healthcare Improvement found that 1/2 (50%) suffered some form of preventable harm in the hospital.
• 15/100 diagnoses are incorrect.
• 20-50/100 diagnostic procedures (e.g., imaging) should never have been done because their results did not help to diagnose ailments or treat patients.
• 5-10/100 admitted patients acquire an infection.
• 3/100 have an incorrect ID band.
• The average hospital spends 25% of its budget on billing and admission.
9
Fifty percent of a nurse’s time is spent doing things that don’t add value, like looking for medications that aren’t where they’re supposed to be or looking for equipment that isn’t where I’s supposed to be.
-- PAUL O’NEILL,
Former U.S. Secretary
of the Treasury
10
9
10

4/13/2021
6
NOT THE ONLY ISSUE …
• And the clinical side is not the only issue.
• Healthcare operations -- billing, ordering, etc. -- waste even
more money.
• Insurance companies are quick to reject claims and slow to pay,
which causes more problems.
11
PIONEERS IN HEALTHCARESSM Health Care in St. Louis and the Pittsburgh Regional Healthcare Initiative have used Lean Six Sigma to …
• Reduce coronary bypass mortality by 25 percent “using a 3-cent aspirin and a 50-cent beta blocker in the emergency room”
• Reduce hospital-acquired infections by 85 percent, saving $30,000 per infection
• Reduce central-line infections by 63 percent• Reduce medication errors from 16 per 100,000 to 1 per 100,000
12
11
12
4/13/2021
7
“DMAIC”Define
Measure
Analyze
Improve
Control
13
KEY LEAN SIX SIGMA/DMAIC TOOLSAND HOW TO APPLY THEM
14
• Value Stream Mapping
• “As Is”/”To Be” Spaghetti Diagram
• Fishbone Diagrams
• Pareto Charts
13
14

4/13/2021
8
VALUE STREAM MAPPING
15
VALUE STREAM MAPPING
16
• Quantification
• Value
15
16
4/13/2021
9
VALUE STREAM MAPPINGCATEGORIES OF VALUE
17
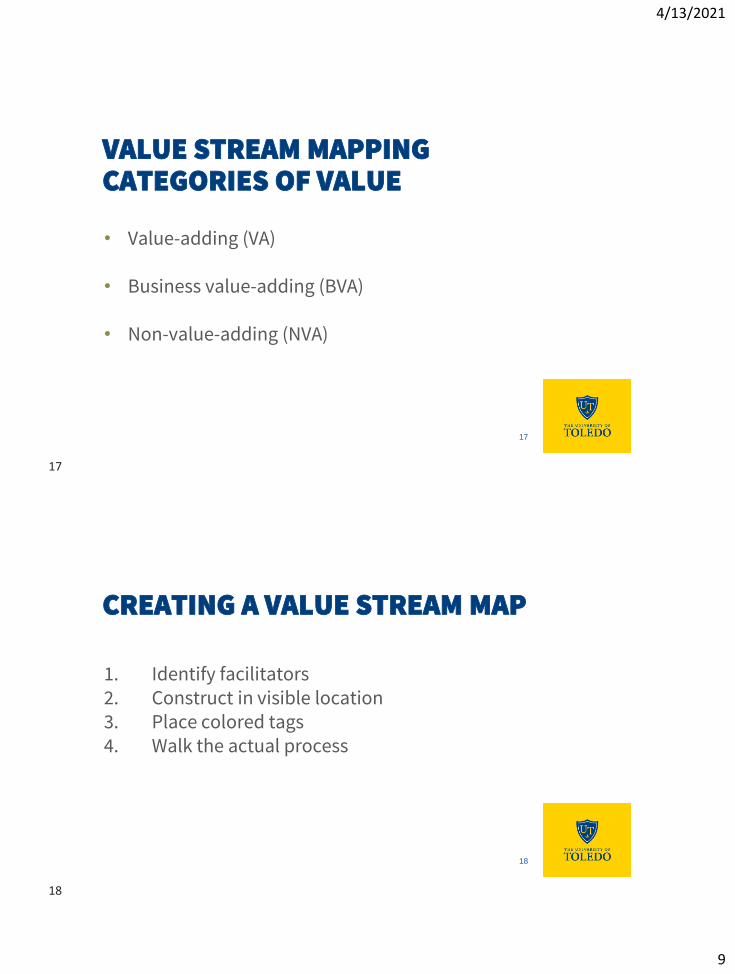
• Value-adding (VA)
• Business value-adding (BVA)
• Non-value-adding (NVA)
CREATING A VALUE STREAM MAP
18
1. Identify facilitators2. Construct in visible location3. Place colored tags4. Walk the actual process
17
18

4/13/2021
10
VALUE STREAM MAP (“BROWN PAPER”)
19
“AS IS” AND “TO BE” SPAGHETTI DIAGRAMS
20
19
20
4/13/2021
11
SPAGHETTI DIAGRAMS
21
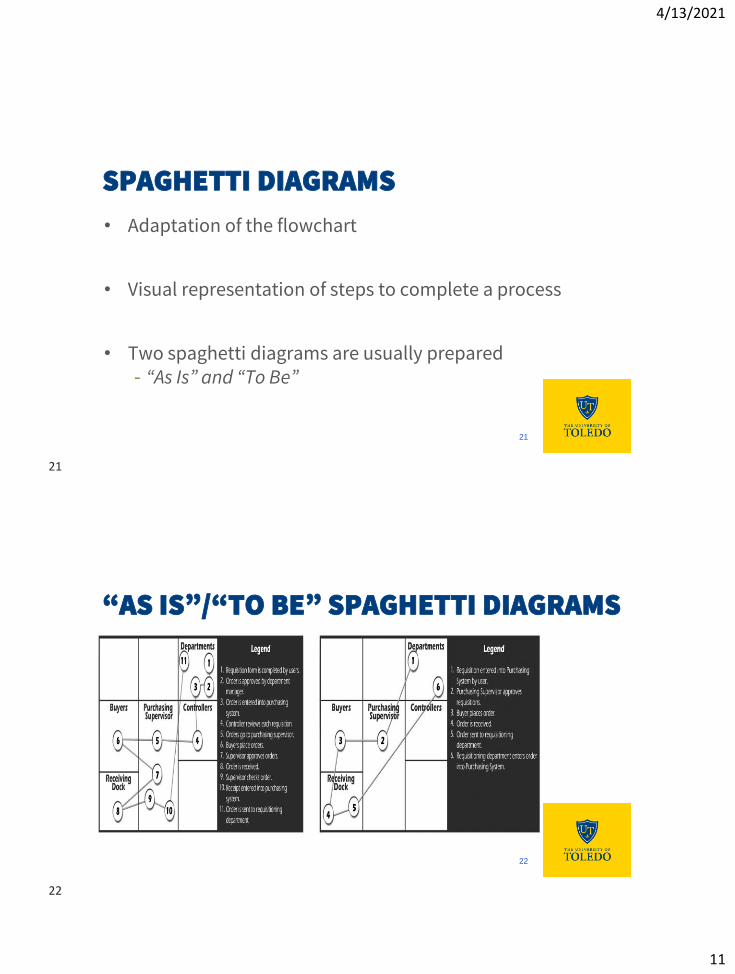
• Adaptation of the flowchart
• Visual representation of steps to complete a process
• Two spaghetti diagrams are usually prepared- “As Is” and “To Be”
“AS IS”/“TO BE” SPAGHETTI DIAGRAMS
22
21
22

4/13/2021
12
SPAGHETTI DIAGRAMS: BENEFITS
23
• Identify:➢ Inefficiencies in area/workspace layout/design➢ Opportunities for less handling➢ Opportunities for better workforce communication➢ Resource allocation opportunities➢ Opportunities for safety improvements
• Highlight major intersection points• Promote staff collaboration
CREATING A SPAGHETTI DIAGRAM
24
1. Diagram floor plan2. Identify object/person to track3. Draw a line replicating actual flow4. Continue until all process steps mapped5. Discuss the final diagram
23
24

4/13/2021
13
CAUSE AND EFFECT (FISHBONE) DIAGRAMS
25
ROOT CAUSE ANALYSIS
26
• General- Structured approach to identifying the factors that resulted in harmful
outcomes - Problems are best solved by attempting to address, correct, or eliminate
root causes
• Root Cause Analysis Tools- Cause-and-effect (fishbone) diagrams- Pareto charts
25
26

4/13/2021
14
FISHBONE DIAGRAMS
27
• Causal diagrams that help you visually display the many potential causes for a problem or an effect
• Also known as fishbone diagrams because their shape is like the side view of a fish skeleton
FISHBONE DIAGRAMSSIX CATGORIES FOR PROBLEMS
28
• Man
• Machine
• Measurements
• Method
• Materials
• Milieu
27
28

4/13/2021
15
CONSTRUCTING A FISHBONE DIAGRAM
29
1. State the problem in the form of a question2. Brainstorm the major categories of causes of the problem3. Draw the categories of causes as branches from the main
arrow4. Begin brainstorming possible causes and attach them to the
appropriate branches5. Ask “Why does this happen?” about each cause6. Focus attention on areas of the chart where ideas are scarce7. Prioritize key causes
FISHBONE DIAGRAM EXAMPLE
30
29
30

4/13/2021
16
PARETO CHARTS
31
PARETO CHARTS
32
• Identify vital items that contribute to problem or opportunity
• Illustrate Pareto principle- 80/20 Rule
• Identify, rank, eliminate defects
31
32

4/13/2021
17
PARETO CHARTS
33
Pareto charts display the count frequency of categorical data in descending order by frequency and category and are useful because they focus attention on those categories that have the highest observational frequencies.
• Root cause analysis- Pareto charts focus attention on the major root causes- Raw-material inventory example
• Scoping- Many teams do not utilize this important tool fully- Identify process step with the highest incidence rate
PARETO CHART EXAMPLE
34
33
34

4/13/2021
18
CREATING A PARETO CHART
35
1. Decide problem 2. Choose unit of measure3. Choose time period4. Gather data5. Compare relative cost or frequency of each problem
category6. Use a line graph to show the cumulative total7. Display the data in descending order on a bar chart8. Interpret the results
OTHER LEAN SIX SIGMA/DMAIC TOOLS
36
• Project Charter• RACI Diagram• SIPOC Diagram• Waste Walk• 5S
• Control Charts• Theory of Constraints • The “Five Whys” Technique• Poke Yokes
Email [email protected] on where to find more information on these tools/reference materials.
35
36

4/13/2021
19
David Cutri
Friday, April 30, 2021
THANK YOU!
Questions?
37
Top Related