


Languages
Pages
Legal


Guanabara Bay QMRA
Rachel SklarAnna Gitter
Alexandre Chabrelie
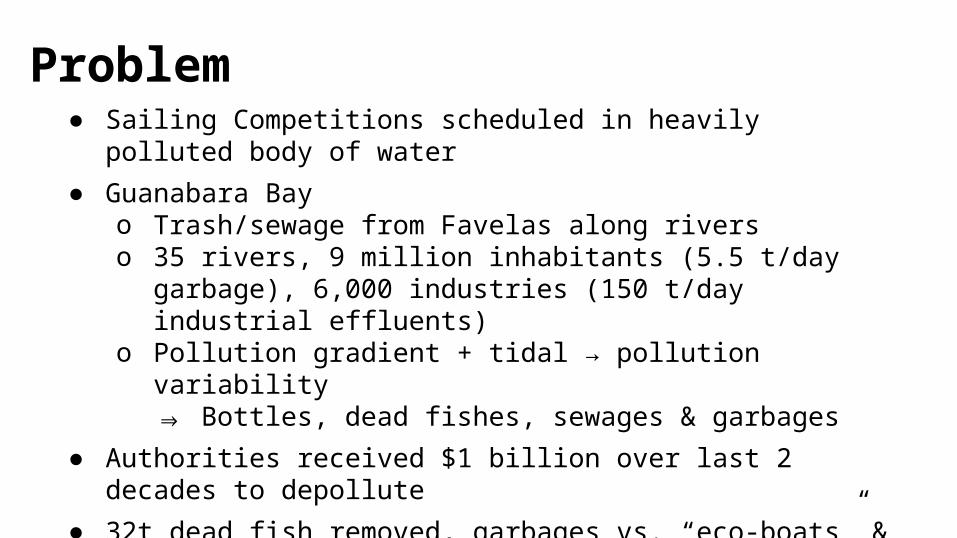
Problem● Sailing Competitions scheduled in heavily polluted body of water
● Guanabara Bay o Trash/sewage from Favelas along riverso 35 rivers, 9 million inhabitants (5.5 t/day garbage), 6,000
industries (150 t/day industrial effluents)o Pollution gradient + tidal → pollution variability
⇒ Bottles, dead fishes, sewages & garbages
● Authorities received $1 billion over last 2 decades to depollute
● 32t dead fish removed, garbages vs. “eco-boats” & eco-barriers, 35% average in 2013 (some spikes: 7% treated sewages)

“Removing 80% of the pollutants? It’s not going to happen”
“From the point of view of the Olympics, the point of view of water
quality, what I’ve said about the 80% does not at all affect the courses”
for the sailing events, Correa said. “There’s no big risk for sailors
having troubles with illnesses and such things.”
Andre Correa, Rio State Environmental Secretary


What is the risk of contracting Highly Credible Gastroenteric Disease to sailors during one hour of an olympic race?
QMRA Question
Hazard ID
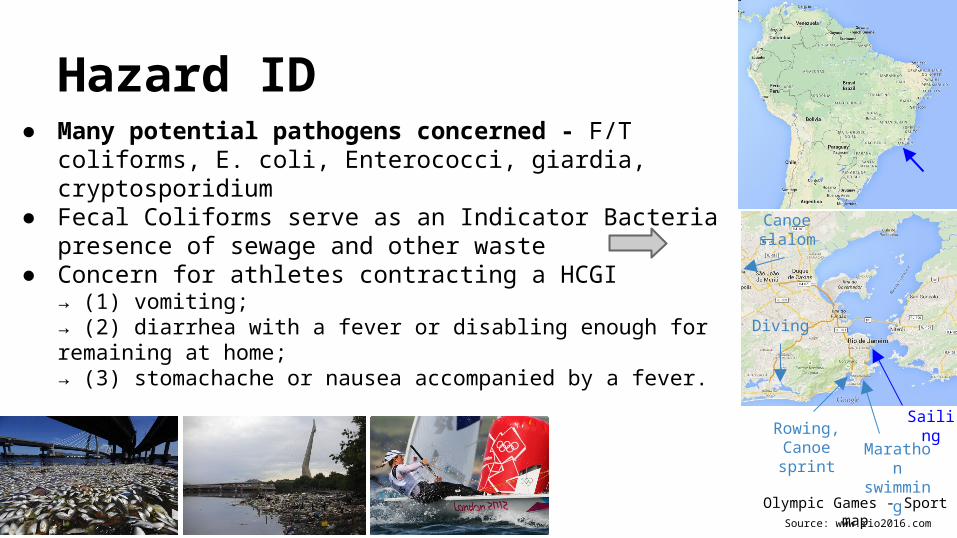
Olympic Games - Sport mapSource: www.rio2016.com
Canoe slalom
Marathon swimming
SailingRowing,
Canoe sprint
Diving
● Many potential pathogens concerned - F/T coliforms, E. coli, Enterococci, giardia, cryptosporidium
● Fecal Coliforms serve as an Indicator Bacteriapresence of sewage and other waste
● Concern for athletes contracting a HCGI→ (1) vomiting;→ (2) diarrhea with a fever or disabling enough for remaining at home;→ (3) stomachache or nausea accompanied by a fever.

Paranhos et al. 1998

Exposure Assessment● Incidental ingestion
o Assumptions recreational contact routes: inhalation and entrapment of mists in the nose and mouth with swallowing;
secondary contact of water (Geosyntec 2008; Sunger 2012) Duration of sailing events: one hour (worst-case scenario assumption)
Distribution Lognormal
Mean 5
Standard Deviation 5
Fixed IntakeMedian (50th Percentile)100th Percentile
4 mL/hr7.52 mL/hr34 mL/hr
Table 1: Canoeist Ingestion Rates (mL/hr) (Geosyntec 2008)


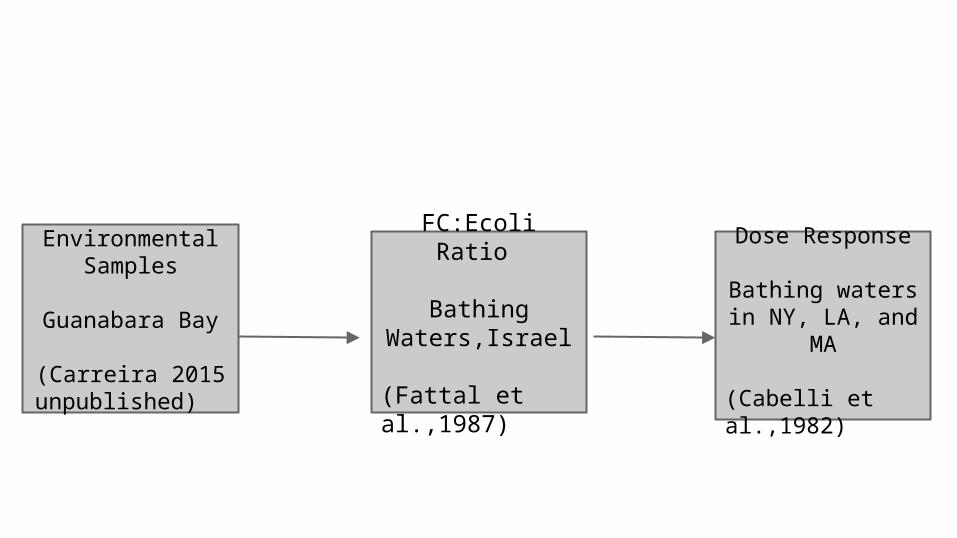
Environmental Samples
Guanabara Bay
(Carreira 2015 unpublished)
FC:Ecoli Ratio
Bathing Waters,Israel
(Fattal et al.,1987)
Dose Response
Bathing waters in NY, LA, and MA
(Cabelli et al.,1982)

Dose Response● Exponential DR Model fit to data from Cabelli et al. 1982
Kcalculated=0.001254263

Risk Characterization
● Crystal Ball method
● Risk of HCGI risk for sailors during one hour of an olympic sailing race: 6.24999E-06
● Very Low!

Risk
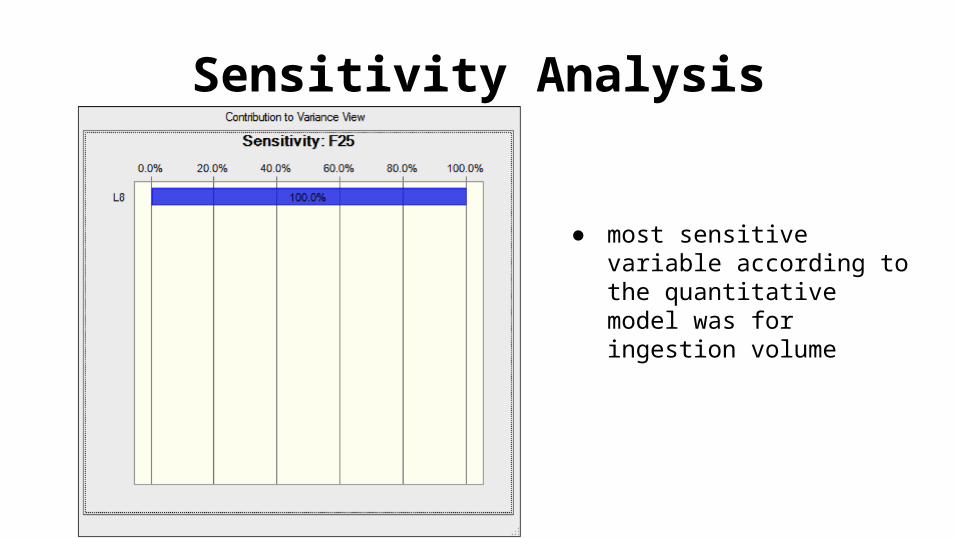
Sensitivity Analysis
● most sensitive variable according to the quantitative model was for ingestion volume

Modelling Limitations
● sensitivity analysis: greatest uncertainty is ingestion rate ???
● FC:E.Coli Ratio for a different environment, Israel vs. Brazil
● Dose-Response curve derived from epi studies in N. America bathing waters

Risk Management
Risk Mitigation● Current:
o New Sewage Treatment Plantso Floating Garbage Barrierso Trash Collecting Vessels called Ecoboats
● Potentialo Education & economic incentives to bring trash and other
waste to a centralized disposal location o Limit unnecessary recreation by athletes in the watero Consider relocating event to a less polluted area of the bay or
out of Brazil

“It can get really disgusting, with dog carcasses in some places and the water turning brown from sewage contamination”
Thomas Low-Beer, 24, a Brazilian sailor
Guanabara Bay was exaggerated, contending that recent tests had shown that fecal contamination in the Olympic regatta area was within “satisfactory” standards in Brazil.
Carlos Portinho, Rio’s top environmental advisor
Future Work● Hazard ID: look at presence of geographically specific pathogens
● Exposure Assessment: sailing specific ingestion rates via observation
● Dose-Response: o indicator to pathogen ratio specific to geographic regiono dose-response curve derived from epi studies in geographically similar
area
● Risk Management:o risk would be significantly lower in another bay in Brazil? o model risk reduction: cost o survey athletes to gauge risk perception

Risk Management● Relocation Scenario: loss of revenue for
Brazil/local communities
● Cleanup Scenario:o investment in prevention and cleanup (infrastructure)o Local leaders, CBO, Brazilian Govt, Olympic
Committeeo incentive schemes that involve benefits for local
people


SourcesAquece Rio-International Sailing Regatta 2015. (n.d.). Retrieved June 11, 2015, from http://www.aquecerio.com/sailing2015/en/documents/NoticeOfRace.pdf Cabelli, V. J., Dufour, A. P., McCabe, L. J., & Levin, M. A. (1982). SWIMMING-ASSOCIATED GASTROENTERITIS AND WATER QUALITY1. American journal of epidemiology, 115(4), 606-616.Francy, D. S., Myers, D. N., & Metzker, K. D. (1993). Escherichia coli and fecal-coliform bacteria as indicators of recreational water quality. US Department of the Interior, US Geological Survey.Geosyntec. (2008). Dry and wet weather risk assessment of human health impacts of disinfection v. no disinfection of the Chicago Area Waterways System (CWS). Retrieved June 8, 2015, from https://www.mwrd.org/pv_obj_cache/pv_obj_id_6AC3502D8F86067ABE801480B078B7E5B7182001/filename/GEOSYNTEC_RISKASSESS_Final.pdf Kjerfve, B., Ribeiro, C. H., Dias, G. T., Filippo, A. M., & Quaresma, V. D. S. (1997). Oceanographic characteristics of an impacted coastal bay: Baía de Guanabara, Rio de Janeiro, Brazil. Continental Shelf Research, 17(13), 1609-1643.Paranhos, R., Pereira, A. P., & Mayr, L. M. (1998). Diel variability of water quality in a tropical polluted bay. Environmental Monitoring and Assessment, 50(2), 131-141.Kirkpatrick, N. (2015, March 19). 2016 Rio Olympics: Sailing with Sewage. The Washington Post. Retrieved June 10, 2015, from http://www.washingtonpost.com/news/morning-mix/wp/2015/03/19/the-bay-in-rio-where-2016-olympic-sailors-will-compete-is-a-disgusting-cesspool/ Sunger, N. 2013. Quantitative Health Risk Assessment of Recreational Water Users in Philadelphia. (Doctoral Dissertation). Accessed from Google Scholar.Texas Commission for Environmental Quality. (2007). Texas Water Quality Standards: Criteria for Recreation. Available from: www.tceq.texas.gov/assets/public/waterquality/tmdl/82lakehouston/82-bactstand-oct2007.pdf.
Top Related