


Languages
Pages
Legal

GROWTH-LIMITING SOIL BULK DENSITIESAS INFLUENCED BY SOIL TEXTURE
DEVELOPED BY
RICHARD L. DADDOWAND
GORDON E. WARRINGTON
WSDG REPORTWSDG-TN-00005JANUARY 1983
WATERSHED SYSTEMS DEVELOPMENT GROUPUSDA FOREST SERVICE
3825 EAST MULBERRY STREETFORT COLLINS, COLORADO 80524
Table of Contents
1.0 Introduction
2.0 Relationship of Soil Texture to Growth-Limiting BulkDensity
3.0 Analysis Methods and Results
4.0 Estimation of Growth-Limiting Bulk Densities
5.0 Limitations and Assumptions
6.0 Management Implications of the Growth-Limiting Bulk DensityTextural Triangle
7.0 Summary and Conclusion
Literature Cited
Page
1
2
3
1 0
1 0
1 2
1 3
1 5

List of Tables
Page
Table 1 .--Soil and plant data related to growth-limiting bulk 5density values.
List of Figures
Page
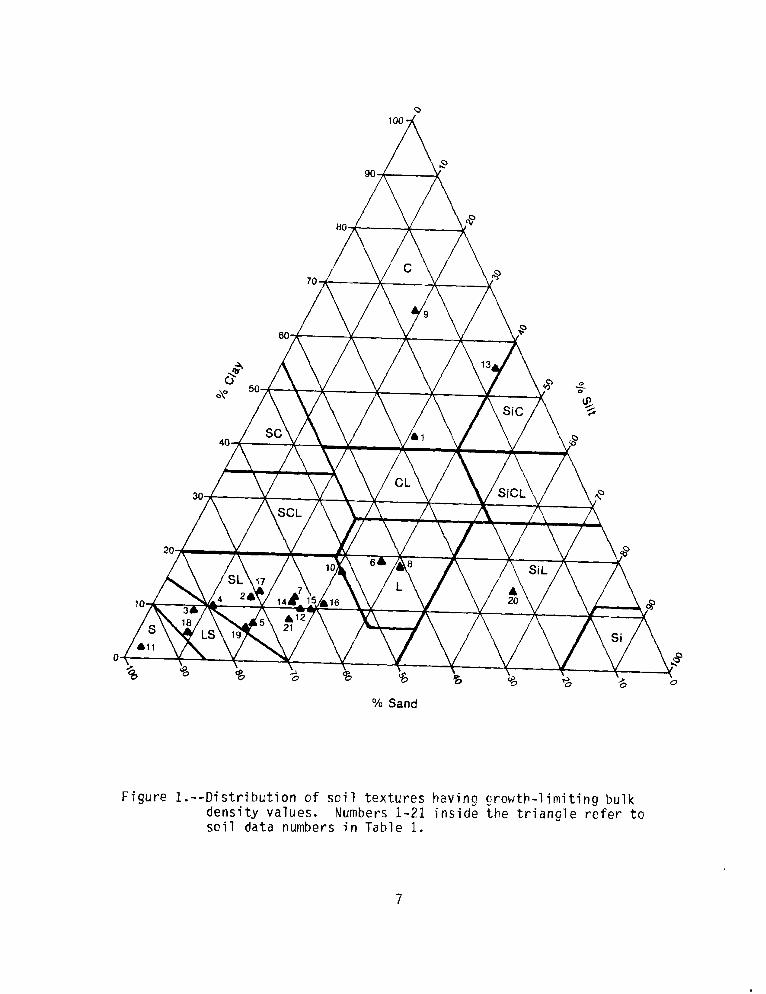
Figure 1.--Distribution of soil textures having growth-limiting 7bulk density values.
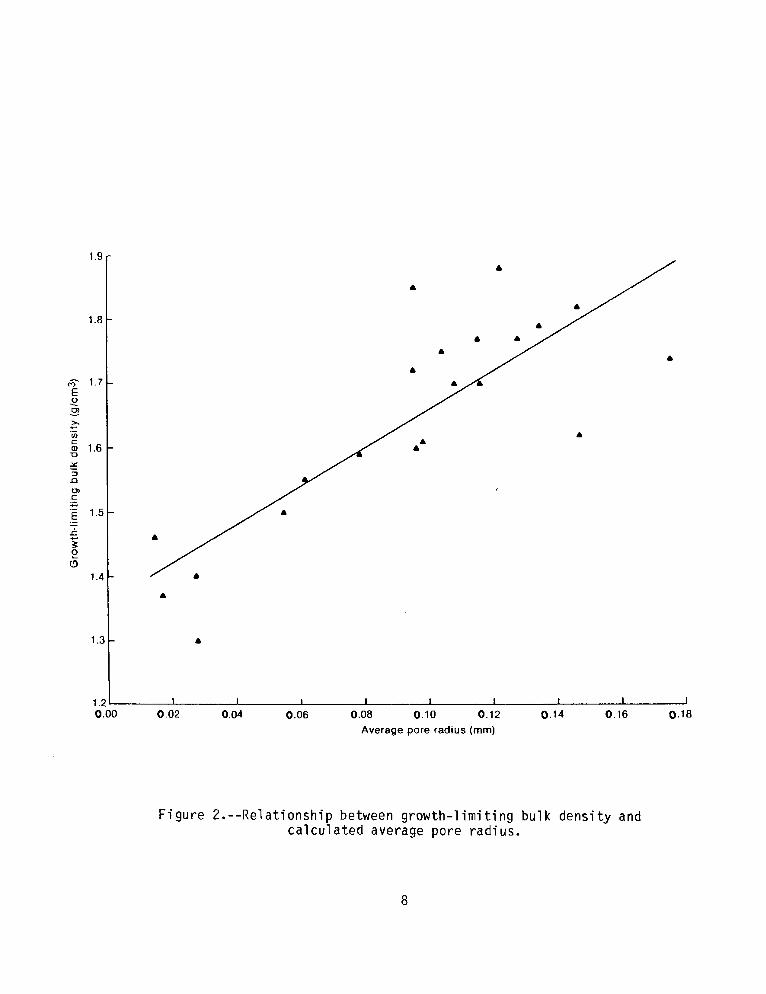
Figure 2.--Relationship between growth-limiting bulk density 8and calculated average pore radius.
Figure 3.--Growth-limiting bulk density textural triangle. 9
GROWTH-LIMITING SOIL BULK DENSITIESAS INFLUENCED BY SOIL TEXTURE
1.0 Introduction
An important forest management concern is the possibility of reduced
vegetative productivity due to soil compaction. Various research studies
have shown the detrimental effects of soil compaction on the establishment
and growth of forest and range plants (Lull 1959, Foil and Ralston 1967,
Hatchell et al. 1970, Wilshire et al. 1978, Froehlich 1979, Greacen and
Sands 1980, Wert and Thomas 1981). The effects of soil compaction on
plant growth are a complex interaction between many soil and plant
properties, but for many situations there appears to be an upper limit or
threshold soil bulk density value where resistance to root penetration is
so high that plant root growth is essentially stopped (O'Connell 1975).
Restricted root penetration and elongation reduces the volume of soil
that can be exploited by a plant for essential nutrients and water, which
can cause a reduction in total growth. This threshold bulk density will
be referred to as "growth-limiting" bulk density (GLBD).
GLBD is influenced by many soil properties but for most cases, soil
texture appears to be the most important property determining t h e GLBD of
a soil (Veihmeyer and Hendrickson 1948, Schuurman 1965, O'Connell 1975).
The main reason why soil texture strongly influences GLBD is its effect
on soil pore size and mechanical resistance.
The purpose of this paper is to (1) discuss the relationship between
soil texture and GLBD, (2) provide forest soil scientists with a tool for
estimating the GLBD of many different kinds of soils, and (3) illustrate
how GLBD may be used to guide management practices so that vegetative
growth is not significantly reduced by soil compaction.

2.0 Relationship of Soil Texture to Growth-Limiting Bulk Density
Roots grow in soil through large soil pores and by moving soil
particles aside when the roots penetrate pores that are smaller than the
root tips. When a soil is compacted to its GLBD value, most soil pore
diameters are substantially smaller than the diameters of growing roots.
In this situation, root growth is essentially stopped because the roots
cannot exert enough pressure to overcome the mechanical resistance and
move soil particles (Wiersum 1957, Aubertin and Kardos 1965).
A soil's GLBD is strongly influenced by soil texture because this
property has a major effect on the average pore size and mechanical
resistance of a compacted soil. A soil with a large amount of fine
particles (silt and clay) will have smaller pore diameters and a higher
penetration resistance at a lower bulk density than a soil with a large
amount of coarse particles. Zisa et al. (1980) reported a silt loam soil
had 19 percent macropore space and a measured penetration resistance of
2.5 bars at a bulk density of 1.4 g/cm3. A coarser sandy loam had 28.9
percent macropore space and a penetration resistance of 1.2 bars at the
same bulk density. Because of this relationship, coarse-textured soils
will usually have higher GLBD than fine-textured soils. For example,
Veihmeyer and Hendrickson (1948) reported that sunflower root growth was
stopped at a GLBD of 1.75 g/cm3 for sandy soils and 1.46 to 1.63
g/cm3 for clayey soils. Schuurman (1965) and O'Connell (1975) reported
similar relationships between soil texture and GLBD.
2

3.0 Analysis Methods and Results
An extensive literature search was done to rev
between plant root growth and soil compaction over
iew the relat ionship
a wide range of soil
textures. This literature emphasized that there are primarily two
general soil parameters-- soil strength and soil bulk density--used to
evaluate the effects of soil compaction on plant root growth.
Soil strength is defined as "the ability or capacity of a particular
soil in a particular condition to resist or endure an applied force"
(Gill and Vanden Berg 1967) and is usually measured by a penetrometer.
Measurement of soil strength is an attempt to determine the actual soil
physical forces the roots are encountering. However, soil strength
measurements are highly dependent on both soil moisture and bulk density
at the time of measurement (O'Connell 1975, Mulqueen et al. 1977). The
type of penetrometer and method of measuring soil strength as a function
of penetrometer resistance can also produce highly variable results
(Greacen and Sands 1980).
Soil bulk density can be measured by various methods, such as clod,
sand cone, core, or auger-hole (O'Connell 1975). Although each method
has its disadvantages, observed soil bulk density values appear to be
less dependent on soil moisture and measuring techniques than are soil
strength values. For these reasons, soil bulk density was selected as
the appropriate parameter for evaluating the relationship of soil texture
to compaction and plant root growth.
In order to establish a relationship between soil texture and GLBD,
published research data were used that included soil mechanical analysis
(percent sand, silt, and clay) and GLBD measurements of either a single
point or a narrow range for each soil. This information is listed in
Table 1 and plotted on a textural triangle in Figure 1. Much of the
3
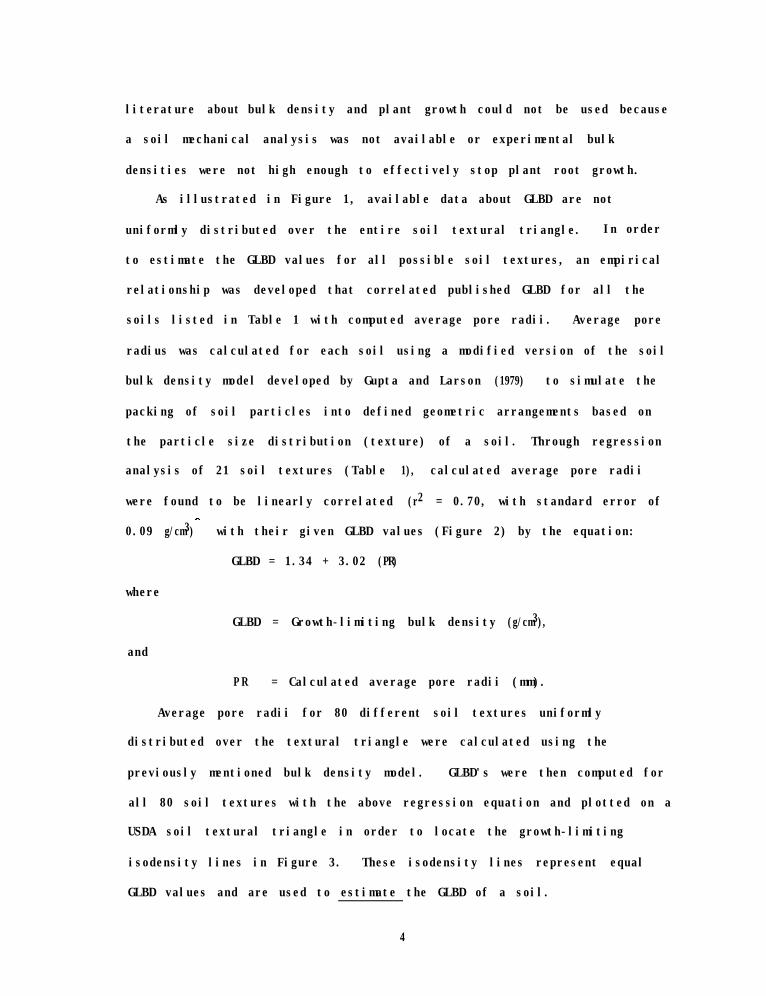
literature about bulk density and plant growth could not be used because
a soil mechanical analysis was not available or experimental bulk
densities were not high enough to effectively stop plant root growth.
As illustrated in Figure 1, available data about GLBD are not
uniformly distributed over the entire soil textural triangle. In order
to estimate the GLBD values for all possible soil textures, an empirical
relationship was developed that correlated published GLBD for all the
soils listed in Table 1 with computed average pore radii. Average pore
radius was calculated for each soil using a modified version of the soil
bulk density model developed by Gupta and Larson (1979) to simulate the
packing of soil particles into defined geometric arrangements based on
the particle size distribution (texture) of a soil. Through regression
analysis of 21 soil textures (Table 1), calculated average pore radii
were found to be linearly correlated (r2 = 0.70, with standard error of
0.09 g/cm3) with their given GLBD values (Figure 2) by the equation:
GLBD = 1.34 + 3.02 (PR)
where
and
GLBD = Growth-limiting bulk density (g/cm3),
P R = Calculated average pore radii (mm).
Average pore radii for 80 different soil textures uniformly
distributed over the textural triangle were calculated using the
previously mentioned bulk density model. GLBD'sGLBD's were then computed for
all 80 soil textures with the above regression equation and plotted on a
USDA soil textural triangle in order to locate the growth-limiting
isodensity lines in Figure 3. These isodensity lines represent equal
GLBD values and are used to estimate the GLBD of a soil.
4
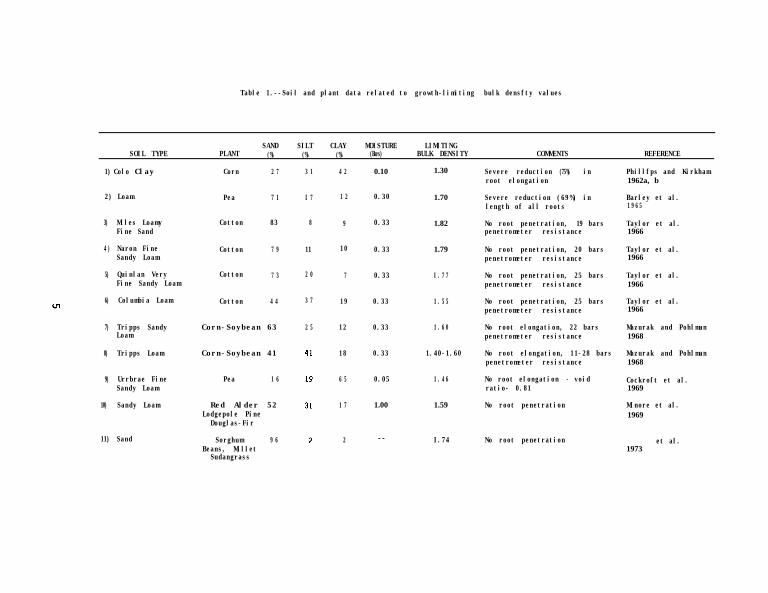
Table 1.--Soil and plant data related to growth-limiting bulk densfty values
SOIL TYPESAND SILT CLAY MOISTURE LIMITING
PLANT (%) (%) (%) (Bars) BULK DENSITY COMMENTS REFERENCE
1) Colo Clay
2) Loam
3) Miles LoamyFine Sand
4 ) Naron FineSandy Loam
5) Quinlan VeryFine Sandy Loam
6) Columbia Loam
7) Tripps SandyLoam
Corn 2 7
Pea 7 1
Cotton 83
Cotton 7 9
Cotton 7 3
Cotton 4 4
Corn-Soybean 63
8) Tripps Loam Corn-Soybean 41
9) Urrbrae FineSandy Loam
10) Sandy Loam
11) Sand
Pea 1 6
Red Alder 52Lodgepole Pine
Douglas-Fir
Sorghum 9 6Beans, Millet
Sudangrass
3 1 4 2
I 7 1 2
8 9
11 1 0
2 0 7
3 7 1 9
2 5 1 2
1 8
6 5
1 7
2
0.10
0.30
0.33
0.33
0.33
0.33
0.33
0.33
0.05
1.00
- -
1.30
1.70
1.82
1.79
I . 7 7
1 . 5 5
1 . 6 0
1.40-1.60
1 . 4 6
1.59
I.74
Severe reductionroot elongation
(75%) in
Severe reduction (69%) in Barley et al.length of all roots 1 9 6 5
No root penetration, 19penetrometer resistance
No root penetration, 20penetrometer resistance
No root penetration, 25penetrometer resistance
No root penetration, 25penetrometer resistance
bars
bars
bars
bars
No root elongation, 22 bars Mazurak and Pohlmanpenetrometer resistance 1968
No root elongation, 11-28 bars Mazurak and Pohlmanpenetrometer resistance 1968
No root elongation - void Cockroft et al.ratio- 0.81 1969
No root penetration
No root penetration
Phillfps and Kirkham1962a, b
Taylor et al.1966
Taylor et al.1966
Taylor et al.1966
Taylor et al.1966
Minore et al.1969
Worker et al.1973

Table l.--Soil and plant data related to growth-limiting bulk density values 1Continuedl
SOIL TYPE
12) Sverdrup SandyLoam
13) Nutley Clay
SAND SILT CLAY MOISTURE LIMITINGPLANT (%) (%) (5) (Bars) BULK DENSITY COMMENTS REFERENCE
Pea 6 3 2 7 1 0 1 .00 1 .61 Severe reduction (79%) in Voorhees et al.primary root elongation 1975
P e a 6 3 9 5 5 1 .00 1 .37 Severe reduction (70%) in Voorhees et al.primary root elongation 1975
1 4 1 - - Apple 6 4 + 5 25 + 3 11 + 3 - - 1 .75 Restricted root growth, Webster 1978- - -porosity - 34%
15) - - Apple 6 1 + 8 29 + 5 10 + 5 - - 1 .72- - Restricted root growth, Webster 1978-porosity - 35%
16) - - Apple 5 8 + 9 31 + 7 11 + 4 - - 1.85 Restricted root growth, Webster I978- - -porosity - 30%
17) - - Apple 6 9 + 5 18 + 4 13 + 3 - - 1 .77 Webster 1978- Restricted root growth,- -porosity - 33%
18) - - Apple 8 6 + 4 9 + 4 5+3 - - 1.62 Webster 1978_ - Restricted root growth,-porosity - 39%
19) - - Apple 7 5 + 1 1 19 + 8 6+3 - - 1.88 Restricted root growth, Webster 1978- -porosity - 29%
20) Nixon Silt Pitch Pine 2 2 6 4 1 4 0 .33 1 .40 Severe reduction (75%) i n Zisa et a l .Loam Austrian Pine root penetration 1980
Norway Spruce
21) Lakewood Sandy Pitch Pine 6 6 2 6 8 0 .33 1.60-l .80 Severe reduction (70%) i n Zisa et a l .Loam Austrian Pine root penetration 1980
Norway Spruce
-- Not available.
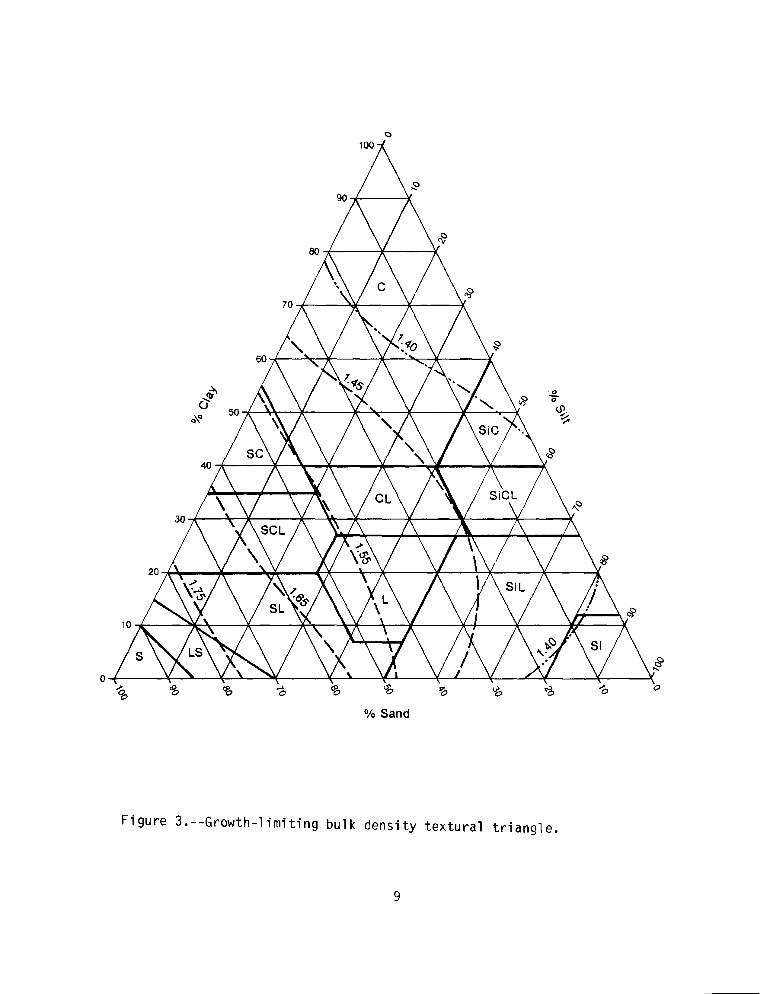
4.0 Estimation of Growth-Limiting Bulk Densities
The GLBD for a given soil can be estimated by locating its percent
sand, silt, and clay on Figure 3 and determining the appropriate GLBD
value associated with that textural point. For example, a clay loam soil
has 30 percent sand, 34 percent silt, and 36 percent clay. Figure 3
shows this textural point located between the 1.45 g/cm3 and 1.55
g/cm3 isodensity lines. Interpolation between the two lines indicates
this soil can be assumed to have a GLBD of about 1.50 g/cm3.
5.0 Limitations and Assumptions
Careful consideration and professional judgment should be exercised
in using the GLBD textural triangle. Limitations and assumptions used in
developing the GLBD textural triangle are:
1. The GLBD values shown in Figure 3 are applicable only on soils
with less than 3 percent organic matter, less than 10 percent
coarse fragments, and particle densities near 2.65 g/cm3. The
reason for these limitations is that most of the data used to
develop the GLBD textural triangle were obtained from
agricultural soils which had particle densities of about
2.65 g/g/cm3 and were low in organic matter and coarse
fragments. At this time, there is not enough research data to
establish absolute GLBD values for soils outside the specified
limits.
2. Individual forest species may have different responses to high
soil bulk densities and may have higher or lower growth-limiting
values than those shown in Figure 3 (Forristall and Gessel 1955,
Minore et al. 1969). Most of the data used in this report is
1 0
from short-term growth records of agricultural plants with very
little quantitative research about long-term effects of bulk
density on the growth of forest and range plants.
3. GLBD relationships are assumed to be based on a soil water
content at or near field capacity (0.33 bar). Soil water
conditions reported for soils used to develop the
growth-limiting textural triangle ranged from 0.05 to 1.00 bar.
If the soil water content is near saturation or is approaching
permanent wilting, soil aeration or water stress may be more
limiting to plant growth than a high soil bulk density (Eavis
1972).
4. The isodensity values in Figure 3 do not account for effects of
soil structure when root growth occurs along ped faces. Strong
structure could result in individual structural units having
internal densities near the growth-limiting bulk density but
with enough structural openings to allow some root growth along
ped faces. This is one reason why maintaining good soil
structure is an important consideration for soil management. If
soil structure is altered or destroyed by soil compaction the
result could be a large reduction in plant growth. Most of the
soils data used for this paper were from structureless soils.
5. Most of the soil bulk density data used for growth-limiting bulk
density values came from core bulk density measurements. Soil
bulk density values determined by other methods may result in
values substantially different from core bulk density
measurements.
11
6.0 Management Implications of the Growth-Limiting Bulk Density Textural
Triangle
The GLBD textural triangle shows that soil texture is an important
property to consider when evaluating the effects that various land
management practices have on compaction of specific sites. For example,
timber harvest and site preparation practices can cause varying amounts
of soil compaction. If the bulk density in the seedling root zone of a
clay-textured soil is near 1.40 g/cm3, this site would be very close to
its growth-limiting threshold value. Under this condition, severe
reduction of root growth might occur. Some type of compaction-
mitigating practice may be needed to promote seedling establishment and
improve growth. However, if this same bulk density were measured for a
sandy-textured site, most likely there would be little if any adverse
compaction effects on root growth.
A soil at its GLBD value is highly compacted, and this condition
should be avoided if at all possible. However, in terms of evaluating,
protecting, and improving the soil productivity of a site, it is probably
more important to know the relationship between plant growth and bulk
densities at less than the growth-limiting value. For example, in many
soils there appears to be an "optimal" bulk density or narrow range of
bulk densities at which plant growth is maximized (Rosenburg 1964,
Greacen and Sands 1980). Unfortunately, because of lack of data for a
wide range of soil textures and forest plants, no generalized
quantitative relationships can be established. Some research studies
(Phillips and Kirkham 1962b,1962b, Taylor et al. 1966, Foil and Ralston 1967,
Mazurak and Pohlman 1968, Cockroft et al. 1969, Zisa et al. 1980, Heilman
1 2
1981) have shown that small increases in bulk density can cause large
reductions in root growth at bulk densities substantially lower than the
growth-limiting values. This emphasizes that bulk densities approaching
growth-limiting values should also be avoided to minimize the potential
reduction in root growth and impairment of vegetative productivity.
7.0 Summarv and Conclusion
The GLBD textural triangle illustrates the relationship between
growth-limiting bulk density and soil texture. This textural triangle
may be used by forest soil scientists as an aid in evaluating the impact
of soil compaction on plant growth through the effects on root growth.
The limitations and assumptions used to develop the growth-limiting bulk
density textural triangle must be carefully considered when using this
tool.
A soil at or above its GLBD value is at a highly compacted condition
where root growth is essentially stopped. This condition should be
avoided if at all possible. In general, a soil approaching its GLBD
value may be also considered at a physical state where vegetative
productivity could be seriously impaired. Because of this possibility,
it would be preferable from a soil management standpoint to keep a soil's
bulk density well below its GLBD value. Therefore, any planned practices
that may increase a soil's bulk density to a value near its GLBD should
be fully evaluated.
Ideally, in terms of protecting and improving the soil productivity
of a site, it would be desirable to know more about the re-lationships
between soil compaction and total plant growth at bulk densities less
1 3
than the GLBD values. However, a lack of data for different forest soils
and plants precludes establishing any general quantitative relationships.
This lack of data points out a need for more research on the relationship
between soil compaction and forest plant growth. Forest management could
benefit from quantitative investigations of bulk density effects on the
growth of important forest tree species on forest soils with large amounts
of coarse fragments, organic matter, or volcanic ash.
1 4

Literature Cited
Aubertin, G. M., and L. T. Kardos. 1965. Root Growth Through PorousMedia Under Controlled Conditions. I. Effect of Pore Size andRigidity. Soil Science Society of America Proceedings 29:290-293.
Barley, K. P., D. A. Farrell, and E. L. Greacen. 1965. The Influence ofSoil Strength on Penetration of a Loam by Plant Roots. AustralianJournal of Soil Research 3:69-79.
Cockroft, B., K. P. Barley, and E. L. Greacen. 1969. The Penetration ofClays by Fine Probes and Root Tips. Australian Journal of SoilResearch 7:333-348.
Eavis, B. W. 1972. Soil Physical Conditions Affecting Seedling RootGrowth. I. Mechanical Impedance, Aeration, and Moisture Availabilityas Influenced by Bulk Density and Moisture Levels in a Sandy LoamSoil. Plant and Soil 36:613-622.
Foil, R. R., and C. W. Ralston. 1967. The Establishment and Growth ofLoblolly Pine Seedlings on Compacted Soils. Soil Science Society ofAmerica Proceedings 31:565-568.
Forristall, F. F., and S. P. Gessel. 1955. Soil Properties Related toForest Cover Type and Productivity on the Lee Forest, SnohomishCounty, Washington.19:384-389.
Soil Science Society of America Proceedings
Froehlich, H. A. 1979. Soil Compaction from Logging Equipment on Growthof Young Ponderosa Pine. Journal of Soil and Water Conservation34:276-278.
Gill, W. R., and G. E. Vanden Berg. 1967. Soil Dynamics in Tillage andTraction. U.S. Department of Agriculture. Handbook No. 316, p. 22.
Greacen, E. L., and R. Sands. 1980. Compaction of Forest Soils - AReview. Australian Journal of Soil Research 18:163-189.
Gupta, S. C., and W. E. Larson. 1979. A Model for Predicting PackingDensity of Soils Using Particle Size Distribution. Soil ScienceSociety of America Journal 43:758-764.
Hatchell, G. E.,in Logging:
C. W. Ralston, and R. R. Foil. 1970. Soil DisturbancesEffects on Soil Characteristics and Growth of Loblolly
Pine in the Atlantic Coastal Plain. Journal of Forestry 68:772-775.
Heilman, P. 1981. Root Penetration of Douglas-Fir Seedlings intoCompacted Soil. Forest Science 27:660-666.
Lull, H. W. 1959. Soil Compaction on Forest and Range Lands.U.S. Department of Agriculture. Miscellaneous Publication No. 768.
15
Mazurak, A. P., and K. Pohlman. 1968. Growth of Corn and SoybeanSeedlings as Related to Soil Compaction and Matric Suction. NinthInternational Congress of Soil Science Transactions 1:813-820.
Minore, D. C., E. Smith, and R. F. Woollard. 1969. Effects of High SoilDensity on Seedling Root Growth of Seven Northwestern Tree Species.USDA Forest Service Research Note PNW-112. Pacific Northwest Forestand Range Experiment Station, Portland, OR.
Mulqueen, J., J. V. Stafford, and D. W. Tanner. 1977. Evaluation ofPenetrometers for Measuring Soil Strength. Journal of Terramechanics14:137-151.
O'Connell, D. J. 1975. The Measurement of Apparent Specific Gravity ofSoils and Its Relationship to Mechanical Composition and Plant RootGrowth. In Soil Physical Conditions and Crop Production, p. 298-313.Ministry of Agriculture, Fisheries, and Food. TechnicalBulletin 29. H.M.S.O., London.
Phillips, R. E., and D. Kirkham. 1962a. Soil Compaction in the Fieldand Corn Growth. Agronomy Journal 54:29-34.
Phillips, R. E., and D. Kirkham. 1962b. Mechanical Impedance and CornSeedling Root Growth. Soil Science Society of America Proceedings26: 319-322.
Rosenburg, N. J. 1964. Response of Plants to the Physical Effects ofSoil Compaction. Advances in Agronomy 16:181-196.
Schuurman, J. J. 1965. Influence of Soil Density on Root Developmentand Growth of Oats. Plant and Soil 22:352-374.
Taylor, H. M., G. M. Roberson, and J. J. Parker, Jr. 1966. SoilStrength-Root Penetration Relationships for Medium- toCoarse-Textured Soil Materials. Soil Science 102:18-22.
Veihmeyer, F. J., and A. H. Hendrickson. 1948. Soil Density and RootPenetration. Soil Science 65:487-493.
Voorhees, W. B., D. A. Farrell, and W. E. Larson. 1975. Soil Strengthand Aeration Effects on Root Elongation. Soil Science Society ofAmerica Proceedings 39:948-953.
Webster, D. H. 1978. Soil Conditions Associated with Absence or SparseDevelopment of Apple Roots. Canadian Journal of Plant Science58:961-969.
Wert, S., and B. R. Thomas. 1981. Effects of Skid Roads on Diameter,Height, and Volume Growth in Douglas-Fir. Soil Science Society ofAmerica Journal 45:629-632.
Wiersum, L. K. 1957. The Relationship of the Size and StructuralRigidity of Pores and Their Penetration by Roots. Plant and Soil9:75-85.
1 6
Wilshire, H. G., J. K. Nakata, S. Shipley, and K. Prestegaard. 1978.Impacts of Vehicles on Natural Terrain at Seven Sites inSan Francisco Bay Area. Environmental Geology 2:295-319.
Worker, G. F., Jr., R. S. Ayers, M. A. Karah, and R. E. Thomason. 1973.Effect of Dense Stratified Sandy Soil on Crop Roots. Journal ofAgricultural Science 81:513-516.
Zisa, R. P., H. G. Halverson, and B. B. Stout. 1980. Establishment andEarly Growth of Conifers on Compact Soils in Urban Areas. USDAForest Service Research Paper NE-451. Northeastern Forest ExperimentStation, Broomall, PA.
17
Top Related