


Languages
Pages
Legal


Growth and Factors Affecting the Uses of e-banking Services in India Dr. Jivan Biradar
Assistant Professor (Economics)
School of Commerce, Dr. Vishwanath Karad MIT World Peace University
Abstract The banking sectors and bankers have started using advanced technology to deliver
banking services. In the e-banking, banks are using modern technology for banking activities and
operations to provide good quality of services to their customers. This study is based on
primary as well as secondary data. A five-point likert scale was used as a quantitative
measure to understand consumer’s perception and factor affecting uses of e-banking
services. The study found that, the uses of e-banking services like mobile banking, credit card
facility and internet banking services are becoming popular in recent period and the comfortable
level is higher with the ATM and debit card facility whereas customers are not comfortable
while using internet banking services. The major reasons for less use of e-banking services are
connectivity problem, less number of ATMs and ignorance of staff members. So, there is a need
to increase infrastructure facilities and financial institutions should take initiatives for staff
training and awareness related activities to increase uses of e-banking services.
Keywords: e-banking services, mobile banking, Credit Cards, Debit Cards
I. Introduction:
Over the period, the banks have changed their way of doing business as per the necessity
of the society. The bank has started in the temple and over the period it is changing way of doing
business, but the central idea remained the same. It’s intermediary between saving and
investment section in the society.
In today’s digital era, across the globe, modern technologies become important tools of
development which decrease human efforts and increase the welfare of the society. The banking
sectors and bankers have started using advanced technology to deliver banking services
(Mohammad Abdul Hannan Mia and et al 2007). In the e-banking, banks are using modern
technology for banking activities and operations to provide good quality of services to their
customers. The banking services are changing drastically due to e-banking services (A. H. M. Saidul
Hasan et al 2010, Shilpan Dineshkumar Vyas 2012). It also helps banks to increase the market
Journal of University of Shanghai for Science and Technology ISSN: 1007-6735
Volume 23, Issue 10, October - 2021 Page-61

share (Ali Nazaritehrani et al 2020) and contribute positively to banks’ return on equity with a
time lag (Md. Nur Alam SIDDIK et al 2016).
In view of the above context, the current study aims to understand the growth of e-
banking services in India along with understanding the factor affecting use of e-banking.
The specific research questions of the study are:
1. Which are the e-banking services growing rapidly in India among others? and,
2. Identifying the factors affecting use of e-banking services.
The remainder of the article is as follows: The review of literature is presented in section II
while research methodology is depicted in section III. The results are presented and
discussed in Section IV and finally, section V summaries the finding of the study.
II. Review of Literature:
a) Perceptions about e-banking:
Divya Singhal and V. Padhmanabhan, (2008) studied customer perception towards
internet banking and discussed various factors determining the internet banking in India. Himani
Sharma (2011) pointed out that how various banking sector across the World are using e-
banking. This study is empirical study conducted for investigating bankers’ prospective or views
on e-banking and they found that bankers’ are convinced that e-banking helps to improve the
relationship between banker and costumer. Bruce Mwiya et al (2017) examined the influence of
e-banking technology’s perceived usefulness, perceived ease of use and trust (safety and
credibility) on e-banking adoption. Mahesh Kumar and Sanjay Gupta (2020) investigated e-
banking users’ perception with regard to online risk for public, private and foreign banks in
India. The risk perception was assessed on three major risk parameters, i.e. security aspect,
privacy aspect, and trust; using a multiple-criteria decision-making tool, called the Analytical
Hierarchy Process (AHP). The general user’s perception of three risk parameters taken together,
public sector banks are perceived to be the most secure, followed by private and foreign banks.
Jamil Hammoud et al (2018) studied about e-banking service quality and customer satisfaction to
determine which dimension can potentially have the strongest influence on customer satisfaction.
The main objective of this study is to identify factors that affect customers’ usage of electronic
banking services Beza Muche Teka (2020).
b) Barriers in use of e-banking:
Journal of University of Shanghai for Science and Technology ISSN: 1007-6735
Volume 23, Issue 10, October - 2021 Page-62

Nyangosi, JS Arora (2011) pointed out that e-banking perceived as important change in
way of doing business in banking sector in India and Kenya. Further the analysis revealed that
high adoption cost, privacy issues, fear of increase in e-crimes and inadequate infrastructure in
banks were the most affecting factors for the growth and adoption of e-banking. RBI (2001)
conducted a research on the opportunities and risk associated in E-banking in India. It has found
that there are lots of opportunities in the E-banking in India; however the risk associated is also
very high due to the illiteracy and lack of Knowledge of E-banking. Richard Singh P. (2013)
explained various barriers in the use of E-banking in India.
c) Determinants of e-banking:
Pooja Malhotra, Balwinder Singh (2010) have used multiple regression technique to
explore the extent of determinant of internet banking services. Kumar Sharma, S. and
Madhumohan Govindaluri, S. (2014), explored the factors determine uses of internet banking in
especially urban India. They found that ease of use, usefulness, awareness; social influence and
quality of internet connection are basic determinants for use of internet banking. The statistical
techniques revealed that several major factors, including perceived ease of use, perceived
usefulness, security and reasonable price, stand out as the barriers to intention to use e-banking
services in Jordan Abdel Latef M. Anouze et al (2019).
d) Types of bank and e-banking:
Dhandayuthap S.P., (2012) revealed that dissatisfied level is highest in case of ATMs
services, internet banking and mobile banking in the public sector banks as compared to private
sector. Majid Karimzadeh, (2014) found that in India, new private sector banks are pioneer to
adopt and provide world class e-banking services to their customers but public sector and old
private banks are not well equipped by these facilities. Mishra, R. K.; Kiranmai, J. (2009) studied
overview of e-banking, its product, services provided by various bans etc. and finally they done
comparison of e-banking among various banks in India. Priya Vasagadekar (2012) conducted
research on the psychology of an Indian customer towards public and co-operative banks e-
banking in Pune region.
III. Research Methodology:
This study is based on primary as well as secondary data. The secondary data were
collected from economic survey of India, handbook of statistics on Indian economy, report
on trend and progress of banking in India, website of RBI for payment system and e-
Journal of University of Shanghai for Science and Technology ISSN: 1007-6735
Volume 23, Issue 10, October - 2021 Page-63

banking services. At initial level of the present study, in depth discussion and interaction
was conducted with key persons in banks and a survey was designed and conducted to find
out the factor affecting uses of e-banking in Pune based different public, private, urban
cooperative as well as foreign banks. A specifically designed questionnaire was used as a
tool and the survey covered a sample of 80 respondents for the purpose of analysis. These
respondents were the customers of various banks. A five-point likert scale was used as a
quantitative measure to understand consumer’s perception and factor affecting uses of e-
banking services. The location of mean is used in the range of five-point likert scale data to
understand factor affecting the uses of e-banking services by the respondents.
We have also used Statistical Package for Social Sciences (SPSS) version 20 as the
statistical analysis tool, while descriptive statistics were computed and used in the
interpretation of findings. The ANOVA is used to test whether there is significant difference
between mean of rating for quality of various e-banking services by all types of banks.
Normally, ANOVA is used to test the formulated hypothesis based on the analysis of
significant difference between the means of the two samples. Thus, the null hypothesis is
formulated as there is no significant difference between the mean of rating for quality of various
e-banking services by all types of banks and the alternative hypothesis is there is significant
difference between mean of rating for quality of various e-banking services by all types of banks.
In this study the hypotheses are tested under 5% level of significance.
The Relative Importance Index (RII) is used in this study for understanding and ranking
the various problems faced by respondents while using e-banking services and suggestions to
improvement in e-banking services by various respondents. The following formula is used to
determine the relative importance index:
∑w 5n5+4n4+3n3+2n2+1n1
The Relative Importance Index (RII) = ---------------- = -----------------------------------
AN 5N
Where w is the weighting given to each factor by the respondent, ranging from 1 to 5.
A is the highest weight (i.e. 5 in the study) and N is the total number of respondents. The
relative importance index ranges from 0 to 1.
Journal of University of Shanghai for Science and Technology ISSN: 1007-6735
Volume 23, Issue 10, October - 2021 Page-64

The data is presented in the form of tables and graphs. The growth of e-banking has
been described in the initial part with latest data and in the second part; factor affecting use
of e-banking has been discussed with the help of primary data.
IV. Results and Discussion:
a. Growth of e-banking in India:
The e-banking is nothing but availing banking services through electronic mode. In
recent years, mode of e-banking services increased rapidly. The number of ATMs increased from
around 21 lakh in 2014-15 to 26 lakh in 2018-19 with 5.72 per cent of compound annual growth
rate (CAGR) (Graph 1).
Source: RBI, Monthly Bulletin- December-2018, Reserve Bank of India and Report on Trend
and Progress of Banking in India, 2018-19.
But the point of sale (POS) increased with CAGR of the 33.16 per cent from 2014-15 to
2018-19. The growth in POS is more in the last three year period (Graph 2). The POS mode is
more convenient than any other mode of e-banking product.
0
500000
1000000
1500000
2000000
2500000
3000000
2014-15 2015-16 2016-17 2017-18 2018-19
Nu
mb
er
Year
Graph 1: Number of ATMs in India
13143712 14803585
20281149
34915879
41320135
0
10000000
20000000
30000000
40000000
50000000
2014-15 2015-16 2016-17 2017-18 2018-19
Nu
mb
er
Graph 2: Number of Point of Sale(POS)
Journal of University of Shanghai for Science and Technology ISSN: 1007-6735
Volume 23, Issue 10, October - 2021 Page-65

Source: RBI, Monthly Bulletin- December-2018, Reserve Bank of India and Report on Trend
and Progress of Banking in India, 2018-19.
The mobile banking is increasing rapidly in India in recent years. The decrease in prices
of mobile phone and evolution in telecommunication industry given more boost to use of mobile
phone in India and banking industry tapped this opportunity to increase the banking business.
The mobile banking was negligible till 2013-14, but after that, it’s increased with the CAGR of
119.13 per cent in terms of volume and 187.55 per cent in terms of value (Graph 3a & 3b).
Source: RBI, Monthly Bulletin- December-2018, Reserve Bank of India and Report on Trend
and Progress of Banking in India, 2018-19.
Source: RBI, Monthly Bulletin- December-2018, Reserve Bank of India and Report on Trend
and Progress of Banking in India, 2018-19.
The analysis of both credit and debit cards shows that, in last three year, the growth rate
of credit cards are more than the debit cards. The volume of credit cards increased with CAGR of
0.0010000.0020000.0030000.0040000.0050000.0060000.0070000.00
Volu
me
(Lak
h)
Graph 3a: Growth of Mobile Banking in India-Volume (Lakh)
0
500000
1000000
1500000
2000000
2500000
3000000
3500000
Valu
e (R
up
ees
Cro
re)
Graph 4b: Growth of Mobile Banking in India-Value (Rupees
Crore)
Journal of University of Shanghai for Science and Technology ISSN: 1007-6735
Volume 23, Issue 10, October - 2021 Page-66

27.58 per cent, whereas debit cards increased by 14.87 per cent and the value also shows same
trends (table 1).
Table 1: Growth Rate of Numbers of Cards in India (%)
Year
Credit Cards Debit Cards
Vol. Value Vol. Value
2012-13 23.92 27.13 6.76 19.92
2013-14 28.26 25.11 16.14 18.23
2014-15 20.97 23.51 16.36 14.03
2015-16 27.81 26.75 18.48 14.76
2016-17 38.13 35.91 18.55 -0.22
2017-18 29.21 39.67 8.97 24.86
2018-19 25.44 31.41 19.49 16.24
CAGR 27.58% 29.81% 14.87% 15.16%
Source: RBI, Monthly Bulletin- December-2018, Reserve Bank of India and Report on Trend
and Progress of Banking in India, 2018-19.
The usage of credit and debit cards shows that the use of credit cards are more at POS and
debit cards at ATMs in India. But, in recent years, use of debit cards at POS are increasing and at
ATMs are decreasing. This shows that, POS service is becoming more popular in India (table 2).
Table 2: Share of Usage of Credit and Debit Cards in India (%)
Year
Usage credit cards at
ATMs
Usage credit cards at
POS
Usage of debit cards
at ATMs
Usage of debit cards
at POS
% Share
in
Volume
% Share
in Value
% Share
in
Volume
% Share
in Value
% Share
in
Volume
% Share
in Value
% Share
in
Volume
% Share
in Value
2011-12 0.68 1.29 99.32 98.71 93.95 96.32 6.05 3.68
2012-13 0.63 1.16 99.37 98.84 91.92 95.74 8.08 4.26
2013-14 0.58 1.08 99.42 98.92 90.77 95.37 9.23 4.63
2014-15 0.69 1.22 99.31 98.78 89.65 94.83 10.35 5.17
2015-16 0.76 1.25 99.24 98.75 87.31 94.11 12.69 5.89
2016-17 0.58 0.86 99.42 99.14 78.11 87.74 21.89 12.26
2017-18 0.55 0.79 99.45 99.21 72.01 86.3 27.99 13.7
2018-19 0.55 0.75 99.45 99.25 69.07 84.8 30.93 15.2
Total 0.61 0.94 99.39 99.06 81.21 90.68 18.79 9.32
CAGR 23.82 20.07% 27.60% 29.91% 9.93% 13.09% 45.00% 41.05%
Source: RBI, Monthly Bulletin- December-2018, Reserve Bank of India and Report on Trend
and Progress of Banking in India, 2018-19.
As technology is changing so rapidly that some mode of banking services are also
changing. If we look at the growth rate of real time gross settlement (RTGC) and electronic
Journal of University of Shanghai for Science and Technology ISSN: 1007-6735
Volume 23, Issue 10, October - 2021 Page-67

clearing services (ECS) then it is confirmed that, now a days, the bank customer are using mobile
banking and POS modes of payment than these. The growth rate of both payment mode is
declined (graph 5 & table 3).
Source: RBI, Monthly Bulletin- December-2018, Reserve Bank of India and Report
on Trend and Progress of Banking in India, 2018-19.
Table 3: Annual Growth Rate of Electronic Clearing Services (ECS) (%)
Year ECS /NECS (Credit) ECS /NECS (Debit)
No. Amt No. Amt
2004-05 97% 97% 94% 30%
2005-06 10% 60% 135% 345%
2006-07 56% 158% 109% 96%
2007-08 14% 839% 69% 92%
2008-09 13% -88% 26% 37%
2009-10 11% 21% -7% 4%
2010-11 20% 54% 5% 6%
2011-12 4% 1% 5% 13%
2012-13 1% -4% 7% 30%
2013-14 25% 41% 9% 17%
2014-15 -24% -19% 17% 37%
2015-16 -66% -48% -1% -5%
2016-17 -74% -86% -96% -98%
2017-18 -39% -18% -82% -75%
-50%
0%
50%
100%
150%
200%
250%
300%
350%
%
Graph 5: Growth Rate of Real Time Gross Settlement
(RTGS) (%)
Number
Amount
Journal of University of Shanghai for Science and Technology ISSN: 1007-6735
Volume 23, Issue 10, October - 2021 Page-68

2018-19 -13% 12% -40% 29%
CAGR -8.50% 1.73% -13.30% -3.81%
Source: RBI, Monthly Bulletin- December-2018, Reserve Bank of India and
Report on Trend and Progress of Banking in India, 2018-19.
b. Factors Affecting the Uses of e-banking Services:
i. Demographic Profile:
The table 5 shows all the key variables related to demographic profile of the respondent.
Out of the total respondents, 56.25 per cent were male and 43.75 per cent were female. The age-
wise classification shows that, almost 50 per cent customer were from the 20 to 35 years age
group and the lowest percentage were form less than 20 years age group, whereas more than 17
per cent were from the 50 and above years category. This shows that more than 75 per cent
customer are from 20 to 50 years age group category. Around 81 per cent respondents were
married, whereas 18.75 per cent were unmarried.
Table 5: Demographic Profile of Respondent
Characteristics Frequency % to Total
Gender Male 45 56.25
Female 35 43.75
Age (Years) Less Than 20 6 7.50
20 To 35 40 50.00
36 To 50 20 25.00
50 And Above 14 17.50
Marital Status Married 65 81.25
Unmarried 15 18.75
Education Level High School 24 30.00
Bachelor Degree 47 58.75
Master Degree 7 8.75
Doctorate Degree 2 2.50
Occupation Service Class 40 50.00
Business Class 28 25.00
Professional 7 8.75
Other 5 6.25
Annual
Income (in Rs)
Less Than Rs. 2,00,000 14 17.50
Rs. 2,00,000 - Rs. 4,00,000 5 6.25
Journal of University of Shanghai for Science and Technology ISSN: 1007-6735
Volume 23, Issue 10, October - 2021 Page-69

Rs. 4,00,000 - Rs. 6,00,000 36 45.00
More Than Rs. 6,00,000 25 31.25
Source: Primary data
The education qualification of respondents reveals that, more than 58 per cent were
having bachelor degree and 30 per cent were carries high school level education but only 2.50
per cent were with the doctorate. The occupation-wise classification shows, the 50 per cent
respondent were from service class whereas 25 per cent were from business class. Reaming 15
per cent respondents were from professional and others category of occupation. The majority of
respondent were from 4 lakh to more than 6 lakh income category (more than 75 per cent), and
more than 17 per cent respond from less than 2 lakh income group category.
ii. Service quality of e-banking:
H0-There is no significant difference between mean of rating for quality of
various e-banking services by all types of banks.
H1- There is significant difference between mean of rating for quality of various
e-banking services by all types of banks.
To understand the quality of e-banking services, the analysis is carried out to identify the
mean rating variation in different e banking services, mobile banking services, internet banking
services, tele- banking services, bill payment facility, ATM facility, credit card facility, EFT
facility, debit card facility provided by public sector bank, private sector bank, urban co-
operative bank and foreign bank. The null hypothesis is assumed that there is no significant
difference between mean of rating for quality of various e-banking services by all types of banks
and alternative hypothesis is that there is significant difference between mean of rating for
quality of various e-banking services by all types of banks. The mean of rating by respondent
have been compared between more than two groups by using ANOVA followed by post-hoc test
for group-wise comparison. In case of mobile banking services and tele-banking services, the
difference between at least two types of bank is statistically significant with p value less than
0.05. It can be said that there is significant mean change in rating of mobile banking services and
tele-banking services. In case of other e-banking services the mean rating are not statistically
significant having p value more than 0.05 in all cases. It means the e-banking services other than
mobile banking services and tele-banking services are having similar pattern. Therefore,
Journal of University of Shanghai for Science and Technology ISSN: 1007-6735
Volume 23, Issue 10, October - 2021 Page-70

alternative hypothesis is accepted for only mobile banking services and tele-banking services by
all banks (Table 6).
Moreover, the test of homogeneity of variances that is the Levene statistic is used to find
out nature of data. The Levene statistic shows that data of mobile banking services is
Homogenous) and tele-banking services is heterogeneous, so, we have used Least significant
difference (LSD) and Dunnett T3 respectively to see the significant changes between the various
types of banks.
Table 6: One Way ANOVA
Groups Source of
Variation
Sum of
Squares
df Mean
Square
F Sig.
Mobile banking services Between Groups 9.437 3 3.146
2.664 .050* Within Groups 89.750 76 1.181
Total 99.188 79
Internet banking services Between Groups 3.900 3 1.300
1.119 .347 Within Groups 88.300 76 1.162
Total 92.200 79
Tele- banking services Between Groups 9.850 3 3.283
3.480 .020* Within Groups 71.700 76 .943
Total 81.550 79
Bill Payment facility Between Groups 1.738 3 .579
.613 .608 Within Groups 71.750 76 .944
Total 73.488 79
ATM facility Between Groups 1.050 3 .350
.339 .797 Within Groups 78.500 76 1.033
Total 79.550 79
Credit card facility Between Groups 2.738 3 .913
.721 .542 Within Groups 96.150 76 1.265
Total 98.888 79
EFT facility Between Groups 3.938 3 1.313
1.280 .287 Within Groups 77.950 76 1.026
Total 81.888 79
Debit Card facility Between Groups 2.238 3 .746
.903 .444 Within Groups 62.750 76 .826
Total 64.988 79
The mean difference is significant at the .05 level, * denotes the significant value.
The analysis clarifies that there is statistically different pattern for rating of quality of
mobile banking services between public sector and private sector bank as their p value are less
than 0.05. The quality of mobile banking services of urban co-operative bank and foreign bank
are having similar pattern. The quality of mobile banking services by public sector and private
sector banks are in good mode as the mean of rating for these banks are 4.1 and 3.9 respectively
in Likert-scale responses 5 points. That means public and private sector banks are provide good
quality of mobile banks services to the customer. And, there is no statistically different pattern
Journal of University of Shanghai for Science and Technology ISSN: 1007-6735
Volume 23, Issue 10, October - 2021 Page-71

for rating of quality of tele-banking services. That means, all type of banks are providing similar
tele-banking services to the customer.
iii. Duration of Use of E-Banking Services:
Table 7 shows the duration of using e-banking services. More than 37 per cent
respondents are using mobile banking services for more than 3 years while 11 per cent
respondents are using this service for less than 1 year. The tele-banking service is used by 30 per
cent respondent for 2-3 years duration. The internet banking facility was used by 36.25 per cent
respondent for more than 3 years. Around 25 per cent respondents are using this service for 1-2
years. Majority of respondents (46 per cent) are using the credit card facility for less than 1 year.
The use of ATM facility and debit card facility are for more than 3 years by around 62.5 per cent
respondent and more than 7 per cent respondent are using these services for less than 1 year.
Table 7: Likert-scale responses and means of duration of uses of E-banking services
E-banking Services 1 2 3 4 Mean Results
Mobile Banking services 9 17 24 30 2.09 1 to 2 years
Internet Banking services 9 20 22 29 2.08 1 to 2 years
Tele-Banking services 18 19 24 19 2.55 2 to 3 years
Bill Payment facility 15 21 18 26 2.68 2 to 3 years
ATM -Automated Teller Machine
facility 6 9 15
50 3.36
More than 3
years
Credit Card facility 37 14 16 13 2.06 1 to 2 years
EFT-Electronic Fund Transfer facility 13 17 24 26 2.78 2 to 3 years
Debit Card facility 5 7 18 50
3.41 More than 3
years
Source: Primary Data
Note: 1= Less than 1 year, 2= 1 year to 2 years, 3= 2 year to 3 years, 4= More than 3 years.
The four point likert-scale is considered an interval scale. If the mean is from 1 to 1.75, it
means average respondent are using e-banking services for less than 1 year, from 1.75 to 2.50
means for 1-2 years, from 2.50 to 3.25 means for 2-3 years and from 3.25 to 4 means for more
than 3 years. The likert-scale responses and mean analysis shows, ATM and debit card facilities
are used for more than 3 years with mean 3.36 and 3.41 respectively whereas the uses of mobile
banking, credit card facility and internet banking services are for 1-2 years with the mean 2.09,
2.06 and 2.08 respectively. Its shows, the uses of e-banking services like mobile banking, credit
card facility and internet banking services are becoming popular among various respondent in
recent period.
Journal of University of Shanghai for Science and Technology ISSN: 1007-6735
Volume 23, Issue 10, October - 2021 Page-72
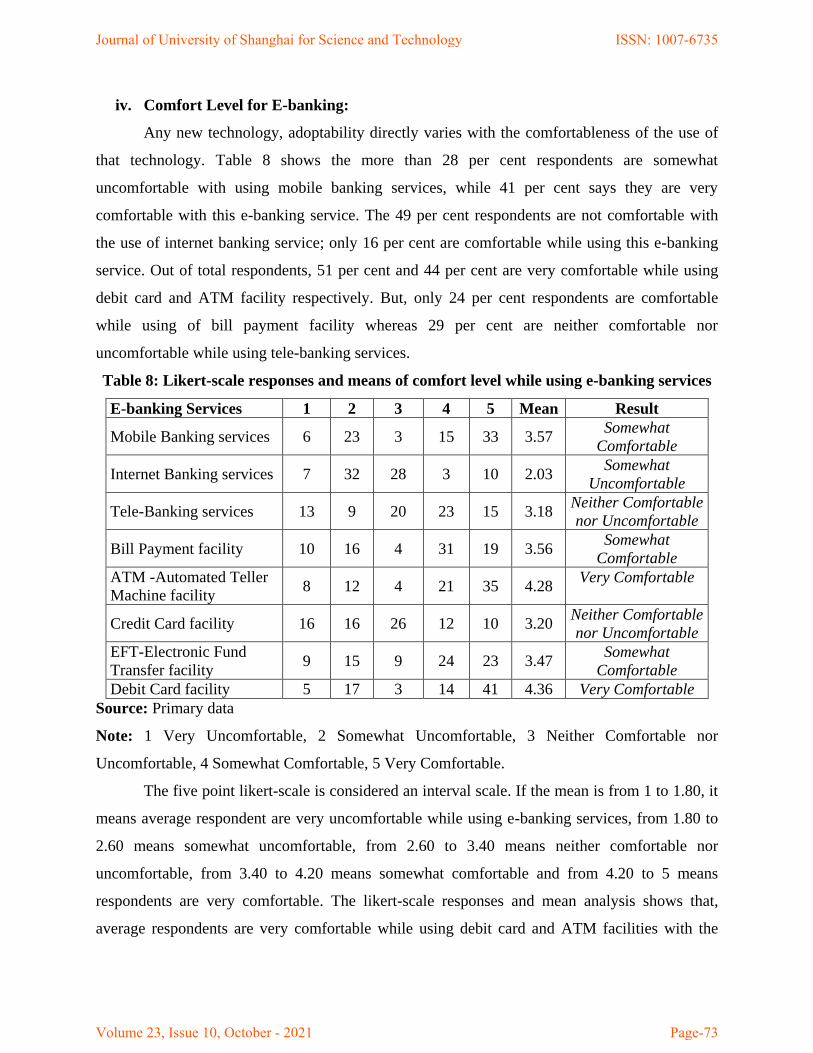
iv. Comfort Level for E-banking:
Any new technology, adoptability directly varies with the comfortableness of the use of
that technology. Table 8 shows the more than 28 per cent respondents are somewhat
uncomfortable with using mobile banking services, while 41 per cent says they are very
comfortable with this e-banking service. The 49 per cent respondents are not comfortable with
the use of internet banking service; only 16 per cent are comfortable while using this e-banking
service. Out of total respondents, 51 per cent and 44 per cent are very comfortable while using
debit card and ATM facility respectively. But, only 24 per cent respondents are comfortable
while using of bill payment facility whereas 29 per cent are neither comfortable nor
uncomfortable while using tele-banking services.
Table 8: Likert-scale responses and means of comfort level while using e-banking services
E-banking Services 1 2 3 4 5 Mean Result
Mobile Banking services 6 23 3 15 33 3.57 Somewhat
Comfortable
Internet Banking services 7 32 28 3 10 2.03 Somewhat
Uncomfortable
Tele-Banking services 13 9 20 23 15 3.18 Neither Comfortable
nor Uncomfortable
Bill Payment facility 10 16 4 31 19 3.56 Somewhat
Comfortable
ATM -Automated Teller
Machine facility 8 12 4 21 35 4.28
Very Comfortable
Credit Card facility 16 16 26 12 10 3.20 Neither Comfortable
nor Uncomfortable
EFT-Electronic Fund
Transfer facility 9 15 9 24 23 3.47
Somewhat
Comfortable
Debit Card facility 5 17 3 14 41 4.36 Very Comfortable
Source: Primary data
Note: 1 Very Uncomfortable, 2 Somewhat Uncomfortable, 3 Neither Comfortable nor
Uncomfortable, 4 Somewhat Comfortable, 5 Very Comfortable.
The five point likert-scale is considered an interval scale. If the mean is from 1 to 1.80, it
means average respondent are very uncomfortable while using e-banking services, from 1.80 to
2.60 means somewhat uncomfortable, from 2.60 to 3.40 means neither comfortable nor
uncomfortable, from 3.40 to 4.20 means somewhat comfortable and from 4.20 to 5 means
respondents are very comfortable. The likert-scale responses and mean analysis shows that,
average respondents are very comfortable while using debit card and ATM facilities with the
Journal of University of Shanghai for Science and Technology ISSN: 1007-6735
Volume 23, Issue 10, October - 2021 Page-73

mean 4.36 and 4.28 respectively whereas the respondents are somewhat uncomfortable while
using mobile banking service with the 2.03 as lowest mean. The comfortable level is also higher
for mobile banking service and bill payment facility with the 3.57 and 3.56 mean respectively.
About the tele-banking services and credit card facility respondents are neither comfortable nor
uncomfortable with the mean range between 2.60 to 3.40 interval scales. Its shows, the
comfortable level is higher with the ATM and debit card facility whereas respondents are not
comfortable while using internet banking services.
v. Satisfaction level for Grievance Settlement System:
Due to increase in competition, many banks started uses of modern technology. The e-
banking is a fast, safe, easy and efficient electronic services provided by various banks through
these technology to perform various activities. Various banks have taken initiative to create
awareness among the customer about these e-banking services and also they have created
separate grievance settlement system. Under this system, they address various issues faced by the
customer while using e-banking services.
Table 9 shows the rating of likert-scale responses and mean of satisfaction level for
grievance settlement system. Out of total, 51 per cent respondents are satisfied with the
grievance settlement system of mobile banking services whereas 8 per cent are dissatisfied with
the same e-banking services. The majority of the respondents (86 per cent) are not satisfied with
the grievance settlement system of internet banking services. The respondents are satisfied with
the grievance settlement system of bill payment facility, credit card facility and electronic fund
transfer facility provided by various banks. Moreover, the 45 per cent and 40 per cent
respondents are very satisfied with the grievance settlement system of ATM and debit card
facility respectively.
Table 9: Likert-scale responses and means of satisfaction level for grievance settlement
system of e-banking services
E-banking Services 1 2 3 4 5 Mean Result
Mobile Banking services 3 6 10 41 20 3.86 Satisfied
Internet Banking services 19 40 10 7 4 2.50 Dissatisfied
Tele-Banking services 5 3 41 18 13
3.20 Neither Satisfied
nor Dissatisfied
Bill Payment facility 1 5 16 42 16 3.83 Satisfied
ATM -Automated Teller
Machine facility 1 9 11
23 36 4.38
Very Satisfied
Credit Card facility 5 10 15 33 17 3.58 Satisfied
Journal of University of Shanghai for Science and Technology ISSN: 1007-6735
Volume 23, Issue 10, October - 2021 Page-74

EFT-Electronic Fund
Transfer facility 4 7 18
33 18 3.67
Satisfied
Debit Card facility 1 7 8 32 32
4.48 Very Satisfied
Source: Primary data
Note: 1 Very Dissatisfied, 2 Dissatisfied, 3 Neither Satisfied nor Dissatisfied, 4 Satisfied, 5 Very
Satisfied.
The likert-scale responses and mean analysis shows that, the respondents are very
satisfied about grievance settlement system of debit card and ATM facility with the mean 4.48
and 4.38 respectively. But the respondents are not satisfied with grievance settlement system of
internet banking services. About the tele-banking services respondents are neither satisfied nor
dissatisfied with the mean range between 2.60 to 3.40 interval scales. That means, banks should
improve the grievance settlement system for internet banking and tele-banking service and also
they should introduce various techno savvy methods in grievance settlement system.
Source: Primary data
The e-banking services are changing way of banking service in the recent year. It helps to
increase financial inclusion the India. The respondents are in opinion that e-banking services are
transforming entire banking system. Out of total, 68 per cent are agreed with the statement that
e-banking services have transformed banks (Graph 6).
0
10
20
30
40
50
60
70
Strongly
Disagree
Disagree Neither Agree
nor Disagree
Agree Strongly
Agree
%
Likert-Scale Responses
Graph 6: To what extent do you agree that e-banking services
have transformed banks?
Journal of University of Shanghai for Science and Technology ISSN: 1007-6735
Volume 23, Issue 10, October - 2021 Page-75

Source: Primary data
In this new technology era banking sector is changing rapidly. But still, out of total, 43
per cent respondents prefer public sector bank as preferred bank among others and 29 per cent
prefer private sector bank. The preference for foreign sector bank is 14 per cent (Graph 7).
vi. Problems While using e-banking services:
Table 10 shows the likert scale response and ranks of problems while using e-banking
services. From pre study discussion with key informant, we have listed the problems faced by
customer while using e-banking services. Those problems are related to various aspects of e-
banking services. Out of total respondents, 41 per cent strongly agreed that the connectivity
problem is the obstacle in the uses of e-banking services; whereas 5 per cent are strongly
disagreeing with this problem. The deduction of balance without withdrawal is not major
problem, however 54 per cent respondents are agreed that the less number of ATMs is the major
constrain while using e-banking services.
Table 10: Likert-scale responses and ranks of problems while using e-banking services
Problems 1 2 3 4 5 Total Weighted
Total
RII Ranks
Connectivity problem 4 6 26 11 33 80 303 0.758 1
Deduction of balance without
withdrawal 6 19 24 23 8
80 248
0.620
5
Less number of ATMs 6 6 25 29 14 80 279 0.698 2
Inconvenient location of
ATMs 8 10 22 22 18
80 272
0.680
4
0
10
20
30
40
50
Public Sector
Bank
Private Sector
Bank
Foreign Sector
Bank
Urban Co-
operative Bank
%
Type of Bank
Graph 7: In the present era of competition, which type of banks
you prefer?
Journal of University of Shanghai for Science and Technology ISSN: 1007-6735
Volume 23, Issue 10, October - 2021 Page-76

High interest rates for Credit
Cards 33 29 12 3 3
80 154
0.385
7
Ignorance of staff members 4 9 27 27 13 80 276 0.690 3
Loss of personal information 12 15 31 14 8 80 231 0.578 6
Source: Primary data
Note: 1 Strongly Disagree, 2 Disagree, 3 Neither Agree nor Disagree, 4 Agree, 5 Strongly
Agree.
The 23 per cent respondents are in opinion that, inconvenient locations of ATMs are the
major barrier in uses of e-banking. Out of total respondents, 78 per cent are disagree with the
problem of high interest rates for credit cards is the problems while suing e-banking services,
but, 39 per cent respondents are neither agree nor disagree on the loss of personal information
while using e-banking services.
The likert-scale responses and Relative Importance Index (RII) analysis shows that, the
respondents are strongly agreed with the connectivity problem while using e-banking with the 1st
rank as per RII. Moreover, less number of ATMs is also major constrain in the uses of e-banking
with the 2nd
rank. However, high interest rate for credit card is not major difficulty in using e-
banking services. The RII rank is lowest (7th
) for this problem. Additions to this, the respondents
are not agreed with the problem of loss of personal information while using e-banking services
with the 6th
rank. It means, the major problems are connectivity problem, less number of ATMs
and ignorance of staff members.
vii. Suggestions to improvement in e-banking services:
Table 11 shows the likert-scale responses and ranks of suggestions to improve in e-
banking services. Out of total respondents, 69 per cent are in opinion that banks should conduct
more staff training programmes whereas 73 per cent suggested that there is need to conduct
customer education programmes to improve e-banking services.
Table 11: Likert-scale responses and ranks of Suggestions to improve in e-banking services
Suggestions 1 2 3 4 5 Total Weighted
total RII Ranks
To conduct more staff
training programmes 3 3 19 27 28 80 314 0.785 1
More transparency is
required in the services 5 2 14 33 26 80 313 0.783 2
To conduct customer
education programmes 3 6 13 33 25 80 311 0.778 3
Journal of University of Shanghai for Science and Technology ISSN: 1007-6735
Volume 23, Issue 10, October - 2021 Page-77

To inform about new
products and services
through E-mail
2 9 16 32 21 80 301 0.753 5
To conduct demo-fare
regarding E-Banking
services
5 6 10 39 20 80 303 0.758 4
Making working hours more
flexible 5 5 34 25 11 80 272 0.680 6
Source: Primary data
Note: 5 Strongly Agree, 4 Agree, 3 Neither Agree nor Disagree, 2 Disagree, 1 Strongly Disagree.
The majority of respondent suggested that banks should give information about new
product and various services through e-mail and conduct demo-fare regarding e-banking
services. However, regarding making working hours more flexible, majority of respondents are
neither agree nor disagree.
The likert-scale responses and Relative Importance Index analysis shows that, majority of
the respondents are given suggestions to conduct more staff training programmes with 1st rank
and more transparency is required in the services with 2nd
rank. They have also suggested that
conduct customer education programmes, conduct demo-fare regarding e-banking services and
inform about new products and services through e-mail. It means, more staff training and
awareness related activities are required to increase uses of e-banking services.
V. Summary:
The use of e-banking services increased rapidly in recent period. From above study the following
important conclusions can be derived:
Firstly, the public and private sector banks are providing good quality of mobile banks
services to the customer. Secondly, the uses of e-banking services like mobile banking, credit
card facility and internet banking services are becoming popular in recent period. Thirdly, the
comfortable level is higher with the ATM and debit card facility whereas customers are not
comfortable while using internet banking services. Finally, the major problems in use of e-
banking services are connectivity problem, less number of ATMs and ignorance of staff
members. So, financial institutions should take initiatives for staff training and awareness related
activities to increase uses of e-banking services.
Journal of University of Shanghai for Science and Technology ISSN: 1007-6735
Volume 23, Issue 10, October - 2021 Page-78

Declaration of Conflicting Interests
The authors declared no potential conflicts of interest with respect to the research, authorship
and/or publication of this article.
Funding
The authors received no financial support for the research, authorship and/or publication of this
article.
References:
Altobishi, Thabit, Gizem Erboz, and Szilard Podruzsik. 2018. “E-Banking Effects on Customer
Satisfaction: The Survey on Clients in Jordan Banking Sector.” International Journal of
Marketing Studies 10 (2). https://doi.org/10.5539/ijms.v10n2p151.
Dhandayuthap S.P. 2012. E-Banking Practices and Customer Satisfaction – In Thanjavur
District, Tamilnadu: An Empirical Study, Ph.D. thesis submitted to Bharathidasan
University, Tiruchirappall, Tamilnadu (India)
Dharmapal, Preethika, and Madhumathi J. Raja. 2019. “E-Banking-Challenges and Opportunities
in India.” International Journal of Social and Economic Research 9 (3).
https://doi.org/10.5958/2249-6270.2019.00053.9.
Divya Singhal and V. Padhmanabhan. 2008. “A Study on Customer Perception Towards
Internet Banking: Identifying Major Contributing Factors”. The Journal of Nepalese
Business Studies 5 (1).
Himani Sharma. 2011. “Bankers' Perspectives on E-Banking”. Global journal of Research
in Management 1 (1).
Kumar Sharma, S. and Madhumohan Govindaluri, S. 2014. “Internet banking adoption in
India”. Journal of Indian Business Research, 6 (2)
Majid Karimzadeh. 2014. E-banking in India: Opportunities and Challenges, Ph.D. thesis
submitted to Department of Economics,Aligarh Muslim University, Aligarh- 202002,
U.P. (India)
Mishra, R. K.; Kiranmai, J. 2009. “E-Banking: A Case of India”. ICFAI Journal of Public
Administration. 5 (1)
Mohammad Abdul Hannan Mia and et al. 2007. “E-Banking: Evolution, Status and
Prospect”. The Cost and Management, 35 (1)
Mwiya, Bruce, Felix Chikumbi, Chanda Shikaputo, Edna Kabala, Bernadette Kaulung’ombe,
and Beenzu Siachinji. 2017. “Examining Factors Influencing E-Banking Adoption:
Evidence from Bank Customers in Zambia.” American Journal of Industrial and Business
Management 07 (06). https://doi.org/10.4236/ajibm.2017.76053.
Nso, Maurice Ayuketang. 2018. “The Role of E-Banking as a Marketing Tool.” Innovative
Marketing. https://doi.org/10.21511/im.14(4).2018.05.
Pooja Malhotra, Balwinder Singh. 2010. “An analysis of Internet Banking Offerings and
its Determinants in India”. Internet Research 20 (1)
PriyaVasagadekar. 2012. “A study on the Psychology of an Indian Customer Towards E-
Banking with Reference to Pune Region”. International Journal of Scientific &
Engineering Research, 3 (11)
RBI, (2001), Report on Internet Banking, Dept. of Economic Analysis and Policy Research,
Mumbai (Chairman-Shri S.R.Mittal)
Journal of University of Shanghai for Science and Technology ISSN: 1007-6735
Volume 23, Issue 10, October - 2021 Page-79

Richard Nyangosi, JS Arora. 2011. Antecedents and obstacles to e-banking adoption: a
comparative study of India and Kenya, International Journal of Indian Culture and
Business Management 4 (2)
Sangeetha, S., and K. Myilswamy. 2020. “Customers Satisfaction towards E-Banking Services
with Special Reference to Coimbatore City.” International Journal of Scientific and
Technology Research 9 (1).
Shilpan Dineshkumar Vyas. 2012. “Impact of E-Banking on Traditional Banking
Services”, International Journal of Computer Science & Communication Networks,
Vol 2 (3)
Singh P. 2013. “An exploratory study on internet banking usage in semi-urban areas in
India”, International Journal of Scientific and Research Publications, 3 (8)
Szopiński, Tomasz Stanisław. 2016. “Factors Affecting the Adoption of Online Banking in
Poland.” Journal of Business Research 69 (11).
https://doi.org/10.1016/j.jbusres.2016.04.027.
Sobiya, S. L., and N. Thangavel. 2019. “An Impact of Technology on E-Banking Dimension in
Banking Sector.” International Journal of Recent Technology and Engineering 8 (1).
Teka, Beza Muche. 2020. “Factors Affecting Bank Customers Usage of Electronic Banking in
Ethiopia: Application of Structural Equation Modeling (SEM).” Cogent Economics and
Finance 8 (1). https://doi.org/10.1080/23322039.2020.1762285.
Toor, Areeba, Mudassir Hunain, Talha Hussain, Shoaib Ali, and Adnan Shahid. 2016. “The
Impact of E-Banking on Customer Satisfaction: Evidence from Banking Sector of
Pakistan.” Journal of Business Administration Research 5 (2).
https://doi.org/10.5430/jbar.v5n2p27.
Journal of University of Shanghai for Science and Technology ISSN: 1007-6735
Volume 23, Issue 10, October - 2021 Page-80
Top Related