


Languages
Pages
Legal


By Reuven Bar-On
Group Report
The information given in this report should be used as a means of generating hypotheses and as a guideto assessment. Scores are reported as standard scores: 100 represents effective emotional functioning.Scores greater than 100 represent enhanced emotional functioning, and scores of less than 100 indicateareas that may be improved.
August 13, 2002Original Report Date:
Group Name:Total in Group:Males:Females:Unspecified:
SAMPLE 001 5230
BarOn Emotional Quotient Inventory
Copyright © 2002 Multi-Health Systems Inc. All rights reserved.P.O. Box 950, North Tonawanda, NY 14120-0950 3770 Victoria Park, Toronto, ON M3H 3M6
Page 2BarOn EQ-i Group Report for SAMPLE 001
Validity Comment:
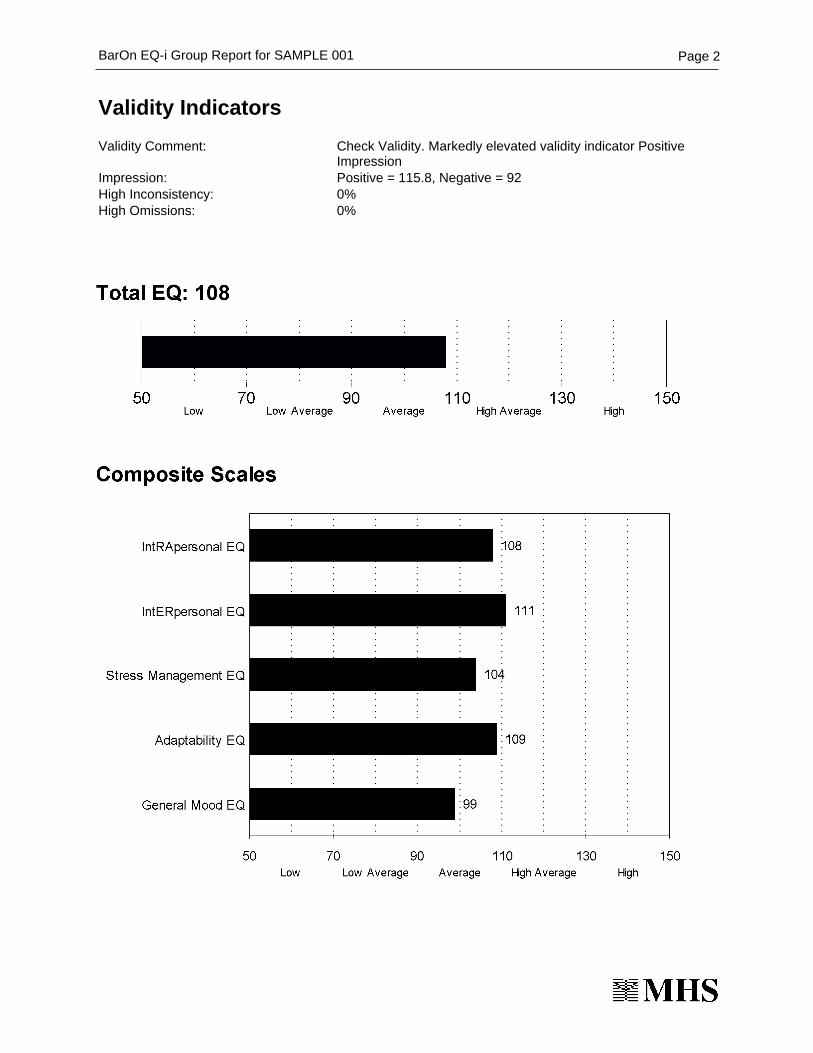
Validity Indicators
Impression:Check Validity. Markedly elevated validity indicator PositiveImpressionPositive = 115.8, Negative = 92
High Inconsistency:High Omissions:
0%0%

Page 3BarOn EQ-i Group Report for SAMPLE 001

Average = 108.2 Minimum = 87 Maximum = 120 Standard Deviation = 14.3 Valid Responsess = 5 Invalid Responses = 0
Average = 108.2 Minimum = 85 Maximum = 120 Standard Deviation = 13.5 Valid Responsess = 5 Invalid Responses = 0
Average = 110.8 Minimum = 96 Maximum = 120 Standard Deviation = 9.8 Valid Responsess = 5 Invalid Responses = 0
Page 4BarOn EQ-i Group Report for SAMPLE 001

Average = 104.4 Minimum = 91 Maximum = 119 Standard Deviation = 9.9 Valid Responsess = 5 Invalid Responses = 0
Average = 109 Minimum = 81 Maximum = 125 Standard Deviation = 16.4 Valid Responsess = 5 Invalid Responses = 0
Average = 98.6 Minimum = 62 Maximum = 113 Standard Deviation = 18.5 Valid Responsess = 5 Invalid Responses = 0
Page 5BarOn EQ-i Group Report for SAMPLE 001

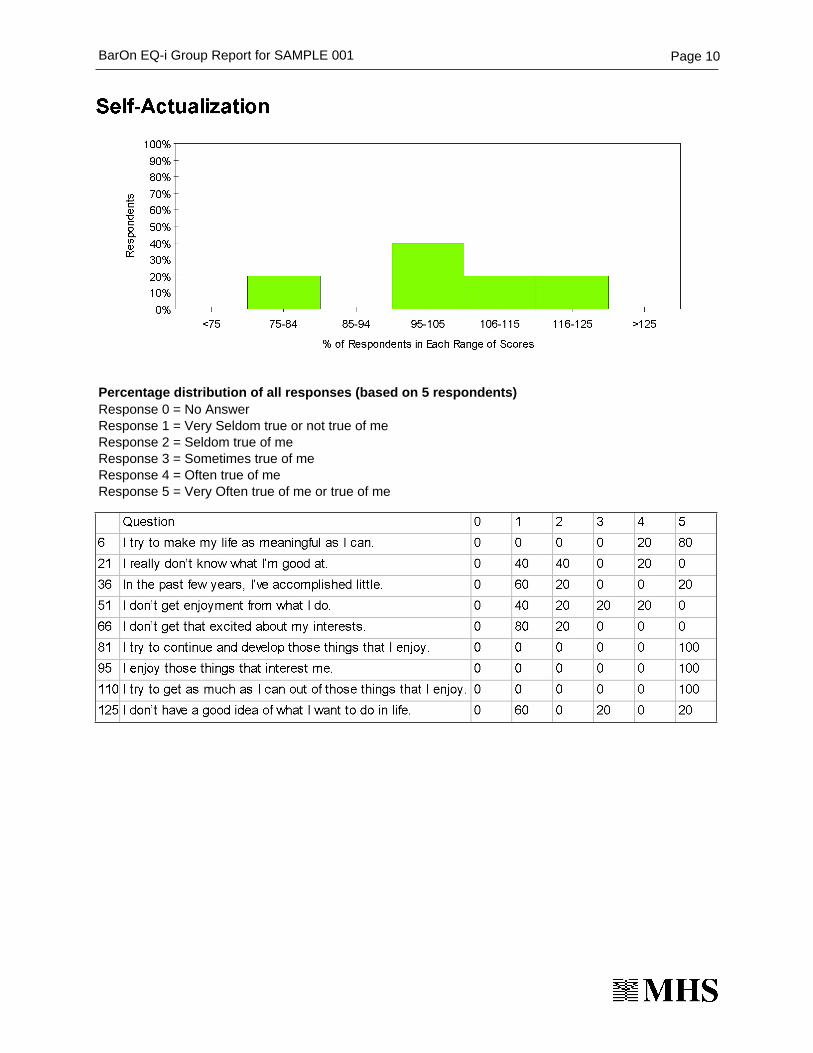
Percentage distribution of all responses (based on 5 respondents)Response 0 = No AnswerResponse 1 = Very Seldom true or not true of meResponse 2 = Seldom true of meResponse 3 = Sometimes true of meResponse 4 = Often true of meResponse 5 = Very Often true of me or true of me
Page 6BarOn EQ-i Group Report for SAMPLE 001

Page 7BarOn EQ-i Group Report for SAMPLE 001
Percentage distribution of all responses (based on 5 respondents)Response 0 = No AnswerResponse 1 = Very Seldom true or not true of meResponse 2 = Seldom true of meResponse 3 = Sometimes true of meResponse 4 = Often true of meResponse 5 = Very Often true of me or true of me

Page 8BarOn EQ-i Group Report for SAMPLE 001
Percentage distribution of all responses (based on 5 respondents)Response 0 = No AnswerResponse 1 = Very Seldom true or not true of meResponse 2 = Seldom true of meResponse 3 = Sometimes true of meResponse 4 = Often true of meResponse 5 = Very Often true of me or true of me

Page 9BarOn EQ-i Group Report for SAMPLE 001
Percentage distribution of all responses (based on 5 respondents)Response 0 = No AnswerResponse 1 = Very Seldom true or not true of meResponse 2 = Seldom true of meResponse 3 = Sometimes true of meResponse 4 = Often true of meResponse 5 = Very Often true of me or true of me
Page 10BarOn EQ-i Group Report for SAMPLE 001
Percentage distribution of all responses (based on 5 respondents)Response 0 = No AnswerResponse 1 = Very Seldom true or not true of meResponse 2 = Seldom true of meResponse 3 = Sometimes true of meResponse 4 = Often true of meResponse 5 = Very Often true of me or true of me

Page 11BarOn EQ-i Group Report for SAMPLE 001
Percentage distribution of all responses (based on 5 respondents)Response 0 = No AnswerResponse 1 = Very Seldom true or not true of meResponse 2 = Seldom true of meResponse 3 = Sometimes true of meResponse 4 = Often true of meResponse 5 = Very Often true of me or true of me

Page 12BarOn EQ-i Group Report for SAMPLE 001
Percentage distribution of all responses (based on 5 respondents)Response 0 = No AnswerResponse 1 = Very Seldom true or not true of meResponse 2 = Seldom true of meResponse 3 = Sometimes true of meResponse 4 = Often true of meResponse 5 = Very Often true of me or true of me

Page 13BarOn EQ-i Group Report for SAMPLE 001
Percentage distribution of all responses (based on 5 respondents)Response 0 = No AnswerResponse 1 = Very Seldom true or not true of meResponse 2 = Seldom true of meResponse 3 = Sometimes true of meResponse 4 = Often true of meResponse 5 = Very Often true of me or true of me

Page 14BarOn EQ-i Group Report for SAMPLE 001
Percentage distribution of all responses (based on 5 respondents)Response 0 = No AnswerResponse 1 = Very Seldom true or not true of meResponse 2 = Seldom true of meResponse 3 = Sometimes true of meResponse 4 = Often true of meResponse 5 = Very Often true of me or true of me

Page 15BarOn EQ-i Group Report for SAMPLE 001
Percentage distribution of all responses (based on 5 respondents)Response 0 = No AnswerResponse 1 = Very Seldom true or not true of meResponse 2 = Seldom true of meResponse 3 = Sometimes true of meResponse 4 = Often true of meResponse 5 = Very Often true of me or true of me

Page 16BarOn EQ-i Group Report for SAMPLE 001
Percentage distribution of all responses (based on 5 respondents)Response 0 = No AnswerResponse 1 = Very Seldom true or not true of meResponse 2 = Seldom true of meResponse 3 = Sometimes true of meResponse 4 = Often true of meResponse 5 = Very Often true of me or true of me

Page 17BarOn EQ-i Group Report for SAMPLE 001
Percentage distribution of all responses (based on 5 respondents)Response 0 = No AnswerResponse 1 = Very Seldom true or not true of meResponse 2 = Seldom true of meResponse 3 = Sometimes true of meResponse 4 = Often true of meResponse 5 = Very Often true of me or true of me

Page 18BarOn EQ-i Group Report for SAMPLE 001
Percentage distribution of all responses (based on 5 respondents)Response 0 = No AnswerResponse 1 = Very Seldom true or not true of meResponse 2 = Seldom true of meResponse 3 = Sometimes true of meResponse 4 = Often true of meResponse 5 = Very Often true of me or true of me

Page 19BarOn EQ-i Group Report for SAMPLE 001
Percentage distribution of all responses (based on 5 respondents)Response 0 = No AnswerResponse 1 = Very Seldom true or not true of meResponse 2 = Seldom true of meResponse 3 = Sometimes true of meResponse 4 = Often true of meResponse 5 = Very Often true of me or true of me

Page 20BarOn EQ-i Group Report for SAMPLE 001
Percentage distribution of all responses (based on 5 respondents)Response 0 = No AnswerResponse 1 = Very Seldom true or not true of meResponse 2 = Seldom true of meResponse 3 = Sometimes true of meResponse 4 = Often true of meResponse 5 = Very Often true of me or true of me

Page 21BarOn EQ-i Group Report for SAMPLE 001

Cautionary RemarksThis computerized report is meant to act as an interpretive aid and should not be used as the sole basisfor placement, intervention, or other kinds of decision making. This report works best when combinedwith other sources of relevant information. The report is based on an algorithm that produces theinterpretations most common for the scores that are obtained. This is a group report and is based on theaverage responses of the group members. Although this report is reflective of the predisposition of thegroup, the comments in this report need not and, in general, will not apply to every individual in thegroup. Individual reports should be used instead to obtain information pertinent to specific people.
Positive Impression (PI) and Negative Impression (NI) ScoresThe group score on the Positive Impression scale (PI) is markedly elevated. The scores produced in thisreport are not reliable and are probably higher than they should be. Because of the high score on the PIscale, the scores provided in this report may not accurately represent the emotional functioning of thisgroup. Use additional sources of information to further analyze/verify these results.
Validity IndicatorsA high score on the Inconsistency Index was obtained by only 0 % of the group. There is sufficientconsistency in the responses, and the Inconsistency Index results support the validity of the obtainedresults.
A high Positive Impression or Negative Impression score means that the scores produced may not bereliable. The results should be interpreted with caution.
Inconsistency Index
Summary of Validity Scale Results
Interpretation Guide for the EQ-i Composite and ContentSubscale ScoresEQ-i scores may be classified as high, moderate, or low. In general, high scores identify areas ofstrength. Scores in the average range on these scales indicate typical healthy functioning and are scoresthat are obtained by the majority of those in the population who have taken the EQ-i. Lower scores reflectareas for development. If all the scores are high or all the scores are low, it is useful to identify the scaleswith the highest and lowest scores; this will help pinpoint areas of relative strength or weakness.Total EQ-iThe Total EQ score for the group is substantially better than average. A score in this range indicates agroup of individuals who feel good about things overall. The group probably consists of individuals whoare leading successful lives. Groups who score high on the Total EQ scale are generally happy and havea positive outlook on life. A more detailed description of the EQ-i components is given next.Total Intrapersonal EQThe Intrapersonal composite score includes Emotional Self-Awareness, Assertiveness, Self Regard,Self-Actualization, and Independence.The Total Intrapersonal score is substantially better than average.High scores are indicative of a group of individuals who are in touch with feelings, and who feel goodabout themselves and about life. High scores also indicate individuals who are independent,strong-minded, and able to express and convey ideas with confidence.Self-RegardThe score on the Self-Regard scale is slightly above average indicating a group with adequateself-respect and self-confidence. People in this group probably have a reasonably good sense of whothey are and have positive feelings about their life, lifestyle, and work most of the time.
Page 22BarOn EQ-i Group Report for SAMPLE 001

Emotional Self-AwarenessThe score on this scale is well above average and indicates that group members understand their ownfeelings and attitudes, and realize how these feelings and attitudes affect their thoughts and actions.Most individuals in this group are able to facilitate interactions by monitoring their own emotions, and byappropriately expressing their feelings and attitudes during communication.AssertivenessCollectively, this group scores high on the Assertiveness scale. This group should have an advancedability to defend their beliefs, deal appropriately with others, and handle adversity. Group members areprobably forthright and confident, and can openly share thoughts, beliefs, and feelings in a constructivemanner. The group milieu is perceived as non-threatening and likely maximizes freedom for exchangingideas.IndependenceThe score on this scale is about average indicating a balance between a desire to think and actindependently, and a willingness to make decisions in combination with other people.Self-ActualizationThe score on this scale is reasonably high, and is indicative of a group of individuals who generally feelmore content and self-fulfilled than the population norm. The score is indicative of a group whosemembers enjoy life most of the time and who usually stay involved in pursuits that are interesting andmeaningful to them. Members of this group are likely motivated, and successful at what they do.Total Interpersonal EQThis component of the Total EQ-i scale taps interpersonal capacity and functioning. The sub-componentsof the Total Interpersonal Scale include Empathy, Interpersonal Relationship, and SocialResponsibility.The Total Interpersonal score is substantially better than average. This score indicates agroup of individuals with social adeptness, the ability to understand others, and the ability to interacteffectively. The score is reflective of individuals who are usually responsible, dependable, and functionwell in tasks involving making contact with others and cooperation.EmpathyThe group score on this scale is above average and is indicative of individuals with a good awareness,understanding, and appreciation of the feelings of others. Individuals with high Empathy scores will goout of their way to help others. This asset is of greatest benefit in interacting with others, and duringcooperative efforts.Social ResponsibilityThe high score on this scale indicates individuals who are cooperative, contributing, and constructivemembers of the "community at large" (society, the corporation, team, etc.). Individuals who score high onthis scale are often described as responsible and dependable. They will do their best to help people, andgenerally will abide by rules, regulations, and protocols.Interpersonal RelationshipThe score on this scale is indicative of a group of individuals who have good interpersonal skills. This isthe scale that ties most directly to the ability to interact with others. Group members are able to formagreeable relationships and alliances. This ability supports effective communication and the mutuallybeneficial exchange of ideas, feelings, and information.Total Stress Management EQThe Stress Management component consists of the Stress Tolerance and Impulse Control Scales.Bothcomponents of the composite scale score for this group are average or better. There seems to beespecially good impulse and anger control. Overall, this group shows reasonably good stressmanagement.
Page 23BarOn EQ-i Group Report for SAMPLE 001
The score on the Stress Tolerance scale is slightly above average and suggests the ability to withstandadverse events and stressful situations. Individuals with above average scores on this scale are generallyable to cope with stress actively and positively even when under pressure. These people are generallycalm and rarely get overly anxious or agitated.
Stress Tolerance
Impulse ControlThe Impulse Control score is higher than average indicating that most individuals in this group can resistor delay impulses, drives, and temptations to act. These people are rarely impatient, and seldomoverreact. This group gives proper thought to decisions and actions helping to avoid careless or costlymistakes.Total Adaptability EQThe Adaptability composite area is composed of the Problem Solving, Reality Testing, and Flexibilitysubscales and examines success in coping with environmental demands based on the ability toeffectively size up and deal with problematic situations.The score obtained on this composite scale issubstantially higher than average. This score indicates a group of individuals who are very flexible inadjusting to changing circumstances and situations. High scores on the Adaptability scale identifypractical, realistic individuals who do not over-fantasize. Such individuals understand problematicsituations and come up with effective, practical solutions. High scores on Adaptability are obtained byindividuals who are "down to earth," clear thinking, and adapt easily to changing demands and priorities.Reality TestingThe Reality Testing score indicates a group of individuals who have a better than average ability toevaluate the correspondence between what they experience (the "subjective") and the facts/reality (the"objective"). Individuals with high Reality Testing scores tend to be described as realistic, well grounded,and "tuned in" to what's going on around them. They are practical and guided by common sense.FlexibilityThe group score on this scale indicates a slightly better than average ability to adjust thoughts, emotions,and behaviors to changing situations and conditions. Most individuals in this group probably find it fairlyeasy to pick up new things, don't become too fixed into routines, and remain relatively open-minded todiffering opinions and ways of thinking. Individuals high in Flexibility will prosper in dynamic environmentsand changeable circumstances.Problem SolvingThe score on the Problem Solving scale is well above average reflecting a group with a good analyticapproach to the resolution of problems. Most of the group members probably have a very deliberatingand methodical style. They are good at defining problems as well as generating and implementingpotentially effective solutions. Cost-Benefit analyses are likely conducted when appropriate, andconsideration is given to long-term implications of decisions.
The subcomponents of this composite scale consist of the Happiness and Optimism Scales. Thesecomponents of the Total EQ-i scale measure general contentment and overall outlook.Both componentsof General Mood are about average or better, and descriptions of these components are given below.
General Mood EQ
The score on this scale is about average indicating a level of optimism that is close to the populationnorm. There are probably times when members of this group feel a little pessimistic, but this is notnecessarily unusual. Overall, optimism usually will be appropriate for the circumstances. Prospects forthe future are assessed by keeping expectations balanced.
Optimism
HappinessThe score on the Happiness scale is about average and indicates a group of people who feel contentwith their lives most of the time. Although the results are satisfactory, attempts to promote more positivefeelings and enjoyment might be beneficial. There may be a need to create a positive atmosphere, and tobalance work with leisure time and relaxation.
Page 24BarOn EQ-i Group Report for SAMPLE 001

Profile SummaryThe Overall EQ-i score was high indicating a group that has good Emotional Intelligence. There are fairlylarge differences in the scores for the 15 content scales indicating areas of relative strengths and areasof improvement. Emotional Intelligence will contribute to success in most endeavors.The three highest subscales are Reality Testing (111), Interpersonal Relationship (111), Empathy (110).The three lowest subscales are Optimism (98), Happiness (100), Self-Actualization (104), StressTolerance (104).
Simple Strategies For DevelopmentStrategies for improving the areas that yielded the three lowest EQ-i scoresOptimism (98)Organization Focussed Strategies: · Adjust goals so that they are more attainable · Use positive feedback for goal attainment, and constructive and supportive feedback when goals are
not successfully met · If appropriate, increase empowerment to avoid the pessimism that often results when people feel
helpless to change the status quo; This feeling is often overcome if one's own judgment can be used to change circumstances.
Individual Focussed Strategies: · Minimize negative thoughts when problems are trivial or temporary · Celebrate personal accomplishments · Be solution-focussed rather than problem-driven · When long-term goals seem difficult, set realistic intermediary goals (or personal goals) that will
serve as guideposts along the way. Happiness (100)Organization Focussed Strategies: · Liberally provide rewards and incentives for accomplishments · Promote a consistently positive atmosphere · Look at negative outcomes as opportunities to learn and improve with the attitude that things will get
better · To the extent that it is possible, match activities with the talents of individuals and with tasks that
they find enjoyable. Individual Focussed Strategies: · Recognize and celebrate personal achievements · Examine career/life plans in terms of current activities and position · Properly balance work/life demands with rest, relaxation, and hobbies · If appropriate, increase activity and exercise to improve overall health and energy level · Increase the amount of time spent on really enjoyable activities.
Page 25BarOn EQ-i Group Report for SAMPLE 001

Self-Actualization (104)Organization Focussed Strategies: · Set goals that are challenging yet clearly attainable; Goals should be objective and, preferably,
measurable · Examine career/life plans and aspirations in terms of the current positions of staff/group members · Train to improve skills so that individuals move closer to achieving full their potential · Try to match what people are actually doing as closely as possible with the things they like doing,
and with the things they are good at doing. Individual Focussed Strategies: · Set personal goals that are consistent with life and career plans · Examine career/life plans and aspirations in terms of current position · Take courses, seminars, etc. to get closer to desired skill level · Avoid unrealistic/fanciful ideals · Revisit goals regularly to check fit with personal changes in beliefs and desires.
This narrative report is meant as an aid to help understand the results of the BarOn EQ-i. Combined withother information, the EQ-i can help identify areas of strength to be celebrated as well as areas that couldbe improved.
Closing Remark
Date Printed: Tuesday, August 13, 2002End of Report
Page 26BarOn EQ-i Group Report for SAMPLE 001
Top Related