


Languages
Pages
Legal

Greenhouse Gas Emissions Inventory University of Texas at Arlington This report summarizes the findings of the Greenhouse
Gas Emissions Inventory for the University of Texas at
Arlington. The purpose of conducting the analysis and
creating this document is to clarify the sources of
emissions and to develop short and long term reduction
policies.
2
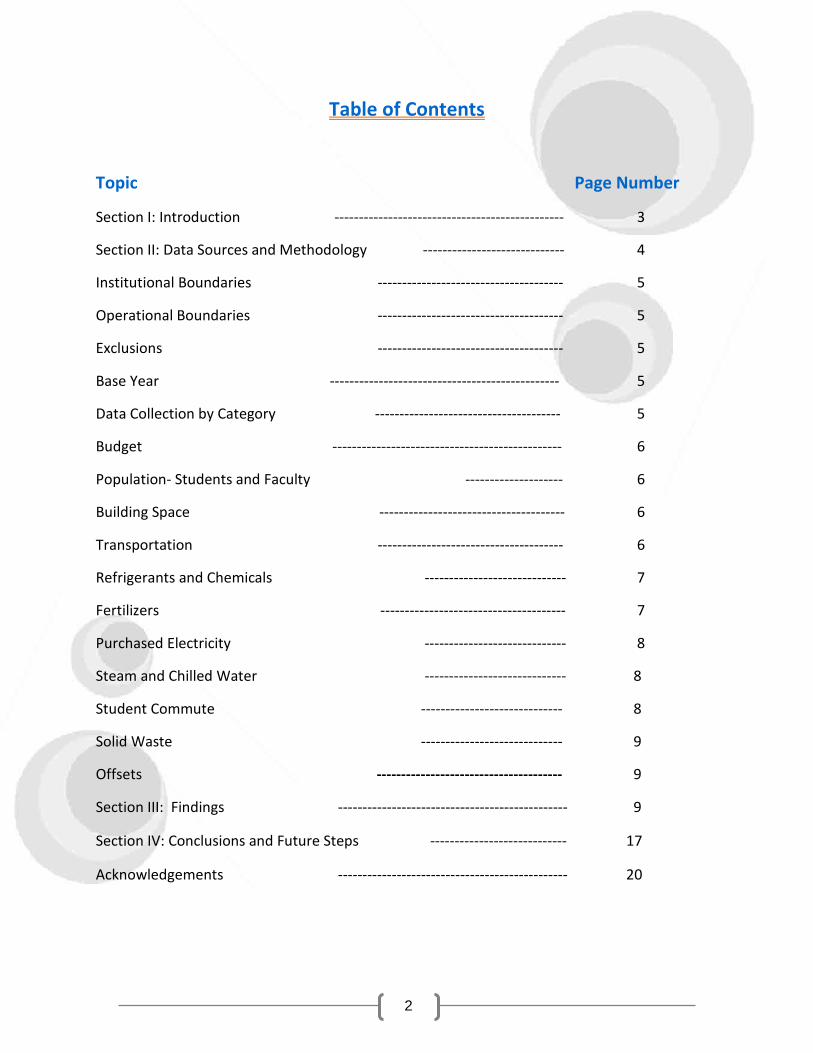
Table of Contents
Topic Page Number
Section I: Introduction ----------------------------------------------- 3
Section II: Data Sources and Methodology ----------------------------- 4
Institutional Boundaries -------------------------------------- 5
Operational Boundaries -------------------------------------- 5
Exclusions -------------------------------------- 5
Base Year ----------------------------------------------- 5
Data Collection by Category -------------------------------------- 5
Budget ----------------------------------------------- 6
Population- Students and Faculty -------------------- 6
Building Space -------------------------------------- 6
Transportation -------------------------------------- 6
Refrigerants and Chemicals ----------------------------- 7
Fertilizers -------------------------------------- 7
Purchased Electricity ----------------------------- 8
Steam and Chilled Water ----------------------------- 8
Student Commute ----------------------------- 8
Solid Waste ----------------------------- 9
Offsets -------------------------------------- 9
Section III: Findings ----------------------------------------------- 9
Section IV: Conclusions and Future Steps ---------------------------- 17
Acknowledgements ----------------------------------------------- 20
3
Section I: Introduction
The University of Texas at Arlington is committed to sustainability and stewardship of the
environment. Sustainability represents societal efforts to meet the needs of the present
without compromising the ability of future generations to meet their own needs. A growing
number of institutions of higher education – along with federal, state, and local governments as
well as corporations – are directing attention to sustainability, as concerned citizens recognize
that the earth’s resources are finite. Because our economy and society are dependent on a
healthy environment, sustainability requires balancing economic success with environmental
conservation, and social equity, also known as the triple bottom line.
The University of Texas at Arlington is committed to this triple bottom line and is striving to
become a leader in campus sustainability through the efforts of administration, faculty, staff,
and students. The University is actively engaged in greening facility operations, promoting
innovative research, supporting and encouraging student initiatives, implementing
environmentally and sustainability focused curriculum, and sponsoring public service initiatives.
The Office of Sustainability was established in 2010 to develop a university wide program that
promotes the principles and mission of the University’s Sustainability Committee (USC). The
office of sustainability integrates sustainability practices into all facets of UT Arlington’s mission
and master plan, including teaching, research, campus operations, outreach, and community
engagement. All initiatives involve collaboration with faculty, staff, and students as well as local
and regional partners like Environmental Protection Agency (EPA), North Central Texas Council
of Governments (NCTCOG).
The Carbon footprint analysis is a campus wide initiative coordinated by the Office of
Sustainability and guided by a university wide working group (USC) that initiates and
coordinates teaching, research, campus policy, and engagement projects to advance the goals
of UT Arlington. The purpose of conducting this analysis and creating the emissions inventory is
to identify the sources of emissions and to develop short and long term reduction targets or
goals. A similar analysis was conducted by UT ARLINGTON in 2008 using ICLEI’s CACP software.
It was however acknowledged during the analysis that CACP is tailored for use by government
4
entities rather than universities, and the Clean Air Cool Planet calculator was recommended as
an alternative.
A greenhouse gas emissions inventory is an accounting of the amounts and sources of
emissions of greenhouse gases attributed to the existence and operations of an institution. The
completion of such an inventory provides an essential foundation for focused, effective
outreach on the issue of sustainability at a university, and the basis for institutional action to
address it. It is a crucial first step toward comprehensive campus climate action efforts.
Section II: Data Sources and Methodology
The Clean Air-Cool Planet calculator was used for UT Arlington’s inventory. We selected the
calculator because it was designed specifically for higher education campuses, measures the six
greenhouse gases identified in the Kyoto Protocol (CO2, CH4, N2O, HFC and PFC, and SF6), and
assists with future projected trends.
Clean Air-Cool Planet offers a Campus Greenhouse Gas Emissions Inventory Calculator, an MS-
Excel-based spreadsheet tool, for use in completing these activities. The Calculator incorporates
three steps, providing procedural protocols and a framework for investigation. The
spreadsheets, based on workbooks by the Intergovernmental Panel on Climate Change (IPCC)
for national inventories, have been adapted for institutional use.
The major emission source categories are on-campus energy production, purchased electricity,
transportation, waste, agriculture and refrigerants. Looking at the emissions levels in each of
these categories provides a good idea of the best opportunities for emissions reduction. The
Campus Carbon Calculator uses standard methodologies codified by the Greenhouse Gas
Protocol (GHG) Initiative, and employed by corporations, the state of California, The Climate
Registry, and other entities to account for greenhouse gas emissions. The GHG Protocol
presents a useful accounting concept, called scopes, that can help entities understand and
structure decisions about operational boundaries, and can simultaneously help address the
potential for “double counting”. This approach defines three levels of responsibility for
5
emissions, and basically posits that an entity’s responsibility for emissions is directly related to
its control over, or ownership of, the sources of those emissions. In order to make future data
collection easier, all data is recorded in the fiscal years September 1 through August 31- and
entered by the year in the which the fiscal year starts (i.e., FY 2007-08 appears in CA-CP as year
2007).
Institutional Boundaries
Institutional boundaries were set to include all operations over which the university has
control-UT Arlington owned or leased buildings, number of students (full time equivalent),
faculty and staff, the university vehicle fleet, waste stream (including food waste).
Operational Boundaries
Inventoried emissions were categorized into three types:
Category 1 – Direct GHG Emissions
-Sources include natural gas, University fleet fuel, and fertilizers
Category 2 – GHG Emissions from Imports of Electricity
-Sources include all electricity consumption
Category 3 – Other Indirect GHG Emissions
-Sources include student and faculty daily commutes, waste sent to landfills
Exclusions
Several sources of University emissions are outside the scope of this inventory. In most cases,
these emissions are excluded because of a lack of sufficient data. The omitted activities include:
University related ground travel for which the University fleet was not used; and University
related air travel. Obtaining University-related travel data from individuals was deemed
infeasible at this time. Emissions from excluded activities, as well as those from satellite
campuses, will be considered at a later time.
6
Base Year
Fiscal year 2005-06 was selected as the base year. For some indicators, we have data going back
to 1990. But this historic data was not available for all the indicators. 2005-06 was the most
recent year for which complete information was available for all the indicators. Reduction goals
in the Action Plan will use 2005-06 as the benchmark year.
Data Collection by Category
This section contains detailed information of data collection and entry into CA-CP
Budget
The Operating budget consists of all sources of funding UT Arlington has financial control of and
is plainly considered as the cost to operate the institution. Research dollars includes all sources
of financial funding that UT Arlington receives for its cumulative research endeavors. Energy
budget is total spent providing the energy needs of all operations. Operational budget data for
all fiscal years (1990-91 to 2009-10) was received from the Office of Finance and
Administration. Energy Budget data for all fiscal years (1990-91 to 2009-10) was received by the
Office of Facilities Management. The combined budget includes budget for electricity, steam
and chilled water, and on-campus stationary sources (heating, etc). Research budget data was
available for the years 2005-09.
Population- Students and Faculty
The fall semester was chosen as a reasonable representation of the university population which
includes full time and part time students, and each category includes both graduate and
undergraduate students. We choose to exclude summer students as suggested by the CA-CP
tool. Faculty data also includes full time and part time. The information was provided by the
Institutional Research, Planning and Effectiveness office. Staff data has not been included.
7
Building Space
Total building size data was provided by the Office of Facilities Management for the fiscal years
1990-91 to 2008-09. Research building data was also provided by the Office of Facilities
Management for the fiscal years 2005-06 to 2008-09.
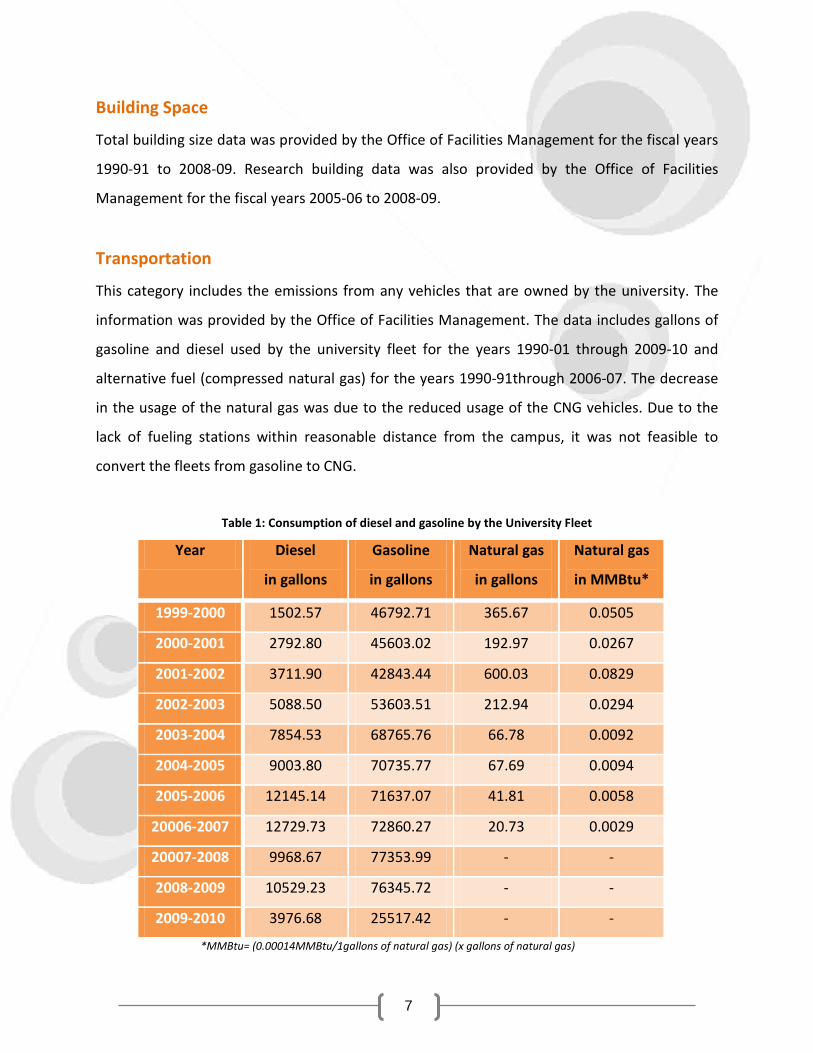
Transportation
This category includes the emissions from any vehicles that are owned by the university. The
information was provided by the Office of Facilities Management. The data includes gallons of
gasoline and diesel used by the university fleet for the years 1990-01 through 2009-10 and
alternative fuel (compressed natural gas) for the years 1990-91through 2006-07. The decrease
in the usage of the natural gas was due to the reduced usage of the CNG vehicles. Due to the
lack of fueling stations within reasonable distance from the campus, it was not feasible to
convert the fleets from gasoline to CNG.
Table 1: Consumption of diesel and gasoline by the University Fleet
Year Diesel
in gallons
Gasoline
in gallons
Natural gas
in gallons
Natural gas
in MMBtu*
1999-2000 1502.57 46792.71 365.67 0.0505
2000-2001 2792.80 45603.02 192.97 0.0267
2001-2002 3711.90 42843.44 600.03 0.0829
2002-2003 5088.50 53603.51 212.94 0.0294
2003-2004 7854.53 68765.76 66.78 0.0092
2004-2005 9003.80 70735.77 67.69 0.0094
2005-2006 12145.14 71637.07 41.81 0.0058
20006-2007 12729.73 72860.27 20.73 0.0029
20007-2008 9968.67 77353.99 - -
2008-2009 10529.23 76345.72 - -
2009-2010 3976.68 25517.42 - -
*MMBtu= (0.00014MMBtu/1gallons of natural gas) (x gallons of natural gas)
8
Refrigerants and Chemicals
R-22 and CFC-22 is employed in space conditionally applications at the Thermal Energy Plant on
Campus. Chlorodifluoromethane or difluoromonochloromethane is a hydrochlorofluorocarbon
(HCFC). This colorless gas is better known as HCFC-22, R-22. The losses of R-22 were obtained
for the years 2000, 2001, 2005-2009 by the HVAC shop and entered for HCFC-22 in the
calculator.
Fertilizers
This section includes fertilizer application on grounds and fields as part of the university’s
landscaping operations. Synthetic fertilizers are used for grounds keeping and de-icing by the
housing department. Synthetic fertilizers are labeled with their chemical makeup to represent
the percentages of nitrogen (N), phosphorus (P), and potassium (K). 10,000 lbs of `25-3-5`
(~2500 lbs of nitrogen) and 500 lbs of `46-0-0` fertilizer (~ 230 lbs of nitrogen) is used annually
by UT Arlington. This equals 2720 lbs or 27.3% of nitrogen. According to the Office of Facilities
Management, the fertilizer usage has remained constant through the timeline considered for
this inventory.
Purchased Electricity
Scope 2 emissions from purchased electricity are likely to be a significant emissions source. The
e-grid sub region was chosen as “ERCT” under the region “ERCOT ALL” for pre and post 2006 e-
GRID sub region choices. An e-grid sub-region represents a portion of the US power grid that is
contained within a single North America Electric Reliability Council (NERC) region, and generally
represents sections of the power grid which have similar emissions and resource mix
characteristics, and may be partially isolated by transmission constraints. E-grid’s emissions
represent emissions from fuel only used for generating electricity.
9
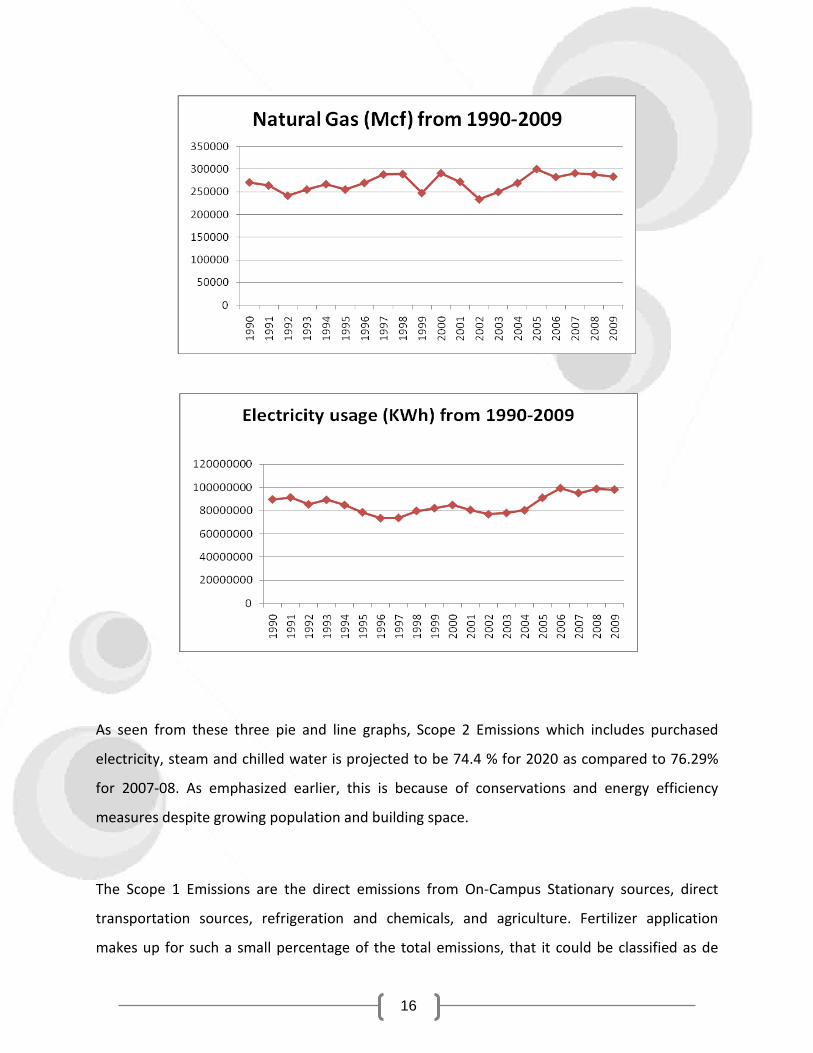
KWh of electricity used per year for the fiscal years 1990-91 through 2009-10 was obtained by the Office of
Facilities Management.
Steam and Chilled Water
Steam is being generated using natural gas as fuel. The natural gas consumption data for the
fiscal years 1990-91 through 2009-10 were provided by the Office of Facilities Management.
Chilled water is generated using electricity and has already been accounted for in the
“Purchased Electricity” and therefore no data has been entered for this section.
Student Commute
This category includes the number of annual miles traveled by faculty, staff, and student. The
reason this is an integral part of the inventory is because the university can influence this travel
in future by offering alternatives like bus, shuttle or a car sharing program. In this analysis we
included the data for only student commute, assumed 100% personal vehicle travel, 4 times a
week. The total number of weeks per year is based on the university calendar for spring and
fall; 16 weeks in spring and fall. The numbers of summer students have been excluded. We
restricted our radius to 60 miles around campus for calculating the total miles traveled.
10
Solid Waste
A fairly representative data for the tonnage of waste from the UT Arlington to the City of
Arlington’s landfill was obtained for the fiscal year 2007 and 2008 by Republic Services. There is
no methane recovery.
Offsets
Offsets are operations or activities that the organization undertakes to compensate for the
damage to the environment. These activities can include recycling or investing in clean
technologies or sustainable activities whose positive impacts are measureable. UT Arlington has
an onsite compost program since 2001, and hence this program qualifies as an Offset with
Additionality. The weights of the composted material have been obtained from the Recycling
Coordinator for offsets.
11
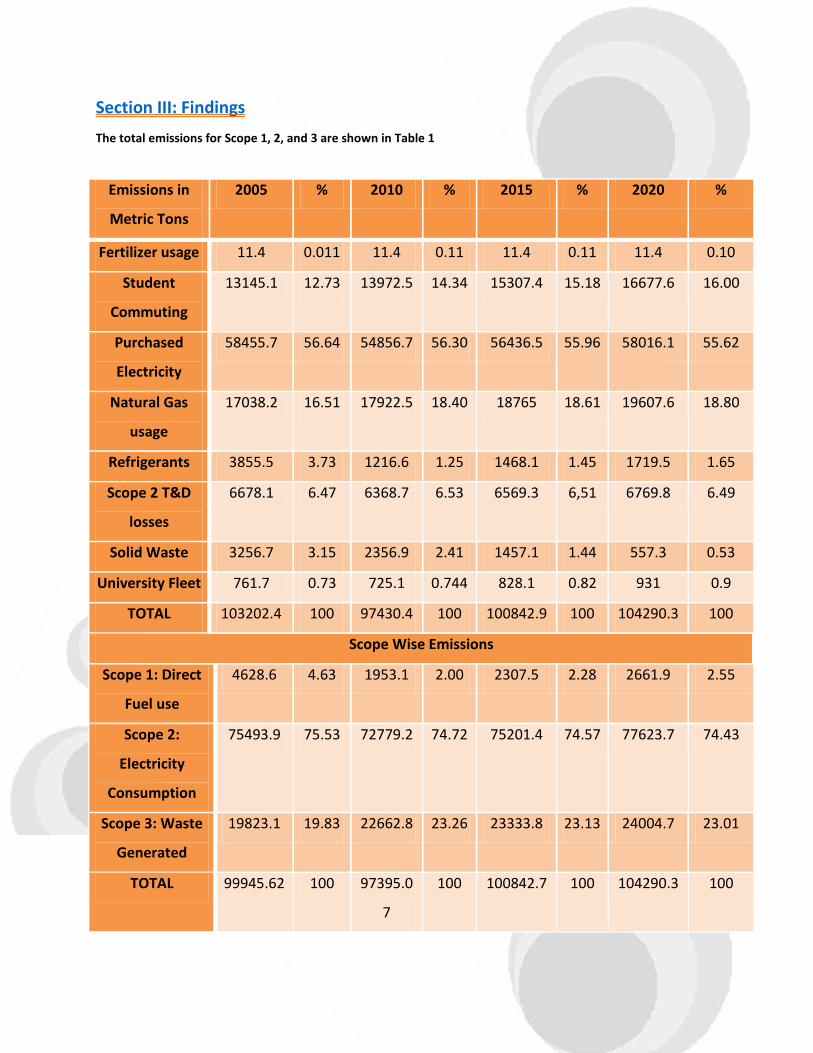
Section III: Findings
The total emissions for Scope 1, 2, and 3 are shown in Table 1
Emissions in
Metric Tons
2005 % 2010 % 2015 % 2020 %
Fertilizer usage 11.4 0.011 11.4 0.11 11.4 0.11 11.4 0.10
Student
Commuting
13145.1 12.73 13972.5 14.34 15307.4 15.18 16677.6 16.00
Purchased
Electricity
58455.7 56.64 54856.7 56.30 56436.5 55.96 58016.1 55.62
Natural Gas
usage
17038.2 16.51 17922.5 18.40 18765 18.61 19607.6 18.80
Refrigerants 3855.5 3.73 1216.6 1.25 1468.1 1.45 1719.5 1.65
Scope 2 T&D
losses
6678.1 6.47 6368.7 6.53 6569.3 6,51 6769.8 6.49
Solid Waste 3256.7 3.15 2356.9 2.41 1457.1 1.44 557.3 0.53
University Fleet 761.7 0.73 725.1 0.744 828.1 0.82 931 0.9
TOTAL 103202.4 100 97430.4 100 100842.9 100 104290.3 100
Scope Wise Emissions
Scope 1: Direct
Fuel use
4628.6 4.63 1953.1 2.00 2307.5 2.28 2661.9 2.55
Scope 2:
Electricity
Consumption
75493.9 75.53 72779.2 74.72 75201.4 74.57 77623.7 74.43
Scope 3: Waste
Generated
19823.1 19.83 22662.8 23.26 23333.8 23.13 24004.7 23.01
TOTAL 99945.62 100 97395.0
7
100 100842.7 100 104290.3 100
12
13
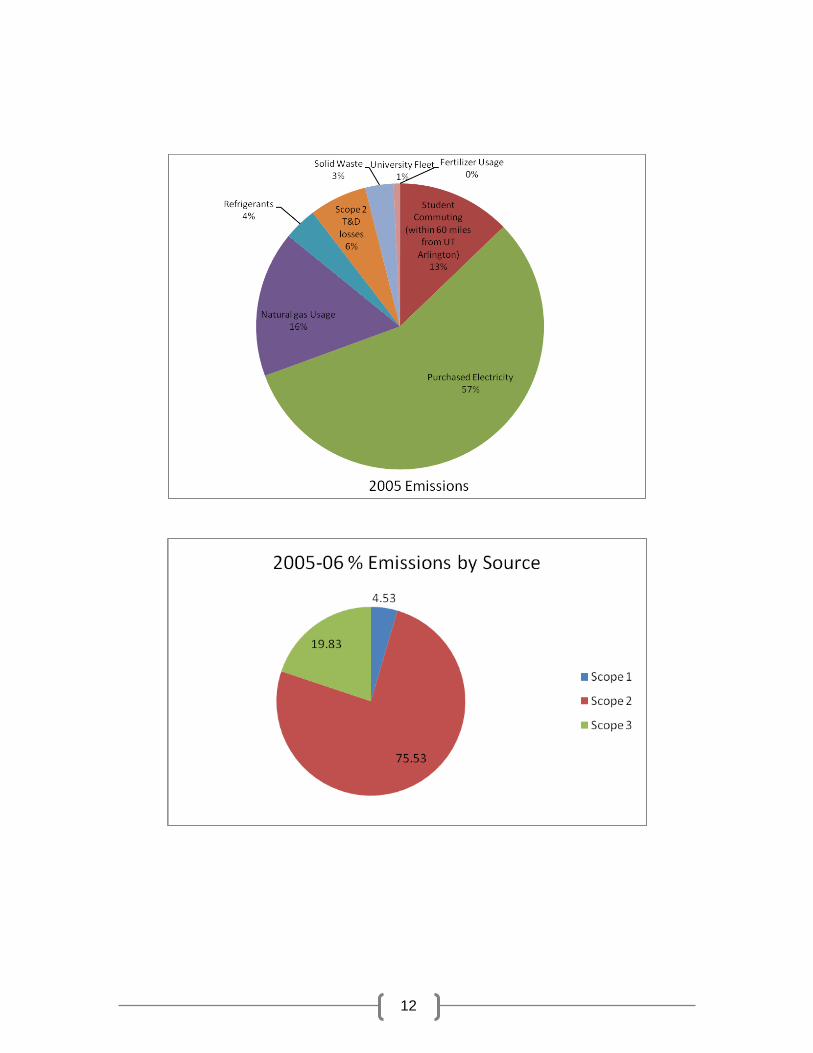
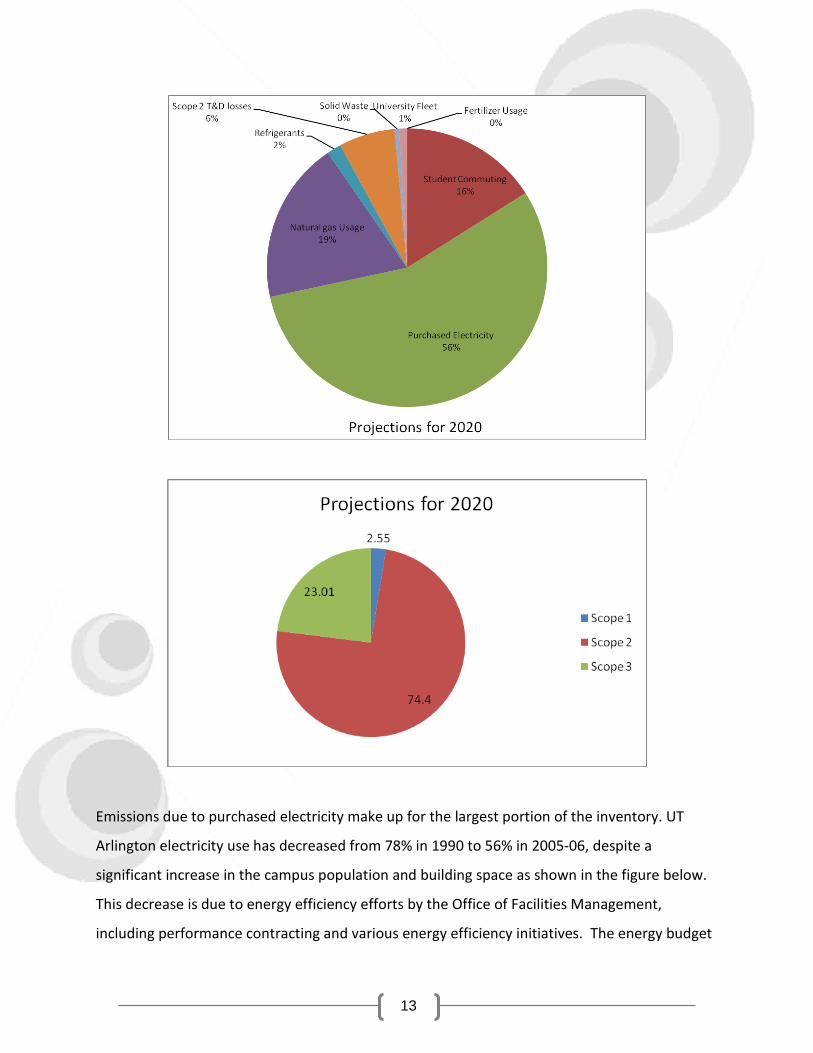
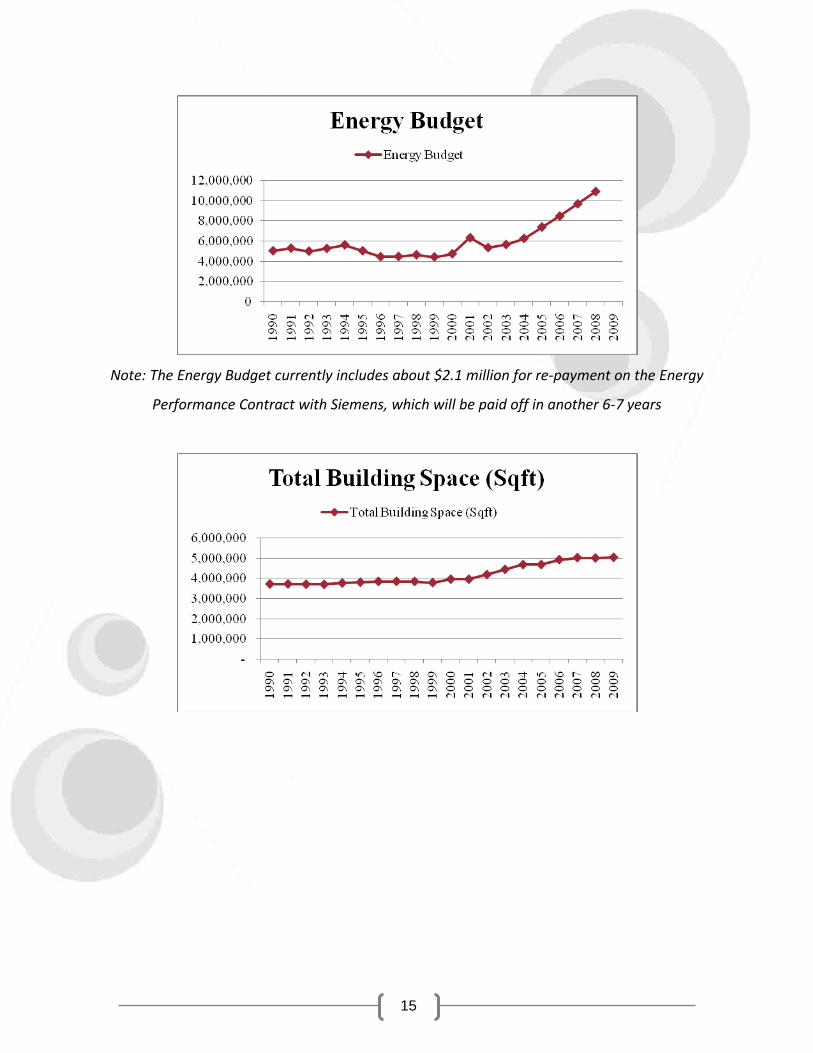
Emissions due to purchased electricity make up for the largest portion of the inventory. UT
Arlington electricity use has decreased from 78% in 1990 to 56% in 2005-06, despite a
significant increase in the campus population and building space as shown in the figure below.
This decrease is due to energy efficiency efforts by the Office of Facilities Management,
including performance contracting and various energy efficiency initiatives. The energy budget
14
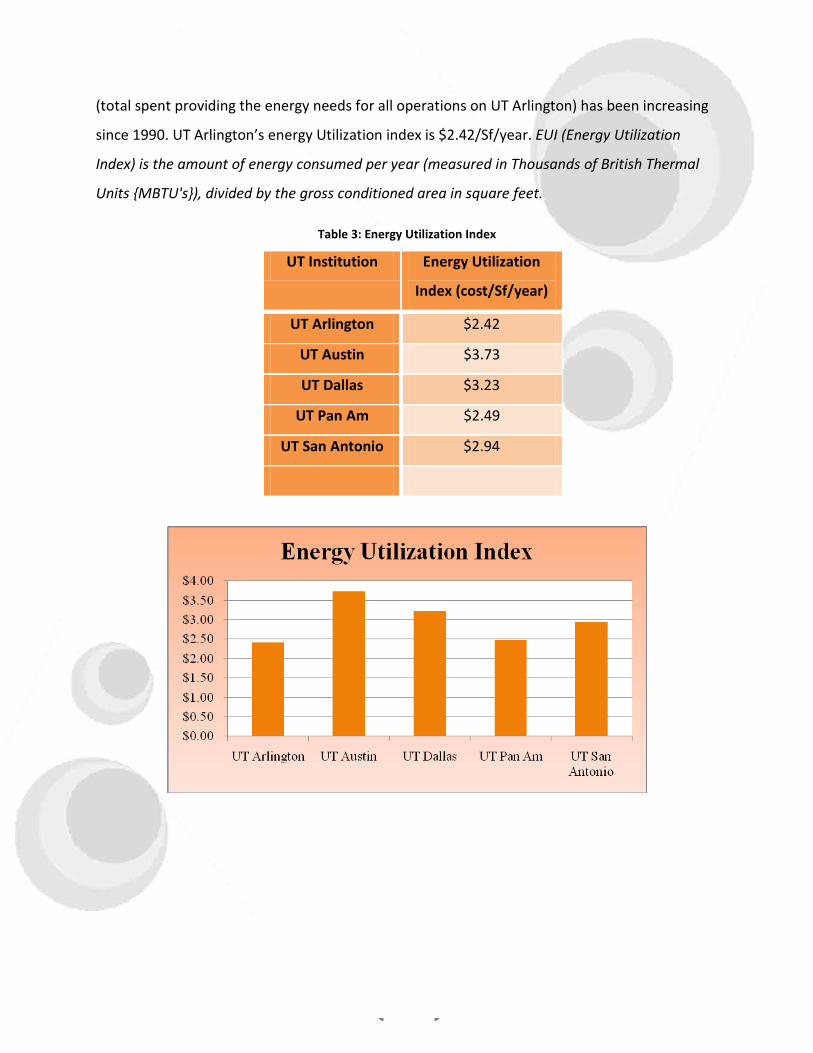
(total spent providing the energy needs for all operations on UT Arlington) has been increasing
since 1990. UT Arlington’s energy Utilization index is $2.42/Sf/year. EUI (Energy Utilization
Index) is the amount of energy consumed per year (measured in Thousands of British Thermal
Units {MBTU's}), divided by the gross conditioned area in square feet.
Table 3: Energy Utilization Index
UT Institution Energy Utilization
Index (cost/Sf/year)
UT Arlington $2.42
UT Austin $3.73
UT Dallas $3.23
UT Pan Am $2.49
UT San Antonio $2.94
15
Note: The Energy Budget currently includes about $2.1 million for re-payment on the Energy
Performance Contract with Siemens, which will be paid off in another 6-7 years
16
As seen from these three pie and line graphs, Scope 2 Emissions which includes purchased
electricity, steam and chilled water is projected to be 74.4 % for 2020 as compared to 76.29%
for 2007-08. As emphasized earlier, this is because of conservations and energy efficiency
measures despite growing population and building space.
The Scope 1 Emissions are the direct emissions from On-Campus Stationary sources, direct
transportation sources, refrigeration and chemicals, and agriculture. Fertilizer application
makes up for such a small percentage of the total emissions, that it could be classified as de
17
minimus source and not tracked for future inventories. Direct transportation sources, which
include the emissions from the University fleet decreased from 4.53 % in 2005-06 to 0.94% in
2007-08. It is projected to increase in 2020 to 2.55% as the University grows and the building
space and campus population increases. Having more electric/hybrid, CNG vehicles on campus
will help reduce these emissions.
Scope 3 Emissions includes solid waste, faculty air travel, commuting, transportation and
distribution losses from purchased electricity, etc. It shows a progressive increase in emissions
from 2005-06 to 2007-08 and 2020. Transportation data collection was the most difficult task of
the entire inventory. Historic data was sparse at best, and several assumptions were necessary.
Based on campus population numbers and information from the Institutional Research,
Planning and Effectiveness office, we can assume a steady increase in commuter emissions.
Promoting and offering car sharing, car pooling, and bike and hike program in the coming years
can help reduce these emissions. We will revisit these findings in the future after we have
access to more data on air travel by faculty and faculty/staff commute.
Solid waste is also an integral part of Scope 3 Emissions. The data for solid waste reductions has
not been collected or tracked. No historic data is available for this indicator. The data was
available for 2006-07 and 2007-08. We will revisit these findings in future if we get information
on historic data. Going forward it will be beneficial to track the numbers more efficiently and
correctly.
18
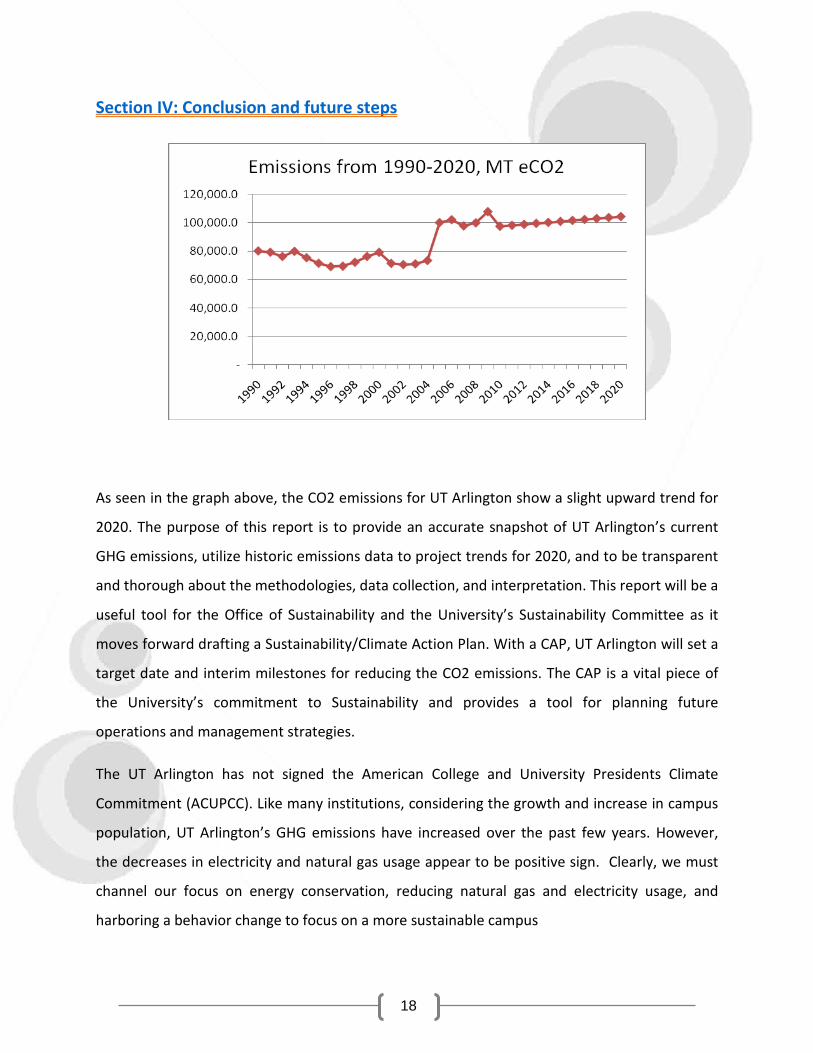
Section IV: Conclusion and future steps
As seen in the graph above, the CO2 emissions for UT Arlington show a slight upward trend for
2020. The purpose of this report is to provide an accurate snapshot of UT Arlington’s current
GHG emissions, utilize historic emissions data to project trends for 2020, and to be transparent
and thorough about the methodologies, data collection, and interpretation. This report will be a
useful tool for the Office of Sustainability and the University’s Sustainability Committee as it
moves forward drafting a Sustainability/Climate Action Plan. With a CAP, UT Arlington will set a
target date and interim milestones for reducing the CO2 emissions. The CAP is a vital piece of
the University’s commitment to Sustainability and provides a tool for planning future
operations and management strategies.
The UT Arlington has not signed the American College and University Presidents Climate
Commitment (ACUPCC). Like many institutions, considering the growth and increase in campus
population, UT Arlington’s GHG emissions have increased over the past few years. However,
the decreases in electricity and natural gas usage appear to be positive sign. Clearly, we must
channel our focus on energy conservation, reducing natural gas and electricity usage, and
harboring a behavior change to focus on a more sustainable campus
19
Considering UT Arlington’s commitment to sustainability and energy conservation efforts, it is
in UT Arlington’s best interest to identify measures and strategies to reduce the carbon
footprint over the coming years as seen by the increasing trend in the graph. Kyoto mandates
7% reductions below 1990 levels by 2012. Using the emissions inventory as a guideline, the
University’s Sustainability Committee will work to prepare a comprehensive plan for campus
sustainability, including interim objectives and targets
20
Acknowledgements
This report required cooperation from many people, most of whom are very busy with their
regular duties and responsibilities. Thank you to everyone for taking the time to help prepare
an accurate and thorough measurement of our campus greenhouse gas emissions, and to
President James Spaniolo and Vice President John Hall for their support and insight to commit
the university to addressing long term planning and implementation of sustainability initiatives
on campus.
Our Sincere thanks to:
Office of the President
Office of Facilities Management
Arlington Regional Data Center
Office of Human Resources
Procurement Services
UT ARLINGTON Library
School of Urban Planning and Affairs
Department of Finance and Administration
Vinodh Valluri- MS in Environmental & Earth Sciences, UT Arlington
Jeff Howard - Asst. Professor, School of Urban & Public Affairs
Megan Topham - Director of Operations, UT Arlington Fort Worth Center
Nicholas Stefkovich- Republic Services
Top Related