


Languages
Pages
Legal


This page is left blank intentionally. Please print this plan using the double-sided printer setting.
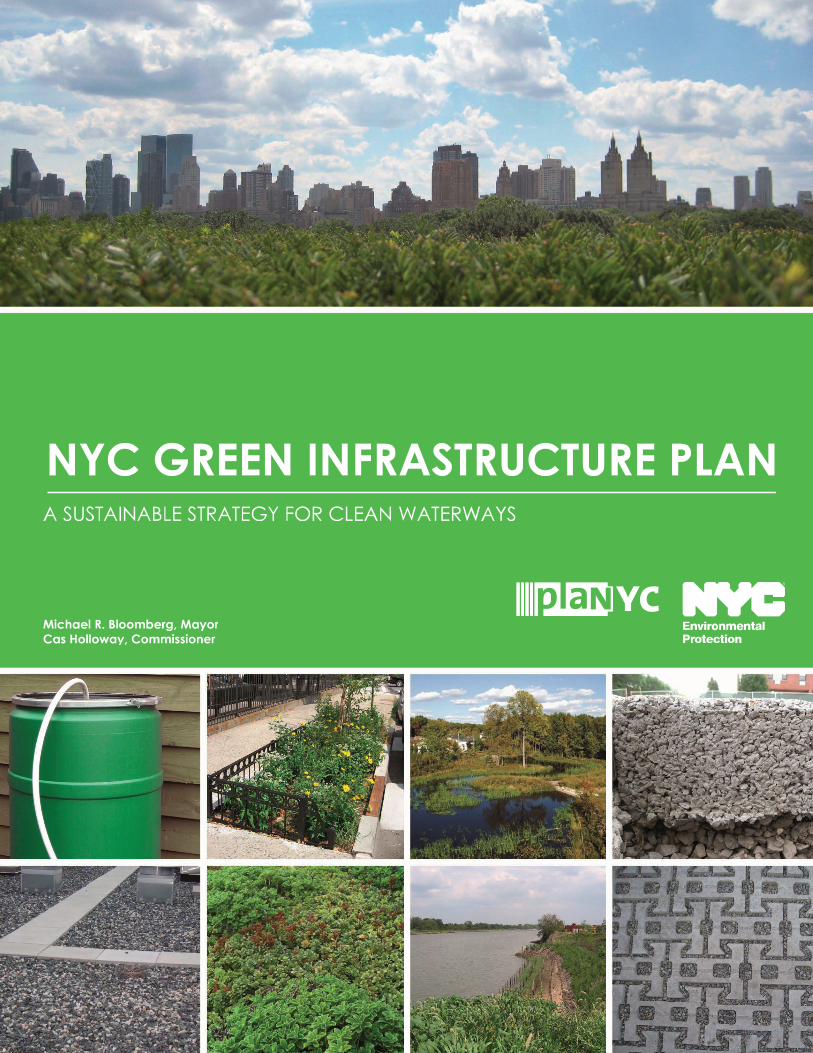
Green infrastructure photographs (clockwise, starting from the top-left): rain barrel, enhanced
tree pit, Staten Island Bluebelt, porous concrete sidewalk, porous pavers, restored wetland,
green roof, blue roof
Credit: Topmost cover photograph taken by Nancy Hey; all others taken by DEP employees.

[Ty
pe
the
do
cu
me
nt
ti-
tle]
i
i
Dear Friends:
Cleaning up New York City’s rivers, creeks, and coastal waters has been a top priority for our
Administration, and the pace of progress has increased dramatically over the past several
years. Since 2002, the City has invested more than $6 billion in water quality, and key indicators
show that New York Harbor is the cleanest and healthiest it’s been in more than a century. But
to open as much of our waterfront as possible to recreation and development, we need a
long-term plan to manage the stormwater that can overwhelm our combined sewer system
when it rains, impairing water quality in the harbor and its tributaries.
To succeed, any plan must be effective and affordable, and the 8.4 million New Yorkers who
will pay for it must see and feel its benefits. The NYC Green Infrastructure Plan will achieve that
goal. Based on years of study and our experience with new technologies, we know that green
infrastructure—advanced street-tree pits, porous pavements and streets, green and blue roofs,
and many other stormwater controls—can improve water and air quality, help to cool the City,
reduce energy bills and greenhouse gas emissions, increase property values, and beautify our
communities. And we can achieve all of these benefits for billions of dollars less than the cost of
the traditional tanks and tunnels that are useful only when it rains.
The NYC Green Infrastructure Plan continues the implementation of PlaNYC, not only by
improving water quality, but by helping the City achieve cleaner air and greener streets, and
we look forward to working with the New York State Department of Environmental
Conservation and the U.S. Environmental Protection Agency to make our plan a reality. The
unprecedented scale of this plan and our commitment to implement it will put the City at the
forefront of stormwater management, and ensure our progress toward a greener, greater New
York.
Sincerely,
Michael R. Bloomberg
Mayor
THE C I TY OF NEW Y ORK
O FF ICE OF THE MAYOR
NEW Y ORK , NY 10007
[Ty
pe
the
do
cu
me
nt
ti-
tle]
ii
ii
AMR Automated Meter Reading
ARRA American Recovery and Reinvestment Act
BID Business Improvement District
BMP Best Management Practice
CAC Citizens Advisory Committee
CAPA City Administrative Procedure Act
CSO combined sewer overflow
DCP New York City Department of City Planning
DEC New York State Department of Environmental Conservation
DEP New York City Department of Environmental Protection
DDC New York City Department of Design & Construction
DOB New York City Department of Buildings
DOE New York City Department of Education
DOT New York City Department of Transportation
DPR New York City Department of Parks & Recreation
EPA United States Environmental Protection Agency
FOG fat, oil, and grease
HPD New York City Department of Housing Preservation & Department
LTCP Long Term Control Plan
MTA New York City Metropolitan Transit Authority
NYCHA New York City Housing Authority
OMB New York City Office of Management and Budget
SCADA Supervisor Control and Data Acquisition
RCNY Rules of the City of New York
ROW Right-of-Way
WWFP Waterbody Watershed Facility Plan
WWTP Wastewater Treatment Plant
ACRONYMS
[Ty
pe
the
do
cu
me
nt
ti-
tle]
EXECUTIVE SUMMARY
1
1
EXECUTIVE SUMMARY
New York City’s efforts to improve water quality are a critical part of PlaNYC, Mayor
Bloomberg’s blueprint for a greener, greater city. Already the Harbor is cleaner than it has
been in over 100 years, and millions of people enjoy the City’s waterfront and waterways every
year, thanks in part to the New York City Department of Environmental Protection’s (DEP’s)
investment of billions of dollars in sewer and wastewater treatment plant upgrades. But in those
waterbodies that do not yet meet water quality standards for pathogens, the biggest
remaining challenge is to further reduce combined sewer overflows (CSOs) that discharge a
mixture of untreated sewage and stormwater runoff when it rains. Traditional approaches to
reduce CSOs further would include the construction of additional, large infrastructure, but the
remaining opportunities for such construction are very expensive, and do not provide the
sustainability benefits that New Yorkers rightly expect from multi-billion dollar investments of
public funds.
This Green Infrastructure Plan presents an alternative approach to improving water quality that
integrates ―green infrastructure,‖ such as swales and green roofs, with investments to optimize
the existing system and to build targeted, smaller-scale ―grey‖ or traditional infrastructure. This is
a multi-pronged, modular, and adaptive approach to a complicated problem that will provide
widespread, immediate benefits at a lower cost. The green infrastructure component of this
strategy builds upon and reinforces the strong public and government support that will be nec-
essary to make additional water quality investments. A critical goal of the green infrastructure
component is to manage runoff from 10% of the impervious surfaces in combined sewer water-
sheds through detention and infiltration source controls.
New York City’s ―Green Strategy‖ is nimble enough to incorporate new technologies and ap-
proaches as they emerge during the implementation of our plan. DEP will preserve its ability to
pursue larger grey infrastructure if necessary and appropriate in the event that the Green
Strategy cannot achieve water quality objectives in a particular drainage area. Promoting
green infrastructure has been endorsed by the U.S. Environmental Protection Agency (EPA)
and the New York State Department of Environmental Conservation (DEC). Under Administrator
Lisa Jackson, EPA has testified that green infrastructure is an ―effective response to a variety of
environmental challenges that is cost-effective, sustainable, and provides multiple desirable
environmental outcomes.‖ (Testimony before the U.S. House of Representatives, Committee on
Transportation and Infrastructure, Subcommittee on Water Resources and Environment, March
19, 2009)
In fact, this approach is not so new — the City and its partners have a long track record of suc-
cessfully meeting water quality standards with natural solutions that have substantial, quantifia-
ble co-benefits. For example, in our Catskill and Delaware watersheds, the City, EPA, New York
State, and community and environmental groups came together and agreed that preserving
forested areas and natural buffers was a better way to keep our drinking water clean than rely-
ing upon end-of-the-pipe, energy-intensive filtration systems. Since the City first applied for a
waiver from filtration requirements for the Catskill and Delaware system in 1991, DEP has com-
mitted more than $1.5 billion and dedicated staff to sustain the pristine quality of source waters,
and so far has eliminated the need for a filtration plant that would cost $10 billion or more.
These commitments are included in the Filtration Avoidance Determinations issued by EPA and
EXECUTIVE SUMMARY
[Ty
pe
the
do
cu
me
nt
ti-
tle]
2
2
implemented by DEP and its watershed partners, including New York State, watershed towns,
and civic organizations. Similarly, since the early 1990s DEP has relied upon wetlands and natu-
ral areas in our Bluebelt system in Staten Island to absorb stormwater runoff from streets, thereby
eliminating the need for costly sewer systems.
In 2007, PlaNYC committed the City to build more Bluebelts and Greenstreets, to require green
parking lots, to incentivize green roofs, and to form an Inter-agency Best Management
Practices Task Force. The Sustainable Stormwater Management Plan issued by that Task Force
in 2008 concluded that green infrastructure was feasible in many areas in the city and could be
more cost-effective than certain large infrastructure projects such as CSO storage tunnels. This
Green Infrastructure Plan builds on the Sustainable Stormwater Management Plan and propos-
es to continue coordination among City agencies to build green infrastructure projects. This ef-
fort will be led by the Mayor’s Office and DEP, and will include collaboration with many City
agencies, including the Department of Transportation (DOT), the Department of Parks and
Recreation (DPR), the Department of Design and Construction (DDC), the Department of City
Planning (DCP), the Department of Education (DOE), the Department of Sanitation (DSNY), the
Department of Citywide Administrative Services (DCAS), the Department of Housing and
Preservation and Development (HPD), the New York City Economic Development Corporation
(EDC), and the New York City Housing Authority (NYCHA).
This Green Infrastructure Plan builds upon and extends the commitments made in PlaNYC and
the Sustainable Stormwater Management Plan. This plan provides a detailed framework and
implementation plan to meet the twin goals of better water quality in New York Harbor and a
livable and sustainable New York City. The analysis in this Green Infrastructure Plan is based up-
on the predicted impacts of the strategy on CSO volumes in individual watersheds and upon
the City’s estimates of capital and operating costs. Further analysis, which is substantially under
way, will refine the modeling and projections in this report by using more updated geospatial
impervious data, incorporating detention technologies, and assessing the impact of CSO re-
ductions on water quality. It will also present data about the operating costs, maintenance,
and performance of the green infrastructure projects currently underway. This Green
Infrastructure Plan forms a framework for CSO reduction strategies and investments over the
next 20 years and will lead to both clean waterways and a greener, more sustainable city.
The importance of the choice we face as a city and the urgent need for collaborative partner-
ships with our state and federal regulators cannot be overemphasized. The City is facing
tremendous economic challenges and tightly constrained resources while the cost of grey
investments such as 50-million gallon underground storage tanks is significantly increasing and
the marginal contribution of such investments to the achievement of overall water quality
objectives is diminishing. At the same time, PlaNYC and the many studies that guided it made
clear that New Yorkers need and want sustainability benefits such as more open space,
improved air quality, more shade, and increased property values. In this new reality, the City
must strive to get the most water quality and sustainability benefits out of every dollar it invests.
[Ty
pe
the
do
cu
me
nt
ti-
tle]
EXECUTIVE SUMMARY
3
3
The Green Infrastructure Plan
The Green Infrastructure Plan will achieve better water quality and sustainability benefits than
the all-Grey Strategy that is mandated or is currently under consideration by:
Reducing CSO volume by an additional 3.8 billion gallons per year (bgy), or approxi-
mately 2 bgy more than the all-Grey Strategy;
Capturing rainfall from 10% of impervious surfaces in CSO areas through green infra-
structure and other source controls; and
Providing substantial, quantifiable sustainability benefits ‒ cooling the city, reducing en-
ergy use, increasing property values, and cleaning the air ‒ that the current all Grey
Strategy does not provide.
Ultimately the success of this program will be measured by water quality objectives, not by CSO
reductions alone.
The Green Infrastructure Plan has five key components:
1. Build cost-effective grey infrastructure
DEP has already built or is planning to build over $2.9 billion in targeted grey infrastructure to re-
duce CSO volumes (the Cost-Effective Grey Infrastructure Investments). These projects were set
out in Waterbody Watershed Facility Plans (Facility Plans) submitted to the New York State
Department of Environmental Conservation (DEC) pursuant to a consent order.1 For the most
part, these projects are the most cost-effective among a number of alternatives considered.
The cost-effective projects will reduce CSOs by approximately 8.3 bgy compared to the pro-
jected baseline for the year 2045 that was used in the 2007 Facility Plans. The grey investments
planned or underway reduce CSOs at a cost of $0.36 per gallon. These investments are five
times more cost-effective than certain other alternatives that DEP seeks to avoid or defer.2 The
Cost-Effective Grey Infrastructure Investments are presented in greater detail in the chapter on
The Green Infrastructure Plan, especially Tables 6 and 8.
2. Optimize the existing wastewater system
DEP will optimize the existing wastewater system through both targeted and system-wide ca-
pacity enhancements to ensure that it can store as much combined flow as is possible. DEP has
already started a comprehensive assessment of the existing system and its hydraulic capacity
to assess further cost-effective improvements. In the meantime, we are already improving exist-
ing programs by inspecting tide gates, surveying and rehabilitating interceptor sewers, prevent-
ing obstructions and cleaning lateral collection sewers, and identifying inflow and infiltration.
These initiatives include the purchase of two new Vactor trucks and a commitment to rehabili-
tate 136 miles of interceptor sewers within two years. By these additional measures, DEP can re-
duce CSOs by approximately 586 million gallons per year (mgy), and will achieve greater re-
1 Under a 2005 Administrative Consent Order, DEC file no. CO2-20000107-8, as modified by a 2008 Order on Consent, DEC file no. CO2
-2007-0101-1 (the CSO Order or the Consent Order).
2 These are the CSO detention tunnels in the Newtown Creek and Flushing Bay drainage areas, the CSO detention tanks in the
Hutchinson River and Westchester Creek drainage areas, and the wet weather expansions at the 26th Ward and Jamaica WWTPs
(Potential Tanks, Tunnels, and Expansions).
EXECUTIVE SUMMARY
[Ty
pe
the
do
cu
me
nt
ti-
tle]
4
4
ductions from the additional system improvements that will occur as additional areas are sur-
veyed. The Green Infrastructure Plan is DEP's first attempt to integrate those particular elements
into a comprehensive CSO reduction program.
A critical element of wet weather overflows is the base flow of sanitary waste from household
and other uses, which can take up sewer system storage and wastewater treatment plant
(WWTP) capacity that could otherwise be used to convey and treat stormwater. Lower sanitary
flows maximize plant capacity during wet weather. Sanitary flows vary with the overall con-
sumption of water, which has constantly and significantly declined in recent years and will con-
tinue to decline. DEP estimates that continued declines will reduce CSO volumes by approxi-
mately 1.7 bgy, or 8% of overall city CSOs, by 2030. This is nearly equivalent to the CSO reduc-
tions estimated for large grey infrastructure investments that are currently contemplated under
the CSO Order or in future Long Term Control Plans (LTCPs).
Encouraging prudent water use also benefits DEP’s water supply and wastewater treatment
system by reducing wear on infrastructure, chemical costs, energy costs for pumping and treat-
ing flow, and greenhouse gas emissions. These are important considerations because in just a
few years DEP’s energy demand will be 30% greater than today as the ultraviolet disinfection
plant for the Catskill and Delaware systems, and the Croton filtration plant come on line. DEP
will undertake or continue conservation initiatives to ensure reduced flow in future years, includ-
ing completing installation of the Automated Meter Reading (AMR) network and, if feasible,
low flow fixture rebates and other initiatives.
3. Control runoff from 10% of impervious surfaces through green
infrastructure
Green infrastructure is at the core of this plan. The City’s goal is to capture the first inch of rain-
fall on 10% of the impervious areas in combined sewer watersheds through detention or infiltra-
tion techniques over 20 years. By preventing one inch of precipitation from becoming runoff
that surges into the sewers over 10% of each combined sewer watershed’s impervious area,
DEP estimates that CSOs will be reduced by approximately 1.5 bgy. DEP proposes to meet this
goal by achieving 1.5% impervious area capture by 2015, an additional 2.5% by 2020, an addi-
tional 3% by 2025, and the remaining 3% by 2030.
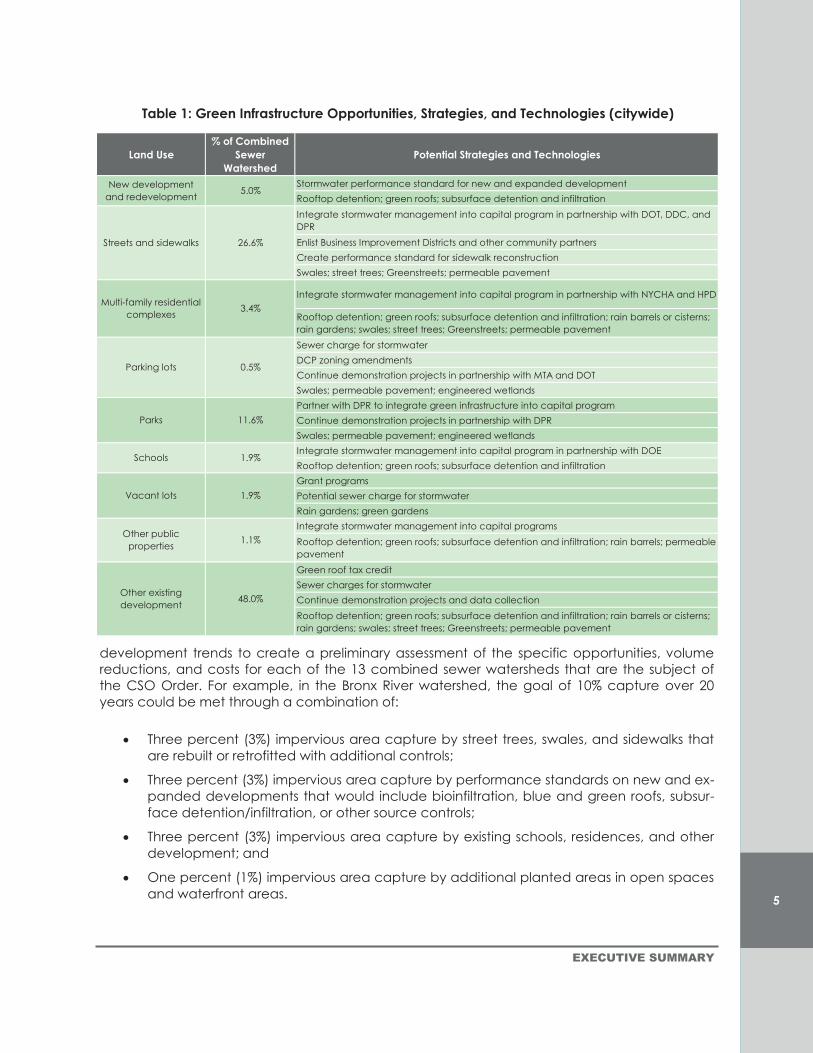
The strategies to achieve the 10% goal vary depending on the type of land use (see Table 1,
following page). DEP’s initial analysis shows that there are significant opportunities to
incorporate green infrastructure in 52% of the land in CSO areas of the City, well more than
needed to meet the 10% capture goal over 20 years. The remaining 48% of the City’s land area
consists of existing development, where stormwater retrofits may also be appropriate but are
more difficult and expensive to build. For a highly urbanized city, the goal of 10% capture over
20 years is ambitious but achievable.
To reach this goal the City will create a Green Infrastructure Task Force to design and build
stormwater controls into planned roadway reconstructions and other public infrastructure pro-
jects. The City is prepared to create a Green Infrastructure Fund and to immediately commit
substantial capital and operating resources to this effort.
The Green Infrastructure Task Force will target investments on a watershed-by-watershed basis.
Already, DEP has completed an unprecedented, detailed analysis of roadway projects and
[Ty
pe
the
do
cu
me
nt
ti-
tle]
EXECUTIVE SUMMARY
5
5
development trends to create a preliminary assessment of the specific opportunities, volume
reductions, and costs for each of the 13 combined sewer watersheds that are the subject of
the CSO Order. For example, in the Bronx River watershed, the goal of 10% capture over 20
years could be met through a combination of:
Three percent (3%) impervious area capture by street trees, swales, and sidewalks that
are rebuilt or retrofitted with additional controls;
Three percent (3%) impervious area capture by performance standards on new and ex-
panded developments that would include bioinfiltration, blue and green roofs, subsur-
face detention/infiltration, or other source controls;
Three percent (3%) impervious area capture by existing schools, residences, and other
development; and
One percent (1%) impervious area capture by additional planted areas in open spaces
and waterfront areas.
Table 1: Green Infrastructure Opportunities, Strategies, and Technologies (citywide)
Land Use
% of Combined
Sewer
Watershed
Potential Strategies and Technologies
Stormwater performance standard for new and expanded development
Rooftop detention; green roofs; subsurface detention and infiltration
Integrate stormwater management into capital program in partnership with DOT, DDC, and
DPR
Enlist Business Improvement Districts and other community partners
Create performance standard for sidewalk reconstruction
Swales; street trees; Greenstreets; permeable pavement
Integrate stormwater management into capital program in partnership with NYCHA and HPD
Rooftop detention; green roofs; subsurface detention and infiltration; rain barrels or cisterns;
rain gardens; swales; street trees; Greenstreets; permeable pavement
Sewer charge for stormwater
DCP zoning amendments
Continue demonstration projects in partnership with MTA and DOT
Swales; permeable pavement; engineered wetlands
Partner with DPR to integrate green infrastructure into capital program
Continue demonstration projects in partnership with DPR
Swales; permeable pavement; engineered wetlands
Integrate stormwater management into capital program in partnership with DOE
Rooftop detention; green roofs; subsurface detention and infiltration
Grant programs
Potential sewer charge for stormwater
Rain gardens; green gardens
Integrate stormwater management into capital programs
Rooftop detention; green roofs; subsurface detention and infiltration; rain barrels; permeable
pavement
Green roof tax credit
Sewer charges for stormwater
Continue demonstration projects and data collection
Rooftop detention; green roofs; subsurface detention and infiltration; rain barrels or cisterns;
rain gardens; swales; street trees; Greenstreets; permeable pavement
Other public
properties1.1%
Parks 11.6%
Other existing
development48.0%
1.9%Vacant lots
Parking lots 0.5%
Schools 1.9%
New development
and redevelopment5.0%
Streets and sidewalks 26.6%
Multi-family residential
complexes3.4%
EXECUTIVE SUMMARY
[Ty
pe
the
do
cu
me
nt
ti-
tle]
6
6
To accelerate the implementation of green infrastructure, DEP is building more than 20 demon-
stration projects in collaboration with other city agencies and local authorities, including DPR,
DOT, DOE, NYCHA, and MTA. These demonstration projects are testing techniques that are
appropriate for a variety of land uses:
Blue roofs and green roofs for rooftop stormwater detention and retention;
Porous pavement for parking lots;
Tree pits, streetside swales, and porous pavement for roadways;
Greenstreets, medians, and curbside extensions for roads;
Constructed wetlands and swales for parks;
A variety of these techniques for high density multi-family housing; and
Rain barrels for low density single family housing.
4. Institutionalize adaptive management, model impacts, measure
CSOs, and monitor water quality
This Green Infrastructure Plan is an adaptive management strategy ‒ an iterative, flexible deci-
sion-making process where incremental measures are continually evaluated and rejected or
improved. This process produces better decisions about investments and overall resource allo-
cation to achieve water quality objectives. Already, DEP has adjusted its approach to incorpo-
rate conservation strategies. An adaptive management approach is essential given the magni-
tude of investment required to manage stormwater and the wide range of uncertainties about
future conditions, including climate, rainfall, population, water demand, land use, technology,
and regulatory requirements. The effectiveness of adaptive management depends upon DEP’s
ability to measure performance. Accordingly, DEP will recalibrate its sewer system model using
new and better impervious data and recently updated wastewater flow projections and will
model the effects of a combination of detention and infiltration strategies on water quality. DEP
will also assess the hydraulic capacities of the sewer system in key drainage areas.
DEP will monitor CSO events by three methods ‒ water elevation monitoring at Tier 1, 2, and 3
CSO outfalls, flows measured at DEP wastewater treatment plants, and flows measured from
CSO detention facilities ‒ that will enable us to monitor up to 90% of CSO flow volume citywide.
DEP is also seeking to develop the technology necessary to measure actual flows at CSO out-
falls. Finally, DEP will gauge improvements in pathogen concentrations resulting from implemen-
tation of the Green Infrastructure Plan by building upon its network of 57 monitoring stations
across the harbor increasing the number of sampling sites at the mouths of key tributaries.
5. Engage and enlist stakeholders
DEP will also take immediate steps to reduce exposure to potentially harmful waters by replac-
ing the signs at all 422 CSO outfalls to reach non-English speakers, and by improving its website
notifications about the risks in recreation after wet weather.
Partnerships with numerous community and civic groups and other stakeholders will be neces-
sary to build and maintain green infrastructure. As part of the development of this plan, DEP
[Ty
pe
the
do
cu
me
nt
ti-
tle]
EXECUTIVE SUMMARY
7
7
had several meetings with environmental groups, city agencies, and other potential partners,
and held a general public meeting to explain its vision for the Green Infrastructure Plan. DEP will
provide resources and technical support so that communities can propose, build, and main-
tain green infrastructure. This is particularly important in environmental justice communities that
need the additional public health and other sustainability benefits of green infrastructure.
Cities around the world are developing innovative ways to meet the needs of growing popula-
tions. To incubate the practical application of advanced techniques and designs, DEP will
sponsor an international forum about green infrastructure.
EXECUTIVE SUMMARY
[Ty
pe
the
do
cu
me
nt
ti-
tle]
8
8
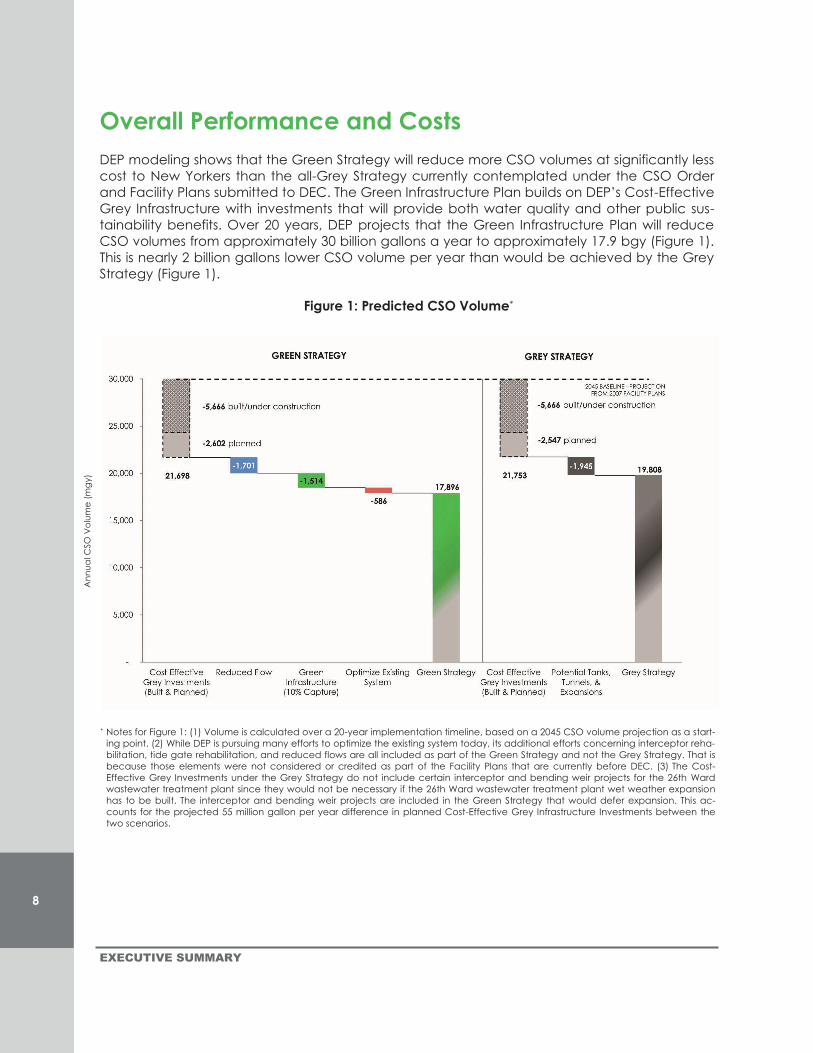
Overall Performance and Costs
DEP modeling shows that the Green Strategy will reduce more CSO volumes at significantly less
cost to New Yorkers than the all-Grey Strategy currently contemplated under the CSO Order
and Facility Plans submitted to DEC. The Green Infrastructure Plan builds on DEP’s Cost-Effective
Grey Infrastructure with investments that will provide both water quality and other public sus-
tainability benefits. Over 20 years, DEP projects that the Green Infrastructure Plan will reduce
CSO volumes from approximately 30 billion gallons a year to approximately 17.9 bgy (Figure 1).
This is nearly 2 billion gallons lower CSO volume per year than would be achieved by the Grey
Strategy (Figure 1).
Figure 1: Predicted CSO Volume*
* Notes for Figure 1: (1) Volume is calculated over a 20-year implementation timeline, based on a 2045 CSO volume projection as a start-
ing point. (2) While DEP is pursuing many efforts to optimize the existing system today, its additional efforts concerning interceptor reha-
bilitation, tide gate rehabilitation, and reduced flows are all included as part of the Green Strategy and not the Grey Strategy. That is
because those elements were not considered or credited as part of the Facility Plans that are currently before DEC. (3) The Cost-
Effective Grey Investments under the Grey Strategy do not include certain interceptor and bending weir projects for the 26th Ward
wastewater treatment plant since they would not be necessary if the 26th Ward wastewater treatment plant wet weather expansion
has to be built. The interceptor and bending weir projects are included in the Green Strategy that would defer expansion. This ac-
counts for the projected 55 million gallon per year difference in planned Cost-Effective Grey Infrastructure Investments between the
two scenarios.
An
nu
al C
SO
Vo
lum
e (
mg
y)
[Ty
pe
the
do
cu
me
nt
ti-
tle]
EXECUTIVE SUMMARY
9
9
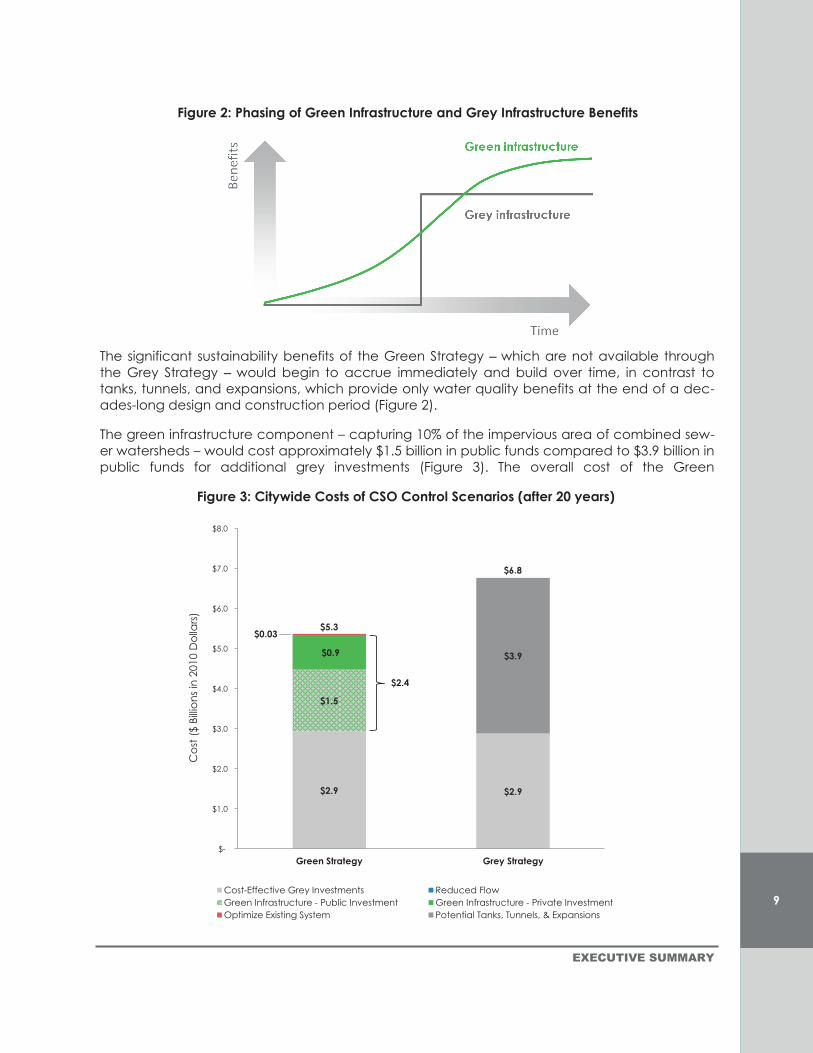
The significant sustainability benefits of the Green Strategy ‒ which are not available through
the Grey Strategy ‒ would begin to accrue immediately and build over time, in contrast to
tanks, tunnels, and expansions, which provide only water quality benefits at the end of a dec-
ades-long design and construction period (Figure 2).
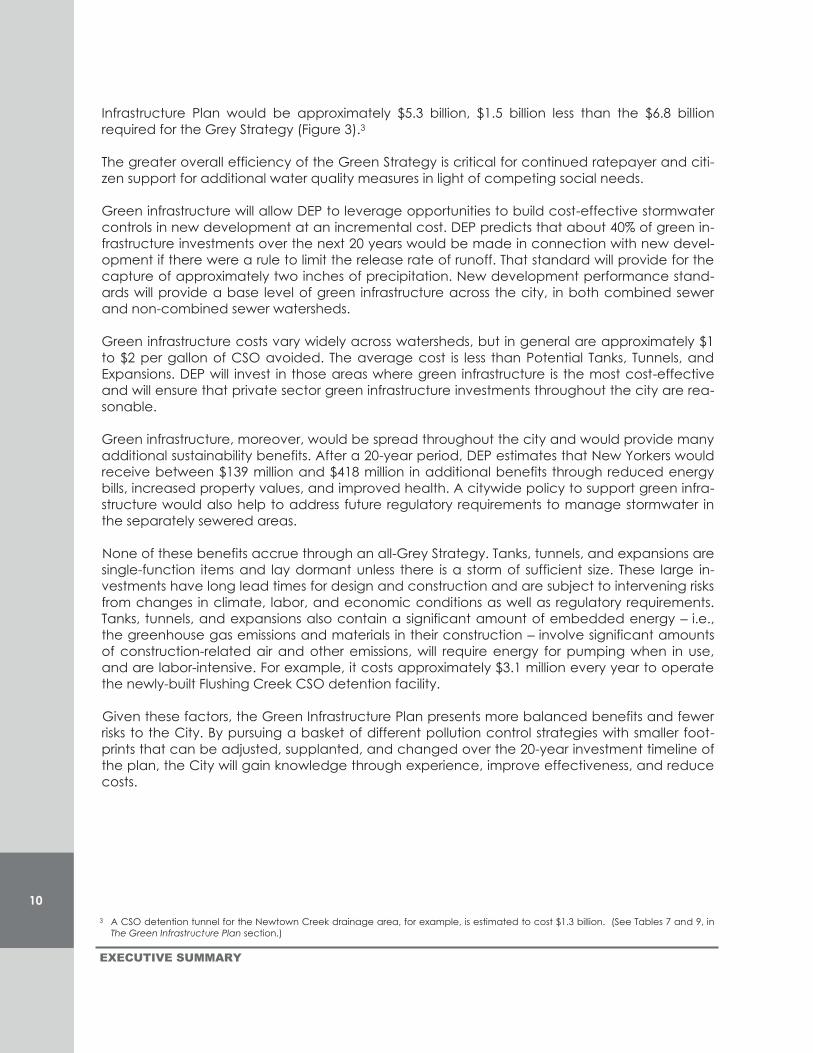
The green infrastructure component – capturing 10% of the impervious area of combined sew-
er watersheds – would cost approximately $1.5 billion in public funds compared to $3.9 billion in
public funds for additional grey investments (Figure 3). The overall cost of the Green
Figure 2: Phasing of Green Infrastructure and Grey Infrastructure Benefits
Figure 3: Citywide Costs of CSO Control Scenarios (after 20 years)
$2.9 $2.9
$1.5
$0.9
$0.03
$3.9
$-
$1.0
$2.0
$3.0
$4.0
$5.0
$6.0
$7.0
$8.0
Green Strategy Grey Strategy
Cost-Effective Grey Investments Reduced Flow
Green Infrastructure - Public Investment Green Infrastructure - Private Investment
Optimize Existing System Potential Tanks, Tunnels, & Expansions
$6.8
$5.3
$2.4
Co
st (
$ B
illio
ns
in 2
01
0 D
olla
rs)
EXECUTIVE SUMMARY
[Ty
pe
the
do
cu
me
nt
ti-
tle]
10
10
Infrastructure Plan would be approximately $5.3 billion, $1.5 billion less than the $6.8 billion
required for the Grey Strategy (Figure 3).3
The greater overall efficiency of the Green Strategy is critical for continued ratepayer and citi-
zen support for additional water quality measures in light of competing social needs.
Green infrastructure will allow DEP to leverage opportunities to build cost-effective stormwater
controls in new development at an incremental cost. DEP predicts that about 40% of green in-
frastructure investments over the next 20 years would be made in connection with new devel-
opment if there were a rule to limit the release rate of runoff. That standard will provide for the
capture of approximately two inches of precipitation. New development performance stand-
ards will provide a base level of green infrastructure across the city, in both combined sewer
and non-combined sewer watersheds.
Green infrastructure costs vary widely across watersheds, but in general are approximately $1
to $2 per gallon of CSO avoided. The average cost is less than Potential Tanks, Tunnels, and
Expansions. DEP will invest in those areas where green infrastructure is the most cost-effective
and will ensure that private sector green infrastructure investments throughout the city are rea-
sonable.
Green infrastructure, moreover, would be spread throughout the city and would provide many
additional sustainability benefits. After a 20-year period, DEP estimates that New Yorkers would
receive between $139 million and $418 million in additional benefits through reduced energy
bills, increased property values, and improved health. A citywide policy to support green infra-
structure would also help to address future regulatory requirements to manage stormwater in
the separately sewered areas.
None of these benefits accrue through an all-Grey Strategy. Tanks, tunnels, and expansions are
single-function items and lay dormant unless there is a storm of sufficient size. These large in-
vestments have long lead times for design and construction and are subject to intervening risks
from changes in climate, labor, and economic conditions as well as regulatory requirements.
Tanks, tunnels, and expansions also contain a significant amount of embedded energy ‒ i.e.,
the greenhouse gas emissions and materials in their construction ‒ involve significant amounts
of construction-related air and other emissions, will require energy for pumping when in use,
and are labor-intensive. For example, it costs approximately $3.1 million every year to operate
the newly-built Flushing Creek CSO detention facility.
Given these factors, the Green Infrastructure Plan presents more balanced benefits and fewer
risks to the City. By pursuing a basket of different pollution control strategies with smaller foot-
prints that can be adjusted, supplanted, and changed over the 20-year investment timeline of
the plan, the City will gain knowledge through experience, improve effectiveness, and reduce
costs.
3 A CSO detention tunnel for the Newtown Creek drainage area, for example, is estimated to cost $1.3 billion. (See Tables 7 and 9, in
The Green Infrastructure Plan section.)
[Ty
pe
the
do
cu
me
nt
ti-
tle]
EXECUTIVE SUMMARY
11
11
Next steps
To implement this Green Infrastructure Plan, the City is prepared to spend up to $1.5 billion over
20 years, including approximately $187 million in capital funds over the next four years, to build
green infrastructure. These commitments depend upon acceptance by DEC and EPA of the
Green Infrastructure Plan as an alternative to the current all-Grey Strategy that costs billions
more, reduces less CSO volume, and foregoes sustainability co-benefits. Additional grey infra-
structure should be pursued only if more effective and beneficial green infrastructure invest-
ments fail. The City seeks to immediately engage with DEC to incorporate the Green
Infrastructure Plan into the existing CSO Order and the 14 separate LTCPs required by 2017. DEP
will also work with the EPA, community leaders, environmental groups, and other stakeholders
to seek consensus on the scope and duration of our green infrastructure commitments.
Over the next year, the City will take a number of concrete steps to begin early implementa-
tion of the Green Infrastructure Plan. These actions include:
1. Preparing a Green Infrastructure Fund;
2. Creating an inter-agency partnership – the Green Infrastructure Task Force – to incorpo-
rate stormwater management into roadway, sidewalk, and other capital projects and to
provide for the maintenance of green infrastructure;
3. Building green infrastructure demonstration projects on a variety of land uses;
4. Partnering with community groups to develop programs for the construction and
maintenance of green infrastructure;
5. Launching a comprehensive program to increase optimization of the existing system, in-
cluding drainage plans, hydraulic studies, the survey and rehabilitation of 136 miles of in-
terceptor sewers in two years, the inspection and repair of tide gates, and programs to
prevent grease from obstructing the sewers;
6. Developing a stormwater management standard for new construction and redevelop-
ment that expands existing development;
7. Piloting sewer charges for stormwater for stand-alone parking lots;
8. Refining DEP models by including new impervious cover data and extending predictions
to ambient water quality;
9. Identifying other funding for additional elements of the Green Infrastructure Plan; and
10. Replacing all CSO outfall signs to reduce potential exposure.

Top Related