


Languages
Pages
Legal

34
Green food consumption in China: segmentation based on attitudes
towards food safety
Breda McCarthy8, Hong-Bo Liu9, Tingzhen Chen10
8 Dr. Breda McCarthy, Lecturer, Department of Economics and Marketing, James Cook University. * [email protected] 9 Dr. Hong-Bo Liu, Lecturer, Department of Economics and Marketing, James Cook University. 10 Dr. Tingzhen Chen, Lecturer, Department of Economics and Marketing, James Cook University.
35
Abstract
The prevalence of food scares in China has led to acute, public concern with food safety. This has
led to demand for both certified organic and green food, a segment that refers to pesticide-reduced
food. The objectives of this paper are twofold; firstly, to examine the demographic factors that drive
demand for green food, and secondly, to segment Chinese consumers based on their attitudes
towards food safety. An online survey was used to collect consumer behaviour information. A total
of 402 responses were obtained covering 24 provinces and municipalities in China. Binary probit
analysis, ANOVA analysis, and cluster analysis are used in this paper. Income, education, age,
gender, presence of young children, household size and overseas experience are variables that have
an impact on green food purchase. Young, wealthy males, who have young children and live in a
small household, are likely to buy green food. The survey shows that Chinese consumers are willing
to pay a price premium for green food; however price will be a major factor restricting the growth of
the green food label in China, given market prices. Three segments, the “distrustful consumer”, the
“ambivalent” and the “trusting consumer” are identified for market segmentation purposes. Market
segmentation, based on attitudes, was found to be related to green food purchase. The contribution
of the paper includes identifying the determinants of green food purchase and providing some
insights into market segmentation. A key task for actors involved in the food supply chain in China
is to provide more information to consumers on food safety and the green label. Avenues for future
research are outlined in the paper.
Keywords: food safety, green food market, China, factors influencing green food purchase,
probit/logit model.
36
Introduction
Frequent food scares and the widespread use of pesticides in Chinese agriculture has led to the
expansion of the green food market in China. The “green food” brand is popular and readily
available in China (Zhou et al., 2004). Green food refers to a certification scheme that is unique to
China and it is comparable to, but differs from, organic products (Marchesini, Hasimu and Spadoni,
2010). The label (see Figure 1) refers to the “controlled and limited use of synthesized fertiliser,
pesticide, growth regulator, livestock and poultry feed additive and gene engineering technology”
(Liu, Pieniak and Verbeke, 2013:94). The primary driver of demand for green food is the lack of
confidence in the safety and quality of Chinese produce (Morgan and Wright, 2014), along with
improvement in living standards and the expansion of the middle class (Zhang & Han, 2009; Zhong
& Yi, 2010; Sun & Mu, 2012). The prevalence of food safety scandals, such as the outbreak of the
melamine food scandal in the dairy industry (Geng, Trienekens & Wubben, 2013), had led the
Chinese central government to strongly support the green food market. Although China has plenty
food safety regulations, enforcement is weak. Developing countries like China are said to lack the
institutional and technical resources to rigorously monitor and enforce food safety standards (Jin,
Lin & Yao, 2011). From a marketing perspective, it is critical to understand consumers, their needs,
attitudes and behaviours. Although the literature on green food is expanding, market segmentation
studies are rare. The purpose of this paper is to: (1) examine how the green food market can be
segmented based on behavioural and demographic bases, and (2) to identify the determinants of
green food purchase. This study contributes to the growing body of research on green food
consumption in China.
Figure 1: Chinese Green Food Certification Sign (A Level)

37
The number of studies conducted on Chinese consumers and green food is small but growing. Liu,
Pieniak and Verbeke (2013) have provided a review of the literature on safe food, focusing on
consumer attitudes and behaviour, such as purchase intent and willingness to pay. Their findings
show that Chinese consumers have high awareness of safe food, but limited knowledge about safe
food. Despite this, attitudes towards safe food are positive and Chinese consumers are willing to pay
more for safe food. There is strong support for demographic profiling in these studies. Chinese
studies show that gender, age, family size and average household income per year, are the main
socio-economic factors influencing willingness to pay for green food (Xia & Zeng, 2007; Xia &
Zeng, 2008). Market segmentation studies on the organic food market are very common in well
developed markets (Chen, 2010; Gil, Gracia and Sanchez, 2000). Very few studies have sought to
segment the Chinese green food market, apart from one segmentation study on organic food
consumers based on lifestyle (Lobo and Chen, 2012), a study on genetically modified food (Zhang
et al., 2010) and segmentation studies of the food market in general (Zhang et al., 2008). This study
adds to the literature on green food by investigating whether segments exist based on attitudes
towards food safety.
Research Design
The population of interest was consumers of green food in urban China. The survey instrument was
originally developed in English and translated into Chinese. The survey contained a section on
socio-demographic information and it covered purchase motivations, sources of information used in
decision-making, outlets used to buy food, willingness to pay a premium for green food and
consumer attitudes towards food safety. The survey was pilot tested on a convenience sample. Based
on feedback from the participants, some questions were reworded to avoid ambiguity.
An online and paper-based survey was conducted in 2014. The internet was used to save time and
money and access a large number of participants (Sue and Ritter, 2007). It was seen as appropriate
since China’s usage rate of the internet is growing rapidly and it is a good way of recruiting the
educated and affluent segments of Chinese society (McKinsey Global Institute, 2013). The survey
was promoted by a major online wine merchant. After examining the preliminary results, student
researchers were asked to target older consumers in an attempt to achieve a more balanced sample in
terms of age. A total of 402 consumers responded to the survey.

38
The survey was informed by the literature. A series of 10 statements were used to evaluate attitudes
towards safety. The scale was adapted from Chen (2010) and previously validated by Knight and
Warland (2005) and Henson and Traill (2000). The components attributed to food safety were
channel of distribution and origin (i.e., imported food brands can be trusted, food consumed in
restaurants can be trusted, food sold in supermarkets can be trusted, food sold in farmer’s markets
can be trusted; Chinese food brands can be trusted); government-oriented (green-labelled foods that
are inspected and checked by the Chinese government can be trusted; I trust the government to
ensure that the level of pesticide residues in food is safe); food processing related (I am satisfied that
the additives in food today are not harmful to my health) and personal opinion on overall food safety
(food is not as safe as it used to be; I am not provided with enough information to judge properly
whether food is safe or not). The respondents were asked to rate this set of variables on a 5-point
Likert scale (1= strongly disagree and 5= strongly agree). It must be noted that this survey measured
general attitudes towards food safety and not specific attitudes, such as attitudes towards a particular
behaviour (see Ajzen, 1991).
The logit/probit model
Modelling is used to understand, explain, and predict the choices that are made. To do so, one can
create an economic model of utility derived from the choice of each alternative. Generally, a single
equation limited dependent variable model such as the probit or Logit model may be summarised by
the following equation. Utility is derived from the selection of an alternative by the
individual and that choice is a function of the attributes (e.g., price, quality) of that
alternative to the individual, and the characteristics (e.g., income, educational attainment, presence
of young kids) of the individual. The binary probit/logit model is used for explaining a dichotomous,
dependent variable with the empirical specification formulated in terms of a latent-response
variable. It has been widely used in diverse fields; originally in toxicology, and now it has gained
popularity in econometric analyses (Maddala 1983; Ben-Akiva and Lerman, 1985). In this study, the
dependent variable may take on only two values to indicate whether a consumer wants to buy
organic food or not.
j )0,1( =j
i ),......1( ti =
39
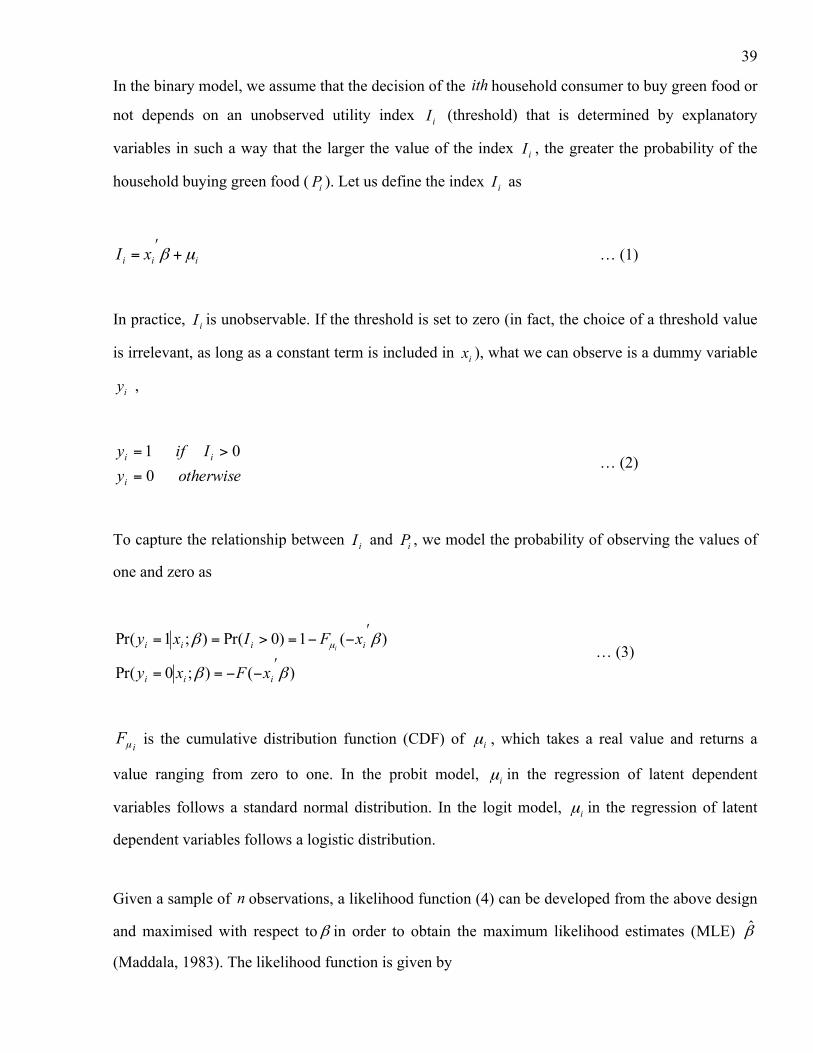
In the binary model, we assume that the decision of the household consumer to buy green food or
not depends on an unobserved utility index (threshold) that is determined by explanatory
variables in such a way that the larger the value of the index , the greater the probability of the
household buying green food ( ). Let us define the index as
… (1)
In practice, is unobservable. If the threshold is set to zero (in fact, the choice of a threshold value
is irrelevant, as long as a constant term is included in ), what we can observe is a dummy variable
,
… (2)
To capture the relationship between and , we model the probability of observing the values of
one and zero as
… (3)
is the cumulative distribution function (CDF) of , which takes a real value and returns a
value ranging from zero to one. In the probit model, in the regression of latent dependent
variables follows a standard normal distribution. In the logit model, in the regression of latent
dependent variables follows a logistic distribution.
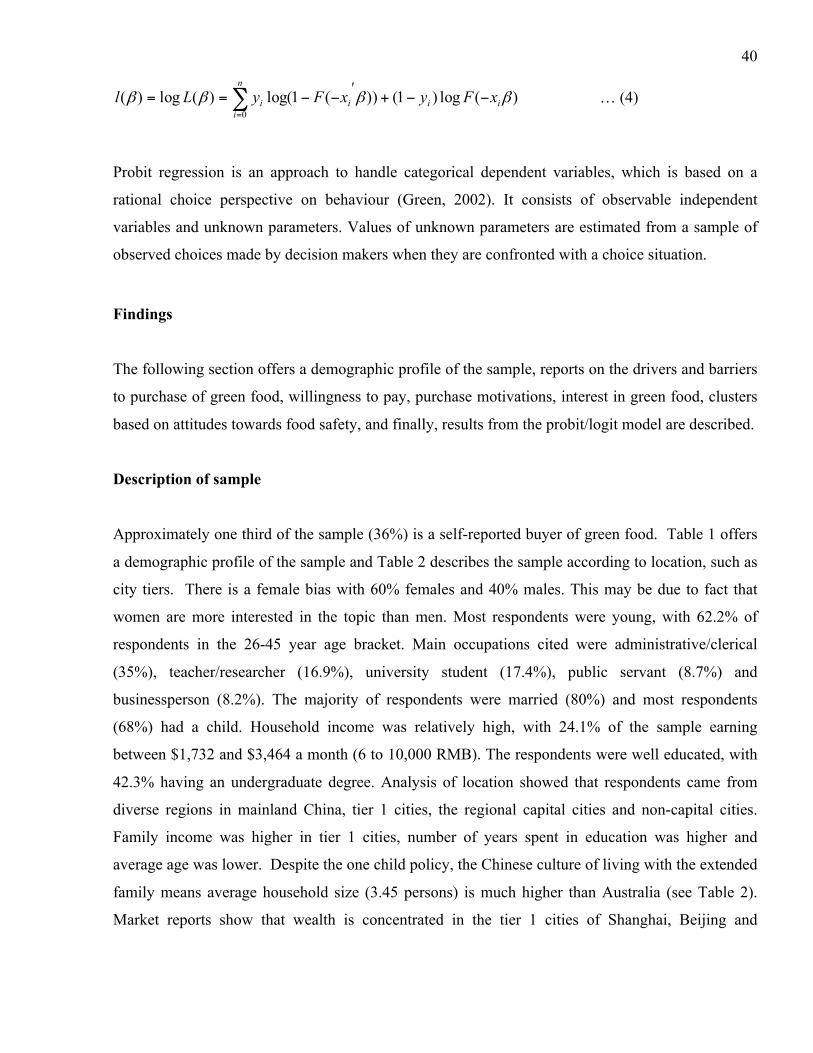
Given a sample of observations, a likelihood function (4) can be developed from the above design
and maximised with respect to in order to obtain the maximum likelihood estimates (MLE)
(Maddala, 1983). The likelihood function is given by
ith
iI
iI
iP iI
iii xI µβ +ʹ′=
iI
ix
iy
otherwiseyIify
i
ii
001
=
>=
iI iP
)();0Pr(
)(1)0Pr();1Pr(
ββ
ββ µ
ʹ′−−==
ʹ′−−=>==
iii
iiii
xFxy
xFIxyi
iFµ iµ
iµ
iµ
n
β β̂
40
… (4)
Probit regression is an approach to handle categorical dependent variables, which is based on a
rational choice perspective on behaviour (Green, 2002). It consists of observable independent
variables and unknown parameters. Values of unknown parameters are estimated from a sample of
observed choices made by decision makers when they are confronted with a choice situation.
Findings
The following section offers a demographic profile of the sample, reports on the drivers and barriers
to purchase of green food, willingness to pay, purchase motivations, interest in green food, clusters
based on attitudes towards food safety, and finally, results from the probit/logit model are described.
Description of sample
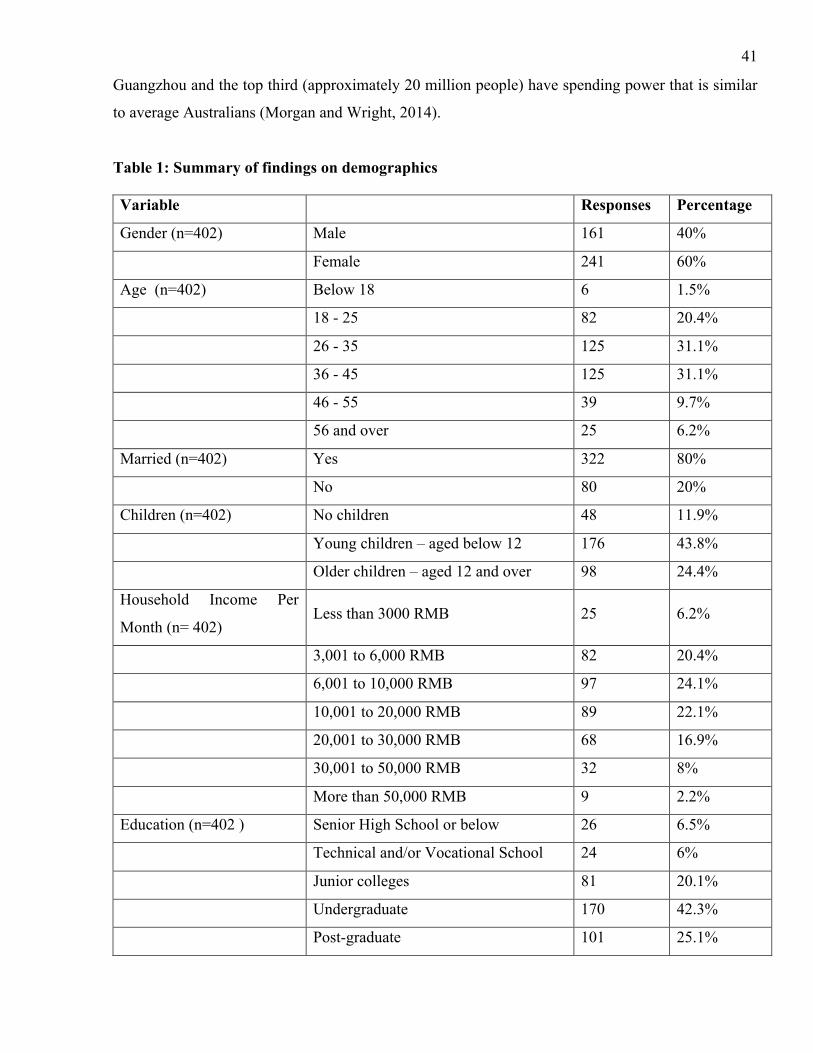
Approximately one third of the sample (36%) is a self-reported buyer of green food. Table 1 offers
a demographic profile of the sample and Table 2 describes the sample according to location, such as
city tiers. There is a female bias with 60% females and 40% males. This may be due to fact that
women are more interested in the topic than men. Most respondents were young, with 62.2% of
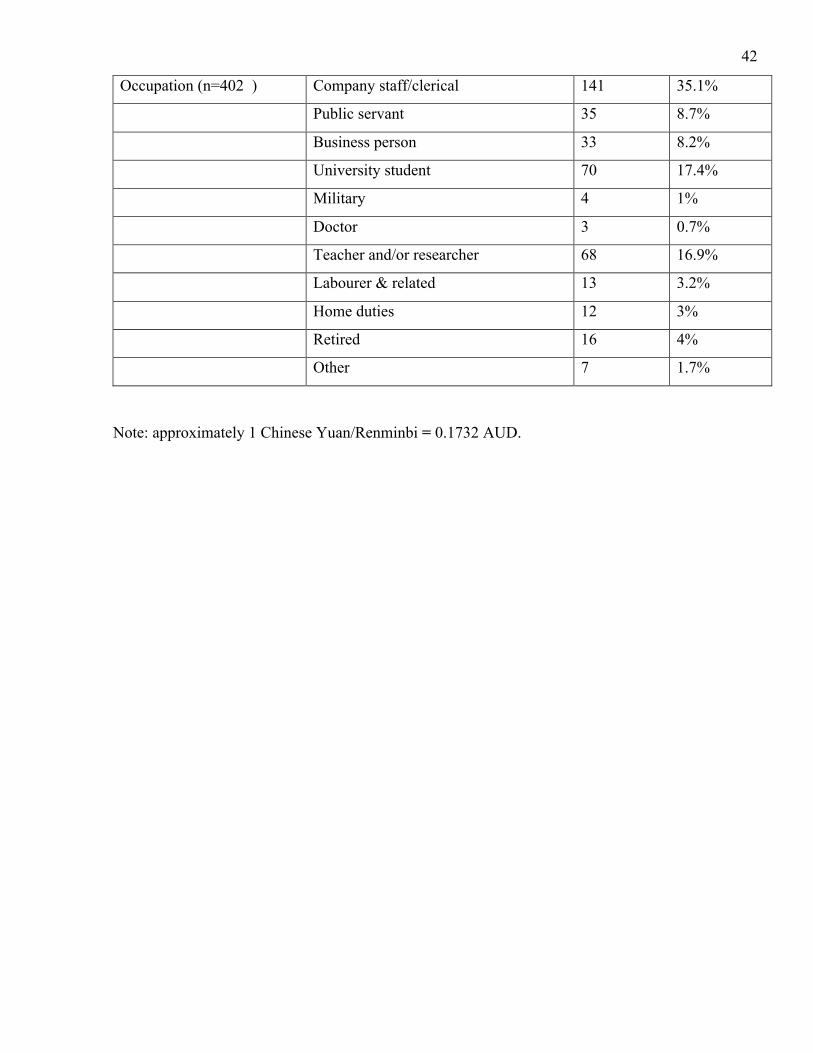
respondents in the 26-45 year age bracket. Main occupations cited were administrative/clerical
(35%), teacher/researcher (16.9%), university student (17.4%), public servant (8.7%) and
businessperson (8.2%). The majority of respondents were married (80%) and most respondents
(68%) had a child. Household income was relatively high, with 24.1% of the sample earning
between $1,732 and $3,464 a month (6 to 10,000 RMB). The respondents were well educated, with
42.3% having an undergraduate degree. Analysis of location showed that respondents came from
diverse regions in mainland China, tier 1 cities, the regional capital cities and non-capital cities.
Family income was higher in tier 1 cities, number of years spent in education was higher and
average age was lower. Despite the one child policy, the Chinese culture of living with the extended
family means average household size (3.45 persons) is much higher than Australia (see Table 2).
Market reports show that wealth is concentrated in the tier 1 cities of Shanghai, Beijing and
∑=
−−+ʹ′−−==n
iiiii xFyxFyLl
0)(log)1())(1log()(log)( ββββ
41
Guangzhou and the top third (approximately 20 million people) have spending power that is similar
to average Australians (Morgan and Wright, 2014).
Table 1: Summary of findings on demographics
Variable Responses Percentage
Gender (n=402) Male 161 40%
Female 241 60%
Age (n=402) Below 18 6 1.5%
18 - 25 82 20.4%
26 - 35 125 31.1%
36 - 45 125 31.1%
46 - 55 39 9.7%
56 and over 25 6.2%
Married (n=402) Yes 322 80%
No 80 20%
Children (n=402) No children 48 11.9%
Young children – aged below 12 176 43.8%
Older children – aged 12 and over 98 24.4%
Household Income Per
Month (n= 402) Less than 3000 RMB 25 6.2%
3,001 to 6,000 RMB 82 20.4%
6,001 to 10,000 RMB 97 24.1%
10,001 to 20,000 RMB 89 22.1%
20,001 to 30,000 RMB 68 16.9%
30,001 to 50,000 RMB 32 8%
More than 50,000 RMB 9 2.2%
Education (n=402 ) Senior High School or below 26 6.5%
Technical and/or Vocational School 24 6%
Junior colleges 81 20.1%
Undergraduate 170 42.3%
Post-graduate 101 25.1%
42
Occupation (n=402 ) Company staff/clerical 141 35.1%
Public servant 35 8.7%
Business person 33 8.2%
University student 70 17.4%
Military 4 1%
Doctor 3 0.7%
Teacher and/or researcher 68 16.9%
Labourer & related 13 3.2%
Home duties 12 3%
Retired 16 4%
Other 7 1.7%
Note: approximately 1 Chinese Yuan/Renminbi = 0.1732 AUD.

43
Table 2: Basic statistics of survey samples at city tier level
City
tier
Sample
s
Femal
e
Family
size
Famil
y
Incom
e
(RMB
)
Average
age
Education
(years)
Househol
d with
young
kids
1st 103 61 3.45 21,700 38.33 15.96 54
2nd 215 129 3.40 13,300 41.34 15.36 89
3rd 84 51 3.36 13,480 40.00 15.64 36
Total 402 241 3.40 16,160 39.89 15.65 179
Purchase motivations, drivers/barriers to purchase of green food.
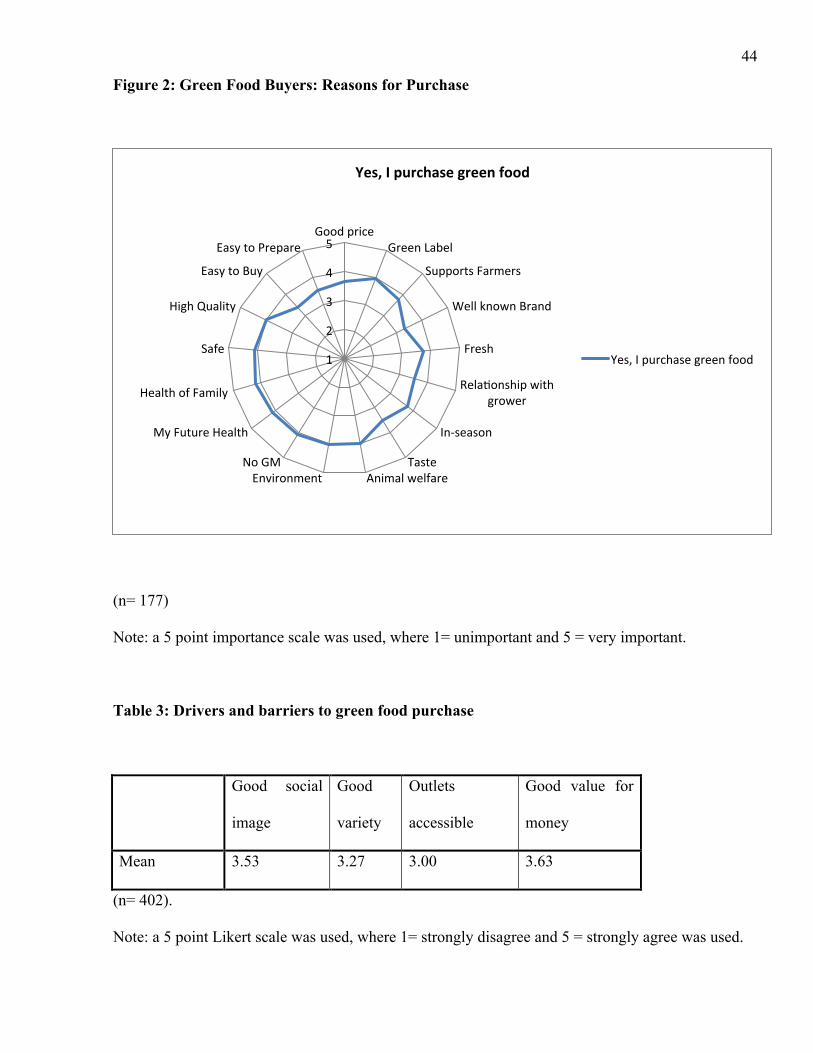
The respondents scored medium to high on all items related to purchase motivations (M>3 on a 5-
point Likert scale). While most of the motivating factors were considered important, the green food
label/pesticide reduced, coming from humanely-treated stock; environmentally-friendly, absence of
genetically modified ingredients, high quality, health and safety, all received the highest scores.
Intrinsic attributes such as freshness and taste received slightly lower scores (see Figure 2). One
way Anova was performed to identify variations in purchase motivations between buyers of green
food and non-buyers, but the results were not significant. The respondents were inclined to agree
that green food offered good value for money and signalled good social image; however the score
for variety and accessibility of outlets was lower. One way Anova showed that there were no
significant differences in mean values between buyers and non-buyers of green food.
44
Figure 2: Green Food Buyers: Reasons for Purchase
(n= 177)
Note: a 5 point importance scale was used, where 1= unimportant and 5 = very important.
Table 3: Drivers and barriers to green food purchase
Good social
image
Good
variety
Outlets
accessible
Good value for
money
Mean 3.53 3.27 3.00 3.63
(n= 402).
Note: a 5 point Likert scale was used, where 1= strongly disagree and 5 = strongly agree was used.
1
2
3
4
5 Good price
Green Label
Supports Farmers
Well known Brand
Fresh
RelaIonship with grower
In-‐season
Taste Animal welfare Environment
No GM
My Future Health
Health of Family
Safe
High Quality
Easy to Buy
Easy to Prepare
Yes, I purchase green food
Yes, I purchase green food
45
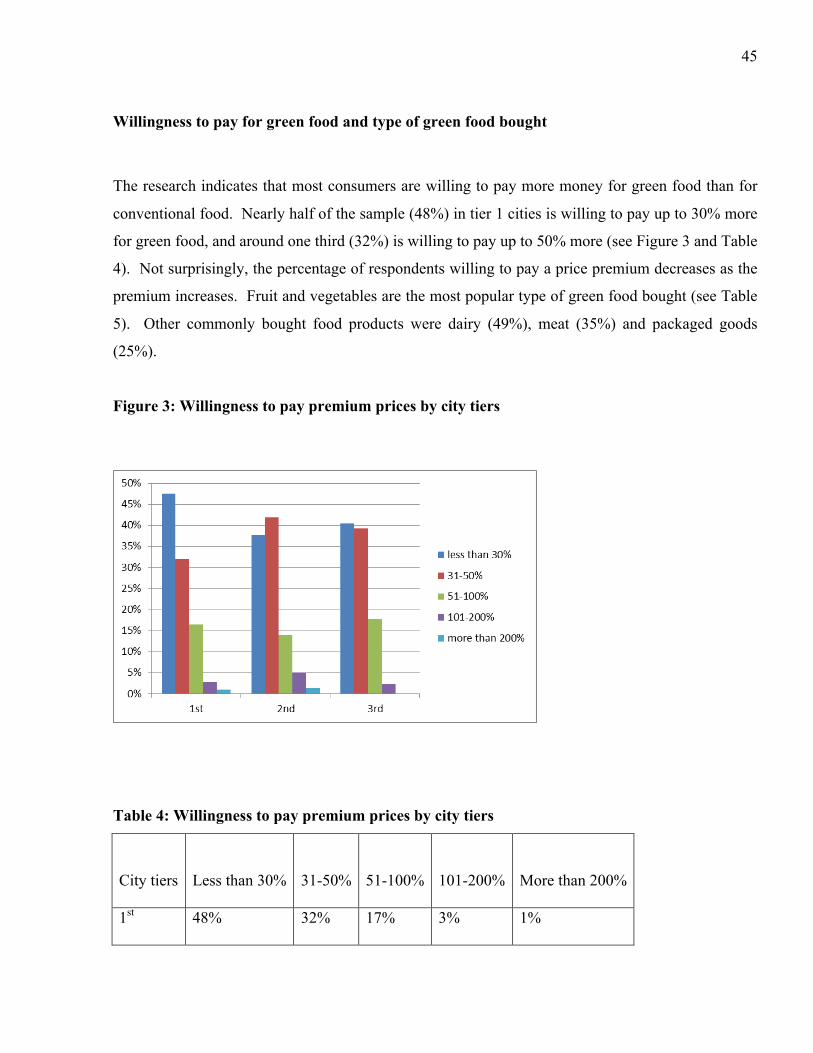
Willingness to pay for green food and type of green food bought
The research indicates that most consumers are willing to pay more money for green food than for
conventional food. Nearly half of the sample (48%) in tier 1 cities is willing to pay up to 30% more
for green food, and around one third (32%) is willing to pay up to 50% more (see Figure 3 and Table
4). Not surprisingly, the percentage of respondents willing to pay a price premium decreases as the
premium increases. Fruit and vegetables are the most popular type of green food bought (see Table
5). Other commonly bought food products were dairy (49%), meat (35%) and packaged goods
(25%).
Figure 3: Willingness to pay premium prices by city tiers
Table 4: Willingness to pay premium prices by city tiers
City tiers Less than 30% 31-50% 51-100% 101-200% More than 200%
1st 48% 32% 17% 3% 1%
46
2nd 38% 42% 14% 5% 1%
3rd 40% 39% 18% 2% 0%
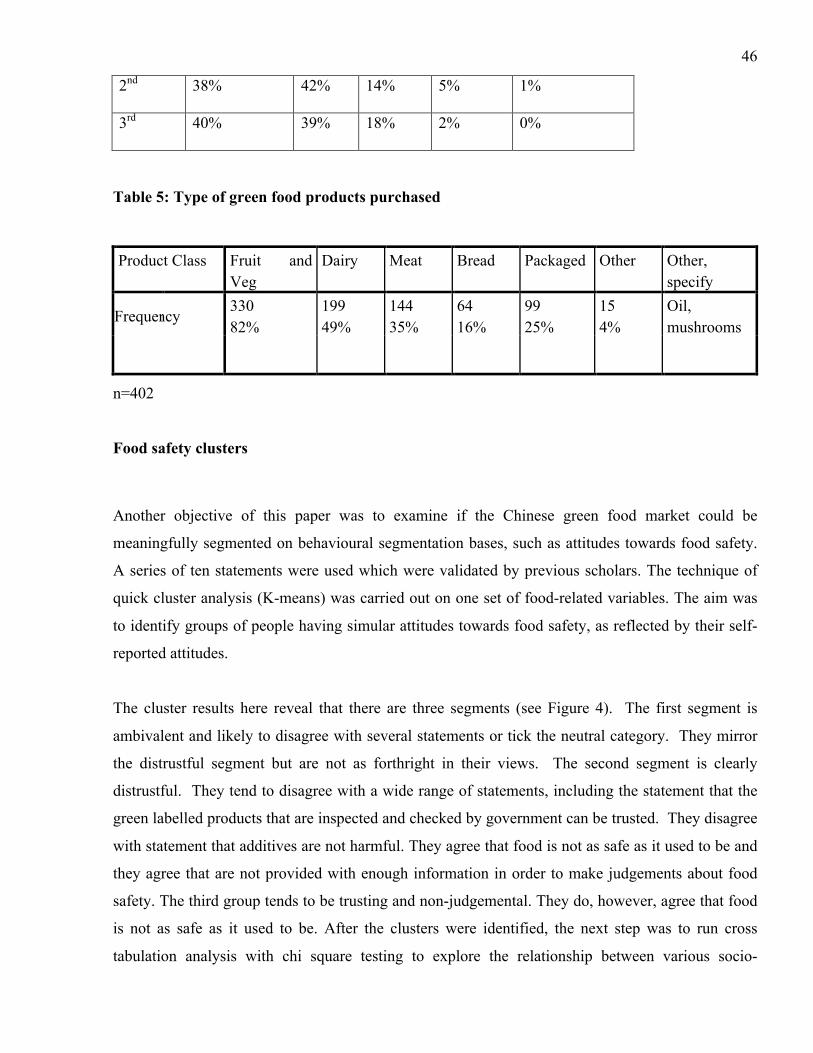
Table 5: Type of green food products purchased
Product Class Fruit and Veg
Dairy Meat Bread Packaged Other Other, specify
Frequency Frequency 330 82%
199 49%
144 35%
64 16%
99 25%
15 4%
Oil, mushrooms
n=402
Food safety clusters
Another objective of this paper was to examine if the Chinese green food market could be
meaningfully segmented on behavioural segmentation bases, such as attitudes towards food safety.
A series of ten statements were used which were validated by previous scholars. The technique of
quick cluster analysis (K-means) was carried out on one set of food-related variables. The aim was
to identify groups of people having simular attitudes towards food safety, as reflected by their self-
reported attitudes.
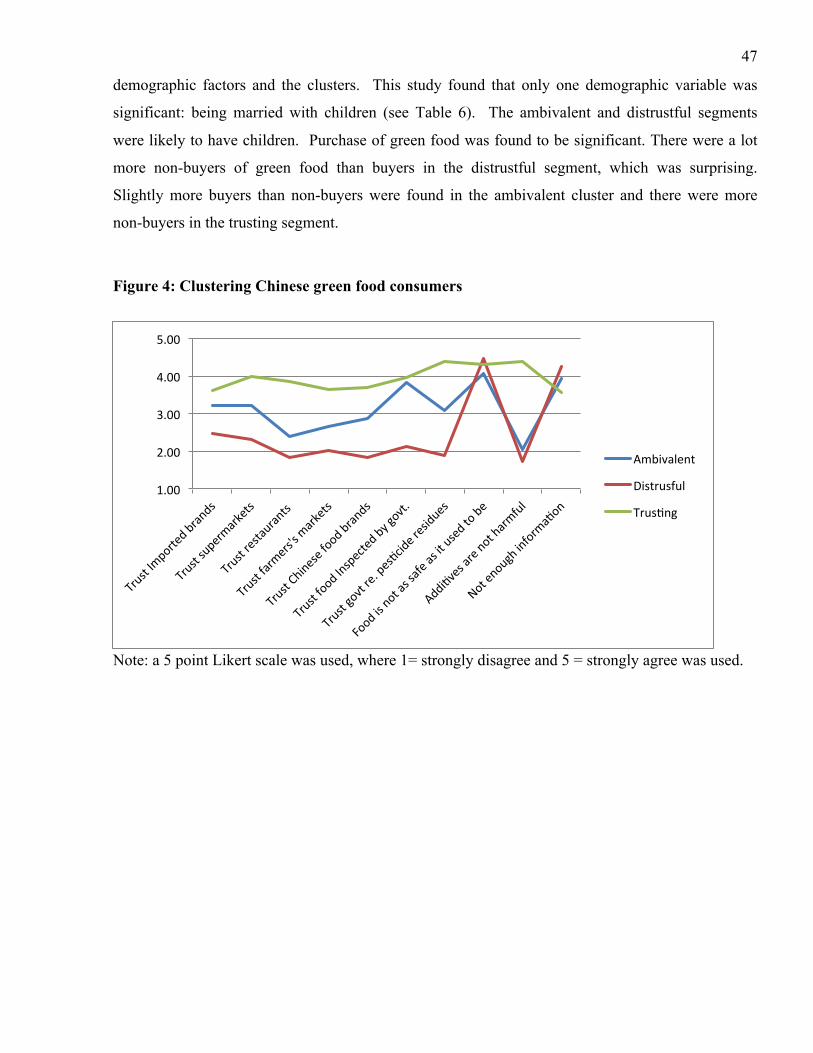
The cluster results here reveal that there are three segments (see Figure 4). The first segment is
ambivalent and likely to disagree with several statements or tick the neutral category. They mirror
the distrustful segment but are not as forthright in their views. The second segment is clearly
distrustful. They tend to disagree with a wide range of statements, including the statement that the
green labelled products that are inspected and checked by government can be trusted. They disagree
with statement that additives are not harmful. They agree that food is not as safe as it used to be and
they agree that are not provided with enough information in order to make judgements about food
safety. The third group tends to be trusting and non-judgemental. They do, however, agree that food
is not as safe as it used to be. After the clusters were identified, the next step was to run cross
tabulation analysis with chi square testing to explore the relationship between various socio-
47
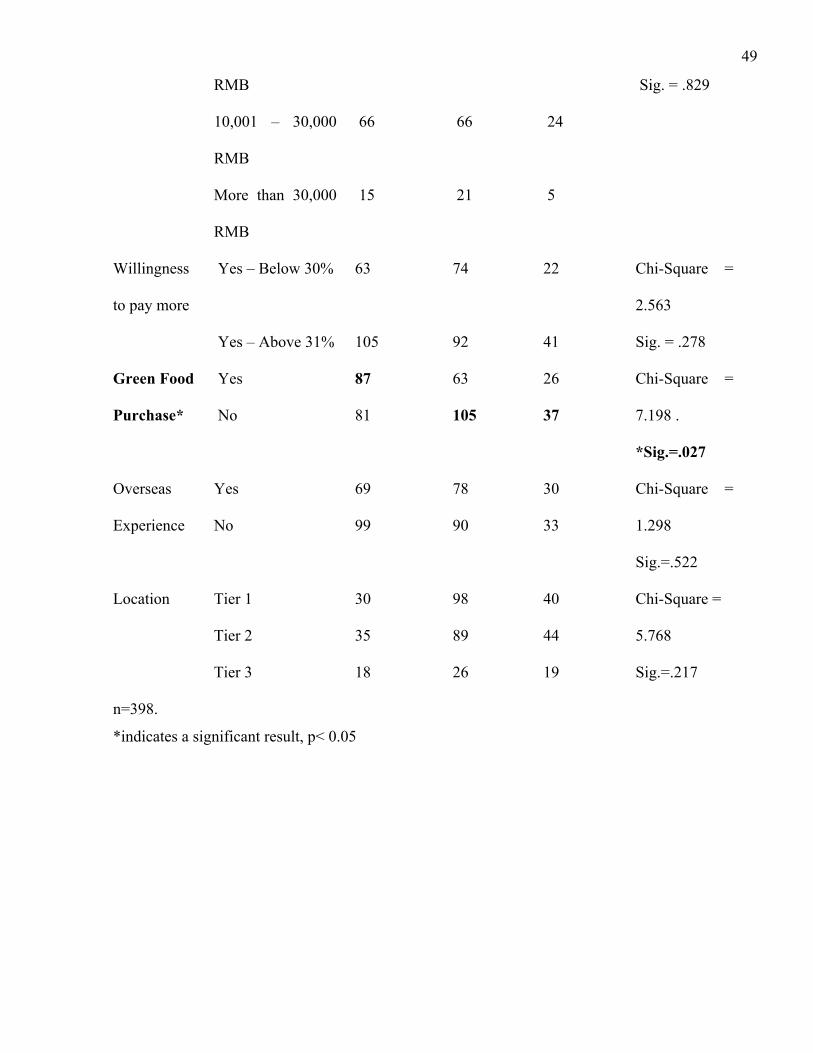
demographic factors and the clusters. This study found that only one demographic variable was
significant: being married with children (see Table 6). The ambivalent and distrustful segments
were likely to have children. Purchase of green food was found to be significant. There were a lot
more non-buyers of green food than buyers in the distrustful segment, which was surprising.
Slightly more buyers than non-buyers were found in the ambivalent cluster and there were more
non-buyers in the trusting segment.
Figure 4: Clustering Chinese green food consumers
Note: a 5 point Likert scale was used, where 1= strongly disagree and 5 = strongly agree was used.
1.00
2.00
3.00
4.00
5.00
Ambivalent
Distrusful
TrusIng

48
Table 6: Demographic profile of the food safety clusters
Clusters
Variable (1)
Ambivalent
(n=168)
(2)
Distrustful
(168 )
(3)
Trusting
(63)
Chi Square
Gender Male 59 68 32 Chi-Square =
4.763
Sig. = .092
Female 109 99 31
Age 0-34 36 33 19 Chi-Square =
8.170
Sig. = .086
35-54 97 114 36
Over 55 35 21 8
Education High
School/Vocational
53 50 27 Chi-Square =
9.426
Sig. = .051 Undergraduate 75 66 28
Post-graduate 40 52 8
Marital
Status
Yes 132 134 53 Chi-Square =
.889
Sig. = .641
No 36 34 10
Married
with
Children*
Yes 116 119 38 Chi-Square =
9.972
*Sig. = .007
No 16 15 15
Household
Income
< 6,000 RMB 43 46 17 Chi-Square =
2.834 6,001 – 10,000 44 35 17
49
RMB Sig. = .829
10,001 – 30,000
RMB
66 66 24
More than 30,000
RMB
15 21 5
Willingness
to pay more
Yes – Below 30% 63 74 22 Chi-Square =
2.563
Sig. = .278
Yes – Above 31% 105 92 41
Green Food
Purchase*
Yes
No
87
81
63
105
26
37
Chi-Square =
7.198 .
*Sig.=.027
Overseas
Experience
Yes
No
69
99
78
90
30
33
Chi-Square =
1.298
Sig.=.522
Location Tier 1
Tier 2
Tier 3
30
35
18
98
89
26
40
44
19
Chi-Square =
5.768
Sig.=.217
n=398.
*indicates a significant result, p< 0.05
50
Degree of interest in green foods
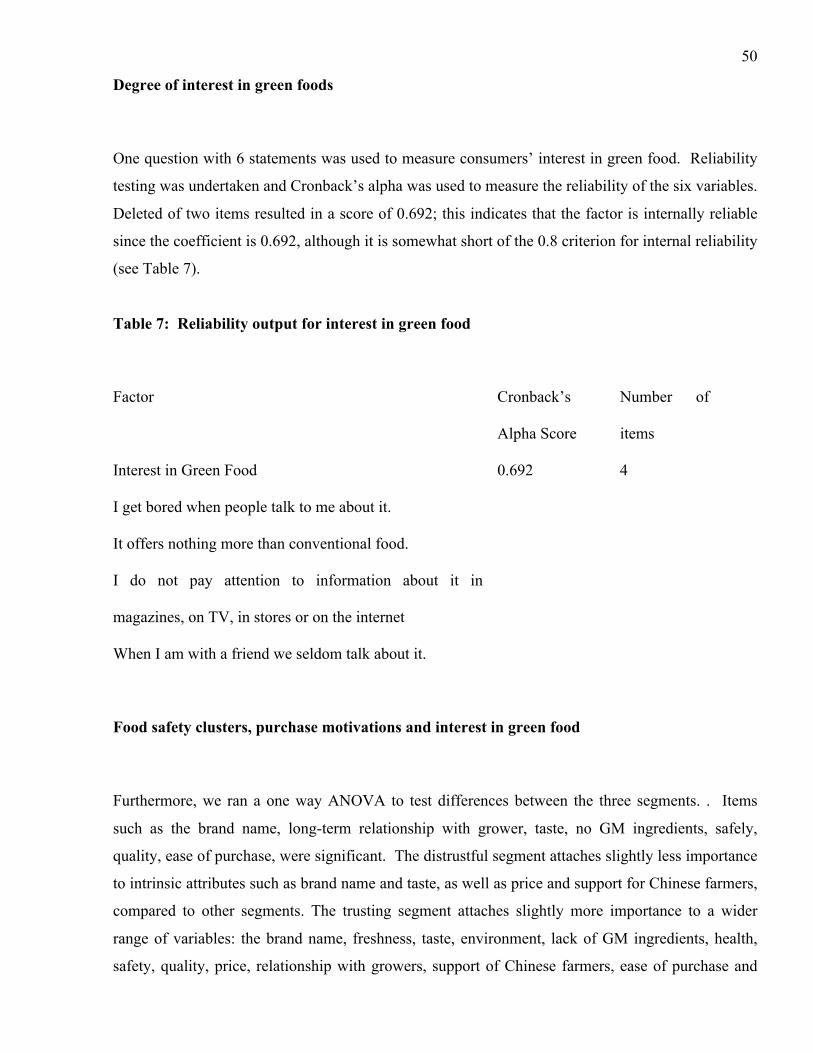
One question with 6 statements was used to measure consumers’ interest in green food. Reliability
testing was undertaken and Cronback’s alpha was used to measure the reliability of the six variables.
Deleted of two items resulted in a score of 0.692; this indicates that the factor is internally reliable
since the coefficient is 0.692, although it is somewhat short of the 0.8 criterion for internal reliability
(see Table 7).
Table 7: Reliability output for interest in green food
Factor Cronback’s
Alpha Score
Number of
items
Interest in Green Food 0.692 4
I get bored when people talk to me about it.
It offers nothing more than conventional food.
I do not pay attention to information about it in
magazines, on TV, in stores or on the internet
When I am with a friend we seldom talk about it.
Food safety clusters, purchase motivations and interest in green food
Furthermore, we ran a one way ANOVA to test differences between the three segments. . Items
such as the brand name, long-term relationship with grower, taste, no GM ingredients, safely,
quality, ease of purchase, were significant. The distrustful segment attaches slightly less importance
to intrinsic attributes such as brand name and taste, as well as price and support for Chinese farmers,
compared to other segments. The trusting segment attaches slightly more importance to a wider
range of variables: the brand name, freshness, taste, environment, lack of GM ingredients, health,
safety, quality, price, relationship with growers, support of Chinese farmers, ease of purchase and
51
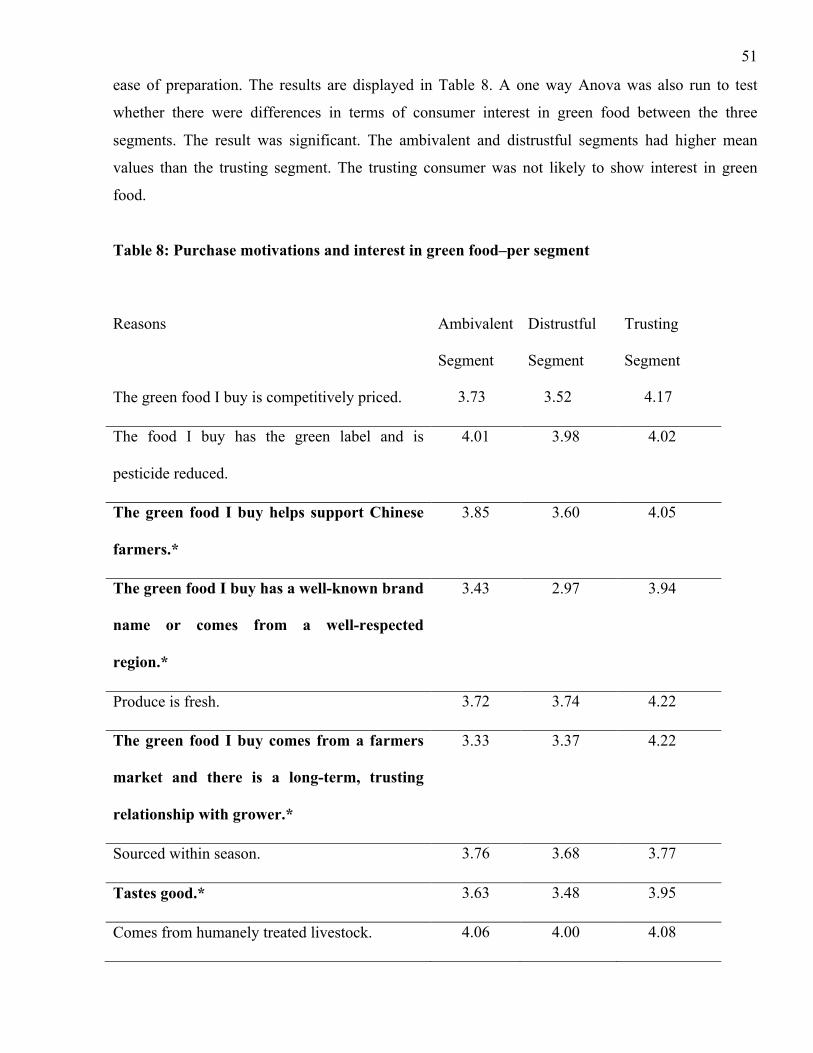
ease of preparation. The results are displayed in Table 8. A one way Anova was also run to test
whether there were differences in terms of consumer interest in green food between the three
segments. The result was significant. The ambivalent and distrustful segments had higher mean
values than the trusting segment. The trusting consumer was not likely to show interest in green
food.
Table 8: Purchase motivations and interest in green food–per segment
Reasons Ambivalent
Segment
Distrustful
Segment
Trusting
Segment
The green food I buy is competitively priced. 3.73 3.52 4.17
The food I buy has the green label and is
pesticide reduced.
4.01 3.98 4.02
The green food I buy helps support Chinese
farmers.*
3.85 3.60 4.05
The green food I buy has a well-known brand
name or comes from a well-respected
region.*
3.43 2.97 3.94
Produce is fresh. 3.72 3.74 4.22
The green food I buy comes from a farmers
market and there is a long-term, trusting
relationship with grower.*
3.33 3.37 4.22
Sourced within season. 3.76 3.68 3.77
Tastes good.* 3.63 3.48 3.95
Comes from humanely treated livestock. 4.06 4.00 4.08

52
Environmentally-friendly in the way it is
produced, packaged and transported.
4.08 4.08 4.32
Does not contain genetically modified
ingredients.*
4.02 4.10 4.43
Green food will improve my future health. 4.16 4.13 4.38
Green food will improve the future health of my
family.
4.21 4.20 4.35
Green food is safe.* 4.14 4.16 4.44
Green food is high quality and has high
nutritional value.*
3.96 4.04 4.30
Easy to buy* 3.30 3.32 3.79
Easy to prepare* 3.43 3.29 3.79
“Interest in green food” factor* 3.17 3.25 2.42
• Sig. p>0.05
Determinants of green food purchase - demographics
Table 9 shows the results of the binary probit model for green food purchase. Results show that
demographic variables, notably, age, gender, presence of young children in the family, family size,
education, income and overseas experience have an impact on green food purchase. Income, age,
gender, presence of young kids (12 years old and under), family size are significant at the 5% level.
Higher education and having overseas experience are significant at the 10% level. Age (older), male,
family size (larger), and education attainment below university are negatively related to green food
purchase. Young, wealthy males, who have young children and who live in a small household are
likely to be buyers of green food.

53
Table 9: Estimates of binary probit model for green food purchase
Variables Coef. Std. Err. z P>z
Age -0.129818 0.0639425 -2.03 0.042**
Gender (Male:1; Female: 0) -0.3155194 0.1370279 -2.3 0.021**
Presence of kids under 12 years old 0.2213435 0.090355 2.45 0.014**
Family size -0.1522628 0.0663902 -2.29 0.022**
Education attainment below university -0.2931753 0.1597256 -1.84 0.066*
Income 0.1142806 0.0535156 2.14 0.033**
Overseas 0.2334513 0.137162 1.7 0.089*
_cons ((Intercept/constant term) 0.1590166 0.4194188 0.38 0.705
LR chi2(8) 54.45
Log likelihood -248.5461
Pseudo R2 0.0987
Note: ** indicates 5% significance and * indicates 10% significance.
Discussion
This research indicates that consumers who buy green food are motivated by the same factors as
those who do not. In general, Chinese consumers attach importance to a wide range of factors in
their food choices, such as the green food label, animal welfare; environmentally-friendly
production methods, absence of genetically modified (GM) ingredients, high quality, safety, self-
health and health of one’s family. A study of Chinese consumers reported that environmental values
serve to influence green food purchase intentions; however barriers to purchase exist such as price
and inconvenient channels (Zhu, Li, Geng & Qi, 2013). The importance given to “no GM
ingredients” is somewhat surprising since GM food ingredients are not prohibited in green foods and
several studies suggest that Chinese consumers accept GM foods (Huang et al., 2006; Zhang et al.,
2010). The other findings on reasons for buying green food are consistent with the organic food
54
literature (it must be noted that green food and organic food are separate and distinct categories).
The factors enticing people to buy organic products include health; product quality and concern
about environmental degradation (Pearson, 2002; Yiridoe et al., 2005; Pearson & Henryks, 2008).
This study investigated willingness to pay (WTP) for generic green foods. The study found that
almost half of the Chinese respondents from tier 1 cities are willing to pay up to 30% more for green
food. Previous studies show that consumer willingness to pay in China is very low due to income
level differences, with only 11.3% willing to pay 16-30% more (Xu and Wu, 2010; Wu, Xu and
Gao, 2011). It must be noted that there is a very large price differential between green food and
conventional food, with the latter being two to three times higher than conventional food (Yin, Wu,
Du and Chen, 2010). One trade report found that the price differential between the cheapest
vegetable (loose product in the Wet markets) and the most expensive (organic in premium retailers)
is up to eight times (Morgan and Wright, 2014). Given that fruit and vegetables are the most
popular type of green food bought by the sample, one can conclude that price will be a major factor
restricting the growth of the green food label in China. However, caution should be exercised in
interpreting the WTP figure, since the study did not investigate WTP for specific green foods.
This study identified three segments based on attitudes towards safety. There is a difference in
green food purchasing behaviour between the clusters. Relatively high numbers of people in the
“distrustful segment” were categorised as non-buyers of green food. This finding is puzzling. Food
safety failures, in particular the melamine case in China, are dangerous and even fatal for some
consumers. Studies on organic food consumers have found that consumers tend to buy organic food
primarily to avoid the so-called risk of ingesting chemicals founded in conventional food (Ott, 1990;
Jolly, 1991; Wilkins & Hillers, 1994). Likewise, one would expect Chinese consumers to buy green
food as a risk avoidance strategy. There is some controversy however around the attitude-behaviour
link since intervening factors such as search time, availability and price can affect behaviour. One
study found that purchase of green food was positively related with food safety concern, the label
and attitude towards green-labelled products (Bing et al., 2011). A study has found that although
Chinese respondents are strongly dissatisfied with food safety conditions, some are unwilling to
shoulder the extra cost (Xu and Wu, 2009). Consumer decision making often evokes paradoxes and
conflicts between attributes (Bingen, Sage and Sirieix, 2011). Research has identified lack of
familiarity with the label, doubt about certified traceable food, and worries about excessively high
prices as limiting factors (Wu, Xu and Gao, 2011). One study found that just 65% of Chinese
consumers recognise the green food logo/label (Liu et al., 2012), and it was concluded that more
55
information needs to be distributed to consumers. Non-purchase may simply reflect a lack of trust
in the state-regulated green label. The problem of fraud, where companies falsely advertise
pesticide-treated produce as organic, is an ever-present concern, leading to a large trust deficit
(Marchesini et al., 2012; Li, Ge & Bai, 2013). For actors in the food chain, building and
maintaining integrity of the green brand with Chinese consumers will be necessary. It is interesting
that the “ambivalent cluster” buys green food. In health psychology studies, researchers are
interested in the concept of risk; it is natural for humans to respond to threats by worrying and by
engaging in some form of threat appraisal (MacGregor, 1991). The outcomes of the threat appraisal
process are threefold (1) an individual ignores the threat if it is seen as irrelevant or insignificant; (2)
an individual takes action if the threat is believed to be serious and relevant; and/or (3) an individual
attempts to minimize the threat through denial or avoidance (Witte & Allen, 2000). Non purchase of
green food may reflect what Bingen et al., (2011:411) call “…emotion-centred strategies that tend to
be more fatalist and sometimes less efficient with respect to resource mobilisation.”
Our study found that green food seems to be favoured by wealthy, educated Chinese males who
have a young child. Apart from gender, these findings are in accordance with the literature. For
instance, a study by Zhu et al., (2013) found that income and education influence green food
purchase intentions and behavours. Chinese studies report that gender – being female - is an
important demographic variable, along with income, education and family size, that influences
willingness to pay for green food (Xia & Zeng, 2007; Xia & Zeng, 2008). Studies on Western
consumers show that concern for young children is likely to increase organic food consumption
(Kriwy & Mecking, 2012); the organic food buyer is likely to be female (Lockie et al., 2004),
female with children (Dettmann & Dimitri, 2009; Van Doorn &Verhoef, 2011) and is likely to be
highly educated (Govidnasamy & Italia, 1990; Kriwy & Mecking, 2012). This finding on gender is
interesting. It may reflect changing roles in modern society, where males are increasingly assuming
responsibility for food shopping. China’s one child policy may intensify the safety concerns of
fathers or make them more cautious or conservative in their handling of risk. This study found that
green food purchase is seen as an indicator of social status. In the literature, it is emphasised that
food purchases are influenced by inter-personal influences such as family, friends and peer
networks, along with cultural norms (Xu, Zheng and Zhou, 2015). For instance, although green
food is bought mainly for private consumption and not public consumption, gift-giving (i.e.,
attractively packaged gifts of fruit) is common in Chinese culture. These potential influences on
male buying behaviour need to be explored in future studies.
56
The study presented here leaves open several questions and avenues for future research. The
intensification of concern about safety in China demands a deeper insight into the concept of
perceived risk, the response of Chinese food consumers to risk, the trade-offs and coping strategies
they adopt given the constraints they face. For instance, the practise of washing and soaking
vegetables to remove pesticide residues is common. It is argued that consumers handle risk in ways
that are more ambivalent, more diverse and complex than envisaged by policy makers (Halkier,
2011). The fact that Chinese males are more likely than females to buy green food deserves
investigation. An in-depth qualitative study of Chinese males/couples who are parents of young
children is needed to probe motivations behind green food consumption. More market segmentation
studies are warranted, using larger sample sizes, with a focus on demographics, behavioural or
psychographic bases.
Conclusion
The contribution of this paper includes identifying the determinants of green food purchase along
with market segments in the green food market. Results show that demographic variables, notably,
income, age, gender, education, presence of young children in the family, household size and
overseas experience have an impact on green food purchase. Wealthy, young males, who have
young children and who live in a small household are likely to be buyers of green food. Three
groups of consumers were identified based on their attitudes towards food safety: the ambivalent,
distrustful and trusting consumers. A key task for actors involved in the food supply chain in China
is to provide more information to consumers on food safety. This study had its limitations, such as
the sample size given the population of China, reliance on self-reported data and potential that the
survey method results in socially desirable responses.
Acknowegements: The research was funded by a mid-career researcher grant from James Cook
University, Townsville, Australia
57
References
Ajzen, I. (1991). The theory of planned behaviour. Organizational Behaviour and Human Decision
Process, 50(2), 179-211.
Ben-Akiva, M., & Lerman, S. (1985), Discrete Choice Analysis: Theory and Application to Travel
Demand, The MIT Press, Cambridge, MA.
Bing, Z., Chaipoopirutana, S., and Combs, H. (2011). Green product consumer behaviour in China.
American Journal of Business Research, 4, (1), 55-71.
Bingen, J., Sage, J., and Sirieix, L. (2011). Consumer coping strategies: a study of consumers
committed to eating local. International Journal of Consumer Studies, 35, 410-419.
Chen, M.F. (2010). Segmentation of Taiwanese consumers based on trust in the food supply system.
British Food Journal, 114 (1), 70-84.
Dettmann, R., & Dimitri, C. (2009). Who’s buying organic vegetables? Demographic characteristics
of US consumers. Journal of Food Products Marketing, 16, (1), 79-91.
Geng, W., Trienekens, J. & Wubben, E.F., (2013). Improving Food Safety within China’s Dairy
Chain: Key Issues of Compliance with QA Standards. International Journal on Food System
Dynamics, 4 (2) 117-129.
Gil, J., Gracia, A., and Sánchez, M. (2000). Market segmentation and willingness to pay for organic
products in Spain. International Food and Agribusiness Management Review, 3, 207-226.
Govidnasamy, R., & Italia, J (1990). Predicting willingness to pay for organically grown fresh
produce. Journal of Food Distribution Research, 30 (2), 44-53
Green, W. (2002), Econometric Analysis, Prentice Hall, New Jersey.
Halkier, B., (2011). Consuming ambivalences: Consumer handling of environmentally related risks
in food. Journal of Consumer Behaviour, 1, 205-224.
Henson, S.J., & Traill, W.B. (2000). Measuring perceived performance of the food-system and food-
related welfare. Journal of Agricultural Economics, 51 (3) 388-404
Huang, J.K., Qiu, H.G., Bai, J.F., & Pray, C. (2006). Awareness, acceptance of, and willingness to
buy, genetically modified foods in urban China, Appetite, 46, 144-151.
Jin, Y., Lin, L., and Yao, L. (2011). Do Consumers Trust the National Inspection Exemption
Brands? Evidence from Infant Formula in China? Paper presented at The Agricultural &
Applied Economics Association’s 2011 AAEA & NAREA Joint Annual Meeting, Pittsburgh,
Pennsylvania, July 24-26, 2011.
58
Jolly, D.A., (1991). Determinants of organic horticultural products consumption based on a sample
of California consumers. Horticultural Economics and Marketing, 23, 141-148.
Knight, A.J., & Warland, R. (2005). Determinants of food safety risks: a multi-disciplinary
approach. Rural Sociology, 70 (2), 253-275.
Kriwy, P., & Mecking, R.A., (2012). Health and environmental consciousness, costs of behaviour
and the purchase of organic food. International Journal of Consumer Studies, 36, 30–37.
Li, C., Ge, Y. & Bai, G. (2013). Issues concerning “greenification” of green food enterprises. Asian
Agricultural Research, 5 (5), 3-8.
Liu, R., Pieniak, Z., & Verbeke, W. (2013). Consumers’ attitudes and behaviour towards safe food
in China: A Review. Food Control, 33, 93-104.’
Liu, X., Wang, C., Shishime, T., and Fujitsuka, T. (2012). Sustainable Consumption: Green
Purchasing Behaviours of Urban Residents in China, Sustainable Development, 20, 292-308.
Lobo, A., and Chen, J. (2012). Marketing of organic food in urban China: Ana analysis of
consumers’ lifestyle segments. Journal of International Marketing and Exporting, 17 (1),
14-26.
Lockie, S., Lyons, K., Lawrence, G., & Grice, J., (2004). Choosing organics: a path analysis of
factors underlying the selection of organic food among Australian consumers. Appetite, 43,
135–146.
MacGregor, D. (1991). Worry over technological activities and life concerns. Risk Analysis, 11(2),
315-324.
Morgan, B. & Wright, C. (2014). The Market Opportunities for Australian Vegetables in China.:
Sydney, Australia: HAL - Horticulture Australia.
Maddala, C. (1983), Limited-dependent and qualitative variables in econometrics, Cambridge
University Press, Cambridge.
Marchesini, S., Hasimu, H., & Spadoni. R. (2010). An overview of the organic and green food
market in China in Hass, Rainer Canavari, Maurizio, Slee, Bill (Eds.). Looking East Looking
West: Organic and Quality Food Marketing in Asia and Europe (pp. 155-172). Wageningen,
NLD: Wageningen Academic Publishers.
Marchesini, S., Huliyeti, H. & Canavari, M. (2012). Perceptual maps analysis for organic food
consumers in China: a study on Shanghai consumers. In 22nd Annual IFAMA World Forum
and Symposium, The Road to 2050: "The China Factor", Shanghai, China June 10 - 14,
2012. Retrieved 1 March 2013 from:
59
https://www.ifama.org/events/conferences/2012/cmsdocs/Symposium/PDF%20Symposium
%20Papers/703_Paper.pdf
McKinsey (2013), China’s e-tail revolution: online shopping as a catalyst for growth, McKinsey
Global Institute, Seoul and San Fransciso, available at:
http://www.mckinsey.com/insights/asia-pacific/china_e-tailing (accessed 15 October 2014).
Morgan, B. & Wright, C. (2014). The Market Opportunities for Australian Vegetables in China.
2014 AUSVEG National Convention, Cairns Convention Centre, 19-21 June 2014.
Retrieved 8 July, 2014, from: http://ausveg.com.au/events/convention-2014/2014-speaker-
sessions.htm
Ott, L.S. (1990). Supermarkets shoppers’ pesticides concerns and willingness to purchase certified
pesticide residue-free fresh produce. Agribusiness, 6, 593-602.
Pearson, D. (2002). Marketing organic food: Who buys it and what do they purchase?, Food
Australia, 4(1), 31-34.
Pearson, D. & Henryks, J. (2008). Marketing organic products: Exploring some of the pervasive
issues, Journal of Food Products Marketing, 1(44), 95-108.
Sue, V. M., & Ritter, L. A. (2007). Conducting online surveys. Sage Publications, Thousand Oaks,
California.
Sun, Q., & Mu, Y. (2012). Analysis of Vegetable Consumption Features and Consumption Demand
System of Beijing Residents. Chinese Agricultural Science Bulletin, 28 (12), 257-263.
Van Doorn, J., & Verhoef, P.C., (2011). Willingness to pay for organic products: differences
between virtue and vice foods. International Journal of Research in Marketing, 28 (3), 167-
280.
Wilkins, J.L., & Hillers, V.N. (1994). Influences of pesticide-residue and environmental concerns
on organic food preference among food cooperative members and non-members in
Washington state. Journal of Nutrition Education, 26, 26-33.
Witte, K., & Allen, M. (2000). A meta-analysis of fear appeals: Implications for effective public
health campaigns. Health Education & Behaviour, 27(5), 591-615
Wu, L., Xu, L., and Gao, J. (2011), The acceptability of certified traceable food among Chinese
consumers, British Food Journal, 113(4), 519-534.
Xia, W., and Zeng, Y. (2007). Consumer’s attitudes and willingness-to-pay for Green food in
Beijing. Paper presented at the 6th International Conference on Management (ICM), August
3-5, 2007, Wuhan, China, Vol. iii, Science Press.

60
Xia, W., & Zeng, Y. (2008). Consumer’s Willingness to Pay for Organic Food in the Perspective of
Meta-analysis. Paper presented at: International Conference on Applied Economics. ICOAE
(pp. 933-943).
Xu, L., and Wu, L.. (2010). Food Safety and consumer willingness to pay for certified traceable
food in China, Journal of Sci Food Agric, 90, 1368-1373
Xu, P., Zheng, S., and Zhou, S. (2015). Family and Western-Style Fast Food : Influences on Chinese
College Students’ Dairy Consumption. Journal of Food Products Marketing, 17 (1), 1-24.
Yin, S., Wu, L., Du, L. & Chen, M. (2010). Consumers’ purchase intention of organic food in
China. Journal of the Science of Food and Agriculture, 90, 1361-1367
Yiridoe, E., Bonti-Ankomah, S., and Martin, R. (2005). Comparison of consumer perceptions and
preference toward organic versus conventionally produced foods; a review and update of the
literature, Renewable Agriculture and Food Systems, 20 (4), 193-205.
Zhang, L., & Han, L. (2009). An analysis on consumer perception of safe food and purchase
behaviour - a survey on fresh food in Shanghai. Chinese Agricultural Science Bulletin, 25
(4), 50-54.
Zhang, X., Huang, J., Qiu, G., and Huang, Z. (2010). A consumer segmentation study with regards
to genetically modified food in urban China. Food Policy, 35, 456-462.
Zhang, X., Dagevos, H.,He, Y., van de Lands, I., & Zhai, F. (2008). Consumption and corpulence in
China: A consumer segmentation study based on the food perspective. Food Policy, 33, 37-
47.
Zhong, F., & Yi, X. (2010). Analysis on difference between consumers' concerns and actual
purchasing behaviour regarding food safety: case study of vegetable consumption in
Nanjing. Journal of Nanjing Agricultural University, 10 (2).
Zhou, Y.H., Huo, L., and Peng, X.J. (2004). Food Safety: Consumer attitudes, willingness to pay
and the impact of information. Chinese Rural Economy, 11, 53-59.
Zhu, Q., Li, Y., Geng, Y., & Qi, Y. (2013). Green food consumption intention, behaviours and
influencing factors among Chinese consumers. Food Quality and Preference, 28, 279-286.
Top Related