


Languages
Pages
Legal


1
Good or bad? - The influence of FDI on output growth An industry-level analysis∗
Carmen Fillat Castejón1
Department of Applied Economics and Economic History
University of Zaragoza
and
Julia Woerz2 The Vienna Institute for International Economic Studies
and
Tinbergen Institute, Erasmus University Rotterdam
- preliminary version -
30/08/2005
Abstract
In this paper we attempt to reconcile the often inconclusive empirical evidence on the
impact of FDI on output growth by taking explicitly two types of heterogeneity into
account: heterogeneity among industries and among countries. Our empirical analysis
is based on a specially compiled data set, including FDI inward stocks, output,
employment, investment, as well as exports, imports and wages for eight industries and
35 countries (OECD, Asian and Eastern European countries) over the period 1987 to
2002. Based on this sample, we test the importance of both - stage of development and
industrial pattern of FDI – for the economic impact of foreign direct investment on an
economy. Our results highlight the importance of the receiving country’s stage of
development for the specific effect of FDI on output growth. Further, FDI alone rarely
translates into higher output or productivity growth, however in certain industries a
significant and positive relationship emerges when FDI is interacted with investment or
export orientation.
Introduction
∗ Julia Woerz acknowledges thankfully the funding of this research by Oesterreichische Nationalbank through Jubiläumsfondsprojekt No. 10214. 1 Carmen Fillat Castejón, Dpto. Economía Aplicada. Facultad de Economía, Universidad de Zaragoza, Gran Via 2, 50005 Zaragoza, Spain, E-mail: [email protected] 2 Julia Woerz, wiiw – The Vienna Institute for International Economic Studies, Oppolzergasse 6, A-1010 Vienna, Austria, E-mail: [email protected]

2
While in theory, the nexus between FDI and growth (in terms of output and productivity) is in general
positive, the empirical literature is far less conclusive. Some studies find positive effects from outward
FDI for the investing country (Van Pottelsberghe and Lichtenberg, 2001; Nachum et al., 2000), but
suggest a potential negative impact from inward FDI on the host country. This results from a possible
decrease in indigenous innovative capacity or crowding out of domestic firms. Thus, in their view and in
line with the standard literature on the determinants of FDI (i.e. Dunning’s OLI paradigm, see Dunning
1988) inward FDI is intended to take advantage of host country (locational) characteristics instead of
disseminating new technologies originating in the sending country. Other studies report more positive
findings: Nadiri (1993) finds positive and significant effects from US sourced capital on productivity
growth of manufacturing industries in France, Germany, Japan and the UK. Also Borensztein et al.
(1998) find a positive influence of FDI flows from industrial countries on developing countries’ growth.
However, they report also a minimum threshold level of human capital for the productivity enhancing
impact of FDI, emphasizing the role of absorptive capacity. Absorptive capacity or minimum threshold
levels in a country’s ability to profit from inward FDI is often mentioned in the literature (see also
Blomström et al. 1994). Consequently the effect of FDI depends among other things to a large extent on
the characteristics of the country that receives FDI. However, the resulting issue of cross-country
heterogeneity has largely been neglected in the literature so far with few exceptions. Blonigen and Wang
(2004) stress explicitly cross-country heterogeneity as the crucial factor which determines the effect of
FDI on growth. Further, Nair-Reichert and Weinhold (2001) and Mayer-Foulkes and Nunnenkamp (2005)
explicitly take up this aspect in their analysis. Our paper will follow their direction and introduce two forms
of heterogeneity, differences between countries and differences between receiving industries.
We argue that since host country heterogeneity plays a role, it is equally likely that the impact of FDI on
the host economy differs greatly according to the receiving industry. FDI in constant returns to scale
industries will have different effects than FDI in increasing returns to scale industries. Likewise, the effect
of FDI may be related to the technology and human capital intensity of the industry and other factors. As
a very intuitive example, heavy FDI in the extractive sector in Nigeria has not improved the country’s
growth performance (Akinlo, 2004). Consequently, the potential for positive spillovers does not solely
depend on a country’s overall absorptive capacity, but the latter may vary across sectors or industries in
one economy. Thus, the impact of FDI differs depending on country specific absorptive capacity or stage
of development. Since the latter is strongly related to the country’s industrial structure in general, this
implies a relationship between the industrial pattern of inward FDI and its effect on the host country. The
economy wide effect of industry specific FDI inflows will then further depend on the extent of intra-
industry versus inter-industry spillovers.
In this paper we investigate the magnitude of all these factors for the role of FDI on the host country by
putting the focus on individual manufacturing industries. Due to measurement issues, interdependencies
between various types of spillovers and their complexity, it is difficult to distinguish between different
theoretically possible channels of technology transmission in empirical research. Therefore, we will focus

3
on the overall effect of foreign sourced capital on manufacturing output growth in addition to the effects
of traditional factors (domestic capital and labour) and controlling for other factors. What is new in our
analysis is the focus on the industry-level of the economy. To our knowledge, there is very little empirical
research on FDI at this level of disaggregation. Disaggregated data on FDI for a large and
heterogeneous set of countries rarely exist in a comprehensive and comparable form. If these data exist,
they are often plagued with two kinds of problems: On the one hand, the coverage of firms and flows
which are recorded as FDI can differ between countries (problems are often caused by the exclusion of
reinvested profits in some countries). On the other hand, the classification into industrial activities may
differ between countries.
The paper proceeds as follows: Section 1 revises briefly the theoretical background of the FDI-growth
nexus. Section 2 describes the data set. Section 3 introduces the estimating framework, the results are
summarized in Section 4. We present results for both, the influence of FDI on output and on productivity
growth. Section 5 deals with the particular experiences of CEECs and Section 6 concludes.
1. Theoretical Background
Economic theory has provided us with many reasons why foreign direct investment may result in
enhanced growth performance of the receiving country. In the neo-classical growth literature, FDI is
associated positively with output growth because it either increases the volume of investment and/or its
efficiency and thus puts the economy on a higher long-term growth path. Thus, FDI can have a level
effect. Apart from the potential efficiency increase, there is no qualitative difference to domestic capital in
these models.
Turning towards endogenous growth model, the potential role for FDI is much greater. In the
neoclassical production function approach, output is generated by using capital and labour in the
production process. With this framework in mind, FDI can exert an influence on each argument in the
production function. FDI increases capital, it may qualitatively improve the factor labour (explained
below) and by transferring new technologies, it also has the potential to raise total factor productivity.
Thus, in addition to the direct, capital augmenting effect, FDI also has additional indirect and thus
permanent effects on the growth rate. Further, by raising the number of varieties for intermediate goods
or capital equipments, FDI can also increase productivity (see Borensztein et al., 1998).3 In sum, FDI can
permanently increase the growth rate through spillovers4 and the transfer and diffusion of technologies,
ideas, management processes, and the like.
3 The same effect can also be achieved through imports of such goods. In this sense, FDI represents an alternative means to increase the number of available varieties in addition to trade, even if there are qualitative differences between the two. 4 Spillovers occur when multinationals are unable to capture all the productivity or efficiency effects that follow in the host country’s local firms as a result of the presence of the multinational (Caves, 1996).
4
The literature mentions basically four channels which allow for technological spillovers from FDI to the
host economy (Kinoshita, 2001, Halpern and Muraközy, 2005): The classical indirect channel for the
transmission of technology from FDI to the domestic economy functions via imitation. The absorptive
capacity of the host country, determined by factors such as the legal system, regulations, infrastructure,
human capital endowments, etc., as well as the complexity of the technology play a vital role in this
respect. If the technological gap between two countries is too large, imitation may not be possible. On
the other hand, if the legal environment is very advanced, imitation may become overly costly or risky
due to a stricter protection of property rights.
Secondly, and often considered to be the most important channel, the training of local workers in foreign
owned firms generates positive spillovers through the acquisition of human capital. The empirical
evidence concerning the labour market implications of foreign owned firms is mixed. On the one hand,
foreign firms spend on average more on training of workers than local firms. On the other hand, foreign
owned firms may skim the market of well trained workers and – at least in the short run – free-ride on
previous training by domestic firms. Thus, there are potentially negative spillovers through the labour
market. The smaller the wage differential between foreign and domestic forms, the greater the scope for
positive spillovers, since this would allow also domestic firms to attract well trained workers from foreign
firms. Further, distance plays a role here: If foreign firms concentrate mostly in one region (for instance
FDI in Hungary remains highly concentrated in the Western part of the country) spillovers are likely to
occur in this region but not in other parts of the host country. Another important question relates to the
specificity of the knowledge acquired by training in foreign owned firms. Based on meta-analysis, Görg
and Strobl (2002) find evidence that the managerial skills of owners of domestic firms, who were
previously employed by multinationals, were industry specific but not firm specific, which points towards
a large potential for intra-industry spillovers.
Thirdly, foreign presence increases competition in a market. The ultimate effect on x-inefficiency, i.e. the
difference between the efficient (frontier) behaviour of firms and their empirically observed behaviour, is
again unclear. Also in this context, the absorptive capacity of the host country is important: If the gap
between foreign and domestic firms is too great, domestic firms will not be able to produce at their
efficient level and go bankrupt, thus more productive foreign firms will crowd out domestic firms. If the
gap is within limits, the increase in competition will induce higher productivity in the catching-up domestic
firms. In any case, only the most efficient domestic firms will survive, implying that the negative capacity
effect is counteracted by a positive efficiency effect. Thus, FDI has an effect on market structure, which
depends on the size of the technology gap as well as on entry and exit behaviour in the market.
Finally, there are vertical or backward spillovers. By purchasing intermediates from foreign suppliers or
by selling output to foreign firms, local firms will be affected positively in terms of efficiency and quality of
output. Thus, the increased variety of intermediate goods may induce a more effective international

5
specialization in production and this together with increasing returns to scale in production will result in
higher productivity growth.
At the micro-level, where the spillovers arise, one has to distinguish between own-firm (i.e. inside the
foreign affiliate) and host-country effects (i.e. between affiliates and indigenous firms). While there is
ample evidence for positive own-firm effects in the literature, the evidence for inter-firm spillovers is less
robust. A related problem, which may be at the heart of these findings relates to the self-selection bias.
I.e. while there is general consensus that FDI increases the productivity of receiving firms, part of this
effect is in fact due to FDI selecting better firms as targets for takeover (Bellak, 2004). At the more
aggregate level, this translates to the imminent causality or endogeneity problem, faced by all empirical
studies on the effects of FDI.
Let us now turn to the focus of this paper, namely the issue of heterogeneity. The above mentioned
importance of absorptive capacity of the host country (and thus cross-country differences in the FDI-
growth link) also finds theoretical foundation. For example, Markusen and Rutherford (2004) develop a
three-period model where they show the following: In low-capacity countries foreign experts substitute
for domestic skilled workers and engage in productive activities in all periods, which implies minimal
spillovers through the labour market. With increasing absorptive capacity (i.e. higher initial human capital
in the host country) foreign experts and skilled domestic workers become complements in the sense that
domestic skilled workers are active in production while the foreign experts engage primarily in training
activities. At very high domestic human capital levels, domestic skilled workers can immediately learn
from foreign experts and thus substitute already in the second period for training activities by foreigners.
In the latter case, the economy becomes independent of foreign workers after the first period. In an
earlier paper, Rodriguez-Clare (1996) builds a new economic geography model which highlights the
developmental impact of multinational firms through the linkages which they create. These linkage
effects are stronger the more intensive the multinational is in the use of intermediate goods, the larger
the costs of communication and trade between headquarters and local plants and the more similar home
and host country are in terms of the variety of intermediate goods produced. This implies stronger
linkages, and thus greater positive effects, the smaller the developmental gap between donor and host
country. These are just two examples of the large body of theoretical literature on the effects of FDI in
receiving economies. Thus, for most of the channels outlined above, one can argue that positive
spillovers will only occur in a suitable setting. If the host economy does not provide an adequate
environment in terms of human capital, infrastructure, legal environment, and the like, many of the
spillovers that may potentially be generated by FDI can not materialize.
The industrial structure is one related aspect which can be decisive for the effects of FDI on the host
economy. Different stages of economic development are characterised by specific industrial patterns. In
line with the previous arguments, a high structural match between the donor and the host country would
imply a proximity in stage of development and thus also a good precondition for the absorptive capacity

6
of the receiving country to be high. In other words, the match between the industrial allocation of FDI and
the host country’s stage of development as characterised by its industrial structure determines the
effectiveness of FDI. We argue in this paper that the “optimal” pattern of FDI across industries varies
with the stage of development. The effect of FDI in the same industry but in countries at different stages
of development can be just as much different as the effect of FDI in one country but in different
industries.
2. Industrial Patterns of Inward FDI
Due to a lack of comparable data at the industry level, empirical research on the link between FDI and
development has largely remained at the macro level, since comparable FDI data across countries are
best available at this level. More recently, firm-level datasets have been released and, as a
consequence, the number of studies using micro data has grown rapidly. However, in contrast to the
macro-level analysis, which often takes a global perspective and analyses large cross-country data sets
(in the cross-section dimension as well as in the panel dimension), many firm-level studies are
constrained to one country or a homogenous group of countries (like the EU) due to issues of data-
availability and comparability.
In order to get a good picture of the link between FDI and growth of individual industries, we combined
several sources in the collection of our data base. Indicators like output, employment, gross fixed capital
formation and wages are taken from the UNIDO Industrial Statistics Database 2003.5 Data for CEECs
were taken from the wiiw Industrial Database 2004. Trade data were taken from the UN COMTRADE
database. FDI data were collected from different sources: Data for OECD members dating back to 1980
are available from OECD for seven categories: food; textiles and wood; petroleum, plastics, rubber and
chemicals; metal and mechanical products; office machinery; transport equipment; other manufacturing
industries. The mineral and leather industries are not allocated in this scheme and is thus included in
other manufacturing. In addition, a remainder category exists which we label “NA” (not allocated) and
which picks up statistical discrepancies among other things. FDI data for nine Central and Eastern
European countries (the new members states plus Croatia) are taken from the wiiw FDI Database
(Hunya and Schwarzhappel, 2005), which reports the data at the NACE, Revisions 1, 2-digit level. Again
industries were aggregated to match the OECD grouping. Finally, FDI data for Asian Countries are taken
from UNCTAD’s World Investment Directory Volume VII (2000). More recent data for ASEAN members
were available from the ASEAN Secretariat6. The latter data refer to approved investment projects with
foreign interest on total project cost basis. Where available, these data were compared to the figures
5 The greatest challenge with this edition was to overcome the change in nomenclature from the second to the third revision of the ISIC classification. In 2003, about half the countries included in our sample still reported according to Revision 2, while the more advanced countries had already switched to reporting according to Revision 3 only. Thus, we extracted the data at the most detailed 4-digit level for both revisions and concorded them into eight industry groups, which we could match with the FDI data obtained from OECD. 6 http://www.aseansec.org/home.htm

7
reported by UNCTAD for FDI and they were found to match closely. In general, we used FDI stock data.
In cases where only flow data was available, the PIM method was used to calculate stock data in form of
cumulated dollar flows. Additional FDI data for Taiwan and South Korea was obtained from Timmer
(2003) and the Investment Commission (MOEA, 1993).
In total, our data set contains more than 3000 observations for 28 to 35 countries, eight industries and 14
years (1987-2000). The data set is highly unbalanced, the number of countries varies over time, with
data for 28 countries over the years 1987 to 1997 and data for 35 countries over the years 1998 to 2000.
The ratio of inward FDI stock to output varies along all dimensions, across industries, years and
countries. For the complete sample, the FDI to output ratio ranges from far less than 1% in the textiles
and wood industry in Japan to more than 100% in the industry group comprising fuel, rubber, plastics
and chemicals in Indonesia. Also the variance is highest in the latter industry (see Figure 1).
Figure 1: FDI to output ratios, 1987 and 2000.
0.1
.2.3
.4FD
I to
outp
ut ra
tio
food textileswood petchem metals machinery transport
1987
0.2
.4.6
.81
FDI t
o ou
tput
ratio
food textileswood petchem metals machinery transport
2000
Note: The median is given by the bar in the middle of the box, the upper and lower bound of the box signifies the 25- and 75-
percentile. Observations which are outside the 75-percentile plus 1.5 times the innerquartile range, as well as observations
below the 25-percentile minus 1.5 times the innerquartile range are classified as outliers and drawn as dots.
It is further striking to see not only the rise in average FDI to output ratio, but also the rapid increase in
variance over time. In some cases, the ratio of FDI to total industry output has increased to 100%.7 The
general rise in FDI in relation to industry output clearly reflects the increasing internationalisation of
production. The additional sharp increase in variance across countries tells us that this
internationalization did not happen at equal rates for all countries and industries. While Asian countries
on average show higher shares of FDI in total industry output, they also exhibit much more variation
across individual countries than OECD members. Entering the picture at a much later point in time,
CEECs show again substantially higher FDI shares in output, yet with considerably less variation across
countries. Thus, this region experienced a uniformly high inflow of foreign capital into manufacturing. On
average, CEECs display higher FDI to output ratios than most other countries in the sample. Many of the 7 In a few cases, not shown in the figure, the stock of inward FDI valued at the end of the year exceeds the industry’s output of the same year, leading to a ratio above 100%. This may happen as a result of heavy foreign investment in a specific year. As a consequence of these investments, one would expect strong increases in output in the following years, for the theoretical reasons given above.

8
former communist countries allowed and actively encouraged the inflow of foreign capital as a way to
privatize the former state owned companies. Due to a general lack of domestic capital and the disruption
of state owned companies, with many inefficient firms exiting the market, the share of foreign capital was
especially high in transition countries.
Table 1 below gives average FDI to output ratios for different geographic regions towards the end of the
observation period. We classified countries into advanced OECD members (Australia, Austria, Denmark,
Finland, France, Germany, Iceland, Ireland, Italy, Japan, The Netherlands, Norway, Sweden, Great
Britain, USA), catching up OECD members (Greece, Mexico, Portugal, Spain, Turkey), the four Asian
Tigers (Taiwan, Hong Kong, Korea, Singapore), East Asia (Indonesia, Malaysia, Philippines, Thailand)
and CEECs (Croatia, Czech Rep., Hungary, Latvia, Poland, Slovak Rep., Slovenia). The table illustrates
nicely the two sources of heterogeneity, stemming from differences among countries as well as between
industries.
There are distinct differences between industries, with the highest ratio in general prevailing in the
petroleum, chemical, rubber and plastic industry. CEECs are the only region with the highest FDI to
output ratio in a different industry, for them the transport industry turns out to be the most FDI intensive
one. Apart from the strong role of FDI in petroleum, chemicals, rubber and plastics, all regions differ with
respect to the importance of FDI in individual industries. Thus, the data exhibit very large disparities
across regions as well as across industries, supporting our argument of the two sources of heterogeneity
in the relationship between FDI and output or productivity. Let us briefly identify these differences here.
Besides the high FDI to output ratio in the petroleum and chemical industry, advanced OECD countries
show relatively low FDI to output ratios of far less than 10% in all other industries. For the group of
catching-up OECD countries, FDI is important in the metal and machinery industry, the ratio of more
than 13% is nearly as high as in the petroleum and chemical industry (16%). The four Tigers are
characterised by a high FDI ratio again in the petroleum and chemical industry (16%), as well as in the
manufacture of electrical machinery (12%), where they also show strong international competitiveness.
East Asia has an extremely high ratio of FDI in the petroleum and chemical industry (30%), and equally
high ratios of 11%-12% in textiles and wood as well as electrical machinery. Finally, CEECs are
characterised by higher FDI ratios than all other groups in all industries with the exception of petroleum /
chemicals and metals / machinery. They receive relatively high inward FDI first of all in transport
equipment (18%), followed by petroleum and chemicals (15%), and further in electrical machinery and
food (about 14%).
Table 1: FDI-output ratios, 1998-2000.
9
adv.
OECD catch-up
OECD 4 Tigers East Asia CEEC Food 4.6 10.5 7.1 2.9 13.7Textiles/Wood 7.4 7.7 4.6 11.8 12.2Pet/Chem 15.7 16.3 16.1 30.4 15.4Metals/Machinery 5.7 13.3 4.5 9.0 9.1Transport 3.6 9.5 4.6 6.7 18.6Electrical machinery 6.6 8.3 12.4 11.1 13.7
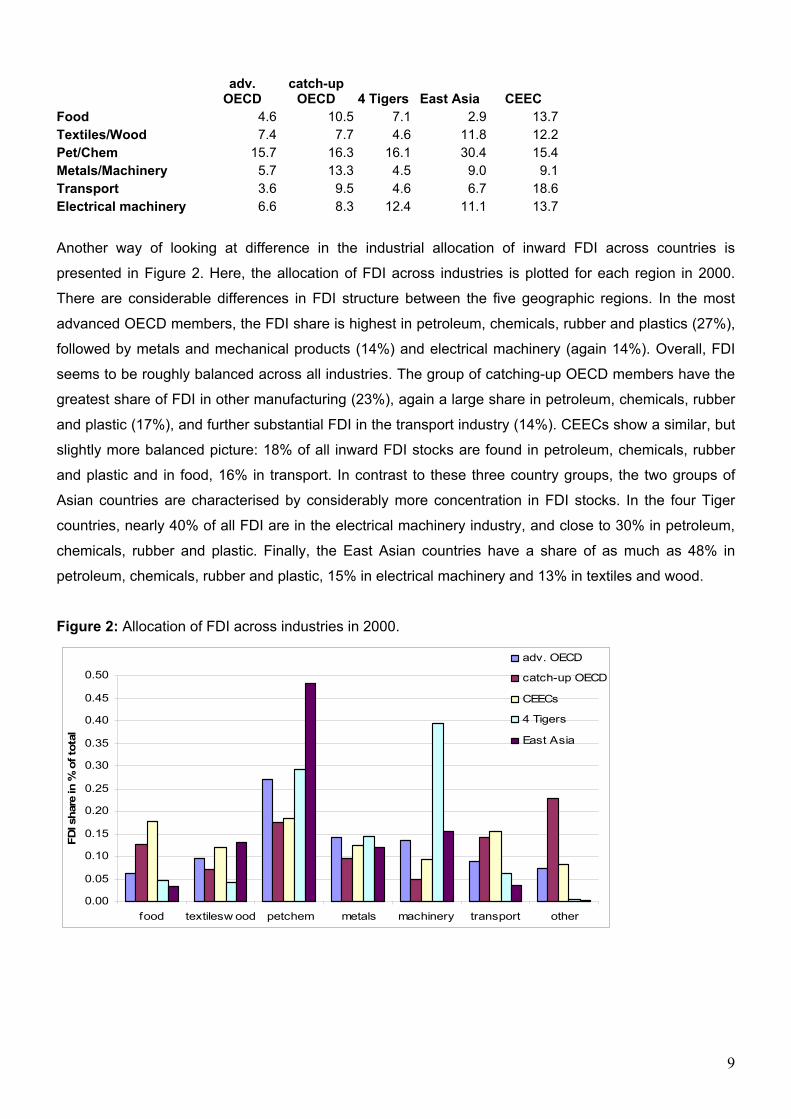
Another way of looking at difference in the industrial allocation of inward FDI across countries is
presented in Figure 2. Here, the allocation of FDI across industries is plotted for each region in 2000.
There are considerable differences in FDI structure between the five geographic regions. In the most
advanced OECD members, the FDI share is highest in petroleum, chemicals, rubber and plastics (27%),
followed by metals and mechanical products (14%) and electrical machinery (again 14%). Overall, FDI
seems to be roughly balanced across all industries. The group of catching-up OECD members have the
greatest share of FDI in other manufacturing (23%), again a large share in petroleum, chemicals, rubber
and plastic (17%), and further substantial FDI in the transport industry (14%). CEECs show a similar, but
slightly more balanced picture: 18% of all inward FDI stocks are found in petroleum, chemicals, rubber
and plastic and in food, 16% in transport. In contrast to these three country groups, the two groups of
Asian countries are characterised by considerably more concentration in FDI stocks. In the four Tiger
countries, nearly 40% of all FDI are in the electrical machinery industry, and close to 30% in petroleum,
chemicals, rubber and plastic. Finally, the East Asian countries have a share of as much as 48% in
petroleum, chemicals, rubber and plastic, 15% in electrical machinery and 13% in textiles and wood.
Figure 2: Allocation of FDI across industries in 2000.
0.00
0.05
0.10
0.15
0.20
0.25
0.30
0.35
0.40
0.45
0.50
food textilesw ood petchem metals machinery transport other
FDI s
hare
in %
of t
otal
adv. OECD
catch-up OECD
CEECs
4 Tigers
East Asia

10
Let us further report a few observations that cannot be seen from the above figures.8 Structural
developments have also been diverse between these regions, with more structural change in both
groups of OECD countries as opposed to more stable FDI patterns in East Asian countries (including the
four Tigers). Very little can be said about developments in FDI structures for CEECs, given the extremely
short period over which industrial FDI data is available for these countries. There is further a low
correlation between FDI patterns and output patterns in both groups of OECD countries and in East
Asia. The four Asian Tiger economies and CEECs seem to be an different with closely matching FDI and
output structures. In the case of the four Tiger countries, where the observation period extends over 20
years, the sequencing of industry patterns suggests that high FDI shares in electrical machinery have
resulted in subsequently high output shares in the industry. For the CEECs, the time period is too short
for any conclusions. However, FDI seems to play a more important role in those two regions and less so
in other.
One can see that the data on FDI exhibit a substantial degree of heterogeneity across countries and
industries. The question if and how these differences relate to differences in international
competitiveness or domestic development cannot be answered without a rigorous econometric analysis.
This will be done in the following sections.
3. Analytical framework
In this paper we do not follow the often embarked approach of using a neoclassical production function
framework. Very generally, we look for empirical evidence of transfers and spillovers from FDI on the
host country, controlling for cross-country and cross-industry heterogeneity. We chose to investigate the
effects of FDI at the industrial level, thus we are unable to distinguish between own and inter-firm effects
as well as between different forms of spillovers. We rather allow for all types of effects without
distinguishing between them by analysing the specific industries in which they matter most. We decided
to work on the industry level, because first, we believe that there is a substantial degree of heterogeneity
among industries which is influential in the relationship between FDI and output or productivity growth.
Second, industrial policy is an important economic policy tool available to governments in order to foster
economic development. Historical evidence has shown that industrial policies were highly relevant in
causing the East Asian growth miracle over the past decades. Thus, industry level analysis is necessary
to identify the differences between individual industries.
In deriving our empirical specification we follow Nair-Reichert and Weinhold (NRW 2001) who explore
the relationship between FDI and economic growth at the macro economic level, putting a special
emphasis on causality and on cross-country heterogeneity in the sample. We take up the second issue
8 See Woerz (2005) for a detailed description of the data.

11
and adapt their specification to include industry specific FDI. Using panel data estimation, we thus allow
not only for heterogeneity arising from the inclusion of countries at different stages of development, but
we also allow for heterogeneity stemming from the type of economic activity that receives FDI inside a
country. Since we have a panel of country/industry-combinations over time, we are dealing in fact with
three dimensions. In our estimation method we take account of this by allowing for different error
components along these dimensions. To emphasize this point, we do not simply treat every
country/industry-combination as one individual “economy”, but we explicitly allow for industry
characteristics that are associated with certain economic activities and thus vary across industries, but
remain constant across countries and over time. We additionally include country-specific effects that vary
across countries only and are independent of the respective industry and time period. In its present form
the model also takes account of spillovers between industries. Still, we cannot explicitly differentiate
between different types of spillovers. However, we see it as a first step to control for this heterogeneity,
and allowing for interactions between industries.
As in NRW (2001) our basic research question is whether an increase in FDI will lead to an increase in
the growth rate of output. We take the growth rate of all variables for the same reasons as NRW (2001)
that we are interested in the effect of FDI on output in a specific country and industry over time. We want
to investigate whether a higher growth of FDI in comparison to other industries and countries will result in
higher output growth, once we control for time-invariant country specific characteristics and for the
growth of other control variables (capital and exports). We expect to see different results for different
country-industry pairs, reflecting the considerations about the importance of the stage of development
given above. As pointed out by NRW (2001), another advantage when using growth rates instead of
levels is that the variables are much more likely to be stationary, which is important if one wants to avoid
the possibility of obtaining spurious results.
However, one problem arose when we calculated growth rates of our variables: Since in some countries,
FDI in quantitatively smaller industries was often very low in the beginning, extremely high growth rates
of FDI (often exceeding 100% by a multiple) were observed due to a level effect. These high growth
rates would have led to a high weight of economically negligible observations in the estimation.
Therefore, we chose to normalize FDI and all other control variables by the industry specific output
level.9 Thus, for our explanatory variables, we always used their ratio to output (and growth thereof).
We use a simple model based on the one in NRW (2001), which in its levels specification considers that
output in the current year depends on investment share from the previous year:
9 We also normalized FDI by employment, however, we believe that this gives a different flavour to the analysis. FDI to employment ratio values are higher for the less labour intensive industries, yielding potentially higher growth rates in the labour intensive industries. This induces a bias towards labour intensive industries. The results were indeed quite different, indicating no importance of FDI in less labour intensive and therefore more high tech industries.

12
=
−
−
1
1
it
itit Y
IfY
In order to find a causal relationship à la Granger, the question could be how much will changes in the
share of investment in one period lead to changes in growth in a subsequent period:
=−
−
−−
1
11
it
ititit Y
IDfYY
Splitting investment share into FDI and domestic investment, and taking into account that in an
international context the openness of the economy might have an important influence on growth, the
model looks like this:
=
−
−
−
−
−
−
1
1
1
1
1
1 ,,it
it
it
it
it
itit Y
EXD
YINV
DYFDI
DfDY
The same model can be written in its growth rates version, which is less constrained than the equivalent
in levels above, in the sense that is less dependent on the initial levels in every country in a cross-
section context. Furthermore, growth rates are more likely to be stationary, while levels may not be,
especially in the case of less developed countries (Weinhold, 1996). In this way, the question to be
answered here is, if FDI share grows faster compared to other countries, will GDP grow also faster? This
is essentially a dynamic question, however, it can be answered within a static model. The static model is
a first approach and it avoids the usual problems with dynamic models, that is, important biases in
efficiency when the sample is very heterogeneous, as is the case here.
The heterogeneity problem can be palliated by splitting the sample into different subsamples of
countries, according to their stage of development – advanced or catching-up. A different behaviour for
both subsamples is expected (see also de Mello, 1999).
There might be also a problem of endogeneity bias because FDI could be determined together with
domestic investment and with openness. One lag in the independent variables can help to avoid
simultaneity between growth and explanatory variables. The efficiency bias could be reduced by
instrumenting in a long time series panel, but with a short time dimension the effect of a weak instrument
cannot be assesed (Kiviet 1995).
So the econometric model to be estimated in this paper is the following:

13
icticictiictiictiict GEXGINVGFDIGY εµβββα +++++= −−− 131211 ***
Where icµ is the individual specific error component and ictε is the basic error component. In our
sample we have three dimensions, countries c, industries i and years t. We estimate a one way error
component random effects model with pooled industries and years as the individual specific error
component.
In a second step, we will interact FDI with the control variables in our model for the following reason: The
effect of foreign capital may depend on the amount of investment as such in the sense that a certain
amount of investment in an industry is necessary for the effects of FDI to materialize. FDI is further
related to trade, whereby it can act as a complement or a substitute for the exchange of goods. These
two possibilities arise primarily from differences in the motives for FDI. Resource- or labour-seeking FDI
is often associated with a complementary relationship to trade and can result in footloose production
units, which move globally in order to utilise the necessary resources. Thus, the potential for spillovers
with a positive influence on long-run development in a specific location is limited. The effect of FDI on the
development of this industry in the respective host country may even be negative if, for instance adverse
employment effects occur once production units are moved away from the particular host country to
another host. On the other hand, market-seeking and strategic FDI, substituting for arm’s length trade,
pursues very different objectives and as a consequence positive effects on the industry’s development in
the host country may result from linkages with upstream producers as well as downstream consumers.
As discussed earlier, the literature mentions threshold effects with respect to FDI. For example,
Borensztein et al. (1998) report a significant impact of a certain level of human capital as a necessary
condition for FDI to show a positive influence. These factors are much more likely to play an important
role in specific industries. We therefore also test whether our coefficient on FDI is affected by this factor
by interacting FDI with measures for human capital and with the respective country’s per capita income
level, measured at purchasing power parities.
Let us add a few more econometric remarks before reporting our results: First, we stress the impact of
heterogeneity in the FDI-growth nexus and we further expect a great deal of heterogeneity in our specific
sample. Since this is the case, we base our conclusions on heteroskedastic-consistent standard errors
(HC-type 1). Second, for every specification, we decided on fixed versus random effects based on the
results of the Hausman test between the two models. Since the test was mostly in favour of random
effects, we always report these results. We also think that the incompleteness of our data (with individual
countries and industries missing in some years but not in others) calls for a treatment of the country
specific effects as being drawn randomly from a common population. However, in the few cases, where
the Hausmann test rejected the use of a random effects model, we report both, the fixed and the random

14
effects results. Third, when we ran the estimations including lagged output growth on the right hand side
we got similar results. We interpret this as an indication that growth rates are stationary over time.
4. Empirical Results
4.1. The impact of FDI on output growth
Table 2 reports the summary of results from estimating the above discussed empirical model, including
various interaction terms. The detailed results are available from the authors upon request.
The results for the basic model in column 1 show that a significant effect from FDI is seen in the food
industry. This can be explained by the importance of marketing, brand names and the like for this
industry. In two more industries the impact from FDI on output growth is significant: first in textiles and
wood and second in the group containing the petroleum, chemicals, plastics and rubber industry
(henceforth called PETCHEM). The result for textiles/wood is surprising. Since the industry category
PETCHEM includes among others pharmaceuticals a strong effect from FDI can be expected. However,
one would also have expected FDI in the electrical machinery industry to play a role for output growth.
Still, it appears that the effect of FDI on output growth is not unique across industries. The effect from
FDI seems to matter more in lower-tech, resource intensive industries according to these first results.
Next, we interact FDI with investment, since it is often pointed out that a sufficient level of investment is
important to bring out the positive effects of FDI. High investment implies newer vintages of the capital
stock and as a result the structure of the capital stock is more suited to absorb new technologies. Thus,
FDI in combination with high investment may result in highly favourable conditions for subsequent output
growth. Conversely, the role for FDI may be severely limited when it is not accompanied by sufficient
investment in general. This idea is captured by a multiplicative term of FDI growth and the investment
share in our specification. The coefficient on the interaction term is expected to be positive. We further
interact FDI with openness on the export side because the two are often seen as complements and
again, FDI may have a qualitatively different impact in export-oriented industries as compared to
domestic-market oriented industries. The sign on this interaction term is in principle ambiguous and
partly related to the motive for FDI. Labour- or resource-seeking FDI is clearly associated with high
exports, thus if this type of FDI promotes growth, the coefficient on the interaction term should be
positive. However, such forms of FDI may be detrimental for the host country, as in the Nigerian example
(Akinlo, 2004). In this case the coefficient would be negative. In the case of market seeking FDI no clear
relationship between FDI and exports is expected in the first place (i.e. they may be complementary or
substitutes), hence no clear predictions can be made about the sign of the coefficient on the interaction
term.

15
Table 2: Summary of results for output growth, GLS estimation ( 1 ) ( 2 ) ( 3 )
GFDI
Food + Textiles/Wood +
PETCHEM +
Food -Textiles/Wood -
PETCHEM -Transport -
Other -
Textiles/Wood -PETCHEM +
Transport -
GINV Textiles/Wood +
PETCHEM + Transport +
Food -Textiles/Wood +
Transport +
PETCHEM +Metals/Mach. +
Other -
GEX Food +
Textiles/Wood + PETCHEM +
Transport +
Food +Transport +
PETCHEM +
GFDI*INV
- Food +Textiles/Wood +
PETCHEM +Transport +
Other +
-
GFDI*OPEN
- - Food + Textiles/Wood +
PETCHEM +Metals +
Transport +adj. R-squared 94.58 97.86 97.41Notes: Dependent variable is output growth; only significant effects are reported, the sign of the effect is indicated by + and - signs; number of observations in all specifications = 1,152.
The interactions with investment and openness both change the results greatly. It appears that a positive
growth impact from FDI arises only in connection with high investment levels in almost all industries. The
purely exogenous effect from FDI alone is mostly negative. With the interaction terms, a significant effect
from FDI arises also in the transport industry. In other words, FDI leads to increased output growth only
in the presence of high investment shares.
Turning to the interaction with openness of an industry in some detail, the only industry with an additional
significant impact from FDI alone is the PETCHEM industry which is a special industry group. It would be
highly desirable to have detailed information on each individual industry contained in this group, since
petroleum extraction is not only very capital intensive, but also very closely tied to endowments and thus
not relevant for every country in the sample. Chemicals on the other hand cover a very wide spectrum of
economic activities ranging from low-skill, resource intensive production to high-skill, technology
intensive activities (such as pharmaceuticals). However, for the present sample, covering a wide range
of countries, any further disaggregation was not possible.
Again FDI in the electrical machinery industry, comprising activities such as the manufacture of
computers and information and communication equipment, show no significant effect on output growth.
Actually, it is surprising that for none of the three variables - FDI, investment and exports – a significantly

16
positive coefficient was observed in this industry. We interprete this finding as follows: International
knowledge and technology spillovers (through FDI and/or trade) are either too small or too difficult to be
absorbed in this high-tech and high-skill industry. In contrast, the medium skill intensive transport
industry seems to be especially conducive for significant and positive spillovers from FDI. The
coefficients on all three variables – FDI, investment, and openness - are often significant in less skill
intensive industries, i.e. transport equipment. This specific result reflects the special importance that the
transport sector in general and in particular outsourcing and international fragmentation in this sector
receive in catching-up countries, especially in the OECD members among them (like Mexico, Spain,
etc.). The same holds true for food and textiles.
The specifications including the interaction terms indicate that FDI on its own does not show significant
effects, it needs to be accompanied by something else in order to have statistically significant effects in
almost all industries apart from PETCHEM. The question now arises what this “something else” is. In
other words, it is not clear from our analysis whether the impact from FDI is tied to the level of
investment in the industry, to the openness of the industry and how much other factors such as stage of
development and human capital add to this link.
Given the importance attached to the stage of development as a determinant of the absorptive capacity
of a country in the literature, we will now focus more on the role of absorptive capacity. In Table 3 we
look at the interdependencies between the stage of development (as a more general determinant of
absorptive capacity than human capital) and the two other controls, investment and openness. Since a
three-way interaction would not lead to any meaningful interpretation of the coefficients, we divided our
sample into two broad groups which can roughly be associated with differing stages of development. The
first group contains advanced OECD member countries, while all other countries are classified as
catching-up countries and subsumed in the second group (see Appendix Table A1 for a listing of
countries and their grouping). These two groups of countries are relatively homogenous in terms of
schooling, initial and current GDP. The summary of results in Table 3 strongly supports our decision to
treat these two groups of advanced and catching-up countries separately.

17
Table 3: Summary of results for output growth by stage of development ( 1 ) ( 2 ) ( 3 )
GFDI-adv PETCHEM + no effects no effects
GFDI-catchup
Food + Textiles/Wood +
PETCHEM +Metals/Mach. +
Transport +el. Machinery +
Food -Textiles/Wood –
PETCHEM +Transport +
el. Machinery +Other +
Food -Textiles/Wood –
PETCHEM -
GINV- adv no effects no effects no effects
GINV- catchup Textiles/Wood +
PETCHEM +Metals/Mach. -
Food -Textiles/Wood +
PETCHEM +Transport -
Metals/Mach. –Other -
GEX- adv no effects no effects no effects
GEX- catchup Food +
Textiles/Wood +PETCHEM +Transport +
Food +PETCHEM + Transport +
PETCHEM -
FDI*INV- adv - no effects -
FDI*INV- catchup
- Food +Textiles/Wood +
Transport – Other -
-
FDI*OPEN- adv - - Metals +
FDI*OPEN- catchup
- - Food + Textiles/Wood +
PETCHEM +Transport +
adj. R-squared 97.00 97.80 98.68 Notes: Dependent variable is output growth; only significant effects are reported, the sign of the effect is indicated by + and - signs; number of observations in all specifications = 1,152.
The distinction between advanced and catching up countries increases the fit of the model. But more
interestingly, FDI mainly exerts a statistically significant effect in the subsample of catching-up countries.
For the subsample of advanced OECD countries, the positive association between FDI and output
growth can be confirmed for PETCHEM only. In the subsample of catching-up countries, nearly all
industries show up with a positive and significant coefficient on the FDI ratio as before. However, this
finding is modified when interaction terms are introduced. If interacted with investment levels, the
marginal impact of FDI alone is mostly negative again. For the group of advanced countries, no effects
from FDI (marginally and in interaction with investment) are observed.
The degree of openness also impacts strongly on the relationship between FDI and output growth. While
only few effects are found for the subsample of advanced countries (one direct and one interaction
effect, each in an rather capital intensive, medium tech industry), the group of catching up countries
show an interesting result. In all industries with the exception of electrical machinery, the direct effect

18
from growth of the FDI ratio is negative, while when interacted with openness, the effects become
positive. In other words, export orientation plays a crucial role for potential positive effects from FDI in
catching up countries. FDI leads to positive growth effects only in combination with a high export ratio,
while the marginal effect of FDI for a given level of openness is even negative in most industries. The
results suggest that FDI flowing to catching-up countries generates a positive influence on growth mainly
in outward oriented industries.
To summarize briefly these results, FDI in the advanced countries does not show strong effects in any
industry. As we have seen earlier (in Table 1), these countries are also characterised by comparably low
FDI to output ratios, thus this result is not surprising. Already quantitatively, FDI plays a much smaller
role in these countries than in catching up countries. For the latter group, FDI is more important, however
its impact on output growth is ambiguous. Investment shares in the same industry as well as – more
crucially – openness of the industry are important factors for a positive effect to be realized.
Our results point towards a strong role for the stage of development in the relationship between FDI and
growth, which has also been mentioned in previous research (Borensztein et al. 1998, NRW 2001,
Blonigen and Wang, 2004). Our focus on individual industries here allows us to identify certain industries
where inward FDI in combination with high investment or outward oriented production offers the greatest
potential for output growth given a certain stage of development.
4.2. The impact of FDI on productivity growth
So far we have looked at output growth as our dependent variable. This has given us an indication of the
effects of FDI in individual industries. However, the correlation between FDI growth and output growth
may be spurious if fast growing and hence more dynamic industries simply attract more FDI than
stagnant industries. Therefore we turn next to the relationship between the growth of labour productivity
and FDI growth. This indicates whether FDI improves the efficiency of production. The problems of
reverse causation and endogeneity are not removed by using productivity growth as our dependent
variable. Thus we are in general reluctant to talk about causation. However, indirect effects and thus
spillovers are better captured when looking at productivity growth rather than output growth. Using
productivity growth as our dependent variable will allow us to assess the improvements in efficiency
concomitant with increases in FDI in a certain industry/country pair.
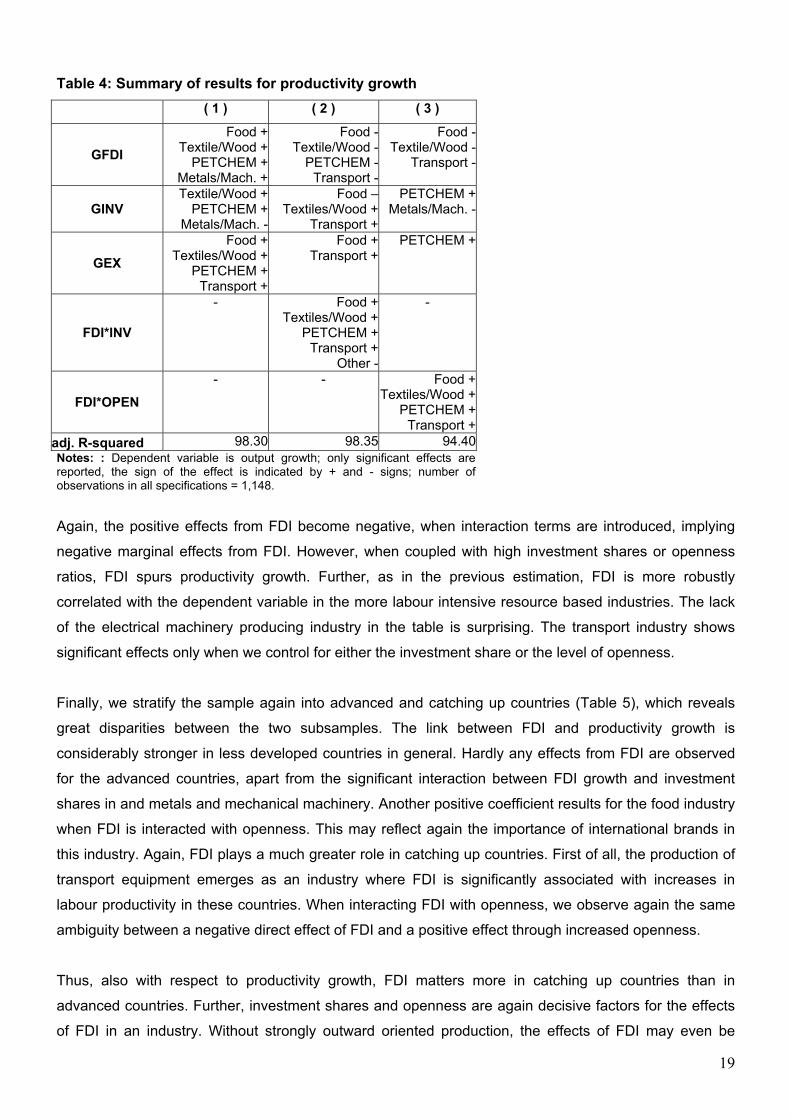
Table 4 shows the summary of results obtained from using our basic model without interactions, when
we replace output growth with labour productivity growth as the dependent variable. Table 5 reports the
results for productivity growth using the additional interaction between stage of development (advanced
versus catching-up) and FDI.
19
Table 4: Summary of results for productivity growth ( 1 ) ( 2 ) ( 3 )
GFDI Food +
Textile/Wood +PETCHEM +
Metals/Mach. +
Food -Textile/Wood -
PETCHEM -Transport -
Food -Textile/Wood -
Transport -
GINV Textile/Wood +
PETCHEM +Metals/Mach. -
Food –Textiles/Wood +
Transport +
PETCHEM +Metals/Mach. -
GEX Food +
Textiles/Wood +PETCHEM +
Transport +
Food +Transport +
PETCHEM +
FDI*INV
- Food +Textiles/Wood +
PETCHEM + Transport +
Other -
-
FDI*OPEN - - Food +
Textiles/Wood +PETCHEM + Transport +
adj. R-squared 98.30 98.35 94.40Notes: : Dependent variable is output growth; only significant effects are reported, the sign of the effect is indicated by + and - signs; number of observations in all specifications = 1,148.
Again, the positive effects from FDI become negative, when interaction terms are introduced, implying
negative marginal effects from FDI. However, when coupled with high investment shares or openness
ratios, FDI spurs productivity growth. Further, as in the previous estimation, FDI is more robustly
correlated with the dependent variable in the more labour intensive resource based industries. The lack
of the electrical machinery producing industry in the table is surprising. The transport industry shows
significant effects only when we control for either the investment share or the level of openness.
Finally, we stratify the sample again into advanced and catching up countries (Table 5), which reveals
great disparities between the two subsamples. The link between FDI and productivity growth is
considerably stronger in less developed countries in general. Hardly any effects from FDI are observed
for the advanced countries, apart from the significant interaction between FDI growth and investment
shares in and metals and mechanical machinery. Another positive coefficient results for the food industry
when FDI is interacted with openness. This may reflect again the importance of international brands in
this industry. Again, FDI plays a much greater role in catching up countries. First of all, the production of
transport equipment emerges as an industry where FDI is significantly associated with increases in
labour productivity in these countries. When interacting FDI with openness, we observe again the same
ambiguity between a negative direct effect of FDI and a positive effect through increased openness.
Thus, also with respect to productivity growth, FDI matters more in catching up countries than in
advanced countries. Further, investment shares and openness are again decisive factors for the effects
of FDI in an industry. Without strongly outward oriented production, the effects of FDI may even be

20
negative in less advanced countries. The results for the interaction with investment shares are less
conclusive. While in labour intensive industries (food and textiles/wood), foreign investment needs to be
accompanied by sufficiently high investment for a positive impact on productivity growth and the
additional effect from FDI is negative, the signs are reversed in all other industries.
Table 5: Summary for productivity growth by stage of development ( 1 ) ( 2 ) ( 3 )
GFDI-adv no effect no effect No effect
GFDI-catchup
Food +Textile/Wood +
PETCHEM +Metals/Mach. +el. Machinery +
Transport +
Food -Textile/Wood -
PETCHEM +Metals/Mach. +el. Machinery +
Transport +Other +
Food -Textile/Wood -
PETCHEM -
GINV- adv No effect No effect Other +
GINV- catchup Textile/Wood +Metals/Mach. -
Food -Textiles/Wood +
Metals/Mach. -Other -
GEX- adv no effect no effect No effect
GEX- catchup Food +
Textile/Wood +PETCHEM +
Food -PETCHEM +
Transport +
No effect
FDI*INV- adv - Metals + -
FDI*INV- catchup
- Food +Textile/Wood +el. Machinery -
Transport -Other -
-
FDI*OPEN- adv - - Food +
FDI*OPEN- catchup
- - Food +Textile/Wood +
PETCHEM +Transport -
adj. R-squared 97.48 98.33 98.89 Notes: : Dependent variable is output growth; only significant effects are reported, the sign of the effect is indicated by + and - signs; number of observations in all specifications = 1,148.
5. Are CEECs different?
Like few other countries, Central and Eastern European countries (CEECs) have experienced a rapid
transformation of their output and trade patterns over the past decade and FDI has played a decisive
role in this transformation process. Compared to the sample in total, the group of CEECs represents a
very homogenous group despite some fundamental differences with respect to how FDI was treated
during the transformation process. FDI inflows in these countries were closely connected to the process
of privatization. Privatization policies in turn have been very distinct in individual CEECs. While Hungary
pursued a policy of early privatization via the capital market, thus attracting large FDI inflows into all

21
sectors, the voucher privatization in e.g. the Czech Republic implied that foreign capital was kept out of
the country for a relatively long time period. Poland started to privatize state-owned firms at a later point
in time; thus FDI inflows occurred at a later stage. Consequently, the timing and industrial spread of
foreign capital inflows into individual CEECs differed because of different privatization policies. Still, FDI
inflow into these countries were highly dynamic. Also, they share some common characteristics. For
instance, due to the coincidence of privatization with some lack of domestic capital and the closing down
of inefficient firms, FDI stocks in relation to output are very high (see Table 2).
For CEECs, the distribution of FDI across industries is distinct from the distribution found for other
country groups, like OECD and Asia. CEECs show a higher share of FDI in the food industry, but also in
the transport industry. Using our estimating framework, we will investigate, whether CEECs fit into the
picture we have drawn in the previous section. Table 6 summarizes the results from estimating the same
equation as above for the subset of CEECs only. FDI exhibits a significant growth promoting effect in
only a few industries. In the first specification, without interaction terms, no significant influence from FDI
growth is found in any industry. When interacting FDI with investment or openness, the electrical
machinery industry emerges as the only industry, where FDI has spurred growth in interaction with either
high investment levels or a high degree of export orientation. The results for output and productivity
growth are very similar. The export-led growth experience of CEECs in the most recent past can also be
read from the table.
Table 6: Results for CEECs
dep. var: output growth productivity growth (1) (2) (3) (1) (2) (3)
GFDI No effect PETCHEM + PETCHEM +
el. Mach. -No effect No effect el. Mach. -
GINV el. Mach. + el. Mach. - Metals/Mach. -
el. Mach. -el. Mach - No effect No effect
GEX
PETCHEM + Metals/Mach. +
el. Mach + Transport +
PETCHEM + Metals/Mach. +
PETCHEM + Transport +
PETCHEM +el. Mach +
PETCHEM + PETCHEM +
GFDI*INV - el. Mach. + - - el. Mach. + -
GFDI*OPEN - - el. Mach. + - - el. Mach. +
adj. R-squared 96.08 98.32 97.73 75.32 77.27 77.60Notes: Dependent variable is output growth; only significant effects are reported, the sign of the effect is indicated by + and - signs; number of observations in all specifications = 55
The results are remarkable in two ways. First, the observation period for this group of countries is much
shorter than for the sample as a whole. In general, one would expect to see effects from FDI on the
22
growth rate only after a certain time lag. These countries already show a significant correlation after a
very short time period. Second, in Central and Eastern Europe, FDI has a significant influence in fewer
industries, but – in contrast to the full sample before – in the manufacture of electrical machinery. S
significant growth effects are observed in this more high tech and skill intensive industry. Again, the
existence of a sufficient investment share as well as export orientation are important. In general, the
result confirms the rapid and successful transformation of these countries.
6. Conclusions
We can conclude from our empirical analysis that the impact of FDI on economic development (in terms
of output growth as well as in terms of efficiency and thus productivity gains) differs between countries at
different stages of development with a greater role for FDI in lagging economies. Further, the results
differ across individual industries. For a country’s long term prospects it is thus crucial, which types of
industries receive foreign capital and not so much the aggregate amount of FDI flowing into a country.
This has important implications for the design of industrial and trade policies as well as for policies
restricting or allowing capital mobility across borders. The decisions, when, how, and which industries to
open to the international capital market are important and should be guided by the long-run implications
of FDI in different industries.
Secondly, not only the industrial allocation in connection with the timing of FDI over the development
process matters, there are also important interactions between FDI and investment as well as between
FDI and export orientation. FDI often turns out to be an important contributor to growth in combination
with investment or exports. This is especially true for the group of catching-up countries, where the
interaction between openness and FDI is often positive while the direct effect of FDI is negative in most
industries. Therefore, we conclude that FDI can be an important contribution to the host country’s
economic development, provided that the conditions and/or the economic environment is conducive to
bringing out its positive impact.
Finally, we should stress here again that the causality between FDI and growth remains unclear. Using a
sophisticated econometric technique, which allows for country specific heterogeneity in a panel across
countries and time, NRW (2001) find a causal relationship between FDI and aggregate economic growth
and some evidence that the efficacy of FDI is higher in more open economies. However, they also
emphasize that the relationship is highly heterogeneous across countries. We tried to avoid the issue of
causality by using lagged values of FDI and all other explanatory variables in the regressions. Given
certain limitations in the data (most importantly, the short time series dimension and the highly
unbalanced sample) we were not able to do a rigorous causality test in this case. This remains on the
agenda for future research.

23
References
Akinlo E. (2004), Foreign Direct Investment and Growth in Nigeria: An Empirical Investigation, Journal of
Policy Modeling 26 (5), 627-639.
Bellak, C. (2004), How Domestic and Foreign Firms Differ and Why Does it Matter?, Journal of
Economic Surveys 18(4), 483-514.
Blomström, M., R.E. Lipsey and M. Zejan (1994), What Explains Developing Country Growth?, NBER
Working Papers 4132.
Blonigen, B.A. and M. Wang (2004), Inappropriate Pooling of Wealthy and Poor Countries in Empirical
FDI Studies, NBER Working Paper No 10378.
Borensztein E., Gregorio, J.D. and Lee, J.W. (1998), How does foreign direct investment affect economic
growth?, Journal of International Economics 45 (1), 115-135.
Caves, R. (1996), Multinational Enterprise and Economic Analysis, New York, Cambridge University
Press.
Dunning, J.H. (1988), The Eclectic Paradigm of International Production: a Restatement and Some
Possible Extensions, Journal of International Business Studies 19 (1), 1-31.
Görg H. and E. Strobl (2004), Outsourcing, foreign ownership, exporting and productivity: An empirical
investigation with plant level data, Paper presented at the 6th Annual Meeting of The European
Trade Study Group 2004, Nottingham.
Halpern L. and B. Muraközy (2005), Does Distance Matter in Spillover?, CEPR Discussion Paper No.
4857.
Hunya, G. and M. Schwarzhappel (2005), Opportunities for Acquisition and Outsourcing; wiiw Database
on Foreign Direct Investment in Central, East and Southeast Europe 2005.
Kinoshita Y. (2001), R&D and Technology Spillovers Through FDI: Innovative and Absorptive Capacity,
CEPR Discussion Paper No. 2775.
Kiviet, J. (1995), On bias, inconsistency, and efficiency of various estimators in dynamic panel data
models; Journal of Econometrics 68, 53-78.
Markusen J. and T. Rutherford (2004), Learning on the Quick and Cheap: Gains from Trade Through
Imported Expertise, CEPR Discussion Paper No. 4504.
MOEA (dec 31, 1993) Statistics on Overseas Chinese and Foreign Investment, Taiwanese Investment
Commission.
Nachum, L., J.H. Dunning and G.G. Jones (2000), UK FDI and the Comparative Advantage of the UK,
The World Economy 23 (5), 701-720.
Nadiri (1993), Innovations and Technological Spillovers, NBER Working Paper No. 4423.

24
Nair-Reichert, U. and D. Weinhold (2001), Causality tests for cross-country panels: a new look at FDI
and economic growth in developing countries; Oxford Bulletin of Economics and Statistics, 63 (2),
153-171.
Rodriguez-Clare (1996), Multinationals, Linkages, and Economic Development, The American Economic
Review 86 (4), 852-873.
Timmer, M.P. (2003) Technological development and rates of return to investment in a catching-up
economy: the case of South Korea, Structural Change and Economic Dynamics, 14 (4), 405-425.
UNIDO (2003), Industrial Statistics Database.
UNCTAD (2000), World Investment Directory Volume VII – Asia and the Pacific.
Van Pottelsberghe De La Potterie, B and F. Lichtenberg (2001), Does Foreign Direct Investment
Transfer Technology Across Borders? The Review of Economics and Statistics Vol. 83 (3), 490-
497.
Woerz, J. (2005), Industry Patterns in Output, FDI and Trade - A regional comparison of CEECs to
OECD and East Asia, forthcoming as wiiw Statistical Report.

25
Appendix
Table A1: Listing of countries and grouping
Group UNIDO code ISO code Country 36 aus Australia 40 aut Austria
208 dnk Denmark 246 fin Finland 250 fra France 276 deu Germany 352 isl Iceland 380 ita Italy 392 jpn Japan 528 nld The Netherlands 578 nor Norway 752 swe Sweden 826 gbr Great Britain
adva
nced
OEC
D
840 usa USA 191 hrv Croatia 203 cze Czech Republic 300 grc Greece 348 hun Hungary 344 hkg Hong Kong 372 irl Ireland 360 idn Indonesia 428 ltv Latvia 410 kor Korea 484 mex Mexico 458 mys Malaysia 608 phl Philippines 616 pol Poland 620 prt Portugal 702 sgp Singapore 703 svk Slovak Republic 705 svn Slovenia 724 esp Spain 158 twa Taiwan 764 tha Thailand
catc
hing
-up
792 tur Turkey
Top Related