


Languages
Pages
Legal


Goldman Sachs Presentation to
Credit Suisse Financial Services Conference
February 13, 2018
Lloyd C. Blankfein
Chairman and Chief Executive Officer

Today’s presentation includes forward-looking statements. These statements are not historical facts, but instead represent only the
Firm’s beliefs regarding future events, many of which, by their nature, are inherently uncertain and outside of the Firm’s control.
Forward-looking statements include statements about potential revenue and growth opportunities and statements about the effect
of the Tax Cuts and Jobs Act (Tax Legislation). It is possible that the Firm’s actual results, including the incremental revenues, if
any, from such opportunities, and financial condition, may differ, possibly materially, from the anticipated results, financial condition
and incremental revenues indicated in these forward-looking statements.
For a discussion of some of the risks and important factors that could affect the Firm’s future results and financial condition, see
“Risk Factors” in our Annual Report on Form 10-K for the year ended December 31, 2016. You should also read the forward-
looking disclaimers in our Form 10-Q for the period ended September 30, 2017, particularly as it relates to capital and leverage
ratios, and information on the calculation of non-GAAP financial measures that is posted on the Investor Relations portion of our
website: www.gs.com. Statements about our revenue and growth opportunities are subject to the risk that the Firm’s businesses
may be unable to generate additional incremental revenues or take advantage of growth opportunities. Statements about the
estimated effects of Tax Legislation are based on our current calculations, as well as our current interpretations, assumptions and
expectations relating to Tax Legislation, which are subject to further guidance and change.
The statements in the presentation are current only as of its date, February 13, 2018.
2
Cautionary Note on Forward-Looking Statements
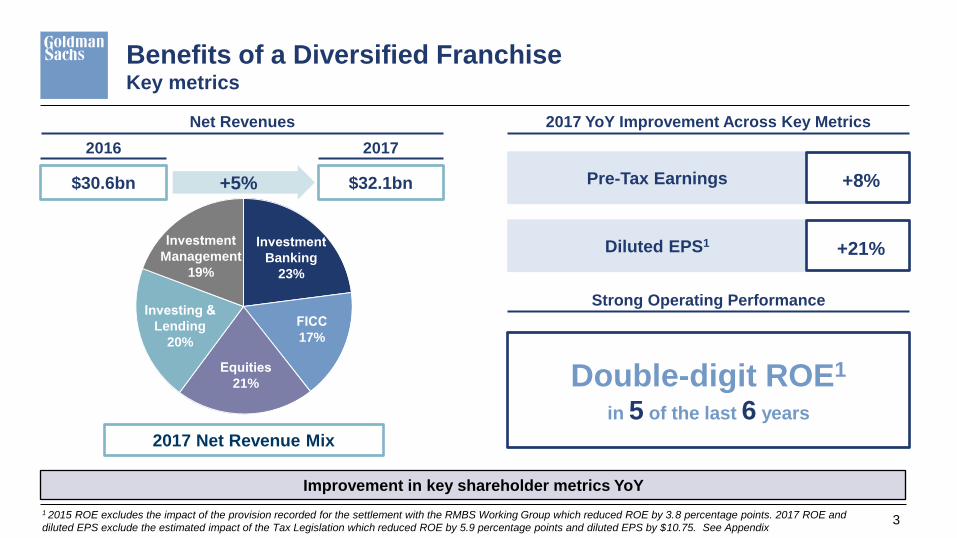
Benefits of a Diversified Franchise Key metrics
3
Improvement in key shareholder metrics YoY
2017 Net Revenue Mix
Net Revenues
$30.6bn $32.1bn +5%
2016 2017
Pre-Tax Earnings +8%
2017 YoY Improvement Across Key Metrics
Diluted EPS1 +21%
Strong Operating Performance
Investment
Banking
23%
Investment
Management
19%
FICC
17%
Equities
21%
Investing &
Lending
20%
Double-digit ROE1
in 5 of the last 6 years
1 2015 ROE excludes the impact of the provision recorded for the settlement with the RMBS Working Group which reduced ROE by 3.8 percentage points. 2017 ROE and
diluted EPS exclude the estimated impact of the Tax Legislation which reduced ROE by 5.9 percentage points and diluted EPS by $10.75. See Appendix
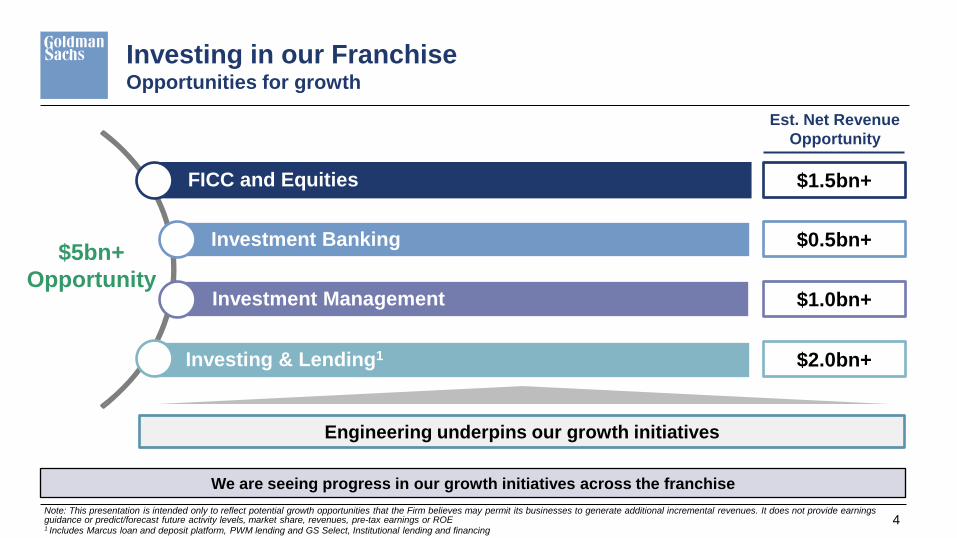
Investing in our Franchise Opportunities for growth
4
FICC and Equities
Investment Banking
Investment Management
Investing & Lending1
$5bn+
Opportunity
We are seeing progress in our growth initiatives across the franchise
$0.5bn+
$1.5bn+
$1.0bn+
$2.0bn+
Est. Net Revenue
Opportunity
Engineering underpins our growth initiatives
Note: This presentation is intended only to reflect potential growth opportunities that the Firm believes may permit its businesses to generate additional incremental revenues. It does not provide earnings guidance or predict/forecast future activity levels, market share, revenues, pre-tax earnings or ROE 1 Includes Marcus loan and deposit platform, PWM lending and GS Select, Institutional lending and financing
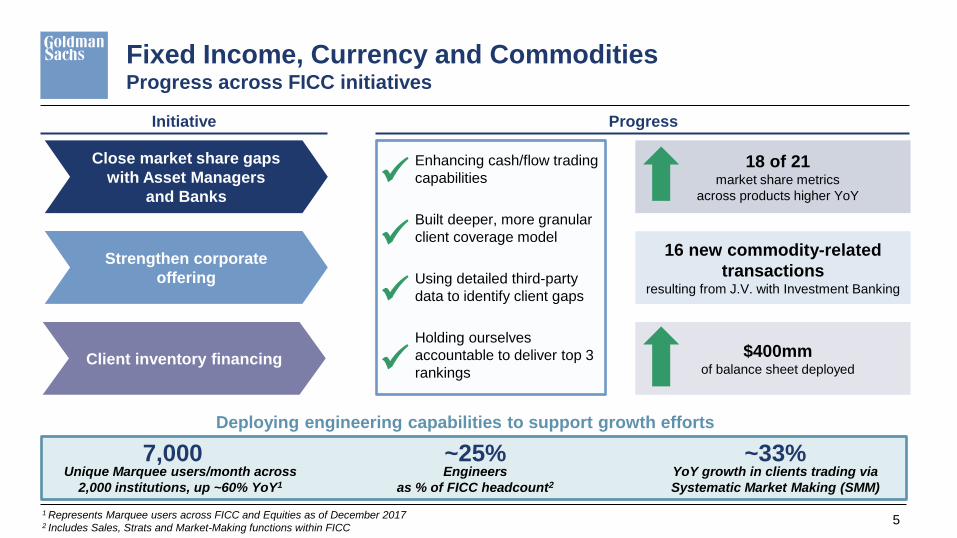
18 of 21 market share metrics
across products higher YoY
$400mm of balance sheet deployed
16 new commodity-related
transactions resulting from J.V. with Investment Banking
Fixed Income, Currency and Commodities Progress across FICC initiatives
Initiative Progress
Unique Marquee users/month across
2,000 institutions, up ~60% YoY1
Engineers
as % of FICC headcount2
YoY growth in clients trading via
Systematic Market Making (SMM)
5
7,000 ~25% ~33%
Deploying engineering capabilities to support growth efforts
Enhancing cash/flow trading
capabilities
Built deeper, more granular
client coverage model
Using detailed third-party
data to identify client gaps
Holding ourselves
accountable to deliver top 3
rankings
Client inventory financing
Close market share gaps
with Asset Managers
and Banks
Strengthen corporate
offering
1 Represents Marquee users across FICC and Equities as of December 2017 2 Includes Sales, Strats and Market-Making functions within FICC
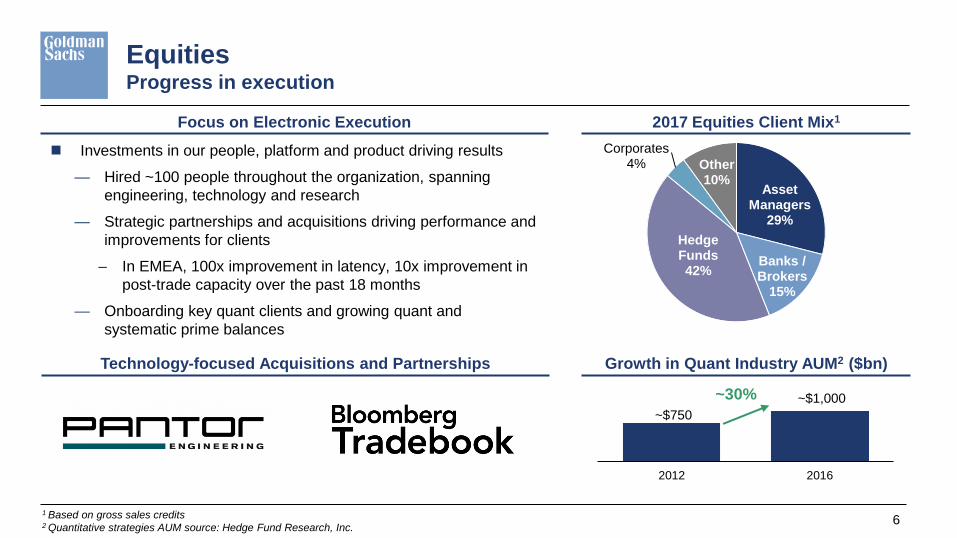
Asset Managers
29%
Banks / Brokers
15%
Hedge Funds 42%
Corporates 4% Other
10%
~$750
~$1,000
2012 2016
Equities Progress in execution
6
Investments in our people, platform and product driving results
— Hired ~100 people throughout the organization, spanning
engineering, technology and research
— Strategic partnerships and acquisitions driving performance and
improvements for clients
– In EMEA, 100x improvement in latency, 10x improvement in
post-trade capacity over the past 18 months
— Onboarding key quant clients and growing quant and
systematic prime balances
2017 Equities Client Mix1
Technology-focused Acquisitions and Partnerships Growth in Quant Industry AUM2 ($bn)
Focus on Electronic Execution
1 Based on gross sales credits
2 Quantitative strategies AUM source: Hedge Fund Research, Inc.
~30%

Investment Banking Progress in client coverage
7
>8,000 >9,000
2016 2020E
+10%
Regional strategy implemented (Seattle, Toronto,
Atlanta, Dallas)
New coverage assigned on >30% of targeted
clients
Awarded >75 new mandates to date from client
coverage expansion efforts
Expanding coverage model by optimizing existing
senior talent and making additional lateral hires
Debt Underwriting League Table Ranking1
Engineering enhances client engagement through apps, machine learning and big data analytics
Expected
increase in
client
coverage by
2020
Debt Underwriting Net Revenues ($bn)
#6 #2
League table rank
improvements
2012 2017
$2.0
$2.9
2012 2017
+50%
Investment
Grade
Leveraged
Loans #5 #3
High
Yield
#8 #5
1 High Yield and Investment Grade Underwriting sourced from Dealogic. Leveraged Loans sourced from Bloomberg
Investment Banking Client Coverage
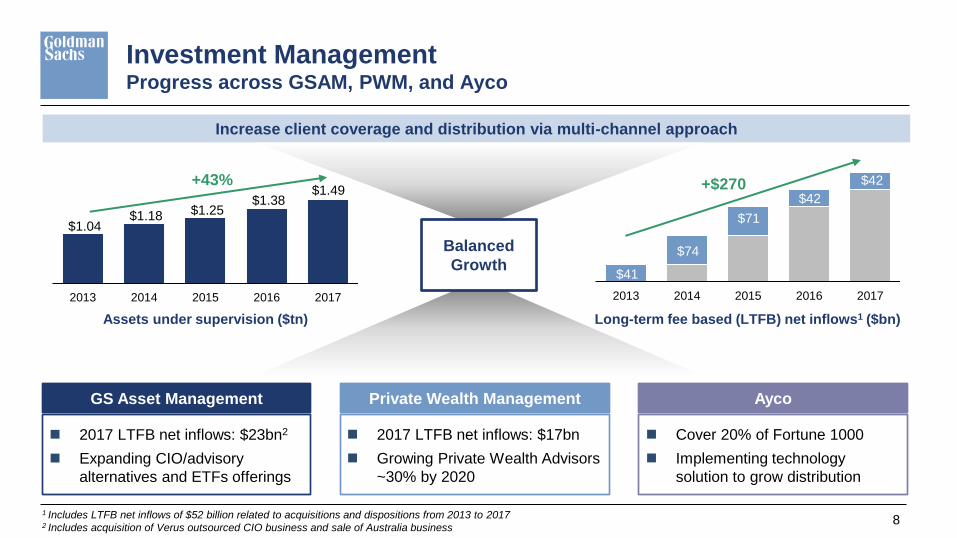
Investment Management Progress across GSAM, PWM, and Ayco
2017 LTFB net inflows: $17bn
Growing Private Wealth Advisors
~30% by 2020
Private Wealth Management
2017 LTFB net inflows: $23bn2
Expanding CIO/advisory
alternatives and ETFs offerings
GS Asset Management
Cover 20% of Fortune 1000
Implementing technology
solution to grow distribution
Ayco
Assets under supervision ($tn) Long-term fee based (LTFB) net inflows1 ($bn)
8 1 Includes LTFB net inflows of $52 billion related to acquisitions and dispositions from 2013 to 2017 2 Includes acquisition of Verus outsourced CIO business and sale of Australia business
Increase client coverage and distribution via multi-channel approach
Balanced
Growth
$1.04 $1.18 $1.25
$1.38 $1.49
2013 2014 2015 2016 2017
+43%
$41
$74
$71
$42
$42
2013 2014 2015 2016 2017
+$270
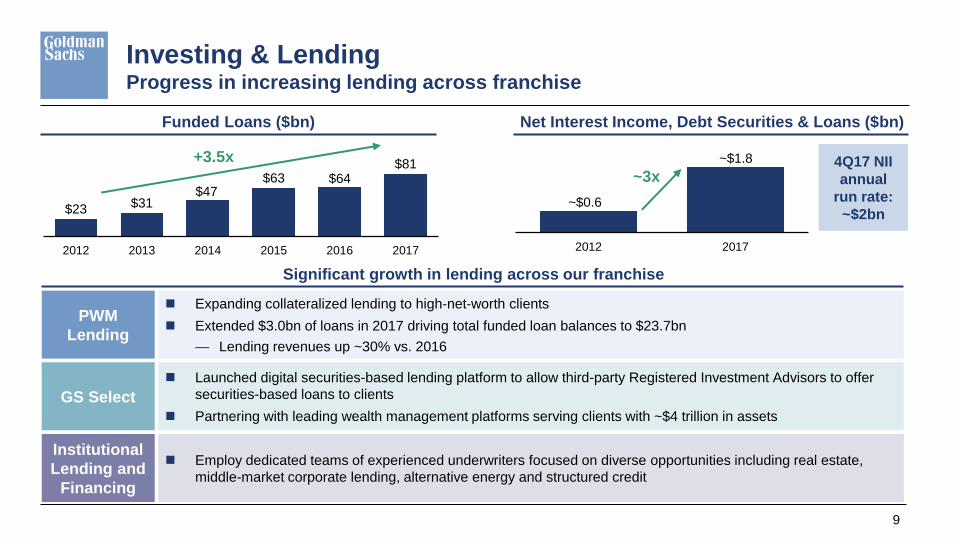
$23 $31 $47
$63 $64 $81
2012 2013 2014 2015 2016 2017
~$0.6
~$1.8
2012 2017
Investing & Lending Progress in increasing lending across franchise
9
Expanding collateralized lending to high-net-worth clients
Extended $3.0bn of loans in 2017 driving total funded loan balances to $23.7bn
— Lending revenues up ~30% vs. 2016
Institutional
Lending and
Financing
Funded Loans ($bn) Net Interest Income, Debt Securities & Loans ($bn)
+3.5x
PWM
Lending
Employ dedicated teams of experienced underwriters focused on diverse opportunities including real estate,
middle-market corporate lending, alternative energy and structured credit
Significant growth in lending across our franchise
4Q17 NII
annual
run rate:
~$2bn
~3x
Launched digital securities-based lending platform to allow third-party Registered Investment Advisors to offer
securities-based loans to clients
Partnering with leading wealth management platforms serving clients with ~$4 trillion in assets
GS Select
10
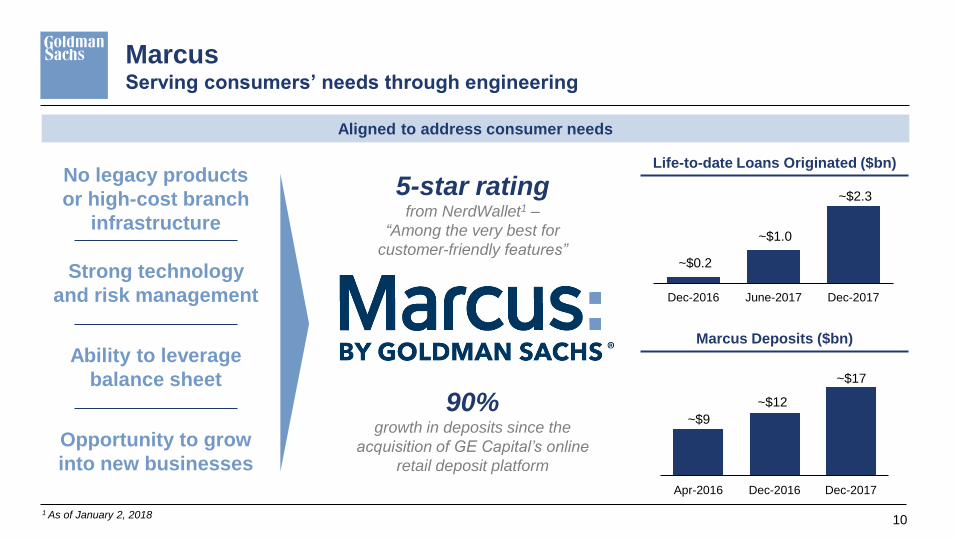
Aligned to address consumer needs
~$0.2
~$1.0
~$2.3
Dec-2016 June-2017 Dec-2017
No legacy products
or high-cost branch
infrastructure
Strong technology
and risk management
Ability to leverage
balance sheet
Life-to-date Loans Originated ($bn)
5-star rating
from NerdWallet1 –
“Among the very best for
customer-friendly features”
~$9
~$12
~$17
Apr-2016 Dec-2016 Dec-2017
Marcus Deposits ($bn)
Opportunity to grow
into new businesses
Marcus Serving consumers’ needs through engineering
90% growth in deposits since the
acquisition of GE Capital’s online
retail deposit platform
1 As of January 2, 2018

Goldman Sachs Presentation to
Credit Suisse Financial Services Conference
February 13, 2018
Lloyd C. Blankfein
Chairman and Chief Executive Officer

Net earnings applicable to common shareholders and common shareholders’ equity, excluding the impact of Tax Legislation
(Unaudited, in millions, except per share amounts)
The table below presents the calculation of net earnings applicable to common shareholders and diluted earnings per common share, excluding the impact of Tax Legislation:
Appendix Non-GAAP Measures
ROE is calculated by dividing net earnings applicable to common shareholders by average monthly common shareholders’ equity. The table below presents the firm’s
average common shareholders’ equity and return on average common shareholders’ equity, excluding the impact of Tax Legislation:
Year Ended December 2017
Net earnings/(loss) applicable to common shareholders, as reported $ 3,685
Impact of Tax Legislation 4,400
Net earnings applicable to common shareholders, excluding the impact of Tax Legislation 8,085
Divided by average diluted common shares used in the calculation of diluted earnings
(excluding the impact of Tax Legislation) per common share 409.1
Diluted earnings per common share, excluding the impact of Tax Legislation $ 19.76
Average for the
Year Ended December 2017
Common shareholders’ equity, as reported $ 74,721
Impact of Tax Legislation 338
Common shareholders’ equity, excluding the impact of Tax Legislation $ 75,059
Return on common shareholders’ equity, as reported 4.9%
Return on common shareholders’ equity, excluding the impact of Tax Legislation 10.8%
Management believes that presenting the firm’s results excluding Tax Legislation is meaningful as excluding this item increases the comparability of period-to-period results.
Diluted earnings per common share and return on common shareholders’ equity, excluding the impact of Tax Legislation, are non-GAAP measures and may not be comparable
to similar non-GAAP measures used by other companies.
12
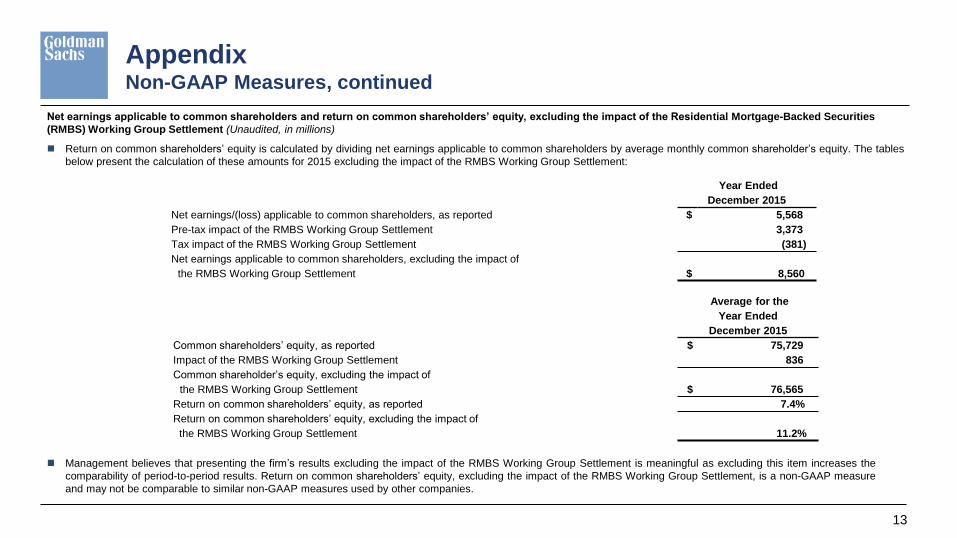
Net earnings applicable to common shareholders and return on common shareholders’ equity, excluding the impact of the Residential Mortgage-Backed Securities
(RMBS) Working Group Settlement (Unaudited, in millions)
Return on common shareholders’ equity is calculated by dividing net earnings applicable to common shareholders by average monthly common shareholder’s equity. The tables
below present the calculation of these amounts for 2015 excluding the impact of the RMBS Working Group Settlement:
Appendix Non-GAAP Measures, continued
Year Ended
December 2015
Net earnings/(loss) applicable to common shareholders, as reported $ 5,568
Pre-tax impact of the RMBS Working Group Settlement 3,373
Tax impact of the RMBS Working Group Settlement (381)
Net earnings applicable to common shareholders, excluding the impact of
the RMBS Working Group Settlement $ 8,560
Average for the
Year Ended
December 2015
Common shareholders’ equity, as reported $ 75,729
Impact of the RMBS Working Group Settlement 836
Common shareholder’s equity, excluding the impact of
the RMBS Working Group Settlement $ 76,565
Return on common shareholders’ equity, as reported 7.4%
Return on common shareholders’ equity, excluding the impact of
the RMBS Working Group Settlement 11.2%
Management believes that presenting the firm’s results excluding the impact of the RMBS Working Group Settlement is meaningful as excluding this item increases the
comparability of period-to-period results. Return on common shareholders’ equity, excluding the impact of the RMBS Working Group Settlement, is a non-GAAP measure
and may not be comparable to similar non-GAAP measures used by other companies.
13
Top Related