
![DENV DetectTM IgM CAPTURE ELISA - Diatekdiatek.in/inbios/FDA_DENV_Detect_IgM_Captue_ELISA_Insert[1].pdf · dengue virus IgM antibodies also peak at about 2 weeks post infection ...](https://static.fdocuments.in/doc/165x107/5ae6320c7f8b9ae1578d4f63/denv-detecttm-igm-capture-elisa-1pdfdengue-virus-igm-antibodies-also-peak-at.jpg)


Languages
Pages
Legal

Going where traditional markers have not gone before:utility of and promise for RAD sequencing in marineinvertebrate phylogeography and population genomics
A. M. REITZEL,*1 S . HERRERA,*† 1 M. J . LAYDEN,‡ M. Q. MARTINDALE‡ and T. M. SHANK*
*Biology Department, Woods Hole Oceanographic Institution, 266 Woods Hole Road, Woods Hole, MA 02543, USA,
†Massachusetts Institute of Technology-Woods Hole Oceanographic Institution Joint Program in Oceanography, 77
Massachusetts Avenue, Cambridge, MA 02139, USA, ‡Kewalo Marine Laboratory, Pacific Bioscience Research Center,
University of Hawaii, Honolulu, HI 96813, USA
Abstract
Characterization of large numbers of single-nucleotide polymorphisms (SNPs)
throughout a genome has the power to refine the understanding of population demo-
graphic history and to identify genomic regions under selection in natural popula-
tions. To this end, population genomic approaches that harness the power of
next-generation sequencing to understand the ecology and evolution of marine inver-
tebrates represent a boon to test long-standing questions in marine biology and
conservation. We employed restriction-site-associated DNA sequencing (RAD-seq) to
identify SNPs in natural populations of the sea anemone Nematostella vectensis, anemerging cnidarian model with a broad geographic range in estuarine habitats in
North and South America, and portions of England. We identified hundreds of SNP-
containing tags in thousands of RAD loci from 30 barcoded individuals inhabiting
four locations from Nova Scotia to South Carolina. Population genomic analyses
using high-confidence SNPs resulted in a highly-resolved phylogeography, a result
not achieved in previous studies using traditional markers. Plots of locus-specific FSTagainst heterozygosity suggest that a majority of polymorphic sites are neutral, with a
smaller proportion suggesting evidence for balancing selection. Loci inferred to be
under balancing selection were mapped to the genome, where 90% were located in
gene bodies, indicating potential targets of selection. The results from analyses with
and without a reference genome supported similar conclusions, further highlighting
RAD-seq as a method that can be efficiently applied to species lacking existing
genomic resources. We discuss the utility of RAD-seq approaches in burgeoning
Nematostella research as well as in other cnidarian species, particularly corals and jel-
lyfishes, to determine phylogeographic relationships of populations and identify
regions of the genome undergoing selection.
Keywords: balancing selection, estuarine, genome, Nematostella, next-generation sequencing,
phylogeography
Received 30 June 2012; accepted 11 December 2012
Introduction
Population genomic approaches offer revolutionary
opportunities over traditional population genetic mark-
ers to characterize species and population histories, and
the genetic mechanisms of adaptation by analysing
Correspondence and Present address: A.M. Reitzel, Department
of Biology, University of North Carolina at Charlotte,
9201 University City Blvd., Charlotte, NC 28223, USA.
Fax: 508 457 2134;
E-mail: [email protected] authors contributed equally.
© 2013 John Wiley & Sons Ltd
Molecular Ecology (2013) 22, 2953–2970 doi: 10.1111/mec.12228
polymorphic markers dispersed throughout the entire
genome (Luikart et al. 2003; Nadeau & Jiggins 2010).
Historically, methods to identify large numbers of
genetic markers and characterize their geographic dis-
tribution in natural populations were labour-intensive
and cost-prohibitive for almost any species, particularly
those lacking extensive sequence resources. However,
advances in sequencing technology in recent years have
opened new avenues for the generation of large num-
bers of molecular markers in a panel of individuals to
better characterize the ecology and evolution of tradi-
tionally nonmodel species (Rowe et al. 2011). One of
these methods is restriction-site-associated DNA
sequencing (RAD-seq), which combines enzymatic
fragmentation of the genome with high-throughput
sequencing for the generation of large numbers of SNP
markers (Baird et al. 2008).
Knowing the proportion of genetic exchange among
populations and the spatial distribution of genetic
diversity for particular species within aquatic ecosys-
tems is critical in order to understand biodiversity and
inform conservation and management decisions (Palum-
bi 2003, 2004; Botsford et al. 2009). Marine and estuarine
habitats are relatively poorly characterized ecosystems
for which we know little about the population genetics
of most resident species when compared to terrestrial
systems. Current data support a spectrum of expecta-
tions for species’ dispersal, and the resulting population
connectivity, from nearly open to a higher degree of
population genetic structure over unexpectedly small
geographic distances due to local recruitment (Hauser
& Carvalho 2008; Ciannelli et al. 2010). Previous expec-
tations for connectivity relied on the pelagic larval
duration (PLD) to hypothesize relative dispersal
distances and thus the probability of gene flow in natural
populations (Cowen et al. 2000; Bay et al. 2006; Cowen
& Sponaugle 2009). However, recent studies have
convincingly shown that PLD is at best weakly correlated
with population genetic structure (Bradbury et al. 2008;
Weersing & Toonen 2009), which may be driven by
errors and uncertainties when calculating FST (Faurby
& Barber 2012), making confident, accurate predictions
about population connectivity in the marine environ-
ment difficult.
The attributes of genetic markers for making popula-
tion genetic inferences can have substantial impacts on
which hypotheses can be adequately tested. Previous
reviews have discussed the relative merits and limita-
tions of the diverse set of molecular markers available
for studying population processes (Parker et al. 1998;
Sunnucks 2000; Mariette et al. 2002; Brumfield 2003;
Brito & Edwards 2008; Diniz-Filho et al. 2008). To date,
a large majority of studies that characterize the popula-
tion genetics of marine or estuarine species have
utilized allozymes, anonymous markers (e.g. AFLPs,
RFLPs), a small number of microsatellites or a handful
of sequence-based markers (e.g. mitochondrial DNA
and nuclear ribosomal DNA). These markers have
trade-offs that frequently balance diversity (e.g. micro-
satellites, AFLPs) with the ease of interpretation and
ability to compare among species (e.g. sequence mark-
ers). More recent surveys discussing the utility of genetic
markers have emphasized the significant advantages of sin-
gle-nucleotide polymorphisms (SNPs) for population
genetic studies (Brumfield 2003; Morin et al. 2004; Brito
& Edwards 2008). Although SNPs have the limitation of
lower diversity due to only four possible allelic states
and a low mutation rate, they have clear advantages for
accommodating diverse assumptions of linkage or
independence of markers depending on the discovery
strategy, explicit models of evolutionary change and
potential for roles in functional evolution (e.g. polymor-
phisms in coding or promoter regions). In addition,
SNPs can be readily compared among genomes
(nuclear, mitochondrial, chloroplast) to utilize the
underlying mutational scales to characterize evolution-
ary processes (Morin et al. 2004; Petit et al. 2004).
Nematostella vectensis is an anthozoan cnidarian
(Cnidaria, Anthozoa, Hexacorallia, Actiniaria) common
to tidally restricted pools in high marsh environments
(Hand & Uhlinger 1994). In recent years, N. vectensis
has emerged as a model cnidarian in molecular biology
and comparative genomics due to ease of laboratory
culture and the publication of its genome (Putnam et al.
2007), the first for a cnidarian. Sexual reproduction and
developmental stages have been well characterized in a
laboratory cultures (Reitzel et al. 2007). Eggs of N. vect-
ensis are released in a gelatinous mass by female
anemones and then externally fertilized by males.
Development progresses from a fertilized egg to an
early embryo within the egg mass. Subsequently, early
larvae swim from the degraded egg jelly, develop into
an elongated late larval stage and then settle as a four-
tentacle juvenile stage within 7 days. This species holds
great promise as a useful model for understanding the
ecological genomics of coastal species (Darling et al.
2005) given that it is found in high marsh estuaries that
are impacted by human encroachment, has been repeat-
edly introduced to non-native locations and has a broad
geographic range likely resulting in local adaptation.
N. vectensis has been collected in salt marshes along the
Pacific and Atlantic coast of North America, a portion
of England (Hand & Uhlinger 1994; Reitzel et al. 2008)
and Brazil (Silva et al. 2010). Previous research on the
population genetic structure of N. vectensis, using
RAPDs, AFLPs and microsatellites, has identified signif-
icant genetic differences among major coastline regions,
estuaries within each region and even among subpopu-
© 2013 John Wiley & Sons Ltd
2954 A. M. REITZEL ET AL.
lations within a single estuary (Pearson et al. 2002;
Darling et al. 2004; Reitzel et al. 2008; Darling et al.
2009). These studies have also shown high variation in
the relative contribution of clonal reproduction to resi-
dent populations throughout its range (Darling et al.
2009). In addition, available data suggest that N. vecten-
sis has been introduced from the west Atlantic to the
west coast of North America and England, where it
receives protective status under the Wildlife and Coun-
tryside Act. Despite these insights, we lack an under-
standing of the phylogeography of populations in the
native range due to the low resolution provided by
these traditional markers. High-resolution data are
critical for testing hypotheses about the historical
distribution of this species, the connectivity of current
populations and the source locations for introduced
populations in non-native habitats. Moreover, there are
currently few data to test for potential genetic adaptation
in natural populations that span its large geographic
range. Two previous studies (Sullivan et al. 2009; Reitzel
et al. 2010) utilized expressed sequence tags generated
during the sequencing of the N. vectensis genome to
document polymorphisms in coding regions, particu-
larly nonsynonymous substitutions in conserved protein
domains. Their findings suggest that SNPs are present
in genes that could exert a large influence on protein
function. More recent work has identified substantial
phenotypic variation in natural populations (Reitzel
et al. in revision) highlighting the need for high-density
genomic markers to provide the tools for linking genetic
and phenotypic diversity in populations occupying envi-
ronmental gradients that may result in phenotypic clines.
Our understanding of the genetic diversity and coarse
population-level relationships for N. vectensis is repre-
sentative of the general population genetic data for
other cnidarians. Within the marine environment,
cnidarians represent a critical taxonomic group of
benthic and pelagic species for both ecological function
and conservation management. The phylum Cnidaria
contains corals that are ecosystem engineers and support
a rich biodiversity in shallow and deep marine habitats
(Jones et al. 1994; Roberts et al. 2006), but are frequently
threatened by anthropogenic activities. Moreover, jelly-
fish have emerged as common nuisance species where
population blooms dramatically impact fisheries and
pelagic biodiversity (Purchell et al. 2007). For species of
conservation concern, resolving genetic diversity and its
structure is critical to understand the impact of human
activities as well as the opportunity for recovery after
disturbances (Palumbi 2003; Baums 2008). In addition,
understanding genetic diversity will assist in assessing
the opportunity for adaptation of populations to chang-
ing environments (Hughes et al. 2003) and, with
the availability of a genome, identification of genomic
regions under selection. For groups, that are exerting
negative impacts on marine communities and human
economies, such as jellyfishes, high-resolution character-
ization of genetic diversity would markedly improve
our understanding of the impacts derived from the
introduction of these species to non-native areas and
the composition of blooms that develop in particular
locations. Despite the clear need for data to understand
phylogeography and the particular regions of the
genome undergoing selection, population genetic studies
of cnidarians often are unable to resolve many of these
questions due to the availability of only few allele-based
markers (e.g. microsatellites), with the exception of a
small number of species, as well as the near absence of
variable sequence-based markers (Shearer et al. 2002;
Bilewitch & Degnan 2011). Thus, the development and
application of next-generation sequencing to the popu-
lation genetics of cnidarians will bridge these critical
gaps. In this respect, N. vectensis is an ideal cnidarian
model in which to assess how RAD-seq, or similar
genomic methods, can be utilized to characterize phy-
logeographic relationships among populations as well
as regions of the genome under selection.
In this study, we utilized RAD-seq to characterize the
genetic diversity and population genetic structure of
N. vectensis individuals collected along the Atlantic
coast of North America. We compared our results with
and without the use of the available reference genome
to assess the potential impacts of utilizing RAD-seq in
nonmodel species with limited genomic data. Finally,
we mapped the SNPs inferred to be under selection to
the reference genome in order to identify genes or
genomic regions that are likely under selection, and
then, we grouped them based on potential biological
function. Together, our study provides one of the first
applications of RAD-seq to a marine invertebrate (see
De Wit & Palumbi 2012) and highlights the utility of a
reference genome in generating hypotheses for linking
population and functional genomics.
Methods
Collection
Adults of N. vectensis were collected from three estuar-
ies along the Atlantic coast of North America (Peggy’s
Cove, Nova Scotia; Sippewissett, Massachusetts; and
Baruch, South Carolina; see Reitzel et al. (2008) for
details). Briefly, individuals were sieved from loose
sediments, transferred to 13& (parts per thousand)
artificial seawater and transported to the laboratory.
Individuals were maintained under a standard cultur-
ing protocol for N. vectensis (13& artificial seawater,
fed 2–3 times per week with freshly hatched Artemia
© 2013 John Wiley & Sons Ltd
CNIDARIAN POPULATION GENOMICS 2955
sp.). Individuals from a common laboratory stock
maintained in the Martindale laboratory (Kewalo
Marine Laboratory, University of Hawaii) were origi-
nally collected from Rhode River, Maryland. In addi-
tion, this laboratory culture served as the source
population from which the N. vectensis genome was
sequenced. When necessary, individual clonal lines
were generated by transverse bisection to yield ade-
quate amounts of genomic DNA.
Molecular laboratory methods
Individual anemones or pooled individuals developed
through bisected clonal lines were starved for at least
3 days prior to genomic DNA extraction to minimize
potential contamination from food sources. Genomic
DNA for nine individuals from each of the Nova
Scotia and Massachusetts populations, and six from the
Maryland and South Carolina populations, was
extracted with the Qiagen DNAeasy kit (Qiagen).
Genomic DNA quality was checked by visual inspec-
tion on an agarose gel and with a ND-1000 Nanodrop
spectrophotometer (Nanodrop Technologies). DNA
concentration was also determined with a Nanodrop
spectrophotometer. Ten micrograms of high-quality
(260/280 > 1.8) genomic DNA per individual was sub-
mitted to Floragenex Inc. for library preparation and
sequencing. Individual libraries were produced from
DNA digested with a high-fidelity SbfI restriction
enzyme and barcoded with 5-base pair sequence tags.
Libraries were sequenced on a single lane of an
Illumina GAIIX sequencer.
Data QC & QA and SNP calling
Sequencing data were filtered using the program
PRINSEQ v0.18 (Schmieder & Edwards 2011). All
sequence reads (i.e. individual fragments of contiguous
nucleotide bases) were trimmed to a length of 31 bp;
shorter reads were discarded. Reads with ambiguous
characters or with mean Phred quality score (Ewing
& Green 1998; Ewing et al. 1998) lower than 20 (base
call accuracy lower than 99%) were also discarded
(Huse et al. 2007).
Reads were aligned to the reference genome of
N. vectensis (v1.0, http://genome.jgi-psf.org/Nemve1/
Nemve1.home.html) using BOWTIE v0.12.7 (Langmead
et al. 2009). Only reads that produced a unique best
alignment to the genome (in terms of the smallest
number of mismatches and the highest Phred score of
the mismatch positions), with at most 3 mismatches,
were retained. Aligned reads were processed in the
program STACKS v0.998 (Catchen et al. 2011)–a tool used
to form stacks of identical unique sequences from each
individual, identify loci by aligning homologous
stacks, generate genotypes and match loci among
individuals. High-confidence SNP calls in STACKS are
performed using a maximum-likelihood framework that
accounts for sources of error inherent to RAD markers
(i.e. sequencing error, variable depth of coverage)
(Hohenlohe et al. 2010; Catchen et al. 2011). A mini-
mum depth of four reads per stack (i.e. eight per
locus) was enforced. Significantly high-repetitive stacks
were discarded by implementing the deleveraging
algorithm, as these likely represent sequencing errors,
duplications or repetitive regions. The deleveraging
algorithm assumes similar depths for stacks originat-
ing from a common locus (Catchen et al. 2011). No
mismatches among loci were allowed when creating
the catalog of all the loci identified among the
sampled individuals. In a similar manner, reads were
processed without the use of a reference genome in
order to evaluate the effects of the lack of this resource
in downstream analysis. A maximum number of two
mismatches was allowed among loci within each indi-
vidual. Loci with more than two alleles per SNP per
individual were discarded as these are considered
methodological artefacts in diploid organisms or prod-
ucts from multiple-copy elements in the genome. Here-
after, we refer to the loci identified in this analysis as
RAD markers.
The reference genome of N. vectensis (Putnam et al.
2007) was sequenced from the offspring of two parent
strains originally collected from Rhode River, Maryland,
USA, which is one of the populations sampled for this
study. The use of this reference genome to process
sequence reads by retaining only those that produce
unique alignments to it could introduce a form of ascer-
tainment bias (i.e. markers present in individuals from
the Maryland population being more likely to be
included in the analyses than others). To assess the
effect of this potential source of bias, we tested for
significant differences in the average number of reads
with one reported alignment to the genome and the
number of RAD markers, per individual, among popu-
lations. To account for the variability in number of
reads among individuals, we randomly resampled the
sets of reads in each individual in order to normalize
them to the set with the smallest number of reads
(56 851), using the PERL-script DAISYCHOPPER v0.6 (avail-
able from www.genomics.ceh.ac.uk/GeneSwytch).
Clone detection
Due to the capability of N. vectensis to reproduce asexu-
ally, we tested for the presence of clones in our data set
by comparing the percentage of genotypic distances
among individuals within each population. To account
© 2013 John Wiley & Sons Ltd
2956 A. M. REITZEL ET AL.

for the possibility that the observed differences were
caused by variability in sequencing coverage of particu-
lar markers among individuals and/or SNP calling
errors, we established an arbitrary cut-off value of 95%
for the percentage of genotypic pairwise distances (i.e.
individuals with genotypic distances smaller than 5%
are considered potential clones). This is a conservative
threshold considering that the probability of a given
genotype for any individual in our study was calculated
to be less than 1 9 10�9 (Arnaud-Haond & Belkhir
2007; Arnaud-Haond et al. 2007). To evaluate the effect
of the presence of potential clones in the data set, all
subsequent analyses were performed comparatively
using genome-aligned or unaligned reads and with or
without potential clone individuals.
Detection of markers under selection
To identify potential markers in genomic regions subject
to selection, we used the FST outlier method (Beaumont
& Nichols 1996) implemented in the program LOSITAN
(Antao et al. 2008). This method utilizes the observed
allele frequencies of SNPs to estimate expected hetero-
zygosities and global unbiased FST values (Weir
& Cockerham 1984; Cockerham & Weir 1993) to simulate
an expected neutral distribution for FST, assuming an
island model of migration (Wright 1931). One million
simulations were performed assuming an infinite alleles
mutation model. 95% confidence intervals were built
around the simulated mean neutral FST. SNPs with FSTvalues significantly greater than expected under neutral-
ity were considered candidates for positive selection.
Conversely, SNPs with FST values significantly smaller
than expected under neutrality were considered candi-
dates for balancing selection (Beaumont & Nichols 1996).
RAD markers containing SNPs with conflicting selection
classifications (e.g. one SNP candidate neutral and
another candidate balancing, in the same marker) were
excluded from the analyses to avoid ambiguities.
Candidate markers under selection
Candidate markers under balancing selection that were
common among all four analyses (genome-aligned or
unaligned reads, with or without potential clones) were
mapped to the reference genome of N. vectensis
(Putnam et al. 2007). Position of each marker was anno-
tated whether it was located in an annotated gene body
(intron or exon) or close to the nearest annotated gene
in the current version of the genome. When the marker
was located in an intergenic region, we identified the
closest gene and quantified the distance to this gene.
Selected genes were then tentatively assigned a name
based on U.S. Department of Energy Joint Genome
Institute (JGI) annotations or on sequence similarity to
available protein sequences assessed through BLASTp
searches at the U.S. National Center for Biotechnology
Information (NCBI) REFSEQ. Gene Ontology (GO) and
Kyoto Encyclopedia of Genes and Genomes (KEGG)
pathway assignments for each selected protein were
identified using the program Blast2GO v2.5.1 (Conesa
et al. 2005). The results from GO analysis were grouped
based on ‘biological process’ to cluster potential shared
functions for these proteins.
Demographic inferences
Inferences of demographic statistics were carried out
using candidate neutral markers only. Only one SNP
per RAD marker was taken into account to avoid violat-
ing the assumption of independence among markers.
Only biallelic SNPs were included in order to simplify
the calculations and fit the assumptions of the soft-
ware utilized for the analyses. As indicated above, all
inferences were performed comparatively using gen-
ome-aligned or unaligned reads and with or without
potential clone individuals.
To evaluate the validity of putative populations
defined by their sampling location, we inferred popula-
tion structuring through a principal component analysis
(PCA) using the software EIGENSOFT v4.2 (Patterson et al.
2006; Price et al. 2006). We evaluated the significance of
the identified principal components through Tracy–
Widom statistics (Tracy & Widom 1994; Johnstone
2001). The statistical significance of the differences
between identified populations was evaluated via a
chi-square test. The summing of ANOVA statistics of
genetic differentiation between pairs of populations
along each eigenvector approximates a chi-square distri-
bution with degrees of freedom equal to the number of
eigenvectors (Patterson et al. 2006; see EIGENSOFT docu-
mentation). We also inferred population structuring
(historical lineages) by maximizing the posterior proba-
bility of the genotypic data, given a set number of clus-
ters (K). This method is known as Bayesian population
clustering and is implemented in the program STRUCTURE
v2.3.2 (Pritchard et al. 2000; Falush et al. 2003) available
in the Bioportal (Kumar et al. 2009). The admixture
model was used with uncorrelated allele frequencies.
The MCMC was run for 1 100 000 repetitions (burnin
period 1 000 000). Values for K were evaluated from
1 to 5 (10 replicates each). The optimal value of K was
selected using the program STRUCTURE HARVESTER v0.6.92
(Earl & Vonholdt 2012) according to the ad hoc DKstatistic (Evanno et al. 2005), which is the second-order
rate of change of the likelihood function. STRUCTURE
results were visualized using the program DISTRUCT v1.1
(Rosenberg 2004).
© 2013 John Wiley & Sons Ltd
CNIDARIAN POPULATION GENOMICS 2957
The overall RAD marker variability was compared
among individuals within each population. A quantitative
measure of this variation was obtained by estimating
four commonly used genetic diversity indexes: the pro-
portion of polymorphic SNPs, the mean observed hetero-
zygosity, the mean expected heterozygosity and the
mean number of alleles. These indexes were calculated
with the R-package POPGENKIT v1.0 (Rioux Paquette 2011).
Genetic differentiation among populations was
measured using the unbiased FST estimator h (Weir
& Cockerham 1984) (here referred to as F W CST ) and the
asymptotically consistent estimator F (Reich et al. 2009)
(here referred to as F RST) using custom scripts in R. F
has been shown to consistently yield accurate estimates
of population differentiation at small sample sizes
(n < 6) when large numbers of loci (>100) are available
(Willing et al. 2012). A correction that accounts for
potential inbreeding effects on F (Reich et al. 2009) (here
referred to as F RcorST ), which could be prevalent in N. vect-
ensis due to possible small effective population sizes, was
also applied. Confidence intervals were calculated for
each estimator based on 1000 bootstrap replicates.
In order to generate useful sequence matrices for
phylogeographic analyses, the nucleotide identity data
from individual homozygous SNP loci (variable among
individuals) were sorted and concatenated following
the procedures suggested by Emerson et al. (2010).
Phylogenetic inferences of evolutionary relationships
were performed through the implementation of statisti-
cal methods following the maximum-likelihood criterion
as implemented in PHYML v3.0 (Guindon et al. 2010). The
general time-reversible model (GTR) of nucleotide
substitution (Tavare 1986) was assumed. Topological
robustness was assessed through 1000 nonparametric
bootstrap replicates. Trees were visualized and edited
in the program FIGTREE v1.3.1 (Rambaut 2009).
Results
SNP discovery and clone detection
The mean number of sequence reads obtained per indi-
vidual was 160 409 (95% CI � 31 084; SD = 85 127;
n = 30), and individual values ranged between 56 851
and 353 084 reads. On average, 1721 reads (1%; 95%
CI � 31 084; SD = 85 127; n = 30) were discarded as low
quality (Fig. S1, Supporting information). An average of
114 071 reads (95% CI � 22 240; SD = 60 907; n = 30)
had a unique alignment to the reference genome, repre-
senting ~71% of all reads (Fig. S1, Supporting informa-
tion). Approximately 4% of the reads failed to produce
an alignment, and 24% were discarded due to having
more than one reportable alignment. To avoid any possi-
ble downstream analytical biases on the accuracy of
population statistics estimates and their uncertainty, for
example Hinrichs & Suarez (2005), only markers present
in all individuals were retained. Reads processed with-
out alignment to the reference genome yielded 20% more
RAD markers than the genome-aligned reads (see
Table 1 and Fig. S2, Supporting information for addi-
tional details). The percentage increase in the number of
polymorphic RAD markers and the number of SNPs per
individual was 88% and 107%, respectively. However,
there was an overall slight reduction in the number of
polymorphic RAD markers (14% less) and the number of
SNPs (18% less) that were shared among all individuals
in this unaligned analysis.
The ascertainment bias analysis performed to address
the possible effect of using the reference genome to
process the sequence reads showed that, when comparing
among populations, individuals from Maryland (same
population as the source of the reference genome) had
the largest number of retained reads. However, there
were no significant differences in the average number
of identified RAD markers between the Maryland and
Massachusetts populations, and only marginal differ-
ences between these and the populations from Nova
Scotia or South Carolina (a = 0.05, see 95% confidence
intervals in Fig. S3, Supporting information).
There were eight individuals identified as potential
clones in three populations: two in Massachusetts, five in
Nova Scotia and one in Maryland. Not a single potential
clone pair shared identical genotypes. The percentage of
pairwise genotypic similarities among potential clones
ranged between 99.0% and 99.9% (mean = 99.5%, 95%
CI � 0.1; SD = 0.3; n = 13). In contrast, the genotypic dis-
tances among nonpotential clones ranged between 61.2%
and 86.5% (mean = 73.3%, 95% CI � 1.5; SD = 7.3;
n = 89). As mentioned in the Methods section, all analy-
ses were also performed after excluding these potential
clone individuals from the data set. The results of these
analyses were almost identical to the ones obtained when
all sampled individuals were included (including poten-
tial clones). When the potential clones were excluded, the
sequence reads processed without alignment to the refer-
ence genome yielded 17% more RAD markers than the
genome-aligned reads (see Table 1). This produced a per-
centage increase in the number of polymorphic RAD
markers and the number of SNPs, per individual, of 77%
and 99%, respectively. However, the number of polymor-
phic RAD markers and the number of SNPs shared
among all individuals remained virtually unaltered
(changes were less than 4%).
Detection of markers under selection
Overall, there were approximately 200 candidate neu-
tral markers and approximately 70 candidate balancing
© 2013 John Wiley & Sons Ltd
2958 A. M. REITZEL ET AL.

Table
1RAD
marker
statistics
per
analyseswithorwithoutclones,an
dusinggen
ome-aligned
orunaligned
read
s
Potential
clones
included
(n=30)
Potential
clones
removed
(n=22)
Gen
omeAligned
NoGen
omeAligned
Gen
omeAligned
NoGen
omeAligned
Meannumber
ofRAD
markersper
individual
2305
(95%
CI�
71;SD
=193)
2759
(95%
CI�
89;SD
=243)
2330
(95%
CI�
75;SD
=206)
2737
(95%
CI�
90;SD
=246)
Meandep
thofcoverag
eper
RAD
marker
per
individual
489
(95%
CI�
8;SD
=22)
499
(95%
CI�
9;SD
=23)
519
(95%
CI�
8;SD
=23)
549
(95%
CI�
9;SD
=24)
Meannumber
ofpolymorphic
RAD
markersper
individual
139(95%
CI�
18;SD
=50)
261(95%
CI�
24;SD
=65)
142(95%
CI�
21;SD
=57)
252(95%
CI�
26;SD
=72)
Meannumber
ofSNPsper
individual
174(95%
CI�
24;SD
=66)
360(95%
CI�
24;SD
=66)
179(95%
CI�
27;SD
=75)
356(95%
CI�
33;SD
=90)
TotalNumber
ofRAD
markersin
thecatalog
2987
4065
2978
3925
Totalnumber
ofRAD
markerspresentin
allindividuals
1297
1251
1351
1426
Totalnumber
ofpolymorphic
RAD
markerspresent
inallindividuals
287
248
304
310
Number
ofpolymorphic
RAD
markers
with1SNP
220
204
232
250
RAD
markerscandidateneu
tral
164
145
167
169
RAD
markerscandidatebalan
cingselection
5659
6579
RAD
markerscandidatepositiveselection
00
02
Number
ofpolymorphic
RAD
markers
with>1SNP
6744
7260
RAD
markerscandidateneu
tral*
4727
4631
RAD
markerscandidatebalan
cingselection*
67
813
RAD
markerscandidatepositiveselection*
00
01
Number
ofmarkerscandidateneu
tral
211
172
213
200
Number
ofmarkerscandidate
balan
cingselection
6266
7392
Number
ofmarkerscandidate
positiveselection
00
03
Totalnumber
ofSNPspresentin
allindividuals
365
298
388
374
SNPscandidateneu
tral
266
199
269
231
SNPscandidatebalan
cingselection*
6874
81107
SNPscandidatepositiveselection*
00
04
Biallelic
SNPscandidateneu
tral
†209
172
212
200
*MarkerscontainingSNPswithconflictingclassifications(e.g.oneSNPcandidateneu
tral
andan
other
candidatebalan
cing,in
thesamelocu
s)wereexcluded
from
thean
alyses.
†Toav
oid
violationsoftheassu
mptionofindep
enden
ce,only
oneSNPper
RAD
marker
was
usedforthedem
ographic
analyses.
© 2013 John Wiley & Sons Ltd
CNIDARIAN POPULATION GENOMICS 2959
selection markers identified in each analysis using gen-
ome-aligned or unaligned reads, with or without poten-
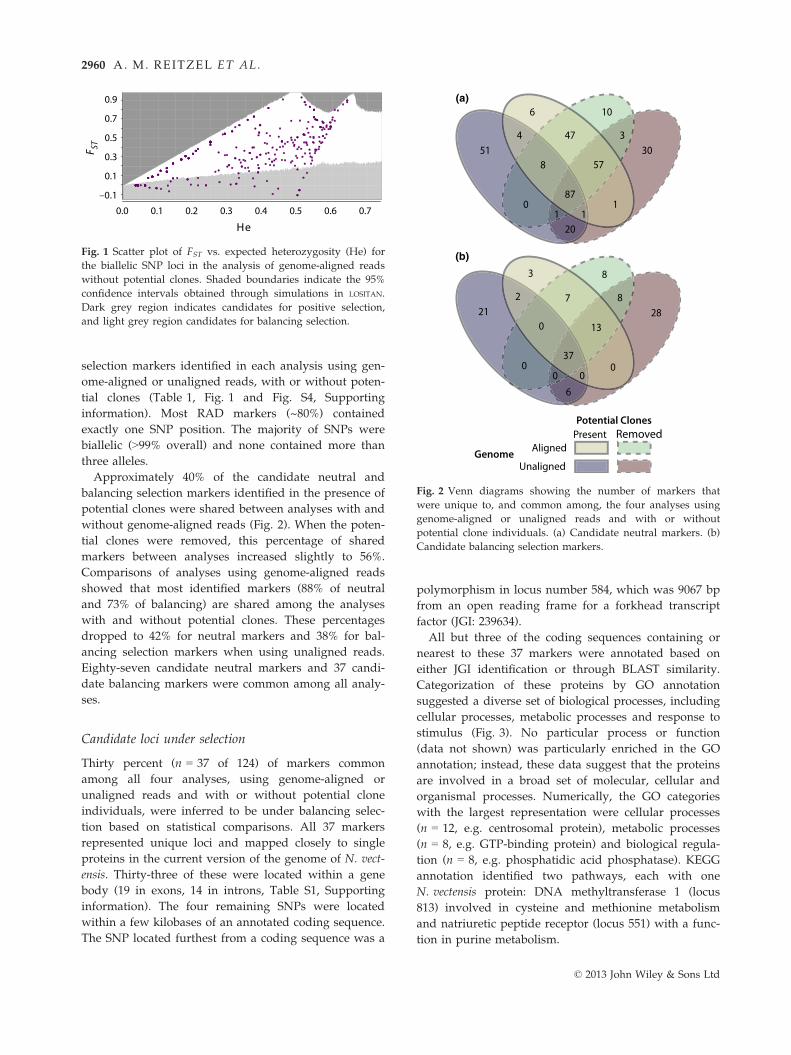
tial clones (Table 1, Fig. 1 and Fig. S4, Supporting
information). Most RAD markers (~80%) contained
exactly one SNP position. The majority of SNPs were
biallelic (>99% overall) and none contained more than
three alleles.
Approximately 40% of the candidate neutral and
balancing selection markers identified in the presence of
potential clones were shared between analyses with and
without genome-aligned reads (Fig. 2). When the poten-
tial clones were removed, this percentage of shared
markers between analyses increased slightly to 56%.
Comparisons of analyses using genome-aligned reads
showed that most identified markers (88% of neutral
and 73% of balancing) are shared among the analyses
with and without potential clones. These percentages
dropped to 42% for neutral markers and 38% for bal-
ancing selection markers when using unaligned reads.
Eighty-seven candidate neutral markers and 37 candi-
date balancing markers were common among all analy-
ses.
Candidate loci under selection
Thirty percent (n = 37 of 124) of markers common
among all four analyses, using genome-aligned or
unaligned reads and with or without potential clone
individuals, were inferred to be under balancing selec-
tion based on statistical comparisons. All 37 markers
represented unique loci and mapped closely to single
proteins in the current version of the genome of N. vect-
ensis. Thirty-three of these were located within a gene
body (19 in exons, 14 in introns, Table S1, Supporting
information). The four remaining SNPs were located
within a few kilobases of an annotated coding sequence.
The SNP located furthest from a coding sequence was a
polymorphism in locus number 584, which was 9067 bp
from an open reading frame for a forkhead transcript
factor (JGI: 239634).
All but three of the coding sequences containing or
nearest to these 37 markers were annotated based on
either JGI identification or through BLAST similarity.
Categorization of these proteins by GO annotation
suggested a diverse set of biological processes, including
cellular processes, metabolic processes and response to
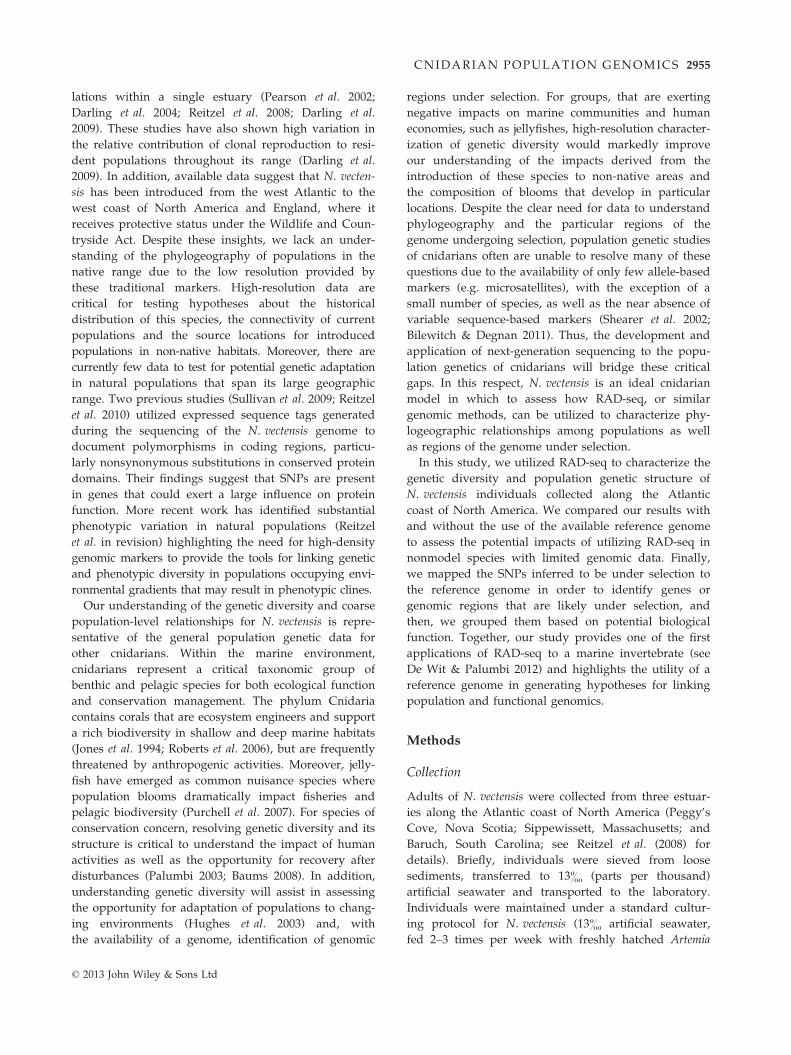
stimulus (Fig. 3). No particular process or function
(data not shown) was particularly enriched in the GO
annotation; instead, these data suggest that the proteins
are involved in a broad set of molecular, cellular and
organismal processes. Numerically, the GO categories
with the largest representation were cellular processes
(n = 12, e.g. centrosomal protein), metabolic processes
(n = 8, e.g. GTP-binding protein) and biological regula-
tion (n = 8, e.g. phosphatidic acid phosphatase). KEGG
annotation identified two pathways, each with one
N. vectensis protein: DNA methyltransferase 1 (locus
813) involved in cysteine and methionine metabolism
and natriuretic peptide receptor (locus 551) with a func-
tion in purine metabolism.
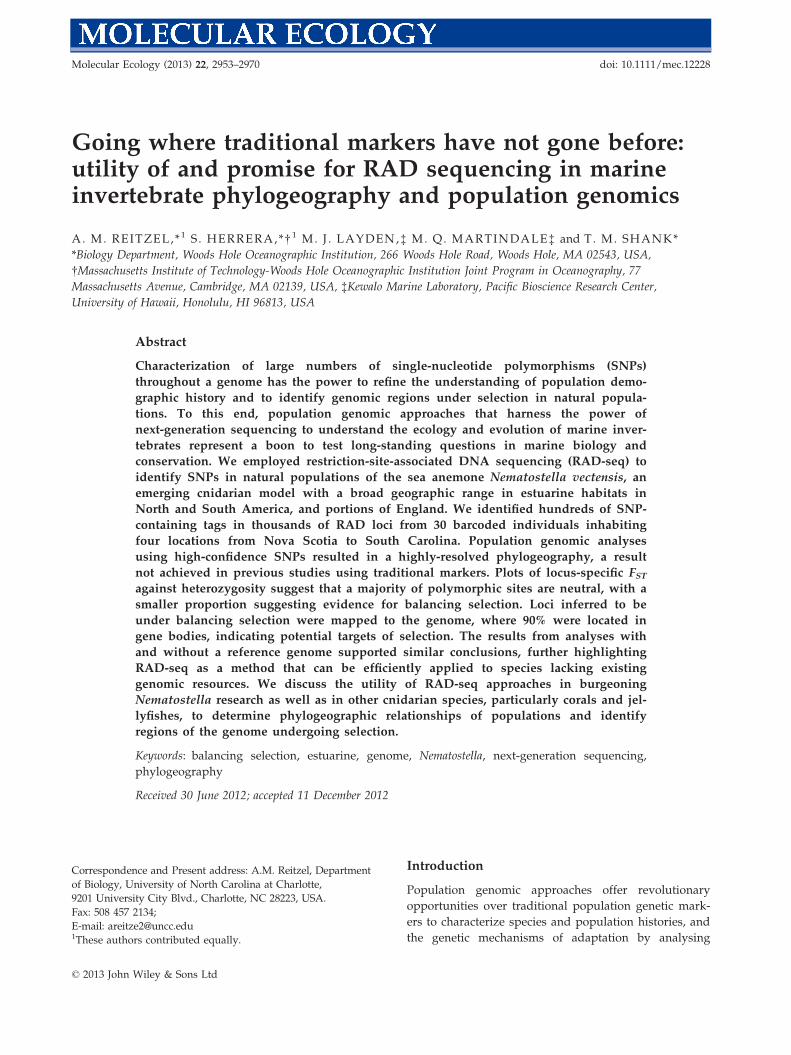
F ST
–0.1
0.1
0.3
0.5
0.7
0.9
0.0 0.1 0.2 0.3 0.4 0.5 0.6 0.7
He
Fig. 1 Scatter plot of FST vs. expected heterozygosity (He) for
the biallelic SNP loci in the analysis of genome-aligned reads
without potential clones. Shaded boundaries indicate the 95%
confidence intervals obtained through simulations in LOSITAN.
Dark grey region indicates candidates for positive selection,
and light grey region candidates for balancing selection.
Unaligned
Present RemovedPotential Clones
GenomeAligned
(a)
(b)
2
3
217
8
8
130
37
0 0
6
0 0
28
4
6
5147
10
3
578
87
1 120
0 1
30
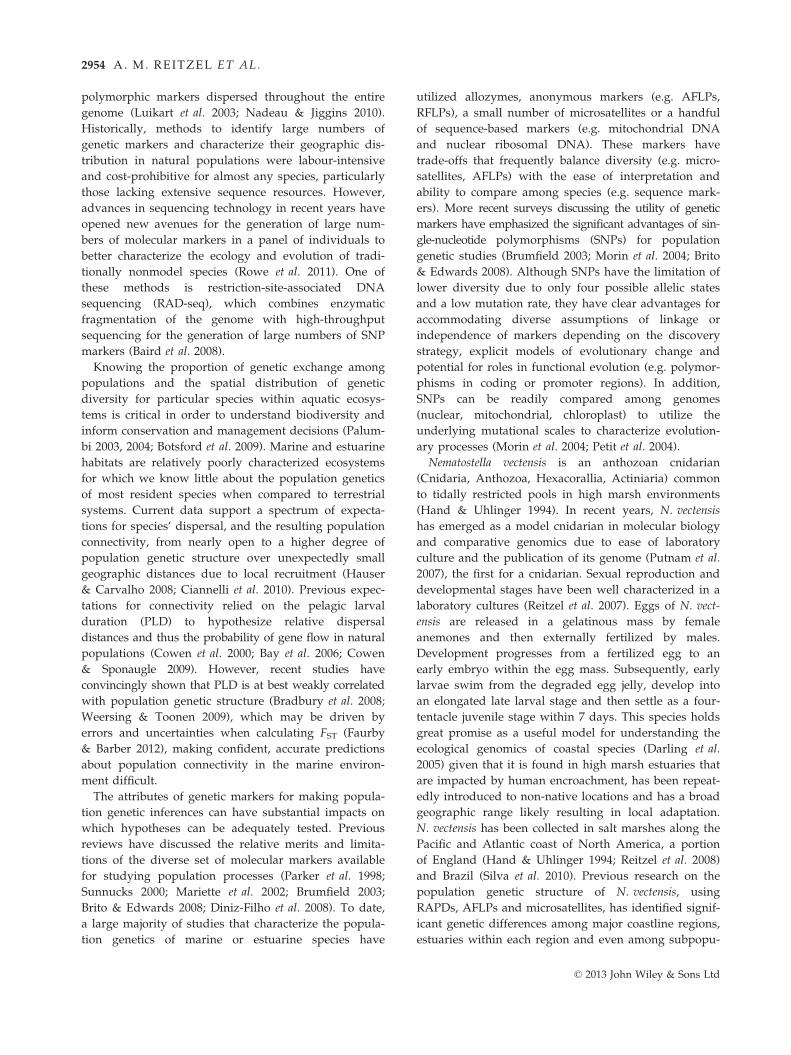
Fig. 2 Venn diagrams showing the number of markers that
were unique to, and common among, the four analyses using
genome-aligned or unaligned reads and with or without
potential clone individuals. (a) Candidate neutral markers. (b)
Candidate balancing selection markers.
© 2013 John Wiley & Sons Ltd
2960 A. M. REITZEL ET AL.

For proteins near to or containing these markers
under balancing selection, we identified a few proteins
of particular interest due to their role in gene regulation.
Two markers were located near or in a gene body for
two transcription factors: locus 301 was located in an
exon of the nuclear receptor co-repressor (N-CoR1) and
locus 383 was 2 kb from heat shock factor 1 (HSF1).
One other notable protein, a TGFb receptor (locus 729),
contained one SNP located in an exon.
Demographic inferences
Principal component analyses identified three large
eigenvectors (axes of variation) revealing the presence
of four distinct clusters (Fig. 4, Figs S5–S7). This same
result was found in all analyses using genome-aligned
or unaligned reads and with or without potential
clones. The eigenvector 1, with the largest eigenvalue,
was not significant (P = 0.097, a = 0.05), and the eigen-
vector 2, with the second largest eigenvalue, was mar-
ginally significant (P = 0.045, a = 0.05, Table S2,
Supporting information). The eigenvector 3, with the
third largest eigenvalue, was highly significant
(P < 0.001, a = 0.05). All differences among identified
clusters were also highly significant (Table S3, Support-
ing information). The results from the STRUCTURE analy-
ses are congruent with the inferences made from the
PCA (data not shown). The four identified clusters
unambiguously matched the a priori population assign-
ments based on the geographic origin of the samples
(Fig. 4, Figs S5–S7).
Genetic diversity in all four analyses was highest in
the Massachusetts population and lowest in the Mary-
land population, as measured by the proportion of
polymorphic markers, the expected and observed
heterozygosities and the average number of alleles
(Table 2). Genetic diversities for the Nova Scotia and
South Carolina populations were similar, although
higher in Nova Scotia. The genetic diversity estimates
between analyses with or without potential clones were
highly similar, but slightly higher overall when poten-
tial clones were removed.
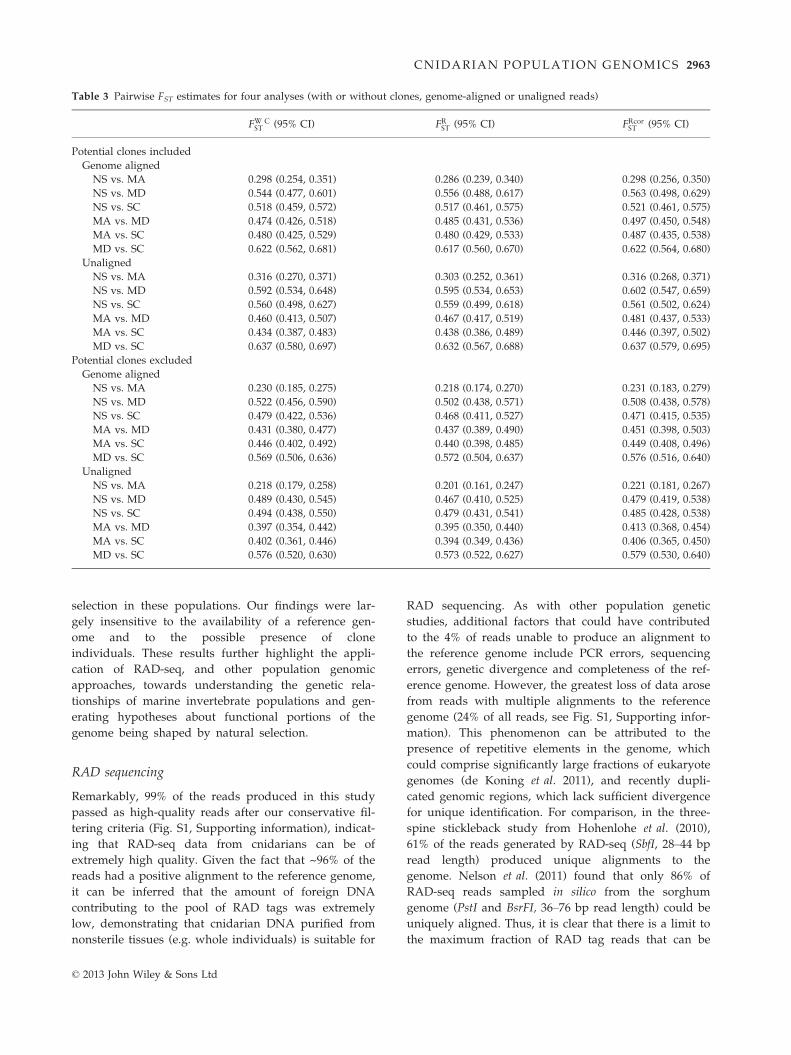
Overall, the pairwise FST values suggest that differen-
tiation was significant (i.e. 95% confidence intervals did
not contain the value of the null hypothesis Fst = 0)
among all populations (Table 3). Genetic differentiation
was greatest between the Maryland and South Carolina
populations. Large genetic differentiation was also found
between the Nova Scotia population and the southern
populations (Maryland and South Carolina). The most
similar populations were Massachusetts and Nova
Scotia. None of the FST estimators yielded significantly
different values between the analyses using genome-
aligned or unaligned reads. When using genome-
unaligned reads, we observed significantly greater FSTvalues when potential clones were included in the anal-
signaling (5)
response to stimulus (6)
reproduction (1)pigmentation (1)
multicellular organismal process (5)
multi-organism process (1)
metabolic process (8)locomotion (1)localization (3)
biological adhesion (2)biological regulation (8)
cell killing (1)cell proliferation (1)
celular component organizationor biogenesis (2)
cellular process (12)death (1)developmental process (2)immune system process (1)
Fig. 3 Distribution of Gene Ontology (GO) categories (‘biological process’, level 2) for proteins coded by genes containing or most
closely positioned in the genome to SNPs inferred to be under balancing selection. Analysis utilized only the 37 markers that were
common among all the four analyses using genome-aligned or unaligned reads and with or without potential clone individuals.
The numbers in parentheses after the GO category refer to the number of proteins annotated for each category.
Eigenvector 1 Eigenvector 2
Eige
nvec
tor 2
Eigenvector 1
Eige
nvec
tor 3
Eige
nvec
tor 3
–0.2
0
0.2
0.4
–0.2 0 0.2 0.4
–0.4
–0.2
0
0.2
0.4
0.6
–0.2 0 0.2 0.4
–0.4
–0.2
0
0.2
0.4
0.6
–0.2 0 0.2 0.4
NSMAMDSC
Fig. 4 Estimated population structure of
Nematostella vectensis according to the prin-
cipal component analysis (PCA) of gen-
ome-aligned reads without potential
clones. Each dot represents an individual.
Colours indicate the geographic site loca-
tions: Nova Scotia (NS), Massachusetts
(MA), Maryland (MD) and South Carolina
(SC). The three principal axes of variation
are shown.
© 2013 John Wiley & Sons Ltd
CNIDARIAN POPULATION GENOMICS 2961

yses than when they were not. Similarly, when using
genome-aligned reads, we also observed greater FST val-
ues when potential clones were included in the analyses
than when they were not; however, these differences
were not statistically significant. No significant differ-
ences were found among different FST estimators.
The inferred phylogeographic hypotheses clustered
individuals according to their sampling location, indi-
cating that individuals in each population share a most
recent common ancestor not shared with individuals
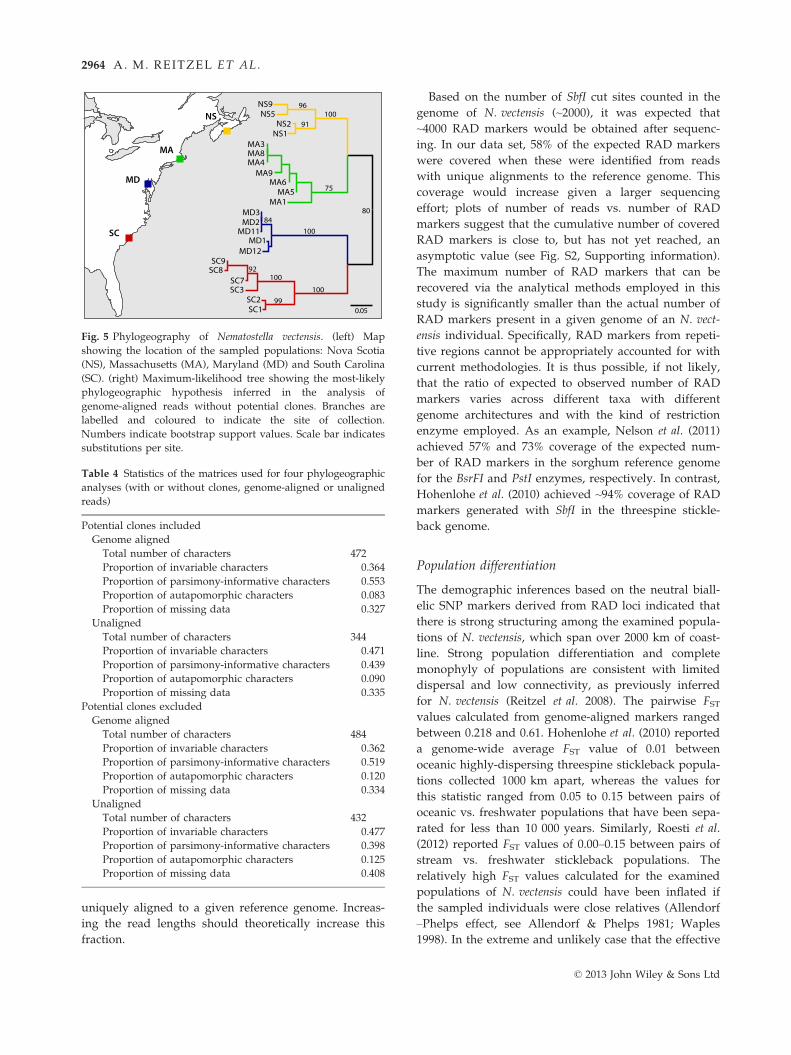
from other populations (Fig. 5). The Nova Scotia and
Massachusetts populations form a monophyletic group
with respect to the other two southern populations,
which is consistent with the sorting of historical
lineages inferred by the PCA and STRUCTURE clustering.
Tree topologies of the phylogenies inferred in all analy-
ses using genome-aligned or unaligned reads and with
or without potential clones are virtually identical (Fig. 5
and Fig. S8, Supporting information), with minor differ-
ences in the bootstrap support values of the most
poorly supported branches. The number of characters
used to perform the phylogenetic analyses was ~430(Table 4). Approximately 36% of the characters were
invariable in the analyses of genome-aligned reads and
47% in the analyses without genome alignment. As
expected, the proportion of autapomorphic characters
was greater in the analyses where potential clones were
excluded.
Discussion
In this study, we have performed one of the first
applications of RAD-seq to a marine invertebrate and
examined genome-wide distribution of polymorphisms
in natural populations of a coastal cnidarian.
Together, our data reveal strong population genetic
structure and clear phylogeographic relationships.
Additionally, through statistical analyses of FST out-
liers, we have identified candidate regions of the gen-
ome of N. vectensis likely undergoing balancing
Table 2 Estimates of genetic diversity per population for four analyses (with or without clones, genome-aligned or unaligned reads)
Nova Scotia (NS) Massachusetts (MA) Maryland (MD) South Carolina (SC)
Potential clones included
Number of samples 9 9 6 6
Genome aligned
RAD markers with biallelic SNPs (neutral) 209
Proportion of polymorphic SNP 0.517 0.612 0.239 0.445
Mean observed heterozygosity 0.213 0.290 0.112 0.161
Mean expected heterozygosity 0.169 0.205 0.082 0.143
Mean number of alleles per SNP 1.517 1.612 1.239 1.445
Number of private alleles 23 22 4 53
Unaligned
RAD markers with biallelic SNPs (neutral) 172
Proportion of polymorphic SNP 0.500 0.703 0.320 0.407
Mean observed heterozygosity 0.201 0.378 0.153 0.162
Mean expected heterozygosity 0.163 0.258 0.110 0.148
Mean number of alleles per SNP 1.500 1.703 1.320 1.407
Number of private alleles 14 12 8 25
Potential clones excluded
Number of samples 4 7 5 6
Genome aligned
RAD markers with biallelic SNPs (neutral) 212
Proportion of polymorphic SNP 0.505 0.632 0.250 0.434
Mean observed heterozygosity 0.217 0.321 0.121 0.176
Mean expected heterozygosity 0.183 0.230 0.092 0.154
Mean number of alleles per SNP 1.505 1.632 1.250 1.434
Number of private alleles 22 28 4 40
Unaligned
RAD markers with biallelic SNPs (neutral) 200
Proportion of polymorphic SNP 0.535 0.705 0.345 0.420
Mean observed heterozygosity 0.261 0.402 0.176 0.178
Mean expected heterozygosity 0.206 0.276 0.128 0.158
Mean number of alleles per SNP 1.535 1.705 1.345 1.420
Number of private alleles 11 16 8 29
© 2013 John Wiley & Sons Ltd
2962 A. M. REITZEL ET AL.
selection in these populations. Our findings were lar-
gely insensitive to the availability of a reference gen-
ome and to the possible presence of clone
individuals. These results further highlight the appli-
cation of RAD-seq, and other population genomic
approaches, towards understanding the genetic rela-
tionships of marine invertebrate populations and gen-
erating hypotheses about functional portions of the
genome being shaped by natural selection.
RAD sequencing
Remarkably, 99% of the reads produced in this study
passed as high-quality reads after our conservative fil-
tering criteria (Fig. S1, Supporting information), indicat-
ing that RAD-seq data from cnidarians can be of
extremely high quality. Given the fact that ~96% of the
reads had a positive alignment to the reference genome,
it can be inferred that the amount of foreign DNA
contributing to the pool of RAD tags was extremely
low, demonstrating that cnidarian DNA purified from
nonsterile tissues (e.g. whole individuals) is suitable for
RAD sequencing. As with other population genetic
studies, additional factors that could have contributed
to the 4% of reads unable to produce an alignment to
the reference genome include PCR errors, sequencing
errors, genetic divergence and completeness of the ref-
erence genome. However, the greatest loss of data arose
from reads with multiple alignments to the reference
genome (24% of all reads, see Fig. S1, Supporting infor-
mation). This phenomenon can be attributed to the
presence of repetitive elements in the genome, which
could comprise significantly large fractions of eukaryote
genomes (de Koning et al. 2011), and recently dupli-
cated genomic regions, which lack sufficient divergence
for unique identification. For comparison, in the three-
spine stickleback study from Hohenlohe et al. (2010),
61% of the reads generated by RAD-seq (SbfI, 28–44 bp
read length) produced unique alignments to the
genome. Nelson et al. (2011) found that only 86% of
RAD-seq reads sampled in silico from the sorghum
genome (PstI and BsrFI, 36–76 bp read length) could be
uniquely aligned. Thus, it is clear that there is a limit to
the maximum fraction of RAD tag reads that can be
Table 3 Pairwise FST estimates for four analyses (with or without clones, genome-aligned or unaligned reads)
FW CST (95% CI) FR
ST (95% CI) FRcorST (95% CI)
Potential clones included
Genome aligned
NS vs. MA 0.298 (0.254, 0.351) 0.286 (0.239, 0.340) 0.298 (0.256, 0.350)
NS vs. MD 0.544 (0.477, 0.601) 0.556 (0.488, 0.617) 0.563 (0.498, 0.629)
NS vs. SC 0.518 (0.459, 0.572) 0.517 (0.461, 0.575) 0.521 (0.461, 0.575)
MA vs. MD 0.474 (0.426, 0.518) 0.485 (0.431, 0.536) 0.497 (0.450, 0.548)
MA vs. SC 0.480 (0.425, 0.529) 0.480 (0.429, 0.533) 0.487 (0.435, 0.538)
MD vs. SC 0.622 (0.562, 0.681) 0.617 (0.560, 0.670) 0.622 (0.564, 0.680)
Unaligned
NS vs. MA 0.316 (0.270, 0.371) 0.303 (0.252, 0.361) 0.316 (0.268, 0.371)
NS vs. MD 0.592 (0.534, 0.648) 0.595 (0.534, 0.653) 0.602 (0.547, 0.659)
NS vs. SC 0.560 (0.498, 0.627) 0.559 (0.499, 0.618) 0.561 (0.502, 0.624)
MA vs. MD 0.460 (0.413, 0.507) 0.467 (0.417, 0.519) 0.481 (0.437, 0.533)
MA vs. SC 0.434 (0.387, 0.483) 0.438 (0.386, 0.489) 0.446 (0.397, 0.502)
MD vs. SC 0.637 (0.580, 0.697) 0.632 (0.567, 0.688) 0.637 (0.579, 0.695)
Potential clones excluded
Genome aligned
NS vs. MA 0.230 (0.185, 0.275) 0.218 (0.174, 0.270) 0.231 (0.183, 0.279)
NS vs. MD 0.522 (0.456, 0.590) 0.502 (0.438, 0.571) 0.508 (0.438, 0.578)
NS vs. SC 0.479 (0.422, 0.536) 0.468 (0.411, 0.527) 0.471 (0.415, 0.535)
MA vs. MD 0.431 (0.380, 0.477) 0.437 (0.389, 0.490) 0.451 (0.398, 0.503)
MA vs. SC 0.446 (0.402, 0.492) 0.440 (0.398, 0.485) 0.449 (0.408, 0.496)
MD vs. SC 0.569 (0.506, 0.636) 0.572 (0.504, 0.637) 0.576 (0.516, 0.640)
Unaligned
NS vs. MA 0.218 (0.179, 0.258) 0.201 (0.161, 0.247) 0.221 (0.181, 0.267)
NS vs. MD 0.489 (0.430, 0.545) 0.467 (0.410, 0.525) 0.479 (0.419, 0.538)
NS vs. SC 0.494 (0.438, 0.550) 0.479 (0.431, 0.541) 0.485 (0.428, 0.538)
MA vs. MD 0.397 (0.354, 0.442) 0.395 (0.350, 0.440) 0.413 (0.368, 0.454)
MA vs. SC 0.402 (0.361, 0.446) 0.394 (0.349, 0.436) 0.406 (0.365, 0.450)
MD vs. SC 0.576 (0.520, 0.630) 0.573 (0.522, 0.627) 0.579 (0.530, 0.640)
© 2013 John Wiley & Sons Ltd
CNIDARIAN POPULATION GENOMICS 2963
uniquely aligned to a given reference genome. Increas-
ing the read lengths should theoretically increase this
fraction.
Based on the number of SbfI cut sites counted in the
genome of N. vectensis (~2000), it was expected that
~4000 RAD markers would be obtained after sequenc-
ing. In our data set, 58% of the expected RAD markers
were covered when these were identified from reads
with unique alignments to the reference genome. This
coverage would increase given a larger sequencing
effort; plots of number of reads vs. number of RAD
markers suggest that the cumulative number of covered
RAD markers is close to, but has not yet reached, an
asymptotic value (see Fig. S2, Supporting information).
The maximum number of RAD markers that can be
recovered via the analytical methods employed in this
study is significantly smaller than the actual number of
RAD markers present in a given genome of an N. vect-
ensis individual. Specifically, RAD markers from repeti-
tive regions cannot be appropriately accounted for with
current methodologies. It is thus possible, if not likely,
that the ratio of expected to observed number of RAD
markers varies across different taxa with different
genome architectures and with the kind of restriction
enzyme employed. As an example, Nelson et al. (2011)
achieved 57% and 73% coverage of the expected num-
ber of RAD markers in the sorghum reference genome
for the BsrFI and PstI enzymes, respectively. In contrast,
Hohenlohe et al. (2010) achieved ~94% coverage of RAD
markers generated with SbfI in the threespine stickle-
back genome.
Population differentiation
The demographic inferences based on the neutral biall-
elic SNP markers derived from RAD loci indicated that
there is strong structuring among the examined popula-
tions of N. vectensis, which span over 2000 km of coast-
line. Strong population differentiation and complete
monophyly of populations are consistent with limited
dispersal and low connectivity, as previously inferred
for N. vectensis (Reitzel et al. 2008). The pairwise FSTvalues calculated from genome-aligned markers ranged
between 0.218 and 0.61. Hohenlohe et al. (2010) reported
a genome-wide average FST value of 0.01 between
oceanic highly-dispersing threespine stickleback popula-
tions collected 1000 km apart, whereas the values for
this statistic ranged from 0.05 to 0.15 between pairs of
oceanic vs. freshwater populations that have been sepa-
rated for less than 10 000 years. Similarly, Roesti et al.
(2012) reported FST values of 0.00–0.15 between pairs of
stream vs. freshwater stickleback populations. The
relatively high FST values calculated for the examined
populations of N. vectensis could have been inflated if
the sampled individuals were close relatives (Allendorf
–Phelps effect, see Allendorf & Phelps 1981; Waples
1998). In the extreme and unlikely case that the effective
NS
MA
MD
SC
MA1
MA9
0.05
MD2
NS9
MA4
SC1
SC9
SC3
MD1
NS1
NS5
MD3
SC2
MD11
NS2
MA3
MA6
MD12
MA5
SC8
MA8
SC7
96
91100
75
80
100
84
100
99
92100
Fig. 5 Phylogeography of Nematostella vectensis. (left) Map
showing the location of the sampled populations: Nova Scotia
(NS), Massachusetts (MA), Maryland (MD) and South Carolina
(SC). (right) Maximum-likelihood tree showing the most-likely
phylogeographic hypothesis inferred in the analysis of
genome-aligned reads without potential clones. Branches are
labelled and coloured to indicate the site of collection.
Numbers indicate bootstrap support values. Scale bar indicates
substitutions per site.
Table 4 Statistics of the matrices used for four phylogeographic
analyses (with or without clones, genome-aligned or unaligned
reads)
Potential clones included
Genome aligned
Total number of characters 472
Proportion of invariable characters 0.364
Proportion of parsimony-informative characters 0.553
Proportion of autapomorphic characters 0.083
Proportion of missing data 0.327
Unaligned
Total number of characters 344
Proportion of invariable characters 0.471
Proportion of parsimony-informative characters 0.439
Proportion of autapomorphic characters 0.090
Proportion of missing data 0.335
Potential clones excluded
Genome aligned
Total number of characters 484
Proportion of invariable characters 0.362
Proportion of parsimony-informative characters 0.519
Proportion of autapomorphic characters 0.120
Proportion of missing data 0.334
Unaligned
Total number of characters 432
Proportion of invariable characters 0.477
Proportion of parsimony-informative characters 0.398
Proportion of autapomorphic characters 0.125
Proportion of missing data 0.408
© 2013 John Wiley & Sons Ltd
2964 A. M. REITZEL ET AL.

number of breeders responsible for the sampled indi-
viduals in a given population (Nb) was only 2, then the
maximum magnitude of the contribution of this Allen-
dorf–Phelps effect to the observed FST values would be
0.25, calculated as 1/2(Nb) (Waples 1998 and citations
therein). This value is smaller than most of the esti-
mated pairwise FST values among populations of
N. vectensis in this study. Another potentially important
source of bias on the estimation of FST values can arise
from the variable and relatively small sample sizes. The
contribution of this sampling error to raw FST estimates
has been shown to be ~1/(2S) (Waples 1998 and cita-
tions therein), where S is the number of individuals
sampled from a population. However, the FST estima-
tors used in this study (Weir & Cockerham 1984; Reich
et al. 2009) explicitly account for this source of bias.
Furthermore, a recent simulation study showed that the
FRST estimator is extremely accurate even when sample
sizes are very small (n < 6), and that its precision is
great, provided that a large number of independent
markers are employed (>100) (Willing et al. 2012).
Therefore, the significant, strong differentiation among
populations of N. vectensis found in this study does not
seem to be a methodological or analytical artefact, but
is in fact a real pattern.
Possible clone individuals
The potential presence of clones among the sampled
individuals had no dramatic effects on the overall
population demographic inferences in this study. The
main statistics that showed consistent, yet small,
changes in the analyses excluding potential clones vs.
analyses including potential clones were genetic diver-
sity (Table 2) and genetic differentiation (FST values, see
Table 3). Overall, the smaller genetic diversity and lar-
ger genetic differentiation observed when potential
clones were included could be caused by the overrepre-
sentation of particular genotypes and biases in the alle-
lic differences among populations. The decrease in
population sample sizes after the exclusion of potential
clones could have also magnified the effect of sampling
error and thus contributed to the observed small
changes in the values of these statistics.
Phylogeography
We found a clear genetic break between northern (NS,
MA) and southern (MD, SC) populations, but a coloni-
zation scenario that could explain this pattern is
unclear. Principally, we were unable to root the tree
due to the uncertainty in the history of these popula-
tions and the lack of a clear outgroup species. Because
the northern portion of the range of N. vectensis was
covered during the last glacial maximum, a reasonable
hypothesis would be that populations recolonized
estuaries north of Cape Cod after the glaciers receded,
similar to other coastal invertebrates (Jennings et al.
2009). Thus, we would expect reduced genetic diversity
in these higher-latitude populations. However, genetic
diversity was overall higher in these more northern
populations. Similarly, genetic diversity assayed with
AFLPs (Reitzel et al. 2008) and by sequence-based mark-
ers (Reitzel et al. 2008; Sullivan et al. 2009; Reitzel et al.
2010) also suggested that genetic diversity is similar or
even higher in populations north of Cape Cod. Previous
research with the estuarine fishes Fundulus heteroclitus
(Adams et al. 2006; Williams & Oleksiak 2008) and
Menidia menidia (Mach et al. 2011), both of which have
overlapping ranges with N. vectensis, has also observed
similar genetic diversity among populations along the
Atlantic coast of North America. In these fish species,
the absence of reduced diversity in higher-latitude
populations is in part a result of local adaptation along
environmental clines and in response to anthropogenic
stressors. These environmental variables have shaped
the regional genetic diversity despite the movement of
populations during glacial periods. Future research
with N. vectensis incorporating additional locations
along the Atlantic coast of North America may help
resolve the directionality of population colonization
and the importance of genetic adaptation to regional
environmental conditions.
Utility and promise for nonmodel organisms
Local physical oceanographic processes and human-
mediated introductions can greatly influence the
population connectivity dynamics among estuarine
communities. The life history of N. vectensis, containing
an egg mass that retains embryos, a demersal larva
with a short swimming period (<7 days) and an infau-
nal adult, would likely promote limited dispersal of
adults and developmental stages. Consistent with this
expectation, surveys of genetic structure within estuar-
ies and between adjacent locations have identified
significant structure (Reitzel et al. 2008). Previous genetic
research has indicated that anthropogenic dispersal has
played an important role in shaping the broad
geographic scale distribution and resulting population
genetic relationships in N. vectensis (Darling et al. 2004;
Reitzel et al. 2008; Darling et al. 2009). Similar to a num-
ber of other coastal invertebrates in North America,
N. vectensis appears to have been introduced from the
Atlantic coast to the Pacific coast, potentially through
the transport of commercial shellfish. The addition of
the high-density SNP data generated in this study to
previous data will provide a high degree of analytical
© 2013 John Wiley & Sons Ltd
CNIDARIAN POPULATION GENOMICS 2965

power to understand both genetic partitioning in the
small spatial scales of natural dispersal and large scales
of long-distance anthropogenic dispersal. Even more so,
these methods hold great opportunity for understand-
ing similar processes in other coastal species. Despite
the differences in the number of loci and SNP recov-
ered when reads were filtered with the genome and
when they were not, the results from the demographic
inferences were overall identical. Furthermore, the use
of the reference genome did not substantially affect the
number of retrieved RAD loci across populations, thus
avoiding the introduction of an ascertainment bias. Our
results highlight the usefulness of RAD sequencing for
population genetics and evolutionary studies with or
without the availability of a reference genome (for more
examples, see Baird et al. 2008; Emerson et al. 2010;
Amores et al. 2011; Baxter et al. 2011; Dasmahapatra
et al. 2012; Peterson et al. 2012). Because most coastal
and oceanic species from shallow and deep environ-
ments lack genomic resources, RAD-seq offers a valu-
able tool for the identification of native source locations
for introduced species, and a tremendous opportunity
for the characterization of genetic diversity in other
species of ecological or conservation interest, especially
those for which basic taxonomic and population struc-
ture knowledge has been particularly challenging to
obtain (e.g. octocorals, see Herrera et al. 2010; McFad-
den et al. 2010 and references therein; Herrera et al.
2012).
Selection
High-density SNP maps generated from field-sampled
populations can be used to identify genomic regions
potentially under selection. When correlated with
known phenotypic diversity, linkage studies provide a
powerful tool in functional genomics to bridge genetic
and phenotypic variation (Feder & Mitchell-Olds 2003;
Mitchell-Olds et al. 2008; Stinchcombe & Hoekstra 2008;
Nadeau & Jiggins 2010). RAD-seq and similar methods,
for example restriction-site tiling analysis (Pespeni et al.
2010), that generate large number of SNPs provide the
technological approaches to produce these data for
nonmodel species. For example, studies in stickleback
(Hohenlohe et al. 2010) and the purple sea urchin
(Pespeni et al. 2012) have each identified novel genomic
regions under selection, which correlate with differen-
tial phenotypes in natural populations. Given the exten-
sive latitudinal range and high degree of genetic
structure of N. vectensis, it is reasonable to expect local
adaptation in its populations.
Two previous studies with N. vectensis mined SNPs
from Sanger-sequenced expressed sequence tags and
identified geographically segregated polymorphisms in
highly conserved regions of genes (Reitzel et al. 2010),
one of which has dramatic functional impacts on
protein function (NF-jB, Sullivan et al. 2009). This previous
approach has clear limitations because SNPs could only
be identified in coding regions, which are certainly
important in adaptive evolution (Hoekstra & Coyne
2007), but would not identify SNPs in noncoding
regions that are also of functional importance (Wray
2007). Furthermore, this approach introduces biases,
such as ascertainment bias, because all source sequences
for SNP identification are generated from individuals
collected at one geographic location. In this study, we
have identified SNPs throughout the genomes of indi-
viduals collected from four geographic locations. We
utilized the restriction enzyme SbfI to generate the RAD
tags, which would at most produce ~2000 cuts based on
counts from the reference genome of N. vectensis. This
number is considerably smaller than the number of cut
sites in the genomes of teleost fishes (~25 000–30 000),
such as the threespine stickleback (Hohenlohe et al.
2010; Amores et al. 2011), which makes it impossible to
generate equivalent high-density mapping for N. vecten-
sis from data generated with this same restriction
enzyme. To achieve a higher mapping density, addi-
tional, more frequently cutting restriction enzymes
would be required (e.g. EcoRI). However, even under
this restriction, we identified 37 polymorphic sites
common among all analyses that were inferred to be
under balancing selection. Perhaps surprisingly, a large
majority of these SNPs were in gene bodies, many of
which have clear orthology to proteins of known func-
tion in other animals. For example, one SNP was
located in an intron of a single ortholog to DNA meth-
yltransferase 1, an enzyme that establishes and regu-
lates tissue-specific patterns of cytosine methylation,
and an intergenic SNP was located nearest to heat
shock factor I, the principle transcription factor that reg-
ulates downstream expression of genes involved in tem-
perature stress. Future research utilizing a more
frequently cutting enzyme will generate a higher-den-
sity SNP map, which will facilitate a more thorough
analysis of genomic regions under selection in these
populations.
Future directions for Nematostella
In addition to resolving population relationships and
identification of genomic regions undergoing selection,
RAD-seq identification of SNPs can be used as a tool to
push functional molecular studies in N. vectensis.
Identification of SNPs linked to a particular genomic
region will allow researchers to identify and test the
relationship of candidate genomic loci with phenotypes
of interest. N. vectensis has emerged as a premier model
© 2013 John Wiley & Sons Ltd
2966 A. M. REITZEL ET AL.
in cnidarian developmental biology and is a prime
candidate as an experimental system in functional molec-
ular genetics. Experimentally induced mutations com-
bined with SNP profiling are a powerful tool that can be
used to identify mutations underlying novel phenotypes
in N. vectensis with high resolution. Researchers would
be able to exploit the asexual reproductive biology of
N. vectensis to perpetually maintain deleterious alleles in
heterozygous individuals, which would facilitate
conducting forward genetic screens to investigate molecular
mechanisms governing the development of particular
morphological characters or differences in physiology.
This unbiased forward approach would be an influential
technological leap for evolutionary developmental biology
and evolutionary ecology of cnidarians, which, until
now, rely heavily on candidate gene approaches. Such
unbiased approaches would inherently investigate novel
mechanisms governing biological processes.
Conclusion
We have presented the broad utility of RAD-seq to char-
acterize the genome-wide distribution of polymor-
phisms in a coastal invertebrate. Our data reveal strong
population genetic structure, clear phylogeographic rela-
tionships and candidate regions of the genome undergo-
ing selection in natural populations. This approach
holds tremendous promise for understanding the
genetic relationships and phylogeography of other
marine invertebrates, including those of conservation
concern that have traditionally been difficult to study
due to the lack of genetic variation (e.g. corals). Popula-
tion genomic approaches will produce data that may be
used to quantify the role played by the environment in
selecting for local adaptation via ecologically important
regions of the genome. This in turn will generate
hypotheses about how functional portions of the gen-
ome are being shaped by natural and anthropogenic
selection.
Acknowledgements
AMR was supported by Ruth L. Kirschstein National Research
Service Award F32HD062178, National Institutes of Health,
NICHD. We are grateful for the support provided by the Office
of Ocean Exploration, National Oceanic and Atmospheric
Administration (NA05OAR4601054), the National Science
Foundation (OCE-0624627; OCE-1131620) and the Academic
Programs Office (Ocean Ventures Fund award to SH), the
Deep Ocean Exploration Institute (Fellowship support to TMS)
and the Ocean Life Institute of the Woods Hole Oceanographic
Institution. MJL was supported by Ruth L. Kirschstein National
Research Service Award FHD0550002, National Institutes of
Health, NICHD. Partial funding for data generation was
provided by the Woods Hole Oceanographic Institution to
Dr. Ann Tarrant (WHOI). We thank J. McDermott and mem-
bers of the Shank laboratory for proofreading earlier versions
of this manuscript. The comments from three anonymous
reviewers substantially improved this manuscript.
REFERENCES
Adams SM, Lindmeier JB, Duvernell DD (2006) Microsatellite
analysis of the phylogeography, Pleistocene history and
secondary contact hypotheses for the killifish, Fundulus
heteroclitus. Molecular Ecology, 15, 1109–1123.
Allendorf FW, Phelps SR (1981) Use of allelic frequencies to
describe population-structure. Canadian Journal of Fisheries
and Aquatic Sciences, 38, 1507–1514.Amores A, Catchen J, Ferrara A, Fontenot Q, Postlethwait JH
(2011) Genome evolution and meiotic maps by massively
parallel DNA sequencing: spotted gar, an outgroup for the
Teleost genome duplication. Genetics, 188, 799–808.Antao T, Lopes A, Lopes R, Beja-Pereira A, Luikart G (2008)
LOSITAN: a workbench to detect molecular adaptation
based on a Fst-outlier method. BMC Bioinformatics, 9, 323.
Arnaud-Haond S, Belkhir K (2007) GENCLONE: a computer
program to analyse genotypic data, test for clonality and
describe spatial clonal organization. Molecular Ecology Notes,
7, 15–17.
Arnaud-Haond S, Duarte CM, Alberto F, Serrao EA (2007)
Standardizing methods to address clonality in population
studies. Molecular Ecology, 16, 5115–5139.Baird NA, Etter PD, Atwood TS et al. (2008) Rapid SNP discov-
ery and genetic mapping using sequenced RAD markers.
PLoS ONE, 3, 3376.
Baums IB (2008) A restoration genetics guide for coral reef
conservation. Molecular Ecology, 17, 2796–2811.
Baxter SW, Davey JW, Johnston JS et al. (2011) Linkage map-
ping and comparative genomics using next-generation RAD
sequencing of a non-model organism. PLoS ONE, 6, e19315.Bay L, Crozier R, Caley M (2006) The relationship between
population genetic structure and pelagic larval duration in
coral reef fishes on the Great Barrier Reef. Marine Biology,
149, 1247–1256.
Beaumont MA, Nichols RA (1996) Evaluating loci for use in
the genetic analysis of population structure. Proceedings of the
Royal Society of London. Series B, Biological Sciences, 263, 1619–1626.
Bilewitch JP, Degnan SM (2011) A unique horizontal gene
transfer event has provided the octocoral mitochondrial gen-
ome with an active mismatch repair gene that has potential
for an unusual self-contained function. BMC Evolutionary
Biology, 11, 228.
Botsford LW, White JW, Coffroth MA et al. (2009) Connectivity
and resilience of coral reef metapopulations in marine pro-
tected areas: matching empirical efforts to predictive needs.
Coral Reefs, 28, 327–337.Bradbury IR, Laurel B, Snelgrove PVR, Bentzen P, Campana SE
(2008) Global patterns in marine dispersal estimates: the
influence of geography, taxonomic category and life history.
Proceedings of the Royal Society B: Biological Sciences, 275, 1803–1809.
Brito PH, Edwards SV (2008) Multilocus phylogeography and
phylogenetics using sequence-based markers. Genetica, 135,
439–455.
© 2013 John Wiley & Sons Ltd
CNIDARIAN POPULATION GENOMICS 2967
Brumfield R (2003) The utility of single nucleotide polymor-
phisms in inferences of population history. Trends in Ecology
and Evolution, 18, 249–256.
Catchen JM, Amores A, Hohenlohe P, Cresko W, Postlethwait
JH (2011) Stacks: building and genotyping Loci de novo from
short-read sequences. G3 (Bethesda, Md.), 1, 171–182.Ciannelli L, Knutsen H, Olsen EM et al. (2010) Small-scale
genetic structure in a marine population in relation to water
circulation and egg characteristics. Ecology, 91, 2918–2930.
Cockerham CC, Weir BS (1993) Estimation of gene flow from
F-statistics. Evolution, 47, 855–863.
Conesa A, Gotz S, Garcia-Gomez JM et al. (2005) Blast2GO: a
universal tool for annotation, visualization and analysis in
functional genomics research. Bioinformatics, 21, 3674–3676.Cowen RK, Sponaugle S (2009) Larval dispersal and marine
population connectivity. Annual Review of Marine Science, 1,
443–466.
Cowen RK, Lwiza KMM, Sponaugle S, Paris CB, Olson DB
(2000) Connectivity of marine populations: open or closed?
Science, 287, 857–859.Darling JA, Reitzel AM, Finnerty JR (2004) Regional population
structure of a widely introduced estuarine invertebrate:
Nematostella vectensis Stephenson in New England. Molecular
Ecology, 13, 2969–2981.Darling JA, Reitzel AR, Burton PM et al. (2005) Rising starlet:
the starlet sea anemone, Nematostella vectensis. BioEssays, 27,
211–221.
Darling JA, Kuenzi A, Reitzel AM (2009) Human-mediated
transport determines the non-native distribution of the
anemone Nematostella vectensis, a dispersal-limited estuarine
invertebrate. Marine Ecology Progress Series, 380, 137–146.Dasmahapatra KK, Walters JR, Briscoe AD et al. (2012) Butter-
fly genome reveals promiscuous exchange of mimicry adap-
tations among species. Nature, doi:10.1038/nature11041.
De Wit P, Palumbi SR (2012) Transcriptome-wide polymorphisms
of red abalone (Haliotis rufescens) reveal patterns of
gene flow and local adaptation. Molecular Ecology, 22, 2884–2897.
Diniz-Filho JAF, de Campos Telles MP, Bonatto SL et al. (2008)
Mapping the evolutionary twilight zone: molecular markers,
populations and geography. Journal of Biogeography, 35,
753–763.
Earl DA, Vonholdt BM (2012) STRUCTURE HARVESTER: a
website and program for visualizing STRUCTURE output
and implementing the Evanno method. Conservation Genetics
Resources, 4, 359–361.
Emerson KJ, Merz CR, Catchen JM et al. (2010) Resolving post-
glacial phylogeography using high-throughput sequencing.
Proceedings of The National Academy of Sciences of The United
States of America, 107, 16196–16200.
Evanno G, Regnaut S, Goudet J (2005) Detecting the number of
clusters of individuals using the software STRUCTURE: a
simulation study. Molecular Ecology, 14, 2611–2620.Ewing B, Green P (1998) Base-calling of automated sequencer
traces using phred. II. Error probabilities. Genome Research, 8,
186–194.
Ewing B, Hillier L, Wendl MC, Green P (1998) Base-calling of
automated sequencer traces using phred. I. Accuracy assess-
ment. Genome Research, 8, 175–185.Falush D, Stephens M, Pritchard JK (2003) Inference of
population structure using multilocus genotype data: linked
loci and correlated allele frequencies. Genetics, 164, 1567–
1587.
Faurby S, Barber PH (2012) Theoretical limits to the correlation
between pelagic larval duration and population genetic
structure. Molecular Ecology, 21, 3419–3432.
Feder ME, Mitchell-Olds T (2003) Evolutionary and ecological
functional genomics. Nature Reviews Genetics, 4, 651–657.
Guindon S, Dufayard JF, Lefort V et al. (2010) New algorithms
and methods to estimate maximum-likelihood phylogenies:
assessing the performance of PhyML 3.0. Systematic Biology,
59, 307–321.
Hand C, Uhlinger K (1994) The unique, widely distributed sea
anemone, Nematostella vectensis Stephenson: a review, new
facts, and questions. Estuaries, 17, 501–508.Hauser L, Carvalho GR (2008) Paradigm shifts in marine
fisheries genetics: ugly hypotheses slain by beautiful facts.
FishandFisheries, 9, 333–362.
Herrera S, Baco A, S�anchez JA (2010) Molecular systematics of
the bubblegum coral genera (Paragorgiidae, Octocorallia)
and description of a new deep-sea species. Molecular Phyloge-
netics and Evolution, 55, 123–135.
Herrera S, Shank TM, S�anchez JA (2012) Spatial and temporal
patterns of genetic variation in the widespread antitropical
deep-sea coral Paragorgia arborea. Molecular Ecology, 21, 6053–6057.
Hinrichs AL, Suarez BK (2005) Genotyping errors, pedigree
errors, and missing data. Genetic Epidemiology, 29, S120–S124.
Hoekstra HE, Coyne JA (2007) The locus of evolution:
Evo devo and the genetics of adaptation. Evolution, 61,
995–1016.
Hohenlohe PA, Bassham S, Etter PD et al. (2010) Population
genomics of parallel adaptation in threespine stickleback
using sequenced RAD tags. Plos Genetics, 6, e1000862.
Hughes TP, Baird AH, Bellwood DR et al. (2003) Climate
change, human impacts, and the resilience of coral reefs.
Science, 301, 929–933.
Huse SM, Huber JA, Morrison HG, Sogin ML, Mark Welch D
(2007) Accuracy and quality of massively parallel DNA
pyrosequencing. Genome Biology, 8, R143.
Jennings RM, Shank TM, Mullineaux LS, Halanych KM (2009)
Assessment of the Cape Cod phylogeographic break using
the bamboo worm Clymenella torquata reveals the role of
regional water masses in dispersal. Journal of Heredity, 100,
86–96.
Johnstone IM (2001) On the distribution of the largest eigen-
value in principal components analysis. Annals of Statistics,
29, 295–327.Jones CG, Lawton JH, Shachak M (1994) Organisms as ecosys-
tem engineers. Oikos, 69, 373–386.de Koning APJ, Gu W, Castoe TA, Batzer MA, Pollock DD
(2011) Repetitive elements may comprise over two-thirds of
the human genome. Plos Genetics, 7, e1002384.
Kumar S, Skjaeveland A, Orr RJS et al. (2009) AIR: a batch-
oriented web program package for construction of superma-
trices ready for phylogenomic analyses. BMC Bioinformatics,
10.
Langmead B, Trapnell C, Pop M, Salzberg SL (2009) Ultrafast
and memory-efficient alignment of short DNA sequences to
the human genome. Genome Biology, 10, 357.
Luikart G, England PR, Tallmon D, Jordan S, Taberlet P (2003)
The power and promise of population genomics: from
© 2013 John Wiley & Sons Ltd
2968 A. M. REITZEL ET AL.
genotyping to genome typing. Nature Reviews Genetics, 4,
981–994.Mach M, Sbrocco E, Hice L et al. (2011) Regional differentiation
and post-glacial expansion of the Atlantic silverside, Menidia
menidia, an annual fish with high dispersal potential. Marine
Biology, 158, 515–530.Mariette S, Le Corre V, Austerlitz F, Kremer A (2002) Sampling
within the genome for measuring within-population diver-
sity: trade-offs between markers. Molecular Ecology, 11, 1145–
1156.
McFadden CS, Sanchez JA, France SC (2010) Molecular phylo-
genetic insights into the evolution of Octocorallia: a review.
Integrative and Comparative Biology, 50, 389–410.
Mitchell-Olds T, Feder M, Wray G (2008) Evolutionary and
ecological functional genomics. Heredity, 100, 101–102.
Morin PA, Luikart G, Wayne RK, Grp SW (2004) SNPs in
ecology, evolution and conservation. Trends in Ecology and
Evolution, 19, 208–216.Nadeau NJ, Jiggins CD (2010) A golden age for evolutionary
genetics? Genomics studies of adaptation in natural popula-
tions. Trends in Genetics, 26, 484–492.
Nelson JC, Wang SC, Wu YY et al. (2011) Single-nucleotide
polymorphism discovery by high-throughput sequencing in
sorghum. BMC Genomics, 12, 352.
Palumbi SR (2003) Population genetics, demographic connec-
tivity, and the design of marine reserves. Ecological Applica-
tions, 13, S146–S158.
Palumbi SR (2004) Marine reserves and ocean neighborhoods:
the spatial scale of marine populations and their manage-
ment. Annual Review of Environment and Resources, 29, 31–68.
Parker PG, Snow AA, Schug MD, Booton GC, Fuerst PA (1998)
What molecules call tell us about populations: choosing and
using a molecular marker. Ecology, 79, 361–382.Patterson N, Price AL, Reich D (2006) Population structure and
eigenanalysis. Plos Genetics, 2, 2074–2093.Pearson CVM, Rogers AD, Sheader M (2002) The genetic
structure of the rare lagoonal sea anemone, Nematostella
vectensis Stephenson (Cnidaria; Anthozoa) in the United
Kingdom based on RAPD analysis. Molecular Ecology, 11,
2285–2293.
Pespeni MH, Oliver TA, Manier MK, Palumbi SR (2010)
Method Restriction Site Tiling Analysis: accurate discovery
and quantitative genotyping of genome-wide polymorphisms
using nucleotide arrays. Genome Biology, 11, R44.
Pespeni MH, Garfield DA, Manier MK, Palumbi SR (2012)
Genome-wide polymorphisms show unexpected targets of
natural selection. Proceedings of the Royal Society B: Biological
Sciences, 279, 1412–1420.
Peterson BK, Weber JN, Kay EH, Fisher HS, Hoekstra HE
(2012) Double digest RADseq: an inexpensive method for de
novo SNP discovery and genotyping in model and non-
model species. PLoS ONE, 7, e37135.
Petit RJ, Duminil J, Fineschi S et al. (2004) Comparative organi-
zation of chloroplast, mitochondrial and nuclear diversity in
plant populations. Molecular Ecology, 14, 689–701.Price AL, Patterson NJ, Plenge RM et al. (2006) Principal com-
ponents analysis corrects for stratification in genome-wide
association studies. Nature Genetics, 38, 904–909.
Pritchard JK, Stephens M, Donnelly P (2000) Inference of
population structure using multilocus genotype data. Genetics,
155, 945–959.
Purchell JE, Uye S, Lo W-T (2007) Anthropogenic causes of
jellyfish blooms and their direct consequences for humans: a
review. Marine Ecology Progress Series, 350, 153–174.
Putnam NH, Srivastava M, Hellsten U et al. (2007) Sea anem-
one genome reveals ancestral eumetazoan gene repertoire
and genomic organization. Science, 317, 86–94.Rambaut A (2009) FigTree: Tree Figure Drawing Tool, version 1.3.1.
Institute of Evolutionary Biology, University of Edinburgh.
Reich D, Thangaraj K, Patterson N, Price AL, Singh L (2009)
Reconstructing Indian population history. Nature, 461,
489–494.
Reitzel AM, Burton PM, Krone C, Finnerty JR (2007) Compar-
ison of developmental trajectories in the starlet sea anem-
one Nematostella vectensis: embryogenesis, regeneration, and
two forms of asexual fission. Invertebrate Biology, 126,
99–112.Reitzel AM, Darling JA, Sullivan JC, Finnerty JR (2008) Global
population genetic structure of the starlet anemone Nemato-
stella vectensis: multiple introductions and implications for
conservation policy. Biological Invasions, 10, 1197–1213.Reitzel AM, Sullivan JC, Finnerty JR (2010) Discovering SNPs
in protein coding regions with StellaSNP: illustrating the
characterization and geographic distribution of polymor-
phisms in the estuarine anemone Nematostella vectensis.
Estuaries and Coasts, 33, 930–943.
Rioux Paquette S (2011) PopGenKit: Useful Functions for File
Conversion and Data Resampling in Microsatellite Datasets. R
package, version 1.0. Available at http://cran.r-project.org/
web/packages/PopGenKit/index.html.
Roberts JM, Wheeler AJ, Freiwald A (2006) Reefs of the deep:
the biology and geology of cold-water coral ecosystems.
Science, 312, 543–547.
Roesti M, Hendry AP, Salzburger W, Berner D (2012) Genome
divergence during evolutionary diversification as revealed in
replicate lake-stream stickleback population pairs. Molecular
Ecology, 21, 2852–2862.
Rosenberg NA (2004) DISTRUCT: a program for the graphical
display of population structure. Molecular Ecology Notes, 4,
137–138.Rowe HC, Renaut S, Guggisberg A (2011) RAD in the realm of
next-generation sequencing technologies. Molecular Ecology,
20, 3499–3502.
Schmieder R, Edwards R (2011) Quality control and prepro-
cessing of metagenomic datasets. Bioinformatics, 27, 863–864.
Shearer T, Van Oppen M, Romano S, Worheide G (2002) Slow
mitochondrial DNA sequence evolution in the Anthozoa
(Cnidaria). Molecular Ecology, 11, 2475–2487.Silva JF, Lima CA, Perez CD, Gomes PB (2010) First record of
the sea anemone Nematostella vectensis (Actiniaria: Edwardsii-
dae) in Southern Hemisphere waters. Zootaxa, 2343, 66–68.
Stinchcombe JR, Hoekstra HE (2008) Combining population
genomics and quantitative genetics: finding the genes under-
lying ecologically important traits. Heredity, 100, 158–170.Sullivan JC, Wolenski FS, Reitzel AM et al. (2009) Two alleles
of NF-jB in the sea anemone Nematostella vectensis are
widely dispersed in nature and encode proteins with distinct
activities. PLoS ONE, 4, e7311.
Sunnucks P (2000) Efficient genetic markers for population
biology. Trends in Ecology & Evolution, 15, 199–203.Tavare S (1986) Some Probabilistic and Statistical Problems in
the Analysis of DNA Sequences. In: Lectures on Mathematics
© 2013 John Wiley & Sons Ltd
CNIDARIAN POPULATION GENOMICS 2969

in the Life Sciences(ed Lipman D, Miura RM), pp. 57–86.
Providence, RI, American Mathematical Society.
Tracy CA, Widom H (1994) Level-spacing distributions and the
airy kernel. Communications in Mathematical Physics, 159,
151–174.
Waples RS (1998) Separating the wheat from the chaff: patterns
of genetic differentiation in high gene flow species. Journal of
Heredity, 89, 438–450.Weersing K, Toonen RJ (2009) Population genetics, larval dis-
persal, and connectivity in marine systems. Marine Ecology
Progress Series, 393, 1–12.
Weir BS, Cockerham CC (1984) Estimating F-Statistics for the
analysis of population-structure. Evolution, 38, 1358–1370.
Williams LM, Oleksiak MF (2008) Signatures of selection in
natural populations adapted to chronic pollution. BMC
Evolutionary Biology, 8, 282.
Willing EM, Dreyer C, van Oosterhout C (2012) Estimates of
genetic differentiation measured by F(ST) do not necessarily
require large sample sizes when using many SNP markers.
PLoS ONE, 7, e42649.
Wray GA (2007) The evolutionary significance of cis-regulatory
mutations. Nature Reviews Genetics, 8, 206–216.Wright S (1931) Evolution in Mendelian populations. Genetics,
16, 97–159.
A.M.R., S.H. and M.J.L. designed the experiment.
A.M.R. and S.H. analysed the data and drafted the
manuscript. M.Q.M. and T.M.S. participated in design
of the study and interpretation of results. All authors
approved the final manuscript.
Data accessibility
• Raw DNA sequence reads are available at the U.S.
National Center for Biotechnology Information
(NCBI) Sequence Read Archive (SRA) accession
number SRA055050.
• Alignments of RAD sequence reads to the reference
genome, as produced by BOWTIE, and the RAD
markers used in the population genomic analyses
are available in DRYAD doi:10.5061/dryad.gk2vc.
• Genomic positions, protein IDs, population statistics
and GO results for each one of the candidate loci
under selection are available as supplementary
material.
Supporting information
Additional supporting information may be found in the online
version of this article.
Fig. S1 Percentages of the number of reads retained after each
major filtering step.
Fig. S2 Scatter plots of the coverage per locus and the number
of identified RAD markers a functions of the number of reads
generated per individual.
Fig. S3 Box and whisker plots showing the effect of utilizing
the N. vectensis reference genome to filter sequence reads. Data
are from resampled data sets and are grouped by population.
Fig. S4 Scatter plots of FST vs. expected heterozygosity (He) for
the biallelic SNP in the four analyses.
Fig. S5 PCA eigenvector 1 vs. eigenvector 2, results of the four
analyses.
Fig. S6 PCA eigenvector 1 vs. eigenvector 3, results of the four
analyses.
Fig. S7 PCA eigenvector 2 vs. eigenvector 3, results of the four
analyses.
Fig. S8 Phylogeography of N. vectensis, results of the four analy-
ses. Presented trees show the most-likely phylogeographic
hypotheses resulting from maximum-likelihood analyses.
Table S1. Details of the 37 markers candidate under balancing
selection common among all four analyses.
Table S2. Tracy-Widom statistics of significance of the identified
principal components.
Table S3. Chi-square statistics of significance of the differences
between identified populations identified by the PCA.
© 2013 John Wiley & Sons Ltd
2970 A. M. REITZEL ET AL.
Top Related