


Languages
Pages
Legal


Going-Private Decisions and the Sarbanes-Oxley Act of 2002 A Cross-Country Analysis
EHUD KAMAR PINAR KARACA-MANDIC ERIC TALLEY
WR-300-2-EMKF
February 2008
WORK ING P A P E R
This product is part of the RAND
Institute for Civil Justice working
paper series. RAND working papers
are intended to share researchers’
latest findings and to solicit additional
peer review. This paper has been
peer reviewed but not edited. Unless
otherwise indicated, working papers
can be quoted and cited without
permission of the author, provided
the source is clearly referred to as a
working paper. RAND’s publications
do not necessarily reflect the opinions
of its research clients and sponsors.
is a registered trademark.
Kauffman-RAND Institute forEntrepreneurship Public PolicyA RAND INSTITUTE FOR CIVIL JUSTICE CENTER

1
Acknowledgments
Ehud Kamar is a Professor of Law at the University of Southern California Gould
School of Law. Pinar Karaca-Mandic is an Assistant Professor in the Division of Health and
Policy Management, at the University of Minnesota School of Public Health, and an Adjunct
Economist at the RAND Corporation. Eric Talley is a Professor of Law at the University of
California at Berkeley Boalt Hall School of Law, and a Senior Economist at the RAND
Corporation.
We thank an anonymous referee, Barry Adler, Yakov Amihud, Oren Bar-Gill, Lucian
Bebchuk, Stephen Choi, Robert Cooter, John Donohue, Guido Ferrarini, Victor Fleischer,
Jesse Fried, Susan Gates, Clayton Gillette, Marcel Kahan, Lewis Kornhauser, Russell
Korobkin, Eran Lempert, Alexander Ljungqvist, David Loughran, Robert Reville, Larry
Ribstein, Michael Rich, Roberta Romano, Gerald Rosenfeld, Daniel Rubinfeld, Alan
Schwartz, Seth Seabury, Sagiv Shiv, Stanley Siegel, James Thompson, Mark Weinstein, Dana
Welch, and workshop participants at the American Law and Economics Association 2006
Annual Meeting, the American Economic Association 2007 Annual Meeting, Columbia
University, Cornell University, New York University, RAND Corporation, University of
California at Berkeley, University of California at Los Angeles, University of Southern
California, University of Colorado, and University of Virginia for comments and discussion,
and RAND/Kauffman Center for the Study of Small Business, New York University School
of Law, and University of Southern California Gould School of Law for financial support.
All errors are ours.

2
Preface
This article investigates whether the passage and the implementation of the Sarbanes-
Oxley Act of 2002 (SOX) drove firms out of the public capital market. To control for other
factors affecting exit decisions, we examine the post-SOX change in the propensity of public
American targets to be bought by private acquirers rather than public ones with the
corresponding change for foreign targets, which were outside the purview of SOX. Our
findings are consistent with the hypothesis that SOX induced small firms to exit the public
capital market during the year following its enactment. In contrast, SOX appears to have had
little effect on the going-private propensities of larger firms.
The Kauffman-RAND Institute for Entrepreneurship Public Policy, which is
housed within the RAND Institute for Civil Justice, is dedicated to assessing and improving
legal and regulatory policymaking as it relates to small businesses and entrepreneurship in a
wide range of settings, including corporate governance, employment law, consumer law,
securities regulation, and business ethics. The institute's work is supported by a grant from the
Ewing Marion Kauffman Foundation
The RAND Institute for Civil Justice is an independent research program within the
RAND Corporation. The mission of the RAND Institute for Civil Justice (ICJ), a division of
the RAND Corporation, is to improve private and public decision making on civil legal issues
by supplying policymakers and the public with the results of objective, empirically based,
analytic research. The ICJ facilitates change in the civil justice system by analyzing trends
and outcomes, identifying and evaluating policy options, and bringing together
representatives of different interests to debate alternative solutions to policy problems. The

3
Institute builds on a long tradition of RAND research characterized by an interdisciplinary,
empirical approach to public policy issues and rigorous standards of quality, objectivity, and
independence.
ICJ research is supported by pooled grants from corporations, trade and professional
associations, and individuals; by government grants and contracts; and by private foundations.
The Institute disseminates its work widely to the legal, business, and research communities,
and to the general public. In accordance with RAND policy, all Institute research products are
subject to peer review before publication. ICJ publications do not necessarily reflect the
opinions or policies of the research sponsors or of the ICJ Board of Overseers.
For additional information on the RAND Institute for Civil Justice or the Kauffman-
RAND Institute for Entrepreneurship Public Policy, please contact:
Robert Reville, Director RAND Institute for Civil Justice 1776 Main Street, P.O. Box 2138 Santa Monica, CA 90407–2138 (310) 393–0411 x6786; FAX: (310) 451–6979 Email: [email protected]
Susan Gates, Director Kauffman–RAND Institute for
Entrepreneurship Public Policy 1776 Main Street, P.O. Box 2138 Santa Monica, CA 90407–2138 (310) 393–0411 x7452;FAX: (310) 451–6979 Email: [email protected]

4
The Sarbanes-Oxley Act of 2002 was enacted after a series of corporate failures that
had shaken public confidence in public securities markets. The Act (along with its regulatory
implementation, to which we refer collectively as “SOX”) introduced significant changes in
the governance, accounting, auditing, and reporting environment of firms traded in American
securities markets. Its most notorious mandate is a requirement under Section 404 to include
in the annual report an attestation by an outside auditor to the effectiveness of the firm’s
internal controls over financial reporting. Additional mandates, among many others, include a
requirement that the chief executive officer and the chief financial officer certify the accuracy
of the firm’s periodic reports and the effectiveness of its internal controls, a requirement that
the firm have an audit committee composed exclusively of independent directors, and a ban
on the outside auditor from providing certain non-audit services to the firm.
Since the enactment of SOX, researchers have begun isolating and studying its effects.
Some studies have found, for example, that SOX was associated with a decline in the rate of
incentive compensation, research and development expenses, and capital expenditures (Cohen
et al. 2007). There is also evidence that SOX was associated with a reduction in accrual-
based earnings management (Cohen et al. 2008). Nevertheless, the overall effect of SOX on
publicly traded firms remains in dispute. Proponents of SOX argue that it facilitates access to
the public capital market by alleviating investor concerns (Cunningham 2003; Coates 2007).
Opponents argue that it unduly raises the cost of being public (Ribstein 2002; Gordon 2003;
Romano 2005).
Of particular interest in this debate is whether SOX disadvantages small firms by
applying to them the same standards it applies to large firms. Responding to this concern, the
Securities and Exchange Commission (SEC) has granted firms with market capitalization

5
below $75 million several deadline extensions — first in June 2003 and most recently in
December 2006 — to comply with the most onerous SOX requirement, an annual duty to
evaluate the effectiveness of internal controls over financial reporting. Thus far, however, the
SEC has stopped short of crafting special carve-outs for these firms despite a recommendation
to do so by an SEC committee (Advisory Committee on Small Public Companies 2006).
In this article, we test whether the net cost of complying with SOX has driven firms in
general, and small firms in particular, to exit the public capital market. Many other attempts
to address this question have had difficulty controlling for unobserved conflating factors that
could have affected exit decisions around the enactment of SOX. We address this difficulty
using a difference-in-differences empirical strategy. This approach compares changes over
time in two populations: one subject to a policy intervention (treatment group), and the other
not (control group). To evaluate the impact of the intervention on outcome, one needs to
compare the outcome change for the treatment group with the outcome change for the control
group. Assuming the two groups are similar in all relevant respects other than their exposure
to the intervention, this approach screens out changes not related to the intervention.
The primary outcome variable in our analysis is a public target’s probability of being
bought by a private acquirer rather than a public one, the treatment group is American targets,
and the control group is foreign targets. To evaluate the effect of SOX, we compare the
change in the propensity of American public targets to be bought by private acquirers rather
than by public acquirers to the corresponding change for foreign public targets. The
difference between the two changes — the difference in differences — is the change we
attribute to SOX.

6
We predict that any effect of SOX on going-private transactions will be most
pronounced for small firms, for two related reasons. First, small firms are more likely than
large firms to be sold in response to SOX because they derive relatively smaller net benefits
from being public and thus stand closer to being sold when there is an increase in the cost of
being public, especially if the increase is relatively larger for them. The acquirers in these
acquisitions, in turn, tend to be financial acquirers, which are typically private. Second, at
least some of the costs of complying with SOX, such as ensuring the effectiveness of internal
controls over financial reporting, are firm-specific and thus not avoidable by a sale to another
public firm. Accordingly, if SOX imposes a relatively larger net cost on small firms, these
firms will lose more of their appeal to public acquirers than will larger firms.
Our results are consistent with this prediction. When we examine acquisitions as a
whole, we find no relative increase in the rate of acquisition by private acquirers (going
private) among American firms. When we differentiate between acquisitions based on firm
size, however, we find a relative increase in the rate of going private by small American
firms. Moreover, when we differentiate between acquisitions based on their proximity to the
enactment of SOX, we find a relative increase in the rate of going private by American firms
in the first year after the enactment. Finally, when we differentiate between acquisitions
based on both firm size and the proximity of the acquisition to the enactment of SOX, we find
that the increase in the rate of going private by small American firms is concentrated in the
first year after the enactment.
The dampening of the SOX effect in the second year after SOX was enacted is
consistent with more than one interpretation. Our preferred interpretation is that maladapted
firms realized their susceptibility to the new regime and went private promptly, before the full

7
panoply of its requirements applies to them, leaving behind public firms that were better
suited to the new regulatory environment.
A second interpretation is that SOX imposed on firms a large upfront cost and a low
recurring cost. This interpretation is consistent with the facts that some of the new mandates
took effect immediately, and that it took time for the SEC to clarify in rules the new mandates
and for a market for SOX consulting services to develop. It is at odds, however, with the fact
that the most costly component of SOX — an annual report on the effectiveness of internal
controls — took effect only in late 2004 and exceeded early cost estimates. Indeed, this
component of SOX has yet to be applied to small firms — the very firms whose propensity to
go private increased after the enactment of SOX.
A third interpretation is that over time other countries have also tightened the
regulation of public firms, bringing going-private rates closer to the American level.1 This
interpretation, however, in unlikely to fully explain the disappearance of the SOX effect after
a year, as we are unaware of foreign reforms similar in scope to SOX at that time.2
1 In July 2003, for example, the United Kingdom required public firms to establish independent audit committees with at least one financial expert to monitor their internal controls (Financial Services Authority 2003).
2 We do not separate the effect of SOX from the effect of other mechanisms of heightened scrutiny to which public firms in the United States became subject around its enactment. SOX was a response to the end of the technology bubble of the late 1990s and the spate of corporate scandals that followed. But it was not the only response. Within the United States, courts, regulators, stock exchanges, and investors all intensified their scrutiny of public firms in additional ways. Each of these non-SOX changes could have raised the cost of being public. Our study compares the combined effect of SOX and these related changes to that of contemporaneous trends abroad.

8
Our analysis proceeds as follows. Section 1 discusses the literature on the effects of
SOX. Section 2 outlines our theoretical framework and empirical strategy, and describes our
data. Section 3 reports our results. Section 4 performs a number of robustness checks.
Section 5 concludes.
1. Related Literature
Existing empirical studies of the impact of SOX follow three approaches.3 One set of
studies assess the accounting and audit costs imposed by SOX. These studies do not measure
the net effect of SOX on the viability of being public. Carney (2006) reviews some of the
studies. Their common theme is that public firms’ accounting and audit costs have increased
substantially since SOX and exceeded early estimates. Eldridge and Kealey (2005) find that
the audit costs associated with SOX increase in assets, asset growth, and effectiveness of
internal controls, but the ratio of these costs to assets decreases in assets.
Another set of studies estimate abnormal stock returns associated with events leading
to the enactment of SOX. While the results of these studies are mixed about the overall effect
of SOX, they suggest that SOX imposed a disproportionate cost on small firms. Zhang
(2007) finds negative returns. Jain and Rezaee (2006) and Li et al. (2008) find positive
returns but a negative relation between returns and practices that SOX sought to limit. Engel
et al. (2007) find that returns are positively related to market capitalization and stock turnover
but do not report whether returns are positive or negative. Chhaochharia and Grinstein (2007)
3 Kamar et al. (2007) provide a detailed review of the literature.

9
find that small firms with ineffective internal controls or boards that are not independent
(which are more affected by SOX) underperform small firms with effective internal controls
or independent boards (which are less affected). In contrast, they find no difference in
performance for large firms whose internal controls are ineffective, and find that large firms
whose boards are not independent outperform similar firms whose boards are independent.
Wintoki (2007) finds that returns are positively related to firm size and age and negatively
related to market-to-book ratio and to expenditure on research and development. Litvak
(2007a) finds in a study of foreign firms cross-listed in the United States that small firms and
large firms experience similar negative returns. Litvak (2007b) finds that small firms react
more negatively when measuring the effect using Tobin’s Q.
A final set of studies, the closest in their approach to this article, examine the effect of
SOX on deregistration. Public firms can deregister their stock with the SEC and thereby opt
out of federal securities law by selling all of their stock to a private acquirer (going private) or
cashing out small shareholders to lower the number of shareholders below 300 (going dark).
Unlike going dark, going private can achieve a number of business goals other than avoiding
federal securities law (Jensen 1989; Kaplan 1989a, 1989b; Baker and Wruck 1990;
Lichtenberg and Siegel 1990; Smith 1990). Consistently, existing studies suggest that going-
dark transactions are more clearly affected by SOX than going-private transactions. Block
(2004) reports that the most commonly cited reason for going private or going dark, especially
by small firms and after the enactment of SOX, is the cost of being public. Engel et al. (2007)
find a small post-SOX increase in deregistration, which becomes insignificant when going-
dark transactions are excluded. Leuz et al. (2008) find a post-SOX increase in going dark, but
10
no significant increase in going private. They also find that distress predicts going dark
before the enactment of SOX, while agency costs predict going dark after its enactment.
The deregistration studies do not separate the effect of SOX from that of
contemporaneous factors that can increase the rate of going private or going dark. One such
factor is financial market liquidity, which can affect the willingness of public and private
investors to pursue acquisitions. This factor applies mainly to going-private transactions
because they require more cash than going-dark transactions. Another factor, applicable to
both types of transactions, is the weakness of the public capital market. Firms are more likely
to leave the public capital market when stock prices are depressed (Maupin et al. 1984; Lerner
1994; Pagano et al. 1998; Benninga et al. 2005). Both of these factors were present around
the enactment of SOX.4
2. Theoretical Framework, Empirical Strategy, and Data
A. Theoretical Framework
In light of the difficulties noted above, our framework is based on a difference-in-
differences approach in which we compare the post-SOX change in the probability that
American public firms undergoing an acquisition be acquired by a private acquirer to the
4 Holstein (2004), MacFayden (2002, 2003, 2004), and Carney (2006) report that the ready availability of private equity financing around the enactment of SOX fueled going-private transactions. Block (2004) reports that almost 40% of firms that either went private or went dark after the enactment of SOX cited as the primary reason not the cost of being public under SOX, but rather pressure and time constraints for top management, lack of coverage by security analysts, absence of liquidity in the public capital market, absence of opportunity for a secondary market, or threat of delisting by Nasdaq.
11
correspondent change for foreign firms, while controlling for the level of stock prices in the
country of primary listing when the transaction is announced. This study design separates the
effect of SOX from the effect of contemporaneous market conditions in two ways. First, it
contrasts the United States with other countries, which were not directly affected by SOX.
Second, it contrasts going-private transactions with acquisitions by public acquirers. The
disadvantage of this study design is that it does not measure the rate of going-dark
transactions which, as noted above, are an alternative way to escape SOX.
As formally developed in the Appendix, SOX could increase the probability that
public firms be acquired by private acquirers rather than public ones in two ways.
First, the cost of complying with SOX could trigger the sale of firms that would not be
sold otherwise. These sales would tend to involve so-called financial acquirers, which invest
in targets, often with target management participation, to sell them later at a profit. Financial
acquirers are distinguished from so-called strategic acquirers, which aim to integrate the
operations of targets with their own, and are therefore less sensitive to price. Importantly, for
reasons unrelated to SOX, most financial acquirers are privately owned. We refer to this
explanation as the “new sales hypothesis”. As the Appendix demonstrates, this hypothesis
requires a sufficiently dense population of private acquirers (relative to the population of
public acquirers) ready to buy firms that pursue a sale to avoid the cost of complying with

12
SOX. This condition is plausible for financial acquirers because, unlike strategic acquirers,
they need not fit the target with operations of their own.5
Second, the cost of complying with SOX could also cause a shift in the composition of
acquirers of firms that would be sold for any reason. According to this theory, post-SOX
acquisitions would tend to involve private acquirers more than pre-SOX acquisitions because
private acquirers retain none of the target’s SOX obligations after the acquisition, while
public acquirers do. The enactment of SOX should therefore reduce the price that public
acquirers would pay in the acquisition relative to private acquirers. We refer to this
explanation as the “all sales hypothesis”.
The post-SOX increase in the probability of being sold to a private acquirer could be
more pronounced for small firms because their costs of being public, especially after adding
the costs of complying with SOX, are relatively higher, and their benefits from being public
are relatively lower, than those of large firms (Pagano and Röell 1998; Pagano et al. 1998).
Accordingly, as we explain further below, both the “new sales hypothesis” and the “all sales
hypothesis” predict that the effect of SOX on the type of acquirers buying public firms will be
most noticeable in small firm acquisitions.
5 The sale of Toys “R” Us to financial acquirer KKR, which began in an attempt to sell one of the firm’s divisions (Global Toys), is a useful illustration: “[The firm’s investment bank] First Boston contacted 29 potential buyers for Global Toys . . . None of the 29 potential buyers was a so-called “strategic buyer” and apparently for good reason. At oral argument and in their briefs, the plaintiffs have been unable to identify any existing retailer that would have a plausible strategy for combining itself in a synergistic manner with Global Toys . . . The 29 financial buyers First Boston contacted are a “who’s who” of private equity funds.” In re Toys “R” Us, Inc., Shareholder Litigation, 877 A.2d 975, 987 (Del. Ch. 2005).

13
The cost of filing periodic reports is a case in point. Even before SOX, small firms
lacked the scale economies that large firms enjoy in preparing these reports. The requirement
of Section 404 of SOX that periodic reports also evaluate the internal controls of the reporting
firm deepened this disadvantage (Holmstrom and Kaplan 2003). According to one newspaper
editorial, “while Section 404 costs the average multibillion-dollar firm about 0.05% of
revenue, the figure can approach 3% for small companies” (Wall Street Journal 2005). The
new burden was especially heavy for small firms because, unlike large firms, many of them
lacked accounting staff to monitor the effectiveness of their internal controls. Consistently,
Doyle et al. (2007) find that small firms are more likely to have ineffective internal controls
than large firms, and Eldridge and Kealey (2005) find that the increase in audit fees in the first
year of complying with SOX is higher for firms with ineffective internal controls and is
higher relative to assets for small firms.
At the same time, small firms gain from being public relatively less than large firms.
The financial press routinely stresses this point. The Economist (2003), for example, reports
increasing marginalization of small firms in the public capital market. Similarly, Deutsch
(2005) notes that small firms often derive low benefits from being public due to limited
market attention and liquidity, and quotes the president of Corfacts, a small telemarketing
firm that left the public capital market in 2004, explaining: “We have been unable to gain a
significant following in the market, yet we have been spending large sums of money for
accounting and legal services needed to maintain our reporting status.” By comparison,
Deutsch (2005) notes, leaving the public capital market is “not an option for huge companies”
because “their identities and structures are inextricably linked with their status as publicly

14
listed entities.” Consistently, Jain et al. (2008) find that large firms experienced a larger
increase in stock market liquidity after the enactment of SOX than small firms.
The differences between small firms and large firms in the costs and benefits of being
public can make small firms more likely to go private in response to SOX both under the
“new sales hypothesis” and under the “all sales hypothesis”.
First, because small firms derive relatively smaller net benefits from being public, they
stand closer to being sold in response to any increase in the costs of being public, especially
when the increase itself is relatively larger for them. As noted above, this sale will likely
involve a financial acquirer, which is typically private, rather than an acquirer aiming to
integrate the target’s business with its own, which can be either private or public. In other
words, SOX is likely to cause small firms to gravitate towards private acquirers under the
“new sales hypothesis”.
Second, to the extent that small firms’ relatively higher costs of complying with SOX
are firm-specific and therefore not avoidable by a sale to other public firms, SOX should
reduce the price public acquirers would pay for small firms relatively more than it reduces the
price these acquirers would pay for large firms. The duty to establish internal controls under
Section 404 of SOX is again a case in point. As Aquila and Golden (2002), Walton and
Greenberg (2003), Glover and Krause (2004), and Klingsberg and Noble (2004) explain,
because the acquirer will assume responsibility for these controls after the acquisition at
uncertain costs, it will demand that they pass muster in advance. The relatively higher cost
that small firms incur to establish internal controls thus cannot be avoided through a sale to a
public acquirer even though the acquirer has established its own internal controls. Put

15
differently, SOX is likely to cause small firms to gravitate towards private acquirers also
under the “all sales hypothesis”.
B. Empirical Strategy
Our basic empirical specification for estimating the difference between the post-SOX
change in going private in the United States and the corresponding change abroad is a probit
model in which the dependent variable is an indicator for whether the acquirer is private and
the independent variables are an indicator for acquisitions announced after the enactment of
SOX (After), an indicator for targets primarily traded in the United States (US), and an
interaction between After and US. This interaction is the key variable. Accordingly, we
estimate the parameters of the probit specification
yikt = 0 + 1USi × Aftert + 2USi + xkt + zi + k + t + ikt, (1)
where i is a specific acquisition, k is the stock exchange, t is the time of announcement, yikt is
an indicator for being acquired by a private acquirer rather than by a public acquirer, USi is an
indicator for targets primarily listed in the United States, Aftert is an indicator for acquisitions
announced after July 31, 2002, xkt is the log of the normalized stock index of the target’s
country of primary listing at announcement, zi is an indicator for target’s 2-digit SIC code
industry, k comprises stock exchange fixed effects, t comprises quarter fixed effects, and ikt
is an error term.
We include several controls for unobserved market characteristics affecting going
private decisions. Following Bertrand and Mullainathan (1999), Gruber (2000), Athey and

16
Stern (2002), and Donohue et al. (2002), we assume that these characteristics can be
decomposed into a fixed component specific to each market and a component that changes
over time but is common to all markets. Accordingly, we modify the specification to include
stock exchange fixed effects, single-digit SIC industry fixed effects, and calendar quarter
fixed effects. We capture some market-specific changes by adding the log of the normalized
stock index of the target’s country of primary listing at announcement.6 Following Bertrand
et al. (2004), we cluster standard errors at the country in which the stock exchange is located
to account for potential serial correlation.
We extend the basic model to allow the coefficient of US × After to differ between
small and large targets, and between acquisitions announced in the first year after the
enactment of SOX and acquisitions announced thereafter.7
C. Data
Our primary data source is Thomson’s Securities Data Company Platinum database
(SDC). The initial sample includes all transactions involving public targets announced
between January 1, 2000 and December 31, 2004 other than spinoffs, recapitalizations, self-
6 The results are robust to adding as controls other financial statistics (by month, year, and country) published by the International Monetary Fund, such as the central bank deposit rate, the lending rate, the treasury bill rate, and the money market rate.
7 In principle, this framework could be expanded to a nested set of decisions, with the first decision concerning whether to be sold and the second decision concerning the type of acquirer. Because of data restrictions, we focus on the second decision by investigating firms’ propensity to be sold to private acquirers rather than public ones conditional on being sold. In Section 3, however, we return to the first decision by investigating whether the number of acquisitions increased after the enactment of SOX.

17
tenders, exchange offers, repurchases, and privatizations. We classify an acquirer as private
when both it and its ultimate parents are private. We classify a target as public when it is
traded on an established public stock exchange, and classify it as an American public firm
when it is primarily traded on any such market in the United States other than Pink Sheets.
We do not treat firms traded on Pink Sheets as American public firms because many of these
firms are not registered with the Securities and Exchange Commission and are therefore not
subject to SOX. The American public firms in our sample are traded on American Stock
Exchange, Boston Stock Exchange, Nasdaq, New York Stock Exchange, OTC Bulletin
Board, and Philadelphia Stock Exchange.
SDC does not identify which of the firms primarily traded abroad are also traded in the
United States. Because these firms are subject to some of the provisions of SOX, an inability
to identify them biases our results toward zero. This weakening should nevertheless be
minimal because cross-listed firms, which tend to be large, are unlikely to give up their access
to the public capital market abroad just to avoid SOX. Rather, as Whoriskey (2005) reports,
they are likely to go dark in the United States while maintaining their listing abroad.
Our initial sample contains 19,947 announced acquisitions between January 2000 and
December 2004. We exclude, in the following order, 1562 withdrawn acquisitions, 413
acquisitions of American firms by foreign public firms or their subsidiaries (which, despite
being direct or indirect acquisitions by public acquirers, would relieve the targets of their
SOX duties), 711 acquisitions of foreign firms by American public firms or their subsidiaries
(which, despite being acquisitions of public firms, would bring the targets into the ambit of
SOX), 29 acquisitions by the targets themselves, 3200 acquisitions of firms partially owned
by public firms (which would not relieve the parent firms of their SOX duties even if made by

18
private acquirers), 661 acquisitions of targets whose primary stock exchange is unknown, 854
acquisitions whose status is “Intended”, “Rumor”, “S buyer” (seeking buyer), or “Unknown”,
786 acquisitions lacking information about the percentage of target stock sought to be owned
by the acquirer after the transaction, 3933 acquisitions lacking information about the target’s
stock market value, 4933 acquisitions by acquirers seeking to own only part of the target’s
stock (because the targets of such partial acquisitions remain public — and subject to SOX —
even when the acquirer is private), and 208 acquisitions of firms primarily listed on stock
exchanges with fewer than 20 acquired firms in the sample period (to reliably differentiate
between small and large firms within each stock exchange).8
We record each target’s primary stock exchange, single-digit Standard Industry
Classification (SIC) code, stock market value four weeks before the announcement of the
acquisition, and announcement date — all as provided in SDC. The foreign firms in our
sample are primarily traded in one of 17 countries.9 We scale the stock market value of the
firm by the United States Consumer Price Index (CPI) in the month in which the transaction
was announced.
8 To the extent that, SOX aside, partial acquisitions and full acquisitions are affected by similar economic conditions, partial acquisitions can serve as a useful comparison group (in addition to foreign acquisitions) for isolating the effect of SOX. In unreported regressions, we included partial acquisitions in the sample and distinguished between them and full acquisitions, finding no effect for partial acquisitions or an opposite effect to the one we found for full acquisitions.
9 The countries are Australia, Canada, Denmark, France, Germany, Hong Kong, India, Italy, Japan, Malaysia, Netherlands, Norway, Singapore, South Africa, Sweden, Thailand, and United Kingdom.

19
We complement the SDC data with the Morgan Stanley Capital International, Inc.
(MSCI) stock index data. MSCI provides monthly stock indexes for developed and emerging
countries. For each transaction, we compute the normalized stock index of the target’s
country of primary listing at announcement, defined as the ratio of the value of the stock
index in the target’s country of primary listing when the acquisition was announced to the
value of that index in January 1999.
3. Results
Table 1 reports summary statistics. After the enactment of SOX, the percentage of
small targets, defined as firms whose market value is in the bottom quartile of their primary
stock exchange over the sample period (the mean threshold is about $18 million and the
standard deviation is about $10 million), increases by 36% in the United States (from 22% to
30%), while increasing by 13% abroad generally (from 24% to 27%) and by 8% (from 25% to
27%) in Canada and Western Europe, whose markets are arguably more integrated with the
American market than other markets. The percentage of acquisitions by private acquirers also
increases in the United States more than abroad. Focusing on acquisitions of small targets,
this percentage increases by 35% (from 40% to 54%) in the United States, while increasing by
2% (from 45% to 46%) abroad generally and by 13% (from 53% to 60%) in Canada and
Western Europe. Taken as a whole, these summary statistics are consistent with the
hypothesis that SOX increased the probability that small firm acquisitions involve private
acquirers. The results reported below provide additional evidence consistent with this
hypothesis.

20
Table 1: Full Acquisitions of Public Targets Announced Between January, 1 2000 and December 31, 2004
Panel A: Acquisitions Announced Between January 1, 2000 and July 30, 2002
United States W. Europe &
Canada All Abroad
Number of observations 974 441 724 Market value ($1,000,000) Mean 827 557 525 Standard deviation 4753 2069 2221 % small targets 22 25 24 % private acquirers 23 45 37 % private acquirers among small targets 40 53 45
Panel B: Acquisitions Announced Between August 1, 2002 and December 31, 2004
United States W. Europe &
Canada All Abroad Number of observations 679 319 712 Market value ($1,000,000) Mean 475 616 388 Standard deviation 1895 3251 2232 % small targets 30 27 27 % private acquirers 32 42 42 % private acquirers among small targets 54 60 46
We start with testing whether the number of acquisitions of public targets traded in the United
States increases after the enactment of SOX relative to the corresponding change abroad.
Specifically, we compare the number of acquisitions announced per quarter in the United
States and abroad in a sample of acquisitions announced up to a year after the enactment of
SOX using an ordinary least squares regression model, while distinguishing between small
targets and large ones.
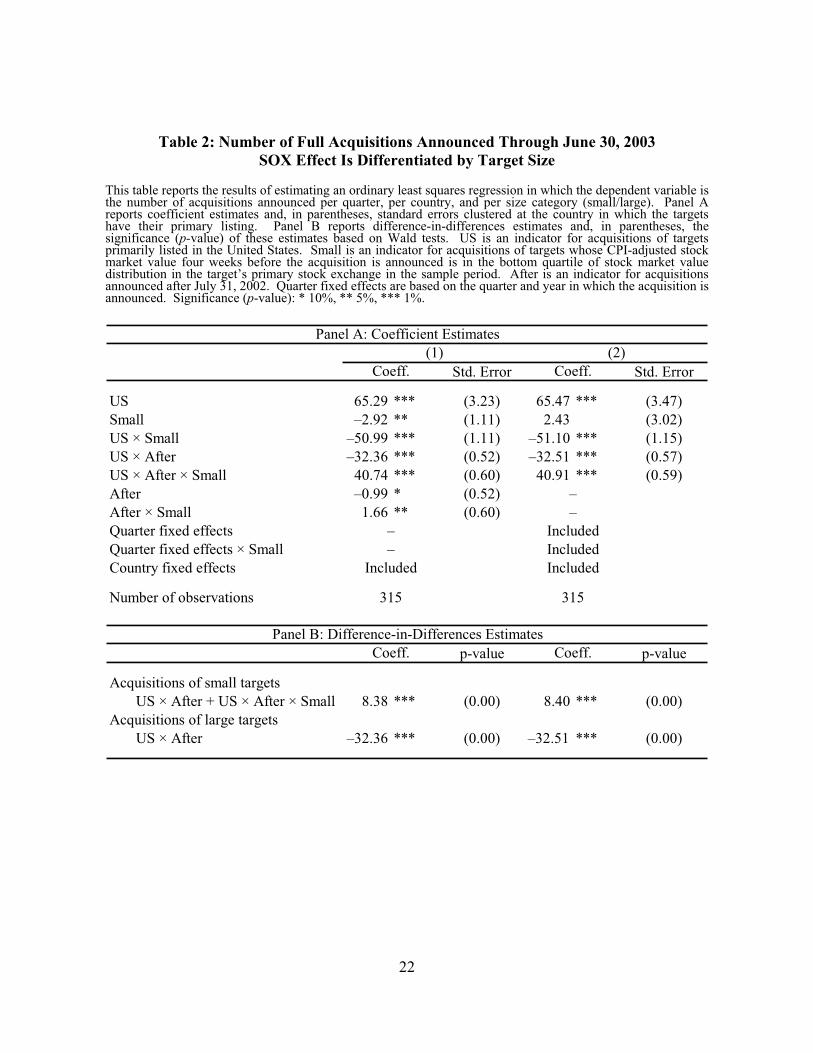
Table 2 reports the results. The difference-in-differences estimate is positive and
significant for small firms, consistent with the notion that anticipated SOX compliance costs
21
drove small target acquisitions in the first year after the enactment. In terms of economic
significance, the coefficients reported in Column (2) indicate a 38% post-SOX increase in the
average number of small target acquisitions per quarter in the United States from 21 to 29. In
contrast, the difference-in-differences estimate is negative and significant for large targets.
The results are robust to replacing After by quarter fixed effects and replacing After × Small
by the interaction of quarter fixed effects with Small. In unreported regressions for a sample
period ending on December 31, 2004, the difference-in-differences estimate for small firms
becomes smaller and insignificant, while the difference-in-differences estimate for large firms
becomes smaller but remains significant.
22
Table 2: Number of Full Acquisitions Announced Through June 30, 2003 SOX Effect Is Differentiated by Target Size
This table reports the results of estimating an ordinary least squares regression in which the dependent variable is the number of acquisitions announced per quarter, per country, and per size category (small/large). Panel A reports coefficient estimates and, in parentheses, standard errors clustered at the country in which the targets have their primary listing. Panel B reports difference-in-differences estimates and, in parentheses, the significance (p-value) of these estimates based on Wald tests. US is an indicator for acquisitions of targets primarily listed in the United States. Small is an indicator for acquisitions of targets whose CPI-adjusted stock market value four weeks before the acquisition is announced is in the bottom quartile of stock market value distribution in the target’s primary stock exchange in the sample period. After is an indicator for acquisitions announced after July 31, 2002. Quarter fixed effects are based on the quarter and year in which the acquisition is announced. Significance (p-value): * 10%, ** 5%, *** 1%.
Std. Error Std. Error
US 65.29 *** (3.23) 65.47 *** (3.47)Small –2.92 ** (1.11) 2.43 (3.02)US × Small –50.99 *** (1.11) –51.10 *** (1.15)US × After –32.36 *** (0.52) –32.51 *** (0.57)US × After × Small 40.74 *** (0.60) 40.91 *** (0.59)After –0.99 * (0.52)After × Small 1.66 ** (0.60)Quarter fixed effectsQuarter fixed effects × SmallCountry fixed effects
Number of observations
p-value p-value
Acquisitions of small targets US × After + US × After × Small 8.38 *** (0.00) 8.40 *** (0.00)Acquisitions of large targets US × After –32.36 *** (0.00) –32.51 *** (0.00)
Panel A: Coefficient Estimates
Panel B: Difference-in-Differences Estimates
(1) (2)
315
Included––
Coeff.Coeff.
Coeff.Coeff.
––
IncludedIncludedIncluded
315

23
Next we examine whether SOX increased the probability that small target acquisitions
involve private acquirers. We begin our analysis by estimating the model in Equation (1),
which does not distinguish between acquisitions according to target size or the proximity of
the acquisition to the enactment of SOX,
Table 3 reports the results. The Wald tests reported in the table do not reject the null
hypothesis that SOX did not affect acquisitions.
Table 3: The Probability of Being Acquired by a Private Acquirer
This table reports the results of estimating a probit model in which the dependent variable is being acquired by a private acquirer rather than by a public acquirer. Panel A reports coefficient estimates and, in parentheses, standard errors clustered at the country in which the target has its primary listing. Panel B reports difference-in-differences estimates and, in parentheses, the significance (p-value) of these estimates based on Wald tests. US is an indicator for acquisitions of targets primarily listed in the United States. Small is an indicator for acquisitions of targets whose CPI-adjusted stock market value four weeks before the acquisition is announced is in the bottom quartile of stock market value distribution in the target’s primary stock exchange in the sample period. Log of country stock index is the log of the normalized stock index of the target’s country of primary listing at announcement. After is an indicator for acquisitions announced after July 31, 2002. Quarter fixed effects are based on the quarter and year in which the acquisition is announced. The regressions include unreported stock exchange fixed effects based on the stock exchange on which the target is primarily listed, and unreported industry fixed effects based on the single-digit SIC code of the target. Significance (p-value): * 10%, ** 5%, *** 1%.
Coeff. Std. Error
US –0.72 *** (0.12)US × After 0.07 (0.06)Log of stock price index –0.31 (0.27)
Quarter fixed effectsIndustry fixed effectsCountry fixed effects
Number of observations
p-value
US × After 0.07 (0.25)
Coeff.
Included
Panel A: Coefficient Estimates
Panel B: Difference-in-Differences Estimates
IncludedIncluded
3089

24
To test the hypothesis that SOX affected small firms more than others, we estimate a
model similar to Equation (1) while distinguishing between large targets and small targets.
We do so by adding an indicator (Small) for targets with market value in the bottom quartile
of their primary stock exchange and the interaction terms US × Small and US × After ×
Small.
Table 4 reports the results. As before, Column (1) assumes that all acquisitions are
affected by the same changes in unobserved economic conditions over time. Column (2)
relaxes this assumption by adding to the regression model a set of quarter fixed effects
interacted with Small. Column (3) relaxes the assumption that the stock exchanges in our
sample undergo the same unobservable changes over time. Following Athey and Stern
(2002), this is done by adding to the regression model a set of quarter fixed effects interacted
with the log of the normalized stock index of the target’s country of primary listing at
announcement. In all of the columns, the difference-in-differences estimate is positive and
significant for acquisitions of small targets, consistent with SOX driving small firms to exit
the public capital market. In contrast, the difference-in-differences estimate is insignificant
for acquisitions of large targets. In terms of economic significance, the coefficients reported
in Column (2) predict a significant increase from 0.40 to 0.54 in the probability that an
acquisition of a small target involve a private acquirer after the enactment of SOX.
25
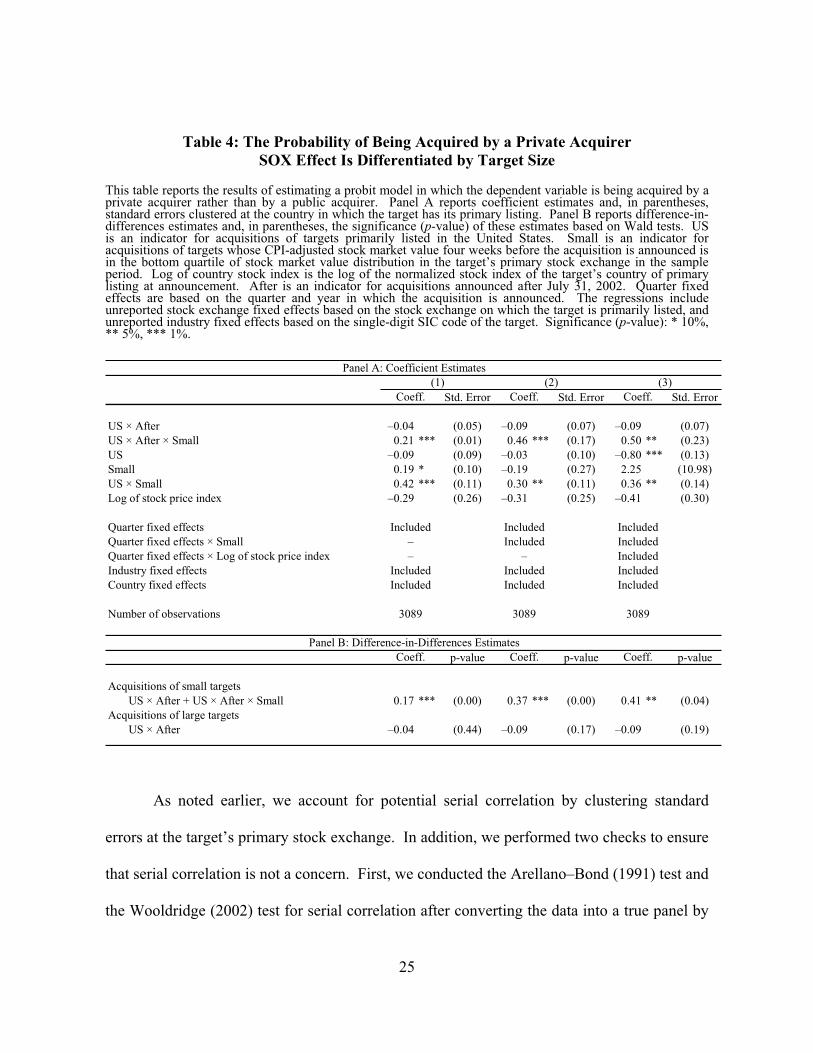
Table 4: The Probability of Being Acquired by a Private AcquirerSOX Effect Is Differentiated by Target Size
This table reports the results of estimating a probit model in which the dependent variable is being acquired by a private acquirer rather than by a public acquirer. Panel A reports coefficient estimates and, in parentheses, standard errors clustered at the country in which the target has its primary listing. Panel B reports difference-in-differences estimates and, in parentheses, the significance (p-value) of these estimates based on Wald tests. US is an indicator for acquisitions of targets primarily listed in the United States. Small is an indicator for acquisitions of targets whose CPI-adjusted stock market value four weeks before the acquisition is announced is in the bottom quartile of stock market value distribution in the target’s primary stock exchange in the sample period. Log of country stock index is the log of the normalized stock index of the target’s country of primary listing at announcement. After is an indicator for acquisitions announced after July 31, 2002. Quarter fixed effects are based on the quarter and year in which the acquisition is announced. The regressions include unreported stock exchange fixed effects based on the stock exchange on which the target is primarily listed, and unreported industry fixed effects based on the single-digit SIC code of the target. Significance (p-value): * 10%, ** 5%, *** 1%.
Std. Error Std. Error Std. Error
US × After –0.04 (0.05) –0.09 (0.07) –0.09 (0.07)US × After × Small 0.21 *** (0.01) 0.46 *** (0.17) 0.50 ** (0.23)US –0.09 (0.09) –0.03 (0.10) –0.80 *** (0.13)Small 0.19 * (0.10) –0.19 (0.27) 2.25 (10.98)US × Small 0.42 *** (0.11) 0.30 ** (0.11) 0.36 ** (0.14)Log of stock price index –0.29 (0.26) –0.31 (0.25) –0.41 (0.30)
Quarter fixed effectsQuarter fixed effects × SmallQuarter fixed effects × Log of stock price indexIndustry fixed effectsCountry fixed effects
Number of observations
p-value p-value p-value
Acquisitions of small targets US × After + US × After × Small 0.17 *** (0.00) 0.37 *** (0.00) 0.41 ** (0.04)Acquisitions of large targets US × After –0.04 (0.44) –0.09 (0.17) –0.09 (0.19)
Coeff.
–Included
3089
Included
3089
Included
Coeff.Coeff.
3089
Included
Included
Coeff.
IncludedIncluded
–Included
IncludedIncluded
Panel A: Coefficient Estimates
Panel B: Difference-in-Differences Estimates
(1) (2) (3)
Included–
Coeff. Coeff.
Included
As noted earlier, we account for potential serial correlation by clustering standard
errors at the target’s primary stock exchange. In addition, we performed two checks to ensure
that serial correlation is not a concern. First, we conducted the Arellano–Bond (1991) test and
the Wooldridge (2002) test for serial correlation after converting the data into a true panel by
26
taking the means of the relevant variables for each primary stock exchange and quarter.
Neither test showed serial correlation: The Arellano–Bond yielded a p-value of 0.98, and the
Wooldridge test yielded a p-value of 0.48. Second, following Bertrand et al. (2004), we
examined whether the results of Table 4 remain when we divide the sample into fewer
periods.10 Specifically, in unreported regressions, we repeated the analysis in Column (2) of
Table 4 while dividing the sample into three periods (pre-SOX, first year after SOX, second
year after SOX) and four periods (second year before SOX, first year before SOX, first year
after SOX, second year after SOX). The results remained.11
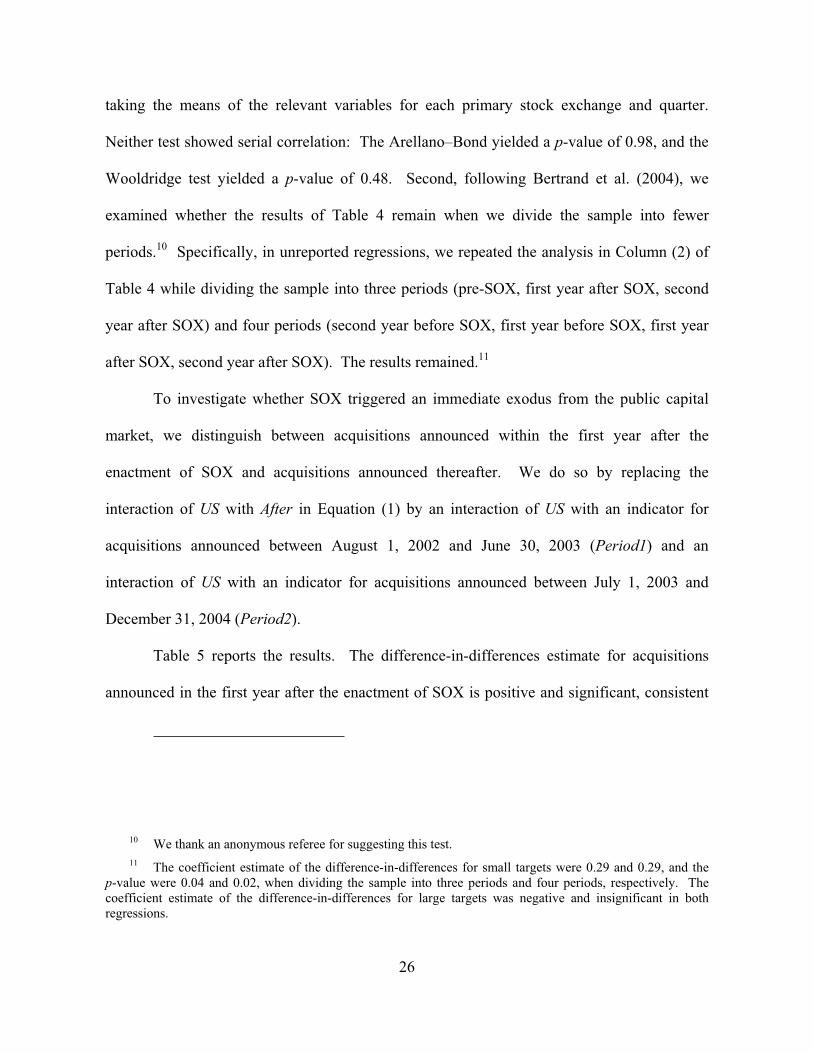
To investigate whether SOX triggered an immediate exodus from the public capital
market, we distinguish between acquisitions announced within the first year after the
enactment of SOX and acquisitions announced thereafter. We do so by replacing the
interaction of US with After in Equation (1) by an interaction of US with an indicator for
acquisitions announced between August 1, 2002 and June 30, 2003 (Period1) and an
interaction of US with an indicator for acquisitions announced between July 1, 2003 and
December 31, 2004 (Period2).
Table 5 reports the results. The difference-in-differences estimate for acquisitions
announced in the first year after the enactment of SOX is positive and significant, consistent
10 We thank an anonymous referee for suggesting this test. 11 The coefficient estimate of the difference-in-differences for small targets were 0.29 and 0.29, and the
p-value were 0.04 and 0.02, when dividing the sample into three periods and four periods, respectively. The coefficient estimate of the difference-in-differences for large targets was negative and insignificant in both regressions.

27
with the hypothesis that anticipated SOX compliance costs caused firms to exit the public
capital market in that period. In contrast, there is no effect for acquisitions announced more
than a year after the enactment of SOX.
Table 5: The Probability of Being Acquired by a Private Acquirer SOX Effect Is Differentiated by Proximity to the Enactment of SOX
This table reports the results of estimating a probit model in which the dependent variable is being acquired by a private acquirer rather than by a public acquirer. Panel A reports coefficient estimates and, in parentheses, standard errors clustered at the country in which the target has its primary listing. Panel B reports difference-in-differences estimates and, in parentheses, the significance (p-value) of these estimates based on Wald tests. US is an indicator for acquisitions of targets primarily listed in the United States. Small is an indicator for acquisitions of targets whose CPI-adjusted stock market value four weeks before the acquisition is announced is in the bottom quartile of stock market value distribution in the target’s primary stock exchange in the sample period. Log of country stock index is the log of the normalized stock index of the target’s country of primary listing at announcement. Period1 is an indicator for acquisitions announced between August1, 2002 and June 30, 2003. Period2 is an indicator for acquisitions announced after June 30, 2003. Quarter fixed effects are based on the quarter and year in which the acquisition is announced. The regressions include unreported stock exchange fixed effects based on the stock exchange on which the target is primarily listed, and unreported industry fixed effects based on the single-digit SIC code of the target. Significance (p-value): * 10%, ** 5%, *** 1%.
Std. Error
US × Period1 0.31 *** (0.08)US × Period2 –0.11 (0.08)US –0.70 *** (0.11)Log of stock price index –0.28 (0.27)
Quarter fixed effectsIndustry fixed effectsCountry fixed effects
Number of observations
p-value
Acquisitions announced in Period1 US × Period1 0.31 *** (0.00)Acquisitions announced in Period2 US × Period2 –0.11 (0.20)
Panel A: Coefficient Estimates
Panel B: Difference-in-Differences Estimates
Coeff.
Coeff.
IncludedIncludedIncluded
3089
Having found a post-SOX increase in going private by small targets (Table 4) and an
increase in going private in the first year after the enactment of SOX (Table 5), we proceed to

28
test whether the effect on small targets is concentrated in the first year after the enactment of
SOX. We do so by estimating the model reported in Table 5 for a sample of small target
acquisitions.
Table 6 reports the results. Column (1) includes all of the small targets in our sample.
The probability of acquisition by a private acquirer is significantly higher for acquisitions of
American targets announced in the first year after the enactment of SOX. This effect is not
only statistically significant, but also economically meaningful, raising the mean probability
of going private by small targets predicted by the coefficients from 0.39 to 0.64.12 In contrast,
there is no effect for acquisitions announced more than a year after the enactment of SOX. In
an unreported regression, we repeated this analysis for large firms, finding no similar effect
(the coefficient estimate of the difference-in-differences in the first year after the enactment of
SOX was 0.01 and the p-value was 0.92). This evidence is consistent with the hypothesis that
SOX induced small firms, but not large firms, to go private within a year after its enactment.
To test whether the disappearance of the SOX effect is the result of a tightening of
regulation outside the United States, Columns (2) and (3) exclude, respectively, targets
primarily listed in Western Europe and Canada (which are more likely to have reformed their
laws following SOX) and targets primarily listed in other foreign countries (which are less
likely to have done so). The results in both columns are qualitatively similar to those in
12 The figures 0.39 and 0.64 are, respectively, the mean predicted probability that the American firms in our sample go private when both Period1 and Period2 are set to 0, and the mean predicted probability that the American firms in our sample go private when Period1 is set to 1 and Period2 is set to 0.

29
Column (1), though the statistical significance is lower in Column (3), perhaps due to the
small number of foreign targets primarily listed outside Western Europe and Canada (93
targets, compared to 235 targets primarily listed in Western Europe or Canada). These
findings suggest that the disappearance of the SOX effect is not due to a tightening of
regulation outside the United States.
Table 6: Small Targets’ Probability of Being Acquired by a Private Acquirer SOX Effect Is Differentiated by Proximity to the Enactment of SOX
This table reports the results of estimating a probit model in which the dependent variable is being acquired by a private acquirer rather than by a public acquirer. Targets are included if their CPI-adjusted stock market value four weeks before the acquisition is announced is less than the bottom quartile of stock market value in their primary stock exchange. Panel A reports coefficient estimates and, in parentheses, standard errors clustered at the country in which the target has its primary listing. Panel B reports difference-in-differences estimates and, in parentheses, the significance (p-value) of these estimates based on Wald tests. US is an indicator for acquisitions of targets primarily listed in the United States. Log of country stock index is the log of the normalized stock index of the target’s country of primary listing at announcement. Period1 is an indicator for acquisitions announced between August1, 2002 and June 30, 2003. Period2 is an indicator for acquisitions announced after June 30, 2003. Quarter fixed effects are based on the quarter and year in which the acquisition is announced. The regressions include unreported stock exchange fixed effects based on the stock exchange on which the target is primarily listed, and unreported industry fixed effects based on the single-digit SIC code of the target. Significance (p-value): * 10%, ** 5%, *** 1%.
Std. Error Std. Error Std. Error
US × Period1 0.72 *** (0.21) 0.71 *** (0.25) 0.62 * (0.37)US × Period2 0.13 (0.25) 0.05 (0.29) –0.02 (0.38)US –0.72 ** (0.29) –0.04 (0.30) –0.77 ** (0.36)Log of stock price index –0.16 (0.71) 0.38 (0.79) –0.67 (0.72)
Quarter fixed effectsIndustry fixed effectsCountry fixed effects
Number of observations
p-value p-value p-value
Acquisitions announced in Period1 US × Period1 0.72 *** (0.00) 0.71 *** (0.00) 0.62 * (0.09)Acquisitions announced in Period2 US × Period2 0.13 (0.62) 0.05 (0.87) –0.02 (0.95)
Coeff. Coeff. Coeff.Panel B: Difference-in-Differences Estimates
Panel A: Coefficient Estimates
(1)Coeff.
All CountriesU.S. and Western
CountriesU.S. and Non-Western
Countries(2) (3)
Coeff. Coeff.
IncludedIncludedIncluded
649
IncludedIncludedIncluded
507
IncludedIncludedIncluded
742

30
4. Robustness Checks and Hypotheses Testing
We now turn to a number of robustness checks of our results.
A. Modifying the Control Group
Table 7 presents sensitivity analyses of the specification reported in Table 4. Column
(1) reproduces Column (2) of Table 4. Column (2) reports the results of estimating the same
regression model while excluding acquisitions by acquirers with more than one generation of
parents. In our original sample, we define acquirers as private when both they and their
ultimate parents are private. This definition, however, will cause us to label acquirers with
private ultimate parents but public intermediate parents as private acquirers. SDC reports the
Committee on Uniform Securities Identification Procedures (CUSIP) code of intermediate
parents of acquirers, but does not report whether these parents are public. To ensure that we
do not label acquirers with public intermediate parents as private acquirers, we exclude
acquisitions in which the immediate parent and the ultimate parent of the acquirer have
different CUSIP codes.
To control for cross-country variation in market conditions not captured by the stock
index, Column (3) reports the results of estimating the same regression model for targets
traded in United States, Canada, or Western Europe. Similarly, Column (4) presents results
for targets traded in the United States or Canada. Over the sample period, the correlation
between the stock index in the United States and the mean stock index in the Western
European countries in our sample is 0.97, and the corresponding correlation between the stock
indexes in the United States and Canada is 0.90. In contrast, the corresponding correlation
31
between the stock index in the United States and the mean stock index in the remaining
countries in our original sample is 0.56.
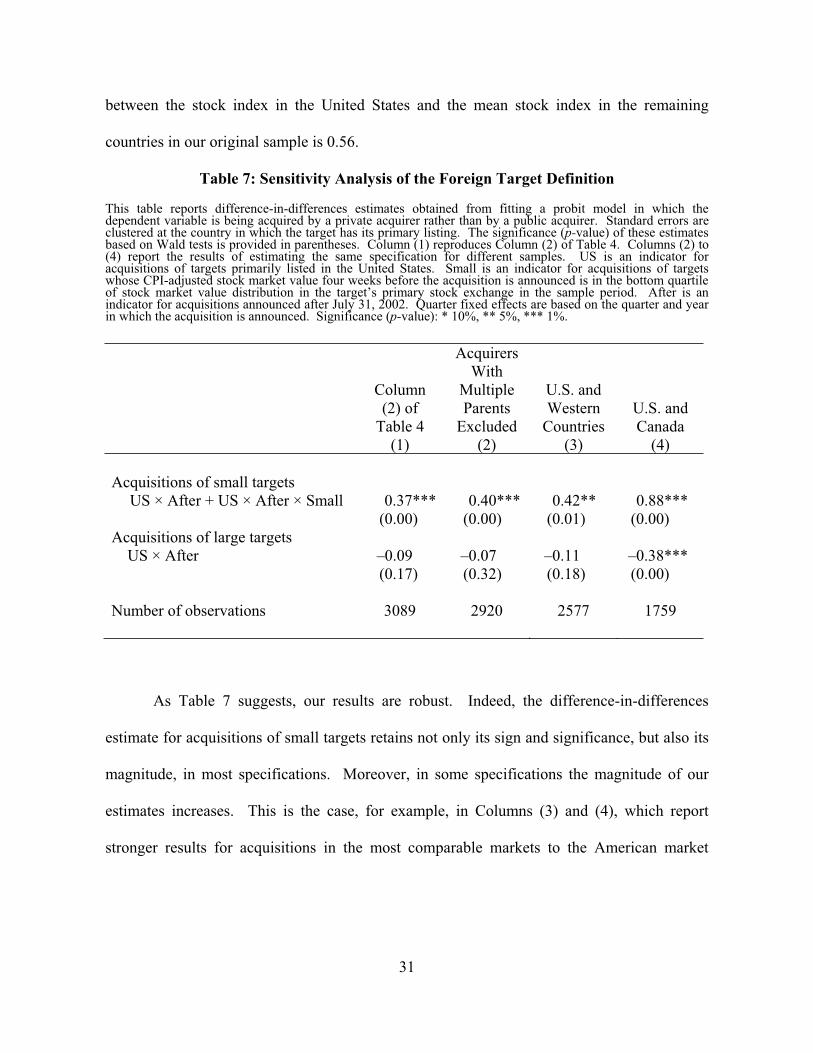
Table 7: Sensitivity Analysis of the Foreign Target Definition
This table reports difference-in-differences estimates obtained from fitting a probit model in which the dependent variable is being acquired by a private acquirer rather than by a public acquirer. Standard errors are clustered at the country in which the target has its primary listing. The significance (p-value) of these estimates based on Wald tests is provided in parentheses. Column (1) reproduces Column (2) of Table 4. Columns (2) to (4) report the results of estimating the same specification for different samples. US is an indicator for acquisitions of targets primarily listed in the United States. Small is an indicator for acquisitions of targets whose CPI-adjusted stock market value four weeks before the acquisition is announced is in the bottom quartile of stock market value distribution in the target’s primary stock exchange in the sample period. After is an indicator for acquisitions announced after July 31, 2002. Quarter fixed effects are based on the quarter and year in which the acquisition is announced. Significance (p-value): * 10%, ** 5%, *** 1%.
Column (2) of
Table 4
AcquirersWith
Multiple Parents
Excluded
U.S. and Western
CountriesU.S. and Canada
(1) (2) (3) (4)
Acquisitions of small targets US × After + US × After × Small 0.37*** 0.40*** 0.42** 0.88***
(0.00) (0.00) (0.01) (0.00) Acquisitions of large targets US × After –0.09 –0.07 –0.11 –0.38***
(0.17) (0.32) (0.18) (0.00)
Number of observations 3089 2920 2577 1759
As Table 7 suggests, our results are robust. Indeed, the difference-in-differences
estimate for acquisitions of small targets retains not only its sign and significance, but also its
magnitude, in most specifications. Moreover, in some specifications the magnitude of our
estimates increases. This is the case, for example, in Columns (3) and (4), which report
stronger results for acquisitions in the most comparable markets to the American market
32
(Canada and Western Europe), even though the samples in these columns are smaller than our
original sample.
B. Modifying the Definition of a Small Firm
Next, we conduct robustness checks of our definition of a small firm. Table 8 reports
our results. Column (1) of Table 8 reproduces Column (2) of Table 4, which classifies a
target as small if its CPI-adjusted stock market value four weeks before the acquisition is
announced was in the bottom quartile of its primary stock exchange regardless of when the
target was acquired. However, if target stock prices declined during the sample period, using
a fixed value cutoff would result in an increase in the number of firms classified as small after
the enactment of SOX. To address this concern, we calculate the bottom quartile of the CPI-
adjusted stock market value for pre-SOX and post-SOX acquisitions separately, and classify a
target as small based on the bottom quartile of its primary stock exchange in the period its
acquisition was announced. Column (2) reports the results of using this classification.
Column (3) reports the results of using the bottom quartile of the entire sample ($16 million)
as a value cutoff for all targets. Column (4) reports the results of classifying a target as small
if it was in the bottom quartile of the entire sample in the period its acquisition was announced
($20 million before SOX, and $13 million after SOX). The estimates in Columns (1) through
(4) are qualitatively similar.

33
Table 8: Sensitivity Analysis of the Small Target Definition
This table reports difference-in-differences estimates obtained from fitting a probit model in which the dependent variable is being acquired by a private acquirer rather than by a public acquirer. Standard errors are clustered at the country in which the target has its primary listing. The significance (p-value) of these estimates based on Wald tests is provided in parentheses. Column (1) reproduces Column (2) of Table 4. In Column (2), Small is an indicator for acquisitions of targets whose CPI-adjusted stock market value four weeks before the acquisition is announced is in the bottom quartile of the stock market value distribution in the target’s primary stock exchange in the period in which the acquisition is announced (pre-SOX or post-SOX). In Column (3), Small is an indicator for acquisitions of targets whose CPI-adjusted stock market value four weeks before the acquisition is announced is less than $16 million, corresponding to the bottom quartile of stock market value distribution of the sample. In Column (4), Small is an indicator for acquisitions of targets whose CPI-adjusted stock market value four weeks before the acquisition is announced is less than $20 million for acquisition announced before the enactment of SOX, and $13 million for acquisitions announced after the enactment of SOX, corresponding to the bottom quartile of stock market value distribution of the sample in each period. US is an indicator for acquisitions of targets primarily listed in the United States. After is an indicator for acquisitions announced after July 31, 2002. Quarter fixed effects are based on the quarter and year in which the acquisition is announced. Significance (p-value): * 10%, ** 5%, *** 1%.
Definition of Small
Market Value in Bottom Quartile by
Country
Market Value in Bottom Quartile by Country, Defined
Pre/Post-SOXSeparately
Market Value in Bottom Quartile (<$16 Million)
Market Value in Bottom Quartile, Defined Pre/Post-SOX Separately
(<$20/$13 Million) (1) (2) (3) (4)
Acquisitions of small targets US × After + US × After × Small 0.37*** 0.50*** 0.30** 0.45***
(0.00) (0.00) (0.02) (0.00) Acquisitions of large targets US × After –0.09 –0.07 –0.08 –0.06
(0.17) (0.30) (0.19) (0.34)
Number of observations 3089 3089 3089 3089

34
C. Controlling for the Availability of Private Equity
As a final robustness check, we investigate whether our results are driven by an
increase in the availability of private equity capital in the United States relative to other
countries after the enactment of SOX. We do so by examining whether post-SOX private
acquirers in the United States gravitate towards public targets and away from private targets.
Even if post-SOX private equity capital became more available in the United States, the
additional funds could be invested in public targets and private targets in the same proportions
as pre-SOX. An increase in the ratio of public target acquisitions would imply an increase in
the appeal of going-private transactions as an investment outlet in the United States.
Accordingly, we estimate for a sample of domestic acquisitions by private acquirers a
variation of the regression model reported in Table 4 in which the dependent variable is an
indicator for acquisitions of public targets, rather than private ones. We determine a public
target’s nation by its stock exchange, and a private target’s by its headquarters. Based on our
earlier finding that the SOX effect was strongest in the first year following the enactment of
SOX, we include only acquisitions announced in that period.
Table 9 reports the results. Column (1) presents the results we obtain when defining a
target as small if its CPI-adjusted stock market value four weeks before the acquisition is
announced was less than the bottom quartile of the market distribution in its primary stock
exchange. Column (2) presents the results we obtain when we use the pre-SOX bottom
quartile of the target’s primary stock exchange as a value cutoff for acquisitions announced

35
before the enactment of SOX, and the post-SOX bottom quartile for acquisitions announced
thereafter. In both columns, the difference-in-differences estimates for acquisitions of small
targets are positive. In contrast, the difference-in-differences estimate is insignificant for
acquisitions of large targets. This suggests that the availability of private equity is not the
only driving force behind our earlier finding that small public targets gravitate towards private
acquirers after the enactment of SOX. In terms of economic significance, the coefficients
reported in Column (2) predict a significant increase from 0.24 to 0.33 in the probability of
purchasing a small public target rather than a small private target after the enactment of SOX.
In an unreported regression, we use a sample of small target acquisitions by private
acquirers to examine the longevity of the increase in the probability that private acquirers will
buy public targets. We find that this effect, like the increase in the probability that public
targets will be sold to private acquirers, disappears in the second year after the enactment of
SOX, suggesting that the two effects are related.

36
Table 9: Private Acquirers’ Probability of Acquiring a Public Target for Acquisitions Announced Through June 30, 2003
This table reports the results of estimating a probit model in which the dependent variable is acquiring a public target rather than a private target. All of the acquirers are private. Panel A reports coefficient estimates and, in parentheses, standard errors clustered at the country in which the target has its primary listing. Public targets’ nation is determined by stock exchange, and private targets’ nation is determined by headquarters. Cross-border acquisitions are excluded. Panel B reports difference-in-differences estimates and, in parentheses, the significance (p-value) of these estimates based on Wald tests. US is an indicator for acquisitions of public targets primarily listed in the United States or private targets headquartered in the United States. After is an indicator for acquisitions announced after July 31, 2002. In Column (1), Small is an indicator for acquisitions of targets whose CPI-adjusted stock market value four weeks before the acquisition is announced is in the bottom quartile of stock market value distribution in the target’s primary stock exchange in the sample period. In Column (2), Small is an indicator for acquisitions of targets whose CPI-adjusted stock market value four weeks before the acquisition is announced is in the bottom quartile of the stock market value distribution in the target’s primary stock exchange in the period in which the acquisition is announced (pre-SOX or post-SOX). Unreported regressors include quarter, industry and country fixed effects, and interaction of quarter fixed effects with Small. Significance (p-value): * 10%, ** 5%, *** 1%.
Definition of Small
Std. Error Std. Error
US × After 0.11 (0.13) 0.16 (0.12)US × After × Small 0.21 (0.21) 0.12 (0.18)US –0.92 *** (0.08) –0.47 *** (0.07)Small –0.55 *** (0.13) –0.95 *** (0.24)US × Small 0.26 ** (0.11) 0.25 *** (0.10)
Number of observations 3012 3012
p-value p-valueAcquisitions of small targets US × After + US × After × Small 0.32 ** (0.04) 0.28 ** (0.05)Acquisitions of large targets US × After 0.11 (0.38) 0.16 (0.19)
Coeff. Coeff.
Panel A: Coefficient Estimates
Market Value in Bottom Quartile by Country
Market Value in Bottom Quartile by Country,
Defined Pre/Post-SOX Separately
(1) (2)
Coeff.Coeff.Panel B: Difference-in-Differences Estimates
D. New Sales Hypothesis versus All Sales Hypothesis
Finally, we use two indirect tests to examine which of our hypotheses — the “new
sales hypothesis”, or the “all sales hypothesis” — is generating our results.
37
First, the “new sales hypothesis” predicts that, SOX would increase the number of
public firms for sale and, given a sufficiently dense population of private acquirers, these
firms would in turn attract financial acquirers looking for a bargain, rather than a strategic
match. We test this prediction by estimating the regression model reported in Table 4
separately for financial acquirers and strategic acquirers. We classify an acquirer as a
financial acquirer if its industry is investment-related while the target’s industry is not. This
classification ensures that acquisitions by financial firms for strategic reasons are not
mistakenly classified as acquisitions for financial reasons.
Table 10 presents the results. Column (1) reproduces Column (2) of Table 4. In
Column (2), which excludes financial acquirers, the small target effect disappears. In
contrast, in Column (3), which excludes strategic acquirers, the small target effect becomes
stronger.1 These findings suggest that the “new sales hypothesis” is the driving force behind
our results.
1 In the sample, 34% of 439 American private acquirers, and 35% of 566 foreign private acquirers, are strategic acquirers.

38
Table 10: Probability of Being Acquired by a Private Acquirer
This table reports difference-in-differences estimates obtained from fitting a probit model in which the dependent variable is being acquired by a private acquirer rather than by a public acquirer. Standard errors are clustered at the country in which the target has its primary listing. The significance (p-value) of these estimates based on Wald tests is provided in parentheses. Column (1) reproduces Column (2) of Table 4. Column (2) reports the results of estimating the same specification excluding financial buyers. Column (3) reports the results of estimating the same specification excluding strategic buyers. US is an indicator for acquisitions of targets primarily listed in the United States. Small is an indicator for acquisitions of targets whose CPI-adjusted stock market value four weeks before the acquisition is announced is in the bottom quartile of stock market value distribution in the target’s primary stock exchange in the sample period. After is an indicator for acquisitions announced after July 31, 2002. Quarter fixed effects are based on the quarter and year in which the acquisition is announced. Significance (p-value): * 10%, ** 5%, *** 1%.
Column (2) of Table 4
StrategicAcquirers
FinancialAcquirers
(1) (2) (3)
Acquisitions of small targets US × After + US × After × Small 0.37*** 0.13 2.20***
(0.00) (0.49) (0.00)Acquisitions of large targets US × After –0.09 –0.04 –0.09 (0.17) (0.66) (0.50)
Number of observations 3089 2295 736
Second, we test the “all sales hypothesis” separately. This hypothesis predicts that
post-SOX public acquirers will shy away from acquiring any target that would add to their
SOX costs. This includes not only public targets, which in the period we study were not yet
required to comply, but also private targets, which were never required to comply.2 In
2 In June 2003, the SEC issued rules on the duty to evaluate annually the effectiveness of internal controls over financial reporting. These rules required firms with a minimum float of $75 million and at least one year of financial reporting to comply in their annual reports for fiscal years ending after June 14, 2004, and
39
contrast, the “new sales hypothesis” predicts that SOX will affect the acquisition market only
by pushing public targets to go private, and will have no effect on private target acquisitions.
In other words, while the “new sales hypothesis” predicts an increase in the number of public
targets selling, with the new sales attracting private acquirers, the “all sales hypothesis”
predicts a decrease in the number of public acquirers buying any target.
We test this prediction by estimating the regression model reported in Table 4 for a
sample of acquisitions of private targets. Because our focus is the acquirer’s decision, we
determine whether the acquisition creates SOX obligations based on the acquirer’s nation,
rather than the target’s. We determine public acquirers’ nation by their primary stock
exchange, and private acquirers’ nation by their headquarters.
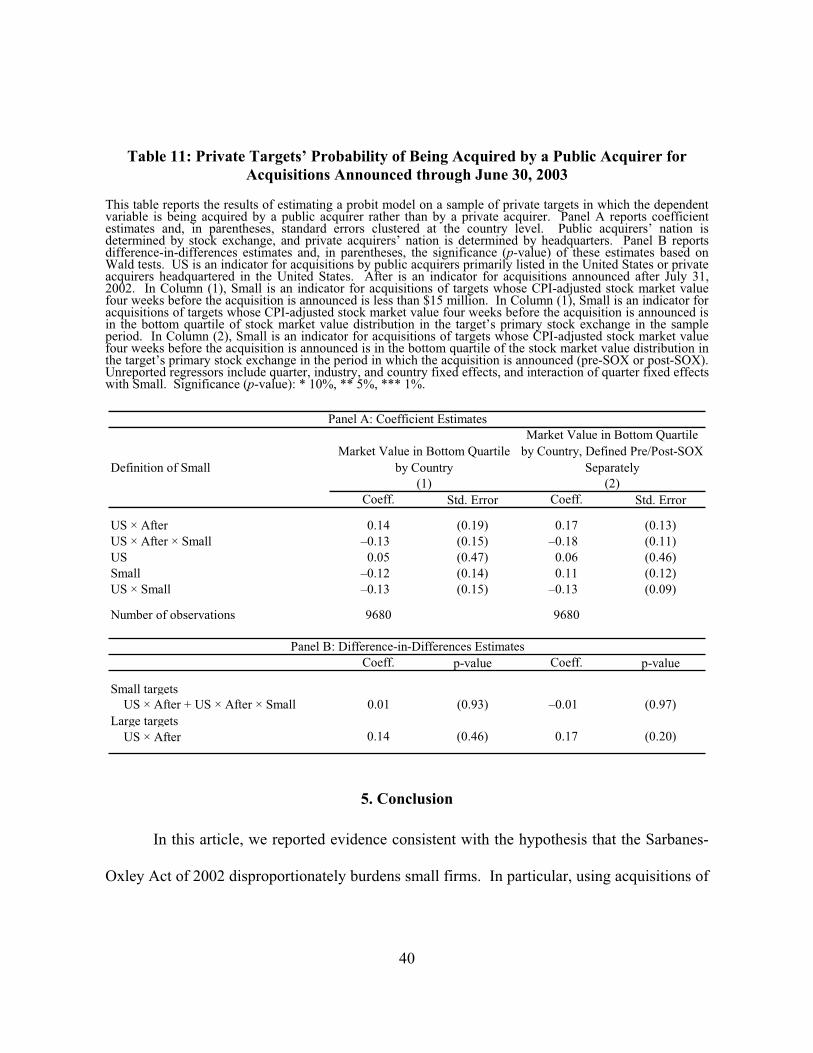
Table 11 reports the results. Columns (1) and (2) differ only in the definition of a
small target. There is no evidence that a private target’s probability of acquisition by a public
acquirer rather than a private one decreases after the enactment of SOX. These findings, like
the ones in Table 10, suggest that the “new sales hypothesis” is the driving force behind our
results.
required other firms to comply for fiscal years ending after April 14, 2005. Both deadlines were subsequently postponed.
40
Table 11: Private Targets’ Probability of Being Acquired by a Public Acquirer for Acquisitions Announced through June 30, 2003
This table reports the results of estimating a probit model on a sample of private targets in which the dependent variable is being acquired by a public acquirer rather than by a private acquirer. Panel A reports coefficient estimates and, in parentheses, standard errors clustered at the country level. Public acquirers’ nation is determined by stock exchange, and private acquirers’ nation is determined by headquarters. Panel B reports difference-in-differences estimates and, in parentheses, the significance (p-value) of these estimates based on Wald tests. US is an indicator for acquisitions by public acquirers primarily listed in the United States or private acquirers headquartered in the United States. After is an indicator for acquisitions announced after July 31, 2002. In Column (1), Small is an indicator for acquisitions of targets whose CPI-adjusted stock market value four weeks before the acquisition is announced is less than $15 million. In Column (1), Small is an indicator for acquisitions of targets whose CPI-adjusted stock market value four weeks before the acquisition is announced is in the bottom quartile of stock market value distribution in the target’s primary stock exchange in the sample period. In Column (2), Small is an indicator for acquisitions of targets whose CPI-adjusted stock market value four weeks before the acquisition is announced is in the bottom quartile of the stock market value distribution in the target’s primary stock exchange in the period in which the acquisition is announced (pre-SOX or post-SOX). Unreported regressors include quarter, industry, and country fixed effects, and interaction of quarter fixed effects with Small. Significance (p-value): * 10%, ** 5%, *** 1%.
Definition of Small
Std. Error Std. Error
US × After 0.14 (0.19) 0.17 (0.13)US × After × Small –0.13 (0.15) –0.18 (0.11)US 0.05 (0.47) 0.06 (0.46)Small –0.12 (0.14) 0.11 (0.12)US × Small –0.13 (0.15) –0.13 (0.09)
Number of observations
p-value p-value
Small targets US × After + US × After × Small 0.01 (0.93) –0.01 (0.97)Large targets US × After 0.14 (0.46) 0.17 (0.20)
Panel A: Coefficient Estimates
Panel B: Difference-in-Differences Estimates
Market Value in Bottom Quartile by Country
Market Value in Bottom Quartile by Country, Defined Pre/Post-SOX
Separately(1) (2)
Coeff.Coeff.
Coeff. Coeff.
9680 9680
5. Conclusion
In this article, we reported evidence consistent with the hypothesis that the Sarbanes-
Oxley Act of 2002 disproportionately burdens small firms. In particular, using acquisitions of
41
foreign targets as a control group, we have found that the propensity of small public American
targets to be acquired by private acquirers rather than public ones increased substantially in
the first year after enactment of SOX. In contrast, we did not found a similar effect for large
targets. These results were robust in a number of alternative specifications.
We offered two interpretations of these findings. According to the “new sales
hypothesis,” the enactment of SOX induced small firms to be sold. The acquirers of these
firms, in turn, tended to be financial acquirers for reasons unrelated to SOX. According to the
“all sales hypothesis,” SOX reduced the price that public acquirers would be willing to pay in
an acquisition because they inherit any firm-specific compliance costs associated with the
target. These compliance costs are relatively higher for smaller targets. We found more
evidence in favor of the “new sales hypothesis”.
To be sure, our findings do not answer all of the questions that need to be answered
for evaluating SOX. First, the exodus of small firms from the public capital market would be
a blessing if the departing firms were prone to the type of financial fraud that SOX seeks to
limit. Second, even if SOX burdened small firms with no connection to the integrity of their
financial statements, it could benefit firms that remained public enough to justify this cost.
Finally, the experience that market participants have continued to develop in complying with
SOX and the steps that regulators have taken to clarify its requirements may have lowered the
costs below their level in the period we study. This article sheds light on an important piece
of this puzzle.
42
References
Aquila, Frank, and Jeff Golden. 2002. “M&A Due Diligence in the Wake of Recent Events,”
M&A Lawyer, September, 1–7.
Arellano, Manuel, and Stephen Bond. 1991. “Some Tests of Specification for Panel Data:
Monte Carlo Evidence and an Application to Employment Equations,” 58 Review of
Economic Studies 277–297.
Athey Susan, and Scott Stern. 2002. “The Impact of Information Technology on Emergency
Health Care Reforms,” 33 RAND Journal of Economics 399–432.
Baker, George P., and Karen H. Wruck. 1990. “Organizational Changes and Value Creation
in Leveraged Buyouts: The Case of O.M. Scott & Sons Company,” 25 Journal of
Financial Economics 163–190.
Benninga, Simon, Mark Helmantel, and Oded Sarig. 2005. “The Timing of Initial Public
Offerings,” 75 Journal of Financial Economics 115–132.
Bertrand, Marianne, Esther Duflo, and Sendhil Mullainathan. 2004. “How Much Should We
Trust Differences-in-Differences Estimates?,” 119 Quarterly Journal of Economics
249–275.
Bertrand, Marianne, and Sendhil Mullainathan. 1999. “Is There Discretion in Wage Setting?
A Test Using Takeover Legislation,” 30 RAND Journal of Economics 535–554.
Block, Stanley B. 2004. “The Latest Movement to Going Private: An Empirical Study,” 14
Journal of Applied Finance 36–44.
Carney, William J. 2006. “The Costs of Being Public After Sarbanes-Oxley: The Irony of
43
“Going Private”,” 55 Emory Law Journal 141–160.
Chhaochharia, Vidhi, and Yaniv Grinstein. 2007. “Corporate Governance and Firm Value:
The Impact of the 2002 Governance Rules,” 62 Journal of Finance 1789–1825.
Coates, John C. IV. 2007. “The Goals and Promise of the Sarbanes-Oxley Act,” 21 Journal of
Economic Perspectives 91–116.
Cohen, Daniel A., Aiyesha Dey, and Thomas Z. Lys. 2007. “The Sarbanes-Oxley Act of
2002: Implications for Compensation Structure and Risk-Taking Incentives of CEOs,”
Working paper, New York University.
Cohen, Daniel A., Aiyesha Dey, and Thomas Z. Lys. 2008. “Real and Accrual-Based
Earnings Management in the Pre- and Post-Sarbanes Oxley Periods,” Accounting
Review, forthcoming.
Cunningham, Lawrence A. 2003. “The Sarbanes-Oxley Yawn: Heavy Rhetoric, Light Reform
(and It Just Might Work),” 35 Connecticut Law Review, 915–988.
Donohue, John J., III, James J. Heckman, and Petra E. Dodd. 2002. “The Schooling of
Southern Blacks: The Roles of Legal Activism and Private Philanthropy, 1910–1960,”
117 Quarterly Journal of Economics 225–268.
Doyle, Jeffrey T., Weili Ge, and Sarah E. McVay., 2007. “Determinants of Weaknesses in
Internal Control Over Financial Reporting,” 44 Journal of Accounting and Economics
193–223.
The Economist Magazine. 2003. “A (Going) Private Matter,” March 22.
Eldridge, Susan W., and Burch T. Kealey. 2005. “Descriptive Evidence on SOX Audit
Costs,” 5 Journal of Accounting, Ethics & Public Policy 343–373.

44
Engel, Ellen, Rachel M. Hayes, and Xue Wang. 2007. “The Sarbanes-Oxley Act and Firms’
Going-Private Decisions,” 44 Journal of Accounting and Economics 116–145.
Financial Services Authority. The Combined Code on Corporate Governance, July 2003.
Glover, Stephen I., and Lindsay B. Krause. 2004. “The Impact of Sarbanes-Oxley’s Internal
Control Rules on M&A Transactions,” M&A Lawyer, February, 1–8.
Gordon, Jeffrey N. 2003. “Governance Failures of the Enron Board and the New Information
Order of Sarbanes-Oxley,” 35 Connecticut Law Review 1125–1143.
Gruber, Jonathan. 2000. “Disability Insurance Benefits and Labor Supply,” 108 Journal of
Political Economy 1162–1183.
Holmstrom, Bengt, and Steven N. Kaplan. 2003. “The State of U.S. Corporate Governance:
What’s Right and What’s Wrong?,” 15 Journal of Applied Corporate Finance 8–20.
Holstein, William J. 2004. “The Very Big Business of Private Equity,” New York Times, May
23, Section 3, 11.
Jain, Pankaj K., Jang-Chul Kim, and Zabihollah Rezaee. 2008. “The Sarbanes-Oxley Act of
2002 and Market Liquidity,” Financial Review, forthcoming.
Jain, Pankaj K., and Zabihollah Rezaee. 2006. “The Sarbanes-Oxley Act of 2002 and Capital-
Market Behavior: Early Evidence,” 23 Contemporary Accounting Research 629–654.
Jensen, Michael C. 1989. “Eclipse of the Public Corporation,” Harvard Business Review
September–October, 61–74.
Kamar, Ehud, Pinar Karaca-Mandic, and Eric Talley. 2007. Sarbanes-Oxley and Small Firms:
What Is the Evidence?, in S.M. Gates & K. Leuschner, eds., In the Name of
Entrepreneurship? The Logic and Effects of Special Regulatory Treatment for
45
Small Business. Santa Monica, CA: RAND.
Kaplan, Steven. 1989a. “The Effects of Management Buyouts on Operating Performance and
Value,” 24 Journal of Financial Economics 217–254.
———. 1989b. “Management Buyouts: Evidence on Taxes as a Source of Value,” 44 Journal
of Finance 611–632.
Klingsberg, Ethan, and Marie Noble. 2004. “SOX 404-Mania: Y2K Déjà Vu, Myths, Risks
and What It All Means for M&A,” M&A Lawyer, September, 1–7.
Leuz, Christian, Alexander J. Triantis, and Tracy Yue Wang. 2008. “Why Do Firms Go Dark?
Causes and Economic Consequences of Voluntary SEC Deregistrations,” Journal of
Accounting and Economics, forthcoming.
Li, Haidan, Morton Pincus, and Sonja O. Rego. 2008. “Market Reaction to Events
Surrounding the Sarbanes-Oxley Act of 2002 and Earnings Management,” Journal of
Law and Economics, forthcoming.
Lichtenberg, Frank R., and Donald Siegel. 1990. “The Effect of Leveraged Buyouts on
Productivity and Related Aspects of Firm Behavior,” 27 Journal of Financial
Economics 165–194.
Litvak, Kate. 2007a. “The Effect of the Sarbanes-Oxley Act on Non-US Companies Cross-
Listed in the US,” 13 Journal of Corporate Finance 195–228.
Litvak, Kate. 2007b. “Sarbanes-Oxley and the Cross-Listing Premium,” 105 Michigan Law
Review 1857–1898.
MacFadyen, Ken. 2002. “Long Awaited Deal Flood Hits in Q3,” Buyouts, October 7, 1.
———. 2003. “Deal Flow Surges Forward with Q4 Splash: Fourth Quarter Deals Push
46
Year-End Volume to $42 billion,” Buyouts, January 6, 1
———. 2004. “The Deals Just Keep Coming and Coming,” Buyouts, July 12, 1.
Maupin, Rebekah J., Clinton M. Bidwell, and Alan K. Ortegren. 1984. “An Empirical
Investigation of Publicly-Quoted Corporations which Change to Closely-Held
Ownership through Management Buyouts,” 11 Journal of Business Finance &
Accounting 435–450.
Pagano, Marco, Fabio Panetta, and Luigi Zingales. 1998. Why Do Companies Go Public? An
Empirical Analysis,” 53 Journal of Finance 27–64.
Pagano, Marco, and Ailsa Röell. 1998. “The Choice of Stock ownership Structures: Agency
Costs, Monitoring, and the Decision to Go Public,” 113 Quarterly Journal of
Economics 187–225.
Ribstein, Larry E. 2002. “Market vs. Regulatory Responses to Corporate Fraud: A critique of
the Sarbanes-Oxley Act of 2002,” 28 Journal of Corporation Law 1–67.
Romano, Roberta. 2005. “The Sarbanes–Oxley Act and the Making of Quack Corporate
Governance,” 114 Yale Law Journal 1521–1611.
Advisory Committee on Smaller Public Companies. 2006. “Final Report to the United States
Securities and Exchange Commission,” http://www.sec.gov/info/smallbus/acspc/
acspc-finalreport.pdf.
Smith, Abbie J. 1990. “Corporate Ownership Structure and Performance: The Case of
Management Buyouts,” 27 Journal of Financial Economics 143–164.
Solomon, Deborah. 2005. “Small Firms to Get another Extension on Sarbanes Rule,” Wall
Street Journal, September 13, A2.
47
Wall Street Journal. 2005. “SOX and Stocks,” April 19, A20.
Walton, Leigh, and Joel I. Greenberg. 2003. “The Impact of Sarbanes–Oxley on Merger &
Acquisition Practices,” M&A Lawyer, June, 6–15.
Wintoki, M. Babajide. 2007. “Corporate Boards and Regulation: The Effect of the Sarbanes–
Oxley Act and the Exchange Listing Requirements on Firm Value,” 13 Journal of
Corporate Finance 229–250.
Whoriskey, Neil. 2005. “Taking Foreign Issuers Private,” M&A Lawyer, May, 13–19.
Wooldridge, Jeffrey M. 2002. Econometric Analysis of Cross Section and Panel Data.
Cambridge: MIT Press.
Zhang, Ivy Xiying. 2007. “Economic Consequences of the Sarbanes–Oxley Act of 2002,” 44
Journal of Accounting and Economics 74–115.

48
Appendix
Below we model the effect of regulatory shocks like the Sarbanes-Oxley Act of 2002
(SOX) on the probability that public firms will be sold and the probability that acquirers of
public firms will be private. In our model, the enactment of SOX can increase or decrease
each of three components of the net cost of being public: a net fixed regulatory cost that any
firm faces notwithstanding its specific attributes, a net fixed regulatory cost that is specific to
the attributes of the firm, and a net variable cost that varies by firm size. We generate three
hypotheses:
More Sales Hypothesis: If SOX was associated with an increase in the net fixed cost,
the net firm-specific cost, or net the variable cost (or decreased the net fixed cost, the net firm-
specific benefit, or the net variable benefit) of being public, more public firms would be sold
than in the absence of SOX.
All Sales Hypothesis: If SOX was associated with an increase in the net firm-specific
cost or the net variable cost (or decreased the net firm-specific benefit or the net variable
benefit) of being public, public firms pursuing a sale would be more likely to be acquired by
private acquirers.
New Sales Hypothesis: Any new sales triggered by SOX (through either the More
Sales or All Sales hypotheses) are more likely to involve financial acquirers, which are
usually private, than other acquirers.
We further show that, if the net variable cost of being public is decreasing in
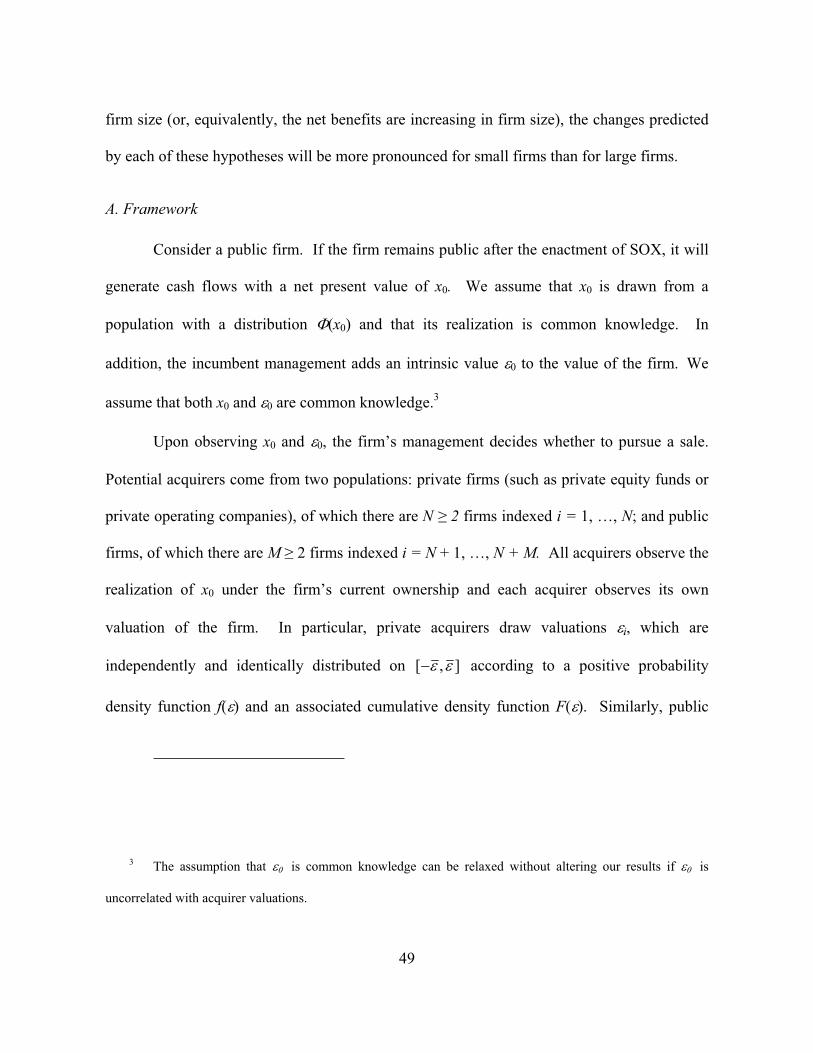
49
firm size (or, equivalently, the net benefits are increasing in firm size), the changes predicted
by each of these hypotheses will be more pronounced for small firms than for large firms.
A. Framework
Consider a public firm. If the firm remains public after the enactment of SOX, it will
generate cash flows with a net present value of x0. We assume that x0 is drawn from a
population with a distribution (x0) and that its realization is common knowledge. In
addition, the incumbent management adds an intrinsic value to the value of the firm We
assume that both x0 and are common knowledge.
Upon observing x0 and the firm’s management decides whether to pursue a sale.
Potential acquirers come from two populations: private firms (such as private equity funds or
private operating companies), of which there are N 2 firms indexed i = 1, …, N; and public
firms, of which there are M 2 firms indexed i = N + 1, …, N + M. All acquirers observe the
realization of x0 under the firm’s current ownership and each acquirer observes its own
valuation of the firm. In particular, private acquirers draw valuations i, which are
independently and identically distributed on ],[ according to a positive probability
density function f ) and an associated cumulative density function F . Similarly, public
3 The assumption that is common knowledge can be relaxed without altering our results if is
uncorrelated with acquirer valuations.
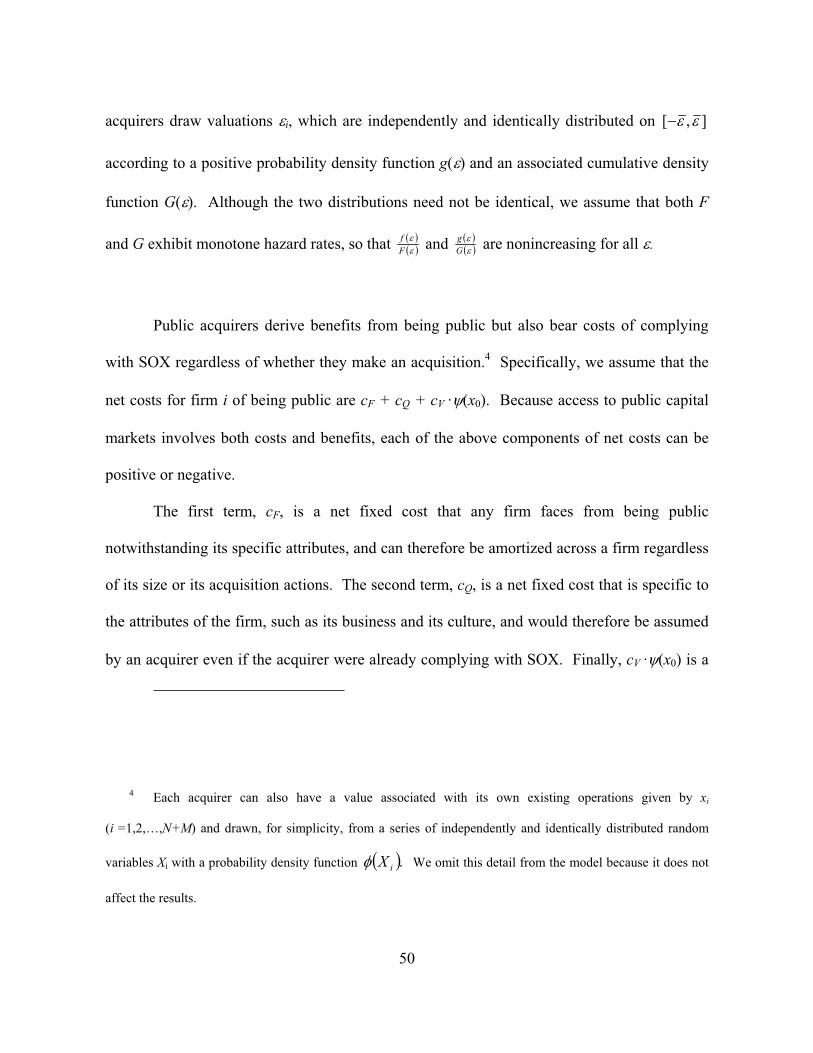
50
acquirers draw valuations i, which are independently and identically distributed on ],[
according to a positive probability density function g( ) and an associated cumulative density
function G( ). Although the two distributions need not be identical, we assume that both F
and G exhibit monotone hazard rates, so that Ff and G
g are nonincreasing for all .
Public acquirers derive benefits from being public but also bear costs of complying
with SOX regardless of whether they make an acquisition.4 Specifically, we assume that the
net costs for firm i of being public are cF + cQ + cV · (x0). Because access to public capital
markets involves both costs and benefits, each of the above components of net costs can be
positive or negative.
The first term, cF, is a net fixed cost that any firm faces from being public
notwithstanding its specific attributes, and can therefore be amortized across a firm regardless
of its size or its acquisition actions. The second term, cQ, is a net fixed cost that is specific to
the attributes of the firm, such as its business and its culture, and would therefore be assumed
by an acquirer even if the acquirer were already complying with SOX. Finally, cV · (x0) is a
4 Each acquirer can also have a value associated with its own existing operations given by xi
(i =1,2,…,N+M) and drawn, for simplicity, from a series of independently and identically distributed random
variables Xi with a probability density function .iX We omit this detail from the model because it does not
affect the results.

51
net cost that varies by firm size and is scaled by the parameter cV 0. A positive shock to cV
will increase this net cost for firms with (x0) > 0 and decrease it for firms with (x0) < 0.
Because larger firms attract more attention in the public capital market, they reap higher
benefits from being public. They also enjoy scale economies in compliance. We therefore
conjecture that '(x0) < 0 in the relevant range. This conjecture is not needed for the model;
however, as we explain in Section V below, it can yield a prediction that small firms and large
firms will react differently to SOX.5
The firm’s management chooses whether to pursue a sale. Pursuing a sale requires a
fixed cost k, which is commonly known at the time of this decision but is distributed ex ante
on [0, ) according to a probability density function (k) and an associated cumulative density
function (k). Should management opt to sell, it will conduct a second-price auction and
select a single reservation price s below which it will not sell.6
5 For simplicity, we assume that a firm’s variable net cost is additively separable from that of any firm
that might acquire it. Thus, if acquirer j of size xj acquires firm i of size xi, the post-acquisition variable cost of
the combined entity equals )).()(( ijv xxc Relaxing this assumption is possible, but would
6 Vickrey, William W. 1962. Auction and bidding games, in Recent Advances in Game Theory.
Princeton, NJ; Princeton University Conference. This assumption is tantamount to allowing the firm to bid for
itself with a publicly revealed bid. A uniform reservation price is suboptimal when acquirers are heterogeneous,
but state law requires firms to treat acquirers evenhandedly. See Revlon, Inc. v. McAndrews & Forbes Holdings,

52
B. Payoffs
We begin by presenting the payoffs of the players. Consider first the firm’s
management, which for simplicity is assumed to be identified with shareholders. Once
management observes x0 and , it updates its expected valuation of the firm. If it decides to
keep the firm independent, it will realize a payoff vNA given by
.000 xcccxv VQFNA
If management chooses to pursue a sale, it will cause the firm to expend k and will
have a reservation value (i.e., if it fails to obtain its reservation price) of:
.000 xccckxkvv
VQF
NAA
Note that in either case, the firm management’s reservation value decreases in the net
cost of being public. Management will pursue a sale only if it expects a price vA sufficiently
high to compensate for the sale cost k. Such an assessment depends on the equilibrium of the
Inc., 506 A.2d 173 (Del. 1986); Paramount Communications, Inc. v. QVC Network, Inc., 637 A.2d 34 (Del.
1994).
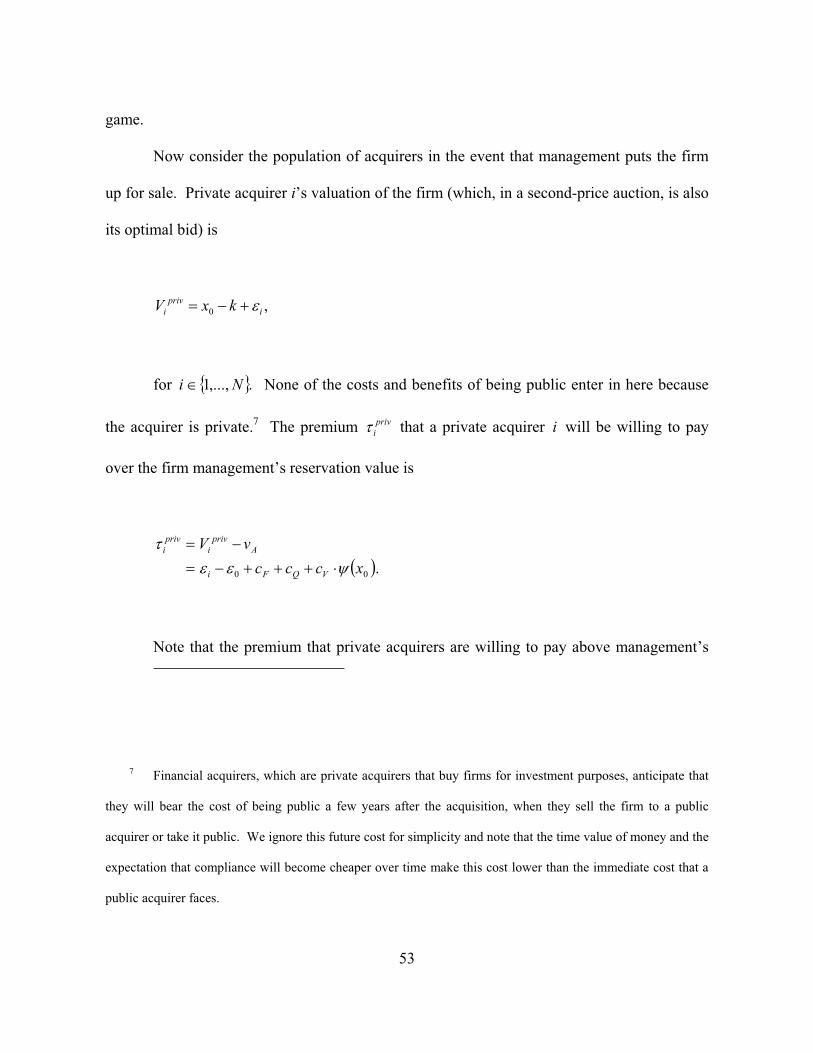
53
game.
Now consider the population of acquirers in the event that management puts the firm
up for sale. Private acquirer i’s valuation of the firm (which, in a second-price auction, is also
its optimal bid) is
,0 ipriv
i kxV
for .,...,1 Ni None of the costs and benefits of being public enter in here because
the acquirer is private.7 The premium privi that a private acquirer i will be willing to pay
over the firm management’s reservation value is
.00 xcccvV
VQFi
Apriv
ipriv
i
Note that the premium that private acquirers are willing to pay above management’s
7 Financial acquirers, which are private acquirers that buy firms for investment purposes, anticipate that
they will bear the cost of being public a few years after the acquisition, when they sell the firm to a public
acquirer or take it public. We ignore this future cost for simplicity and note that the time value of money and the
expectation that compliance will become cheaper over time make this cost lower than the immediate cost that a
public acquirer faces.
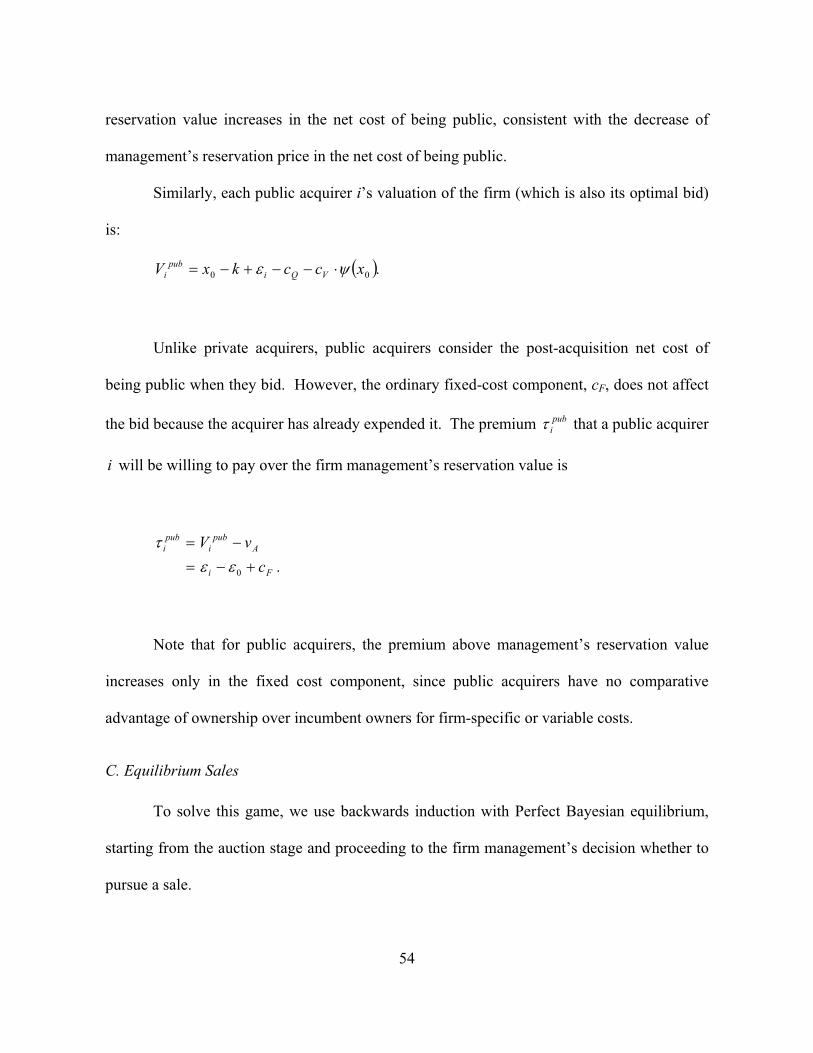
54
reservation value increases in the net cost of being public, consistent with the decrease of
management’s reservation price in the net cost of being public.
Similarly, each public acquirer i’s valuation of the firm (which is also its optimal bid)
is:
.00 xcckxV VQipub
i
Unlike private acquirers, public acquirers consider the post-acquisition net cost of
being public when they bid. However, the ordinary fixed-cost component, cF, does not affect
the bid because the acquirer has already expended it. The premium pubi that a public acquirer
i will be willing to pay over the firm management’s reservation value is
.0 Fi
Apub
ipub
i
cvV
Note that for public acquirers, the premium above management’s reservation value
increases only in the fixed cost component, since public acquirers have no comparative
advantage of ownership over incumbent owners for firm-specific or variable costs.
C. Equilibrium Sales
To solve this game, we use backwards induction with Perfect Bayesian equilibrium,
starting from the auction stage and proceeding to the firm management’s decision whether to
pursue a sale.

55
Because the sale is a second-price auction, all acquirers reveal their true valuations
and this revelation determines whether they win the auction, but not how much they pay. In
contrast, as the section below will demonstrate, the firm’s management will select a
reservation price s* above its reservation value Av .
Letk
denote the k-th order statistic of the set of the premia offered in the auction —
that is, the k-th highest bid premium over Av (either public or private), where
MNk ,...2,1 . Similarly, let .kh and .kH denote, respectively, the probability
density function and the cumulative density function of .k Once the firm’s management
decides to pursue a sale, it sets a reservation price to maximize — given the bidding strategies
of the acquirers — its expected gains from the auction. Analysis of this problem yields the
following result:
Lemma 1: In the event of an auction, the firm’s management will optimally set a
reservation price ,1
12
shsHsH
Avs which strictly exceeds vA.
Proof: It is convenient to redefine the reservation price in terms of a reservation
premium , where = s – vA. In the event of a sale, the premium will equal to the maximum
of
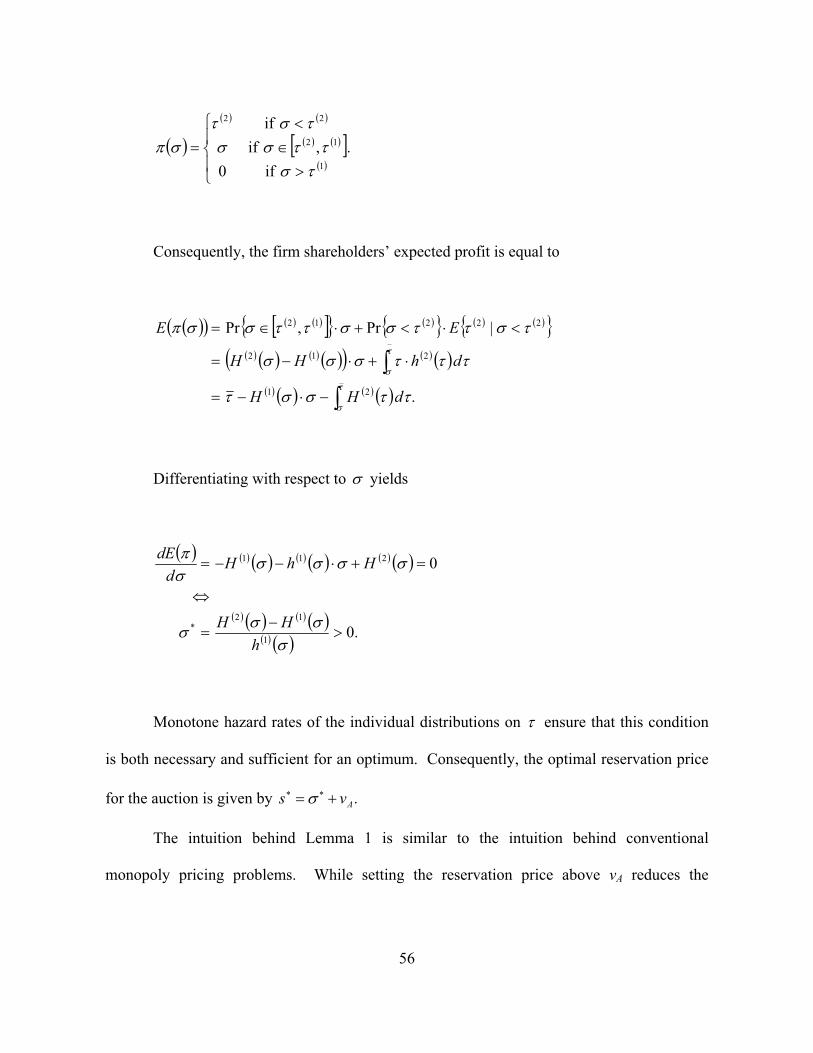
56
. if0
, if if
1
12
22
Consequently, the firm shareholders’ expected profit is equal to
.
|Pr,Pr
21
212
22212
dHH
dhHH
EE
Differentiating with respect to yields
.0
0
1
12*
211
hHH
HhHd
dE
Monotone hazard rates of the individual distributions on ensure that this condition
is both necessary and sufficient for an optimum. Consequently, the optimal reservation price
for the auction is given by .Avs
The intuition behind Lemma 1 is similar to the intuition behind conventional
monopoly pricing problems. While setting the reservation price above vA reduces the

57
probability of a sale if the highest valuing acquirer values the firm below this price, it allows
the firm to collect a higher premium when the highest valuation exceeds vA but the second-
highest valuation does not.
The firm’s management will pursue a sale if the price it expects justifies the cost of
conducting the sale. This observation yields the following propositions:
Proposition 1: The equilibrium probability that the firm’s management will pursue a
sale is strictly increasing in cF and cQ, strictly decreasing in 0 , and — if and only if 0x is
positive (negative) — strictly increasing (decreasing) in cV.
Proof: Consider an increase in an arbitrary parameter z. Applying the envelope
theorem to the maximized value of the firm management’s expected profit, we see that, for
any parameter z,
.21
ddz
dHdz
dHdZ
dE
In terms of the parameters of the model, note that
211 MN GFH
and that

58
,1
1
1
2112
21
11
21
21
1211
212
GFMNMFNGGF
GGFM
FGFNGFH
MN
MN
MN
MN
where
.02
001
F
VQF
cxccc
Note that both 1H and 2H are strictly increasing in .1 and ,.2 so that
.2
2
21
1
22
2
11
1
1
ss
ss
ddz
dd
dHdzd
ddHs
dzd
dsdHs
dzd
dsdH
dzdE
Finally, it is clear that both .1 and .2 are strictly increasing in 0 and strictly
decreasing in cF . Moreover, 1 is strictly decreasing in cQ and — if and only if 0.
— strictly decreasing in cV. These observations yield the result stated in the proposition.

59
Proposition 2: The equilibrium probability that the firm will actually be sold is
strictly increasing in cF and cQ, strictly decreasing in 0 , and — if and only if 0x is
positive (negative) — strictly increasing (decreasing) in cV.
Proof: As noted above, the probability that the firm’s management will pursue a sale
is .Pr EkE Because k and all of the i ’s are independent, the
distribution of the highest premium conditional on an auction, ,|1 EkH is equal
to the unconditional distribution .1H Therefore, conditional on an auction, the probability
that the firm will be sold is equal to the unconditional probability that the highest premium
offered will exceed , or
.11
21
1
MN GFH
Differentiating this expression with respect to VQF ccc ,, , and 0 yields the result
stated in the proposition.
Propositions 1 and 2 formalize the “more sales hypothesis” articulated in the
introduction. They state that an increase in any cost component will raise the probability of
an auction and the probability of an ultimate sale. The reason is that a sale to any acquirer
allows the firm to avoid the fixed cost Fc , and a sale to a private acquirer allows the firm to
avoid the firm-specific cost Qc and the variable cost Vc .

60
It is helpful to think of the marginal firm, whose management is indifferent between
pursuing a sale and keeping the firm independent. Let k denote this firm’s k. The corollary
below follows:
Corollary 1: The critical value k characterizing the marginal firm is strictly
increasing in Fc and ,Qc strictly decreasing in 0 , and — if and only if 0x is positive
(negative) — strictly increasing (decreasing) in Vc .
Corollary 1 restates in terms of k the observation that, as the net cost of being public
increases, a higher sale cost will be needed to deter firm managements from pursuing a sale.
D. Equilibrium Identity of the Acquirer
We now examine the probability that, in the event of a sale, the acquirer will be
private. Consider first infra-marginal firms, whose management pursues a sale regardless of
an increase in the net cost of being public. For the following results it is helpful to define
., 00201 xcckxvvvandkxvvv VQ
Proposition 3: The probability that an infra-marginal firm, which pursues a sale
regardless of an increase in the cost of being public, will be sold to a private acquirer rather
than a public one is invariant in Fc , strictly increasing in cQ, and — if and only if 0x is
positive (negative) — strictly increasing (decreasing) in Vc .

61
Proof: Because the error terms are assumed to be independently and identically
distributed, this conditional probability is identical to the unconditional probability that the
highest private acquirer’s valuation exceeds the highest public acquirer’s valuation:
.
|Pr
111
2
1211
dvvvfvvFvvGN
vvdFvvGVV
NM
NMprivpub X
Differentiating the integrand above shows that it is strictly increasing in ..2v
Moreover, .1v is invariant in all of the cost components, and .2v is invariant in cF but is
increasing in cQ, and — if . is positive (negative) — increasing (decreasing) in cV. This
establishes the claim in the proposition.
Proposition 3 formalizes the “all sales hypothesis” articulated in the introduction. It
states that increasing the firm-specific cost or the variable cost of being public skews all sales
toward private acquirers. The intuition is similar to the intuition of Propositions 1 and 2:
Because only private acquirers avoid the firm-specific cost and the variable cost of being
public, private acquirers play a more central role in the acquisitions market as these costs rise.
Consider next marginal firms, whose management pursues a sale only after an increase
in the cost of being public.
Proposition 4: If ,11
1
2
2
1
1vvFvvf
vvGvvg
vvfvvf NM the probability that a marginal
firm, which pursues a sale because of an increase in the cost of being public, will be

62
sold to a private acquirer rather than a public one is strictly increasing in Fc , strictly
increasing in Qc , and — if and only if 0x is positive (negative) — strictly increasing
(decreasing) in Vc .
Proof: The proof turns on showing that X|Pr )1()1(privpub VV is increasing in k. The
reason is that an increase in the cost of being public raises the cutoff k* at which the firm’s
management is indifferent about a sale. When the cost of being public increases, marginal
firms put on sale will have a higher k than infra-marginal firms. Because the probability that
the acquirer is private is increasing in k, these marginal firms will raise the probability that
acquisitions involve private acquirers. Denoting ,111
2 vvfvvFvvGNv NM the
derivative of X|Pr )1()1(privpub VV with respect to k is
.1 11
211
22
211
121
1
1
2
2
dvvvfvvFvvfNvvFvvG
vvgvvfvvFvvGMN
dvdkdv
dvd
dkdv
dvdNdvv
dkd
NM
NM
The condition for the proposition comes from the integrand of the above expression.
If at k* this integrand is strictly positive, the marginal firm will increase the probability that
acquisitions involve private acquirers. Simplifying the integrand we find that it takes on a
strictly positive value whenever:

63
.11
1
2
2
1
1
vvFvvfN
vvGvvgM
vvfvvf
Because k* is strictly increasing in Fc and ,Qc and — if and only if 00x —
strictly increasing in Vc , the proposition follows.
Proposition 4 formalizes the “new sales hypothesis” articulated in the introduction. It
states that firms that are sold in response to the increase in the cost of being public are likely
to be acquired by private acquirers if there is a sufficiently dense population of private
acquirers relative to the population of public acquirers ready to buy firms that pursue a sale to
avoid the cost of complying with SOX. This condition is plausible for financial acquirers,
which buy firms for investment purposes and are therefore more sensitive to price than
strategic acquirers, which buy firms to integrate their operations with their own. While
financial acquirers tend to be private for reasons unrelated to SOX, strategic acquirers can be
either private or public.
While Proposition 4 is narrower than Proposition 3 in that it applies only to sales
triggered by the increase in the cost of being public and only to one type of private acquirers,
it is broader than Proposition 3 in that it predicts an increase in the probability that a sale will
involve a private acquirer even if only the fixed cost of being public increases.
E. Discussion
The framework above provides testable predictions about whether SOX increased or
decreased the net cost of being public. These predictions need not apply uniformly across

64
all industries. First, industries in which the role of incumbent management is significant
should be less affected than other industries. Second, the costs and benefits of SOX need not
be the same within a specific industry because firms differ in size. Indeed, the net variable
cost 0xcV explicitly incorporates size heterogeneity. If, as we conjecture, is
decreasing in ,0x an increase in Vc will affect small firms more than large firms. In fact, a
legal change that increases the net variable cost for small firms can decrease this cost for large
firms.
Top Related