


Languages
Pages
Legal


Glucose Homeostasis
brain has high consumption of glucose– uses ~20% of RMR– 1° fuel for energy
during exercise, working muscle competes with brain for glucose
many redundant systems for maintaining glucose homeostasis– hepatic glucose production (glycogen, lactate,
pyruvate, glycerol, alanine)– pancreatic hormones (insulin, glucagon) – sympathoadrenal stimulation (epinephrine)
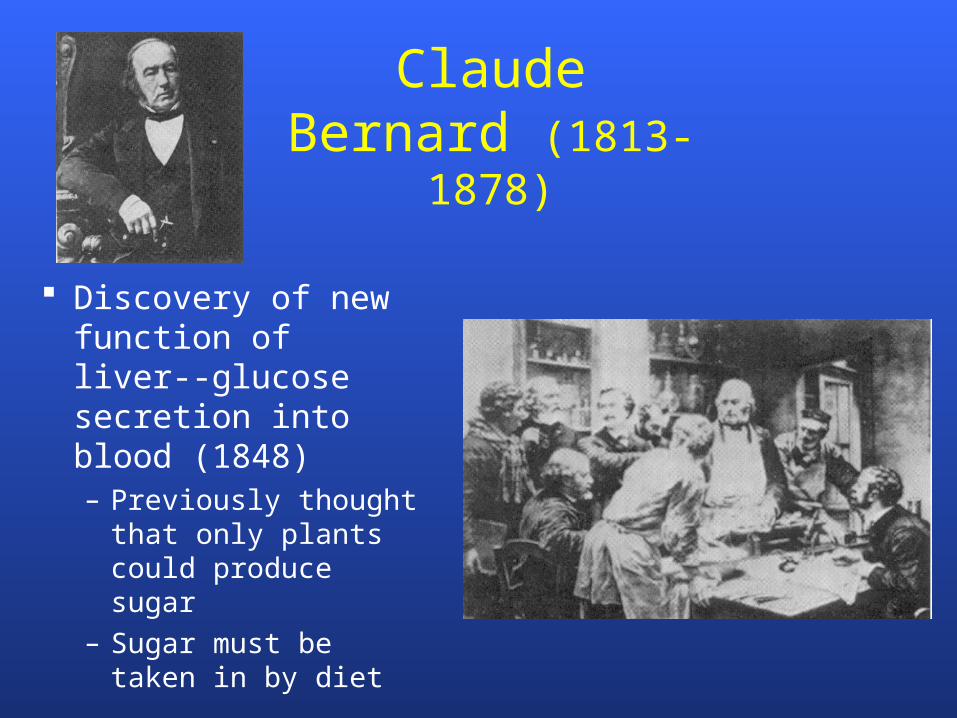
Claude Bernard (1813-1878)
Discovery of new function of liver--glucose secretion into blood (1848)– Previously thought
that only plants could produce sugar
– Sugar must be taken in by diet

Glucose ProductionDuring Exercise

Maintenance of Blood Glucose
glucose needed for CNS, ATP synthesis, Kreb’s cycle intermediates
muscle glucose uptake (Rd) matched by liver glucose release (Ra)– glucose pool = ~5 g (~20 kcal)– dependent upon exercise intensity and duration
endurance exercise may need CHO ingestion to maintain blood [glucose]

Cori Cycle

Liver Gluconeogenesis
uses pyruvate & lactate (Cori cycle), glycerol, and alanine (glucose-alanine cycle) as substrates
liver contains glucose 6-phosphatase and other enzymes that allow reversal of glycolysis and release of glucose

Gluconeogenic amino acids
urea formation from excreted N in amino acid degradation
C skeletons are degraded into:– glucose– ketone acetoacetate or acetyl Co-A
during fasting, starvation, and prolonged exercise, AA supply most of C used in gluconeogenesis– glucose-alanine cycle
AA metabolism contributes 10-15% of total substrates used during exercise

Glucose-alanine cycle
Leucine is 1° BCAA that provides N for alanine formation. This model may not operate when glucose & glycogen is low
leucine

Interrelationship of leucine catabolism and alanine formation
Rate of appearance (Ra) of alanine (a) and leucine N transfer to alanine (b) at rest and during exercise
Wolf et al., 1982, 1984

Regulation of liver glucose output
glucose threshold stimulates liver glucose output– hypoglycemia stimulates hormonal response (EPI,
glucagon, cortisol, GH)– glucose threshold is dynamic
like blood, glucose uptake is shunted to active tissue– skeletal muscle GLUT transporters
• GLUT1 is 1º transporter at rest• GLUT4 is 1º transporter during exercise

Endocrine Regulation of Glucose Homeostasis
Insulin—secreted from pancreatic islet ß cells– released regulated by blood [glucose] (glycemic threshold)– stimulates glucose oxidation & storage and inhibits glucose
production• stimulates glycogen synthase• inhibits phosphorylase• inhibits gluconeogenesis• stimulates glucose transport into adipocytes, which is then
converted into TG• inhibits hormone-sensitive lipase (HPL) ( cAMP) and
lipoprotein lipase• activates GLUT1
– release inhibited by EPI and NE– obesity increases and training decreases insulin secretion

Endocrine Regulation of Glucose Homeostasis
Glucagon—secreted from pancreatic islet cells– promotes liver mobilization of fuels– stimulates cAMP– released regulated by blood [glucose] (glycemic
threshold)– Activates phosphorylase– Stimulates gluconeogenesis

Endocrine Regulation of Glucose Homeostasis
Epinephrine—secreted from adrenal medulla– released in response to exercise and
decreased blood [glucose]• stimulates liver and muscle phosphorylase a
and PFK• increases liver glucose output and muscle
glucose metabolism
Glucose HomeostasisDuring Exercise
Effect of CHO feeding during exercise on glucose homeostasis
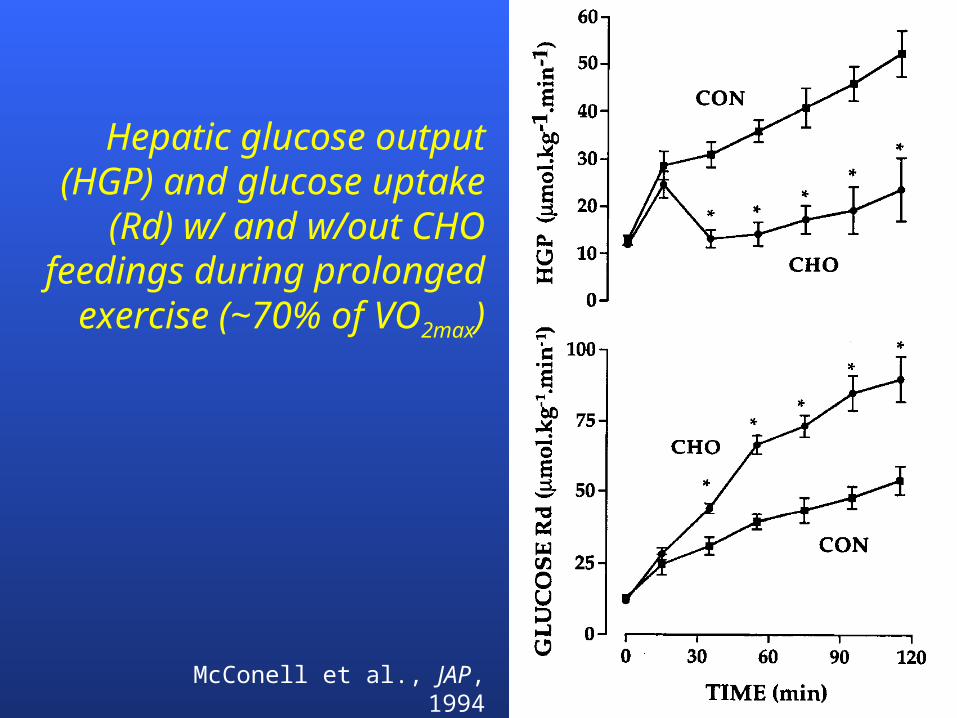
Hepatic glucose output (HGP) and glucose uptake
(Rd) w/ and w/out CHO feedings during prolonged exercise (~70% of VO2max)
McConell et al., JAP, 1994

CHO Feeding during Prolonged Exercise
blood glucose maintains CHO oxidation rate time to exhaustion/performance conserves liver glycogen muscle glucose uptake no effect on muscle glycogen utilization
Effects of Prolonged Exercise on Blood Glucose

Muscle Glucose Uptake
0.0
0.5
1.0
1.5
2.0
2.5
3.0
0 30 60 90 120 150 180
Time (min)
Glu
co
se
Up
tak
e (
mm
ol/m
in)

Blood Glucose
0.0
1.0
2.0
3.0
4.0
5.0
6.0
0 30 60 90 120 150 180
Time (min)
Glu
co
se
(m
M)

Liver Glycogen
0
10
20
30
40
50
60
0 30 60 90 120 150 180
Time (min)
Gly
co
ge
n (
g/k
g)

Liver Glucose Output
0.0
0.5
1.0
1.5
2.0
2.5
3.0
3.5
0 30 60 90 120 150 180
Time (min)
Glu
co
se
Ou
tpu
t (m
mo
l/min
)

Blood Glucagon
50
100
150
200
250
300
0 30 60 90 120 150 180
Time (min)
Glu
cag
on
(p
g/m
l)

Blood Insulin
0.4
0.5
0.6
0.7
0.8
0.9
1.0
1.1
1.2
0 30 60 90 120 150 180
Time (min)
Ins
ulin
(u
U/m
l)

Blood Epinephrine
0.0
0.2
0.4
0.6
0.8
1.0
1.2
1.4
1.6
0 30 60 90 120 150 180
Time (min)
Ep
ine
ph
rin
e (
ng
/ml)

Liver glucose output from gluconeogenesis (GNG) and glycogenolysis (GLY) during prolonged exercise at 30% of VO2max
Effect of exercise intensity on liver glucose output

Effects of Incremental Exercise on Blood Glucose
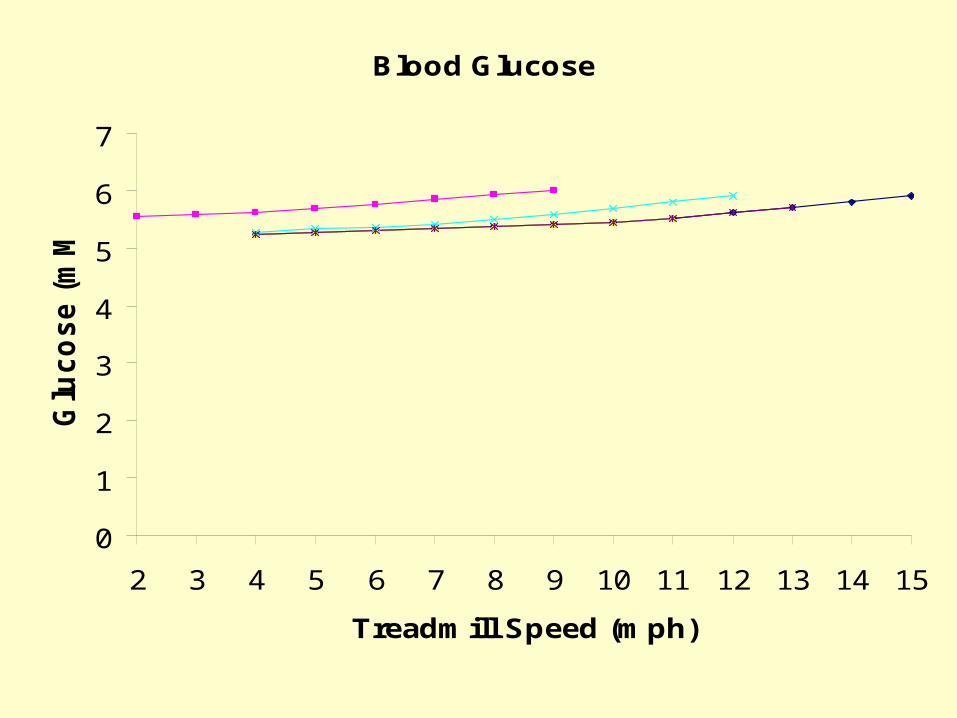
Blood Glucose
0
1
2
3
4
5
6
7
2 3 4 5 6 7 8 9 10 11 12 13 14 15
Treadmill Speed (mph)
Glu
co
se
(m
M)

Blood Epinephrine
0
0.1
0.2
0.3
0.4
0.5
0.6
2 3 4 5 6 7 8 9 10 11 12 13 14 15
Treadmill Speed (mph)
Ep
ine
ph
rin
e (
ng
/ml)

Blood Insulin
0.0
0.2
0.4
0.6
0.8
1.0
1.2
2 3 4 5 6 7 8 9 10 11 12 13 14 15
Treadmill Speed (mph)
Ins
uli
n (
uU
/ml)

Liver glucose output from gluconeogenesis (GNG) and glycogenolysis (GLY) during prolonged exercise at 30% of VO2max
Effect of exercise intensity on liver glucose output

And now a contest:
Why women live longer than men.Why women live
longer than men.

6th place


5th place


4th place


3rd place


2nd place


And the winner is:


...and now, a close runner up


EUROPEAN HUSBAND OF THE YEAR AWARDS

3rd Place goes to: Greece

2nd Place goes to: Serbia

and the winner of the husband of the year is:
Ireland...........

Focus on Research

Scientific Process
What is truth? How is truth determined? Scientific process
– research question & hypothesis– experimental design– data analysis, interpretation, & conclusion– communication of results
• peer-reviewed paper• presentation
Top Related