


Languages
Pages
Legal

Globalizing the Boardroom - The Effects of Foreign Directors on
Corporate Governance and Firm Performance*
Ronald W. Masulis
University of New South Wales
Cong Wang
Chinese University of Hong Kong
Fei Xie
George Mason University
July 12, 2011
Abstract
We examine the benefits and costs associated with foreign independent directors (FIDs) at U.S.
corporations. We find that firms with FIDs make better cross-border acquisitions when the targets
are from the home regions of FIDs. However, FIDs also display poor board meeting attendance
records, and firms with FIDs are more prone to commit intentional financial misreporting and
overpay their CEOs and have lower CEO turnover sensitivity to performance. Finally, firms with
FIDs are associated with significantly poorer performance, especially as their business presence
in the FID’s home region becomes less important.
* We are grateful to the editor, Jerry Zimmerman, and an anonymous referee for suggestions that
significantly improved the paper. We also thank Paul Chaney, Bill Christie, Mara Faccio, Han Kim, Craig
Lewis, Kai Li, Kasper Nielsen, Alex Philipov, Charu Raheja, Hans Stoll, Tracie Woidtke, Jun Yang, David Yermack, and seminar participants at George Mason University, Tilburg University, University of
Tennessee, Vanderbilt University, 2011 AFA annual meeting, 2010 Chinese International Conference in
Finance, the European Financial Management Symposium on Corporate Governance and Control at
Cambridge University, and 2010 FMA annual meeting for many helpful comments. We acknowledge the
financial support from Hong Kong’s Research Grants Council under GRF grant #CUHK455410.
1
I. Introduction
The board of directors is a critical element in a firm’s corporate governance system, and
it has two major functions. One is to hire, fire, and compensate managers, i.e., the monitoring
role, and the other is to advise managers on important strategic decisions, i.e., the advisory role.
How well directors perform these two functions largely determines the effectiveness of boards in
corporate decision making and shareholder value creation.1
In this study, we focus on an interesting class of directors whose unique characteristics
can either enhance board decision making or weaken it. Specifically, we examine foreign
independent directors (FIDs) in U.S. corporations, defined as independent directors domiciled in
foreign countries.2 The geographic location of FIDs is a double-edged sword. As we elaborate
below, FIDs can provide valuable international expertise and advice to firms, especially those
with significant foreign operations or plans for overseas expansion. On the other hand, foreign
independent directors are apt to be less effective in overseeing management than U.S.-based
independent directors and thus, they could weaken a board’s monitoring and disciplining role.
Foreign directors can be less effective monitors for several reasons. First, a director’s
geographic distance from corporate headquarters generates substantial oversight costs, since
making on-site visits and attending board meetings (usually held at corporate headquarters)
become more difficult and time-consuming. This undermines a director’s ability and incentives to
gather information and closely monitor management. Consistent with this view, Lerner (1995)
finds that venture capitalists are reluctant to sit on boards of geographically distant firms, and
Knyazeva, Knyazeva and Masulis (2011) document a significant local component to the matching
1 Boards can perform their monitoring and advising functions simultaneously for certain firm decisions
such as capital budgeting and payout policies (Brickley and Zimmerman (2010)), while for other decisions
such as executive compensation, financial reporting, and CEO retention/dismissal, boards are likely to play
a greater monitoring and disciplinary role. Adams and Ferreira (2007) and Harris and Raviv (2008) develop theories of the dual role of boards, and Boone, Field, Karpoff, and Raheja (2007), Coles, Daniel, and
Naveen (2008), Linck, Netter, and Yang (2008), and Lehn, Patro, and Zhao (2009) provide supporting
empirical evidence. 2 In our definition, FIDs do not have to be foreign nationals and they can be U.S. citizens working or living
in a foreign country, while a foreign national working or living in the U.S. will not qualify as a FID.
2
process of companies and outside director candidates. The obstacles created by distance are even
greater for FIDs, as the time zone differences and time and energy consumed by international
travel, coupled with heightened security concerns post 9/11, are likely to impose heavier burdens
on foreign directors than on domestic directors, further eroding their monitoring incentives and
ability.3 Second, directors who are geographically removed from the vicinity of a firm’s corporate
headquarters are cut off from local networks that provide valuable soft information (Coval and
Moskowitz (1999, 2001)). Located in foreign countries, FIDs have even fewer channels and less
access to current information about the U.S. companies on whose boards they sit, and thus may
be less able to stay well informed about these firms’ current operations and performance. Third,
FIDs are likely to be less familiar with U.S. accounting rules, laws and regulations, governance
standards, and management methods, making it more difficult for them to evaluate managerial
performance or challenge managerial decisions. These considerations suggest that FIDs can often
weaken a board’s monitoring effectiveness, and thus lead to greater agency problems between
managers and shareholders and ultimately poorer firm performance.
Concerns about the incentives and ability of FIDs to oversee management are consistent
with several anecdotes. Before Sir Win Bischoff stepped down as Citigroup’s chairman in
February 2009, some Citigroup directors were considering replacing him as chairman, because
“Sir Win, who is based in London, hasn't been exercising adequate oversight.”4 During the period
of 1997-2001 when Enron committed high profile accounting fraud, its audit committee included
two foreign independent directors, the Chairman of the Hang Lung Group in Hong Kong and a
senior executive of Group Bozano in Brazil, which raises questions about the effectiveness of
FIDs’ monitoring of a firm’s operations and financial reporting. Concerns with FIDs are not
3 In an interview with The Financial Times, Charles King, a managing director of Korn Ferry International
(an executive search firm), comments on the logistical problem of hiring a foreign director-“To get someone to fly to New York for a board meeting six or seven times a year, even from London, takes at least
18 days out of their schedule.” The same concern is also voiced by some companies mentioned in the
aforementioned WSJ article. 4 David Enrich and Robin Sidel, “Citi Directors Mull Replacing Chairman”, The Wall Street Journal,
November 13, 2008.
3
unique to U.S. firms. The Korean Corporate Governance Service highlighted the poor board
meeting attendance record of foreign outside directors of Korean companies over the 2004-2006
period and suggested that “the main reason behind foreigners' low attendance is that most of
them live outside Korea and are unable to fit traveling here for the meeting on their schedule.”5
Despite their monitoring deficiencies, FIDs can enhance the advisory capability of boards
to the extent that living or working in foreign countries gives them first-hand knowledge of
foreign markets and enables them to develop and tap a network of foreign contacts. These
resources can enable FIDs to provide valuable advice and assistance to U.S. corporations,
especially those with major foreign operations or aspirations to expand internationally (Adams,
Hermalin, and Weisbach (2009)).6 With the increasing globalization of virtually all industries and
marketplaces and the rising importance of emerging-market economies, an ever greater number
of U.S. companies are looking beyond their national borders for opportunities to cut costs,
generate growth, and create shareholder value. As companies make initial forays into particular
foreign markets or try to build up their foreign operations, they face unfamiliar political
landscapes, regulatory environments, cultural and social norms, industry structures, and consumer
preferences. For these companies, FIDs’ knowledge of their home countries or regions and their
close connections to local business, social, and political circles can be especially beneficial.7
Given the concomitant benefits and costs associated with FIDs, their net effect on overall
board effectiveness, corporate decision making, and firm performance represents an intriguing
empirical question. Our investigation focuses on the following issues: How prevalent are FIDs on
the boards of U.S. public companies? Which firms are more likely to have FIDs? Are FIDs less
effective monitors than their U.S. based counterparts? Under what circumstances do companies
5 Hyong-Yi Park, “Foreign Outside Directors’ Presence at Board Meetings Low”, The Korea Times, August
13, 2007. 6 This would be consistent with Agrawal and Knoeber’s (2001) finding that firms for which politics and
regulations are more important are more likely to have outside directors with political and legal
background. 7 See for example, Joann S. Lublin, “Globalizing the boardroom”, The Wall Street Journal, October 31,
2005.
4
benefit from having FIDs? Do FIDs strengthen or weaken board effectiveness in handling
specific tasks? What is the overall impact of FIDs on shareholder value and firm performance?
Our examination of the boards of S&P 1500 companies from 1998 to 2006 reveals that
FIDs are present in about 13% of firm-year observations. Conditional on a board having at least
one FID, the percentage of FIDs among all independent directors averages about 18%, equivalent
to one FID in every 5 to 6 independent directors. We first examine specific actions undertaken by
FIDs and some major corporate policies and decisions in which they are involved. These tests aim
to provide insights into the channels through which FIDs impact board effectiveness, shareholder
value and firm performance, and they have the added advantage that they are less susceptible to
alternative casual interpretations that often plague firm performance regressions.
We first explore how FIDs can contribute to firm performance and shareholder value
through their advisory role. Specifically, we examine whether firms with FIDs make better cross-
border acquisitions, as suggested by Adams, Hermalin, and Weisbach (2009). We find that
acquirer announcement-period abnormal returns are significantly higher (by about 2%) in deals
where the acquirer has a FID who is from the same region as the target. This evidence suggests
that FIDs provide region-specific expertise that is valuable to cross-border acquirers in evaluating
targets and assessing deal merits.
We next turn our attention to the monitoring effectiveness of FIDs. Given the importance
of board meetings as a venue for management-director interactions and the availability of public
data on director participation in board meetings (Adams and Ferreira (2009)), we compare the
board meeting attendance records of FIDs with those of domestic independent directors. We find
that everything else being equal, FIDs are almost three times more likely than their domestic
counterparts to miss at least 25% of board meetings, and the difference is statistically significant.
This evidence is consistent with geographical distance and logistical difficulty discouraging FIDs
from attending board meetings, and calls into question the presumption that FIDs can effectively
fulfill their monitoring responsibilities.
5
We then examine the impact of FIDs on the quality of a firm’s accounting disclosure and
CEO compensation policies, two areas that are under the direct purview of corporate boards. Our
analysis shows that firms with FIDs on their boards are significantly more likely to engage in
intentional financial misreporting that requires future restatements, and they are associated with
significantly higher CEO compensation. The greater tendency of FID firms to commit financial
misreporting is more pronounced when FIDs sit on audit committees. The excess CEO
compensation at FID firms is larger when FIDs sit on compensation committees.
In further analysis, we investigate the effect of FIDs on board effectiveness in
disciplining poorly performing CEOs. We find that ceteris paribus, FID presence significantly
reduces the sensitivity of forced CEO turnovers to performance. This result suggests that the
logistical difficulty and information disadvantage confronting FIDs not only reduce their ability
to monitor managers, but also make them less likely to act to remove underperforming managers.
In light of our evidence that FIDs bring both benefits and costs to U.S. firms, we evaluate
their net impact on firm performance and shareholder value. We begin by analyzing the relation
between FID presence and firm operating performance through OLS, firm-fixed effects, and two-
stage least squares (2SLS) regressions. We find that firms with FIDs exhibit significantly lower
returns on assets (ROA), especially when they do not have a significant business presence in their
FID’s home region. This is consistent with the notion that the lax monitoring of CEOs by FIDs
undermines the effectiveness of board oversight and corporate governance in general, resulting in
greater agency problems and lower firm performance. Our results also indicate that FIDs make
increasingly greater contributions to firm performance through their local expertise when FID
home regions become more important to firms in terms of the percentage of total firm sales
accounted for by those regions. We obtain largely similar findings from OLS, firm fixed-effects,
and 2SLS regressions of Tobin’s Q as a measure of firm value.
Finally, we conduct an event study of FID appointment announcements by our sample
firms. We find the stock market reacts negatively to a firm’s decision to appoint a FID; the
6
average 3-day announcement-period abnormal return is -0.56% (two-sided p-value: 0.054), and
the median is -0.46% (two-sided p-value: 0.015). These announcement returns are significantly
lower than those generated by appointments of domestic independent directors, which are
significantly positive at both the mean and median levels.
Our study contributes to the literature on corporate boards and governance by identifying
a new independent director characteristic that affects a board’s ability to monitor and advise
management. We complement earlier studies of board independence and independent director
characteristics by highlighting the importance of a director’s geographic location in relation to
corporate headquarters.8 Our analysis provides evidence that the international expertise of FIDs
benefits firms with substantial foreign operations or firms making cross-border acquisitions.
However, for firms without major operations in the home regions of FIDs, it appears that FIDs’
expected advisory benefits are not large enough to offset the value destroying effect of their
weaker monitoring and disciplinary role. To the extent that FID appointment is a well-intentioned
decision to obtain international expertise, our evidence points to the danger of overlooking the
logistical difficulties and informational disadvantages FIDs must overcome to perform their
duties effectively. Of course, it is also possible that some FIDs are brought on boards precisely
because of their impaired monitoring capabilities, much like the appointments of other
monitoring deficient independent directors, such as busy directors. As such, the evidence we
uncover on the negative effects of FIDs on board effectiveness in monitoring and disciplining
managers and on firm performance and value could be partly due to weaknesses in some firms’
board nominating processes and possibly their overall corporate governance.
8 These earlier studies include, e.g., Weisbach (1988), Byrd and Hickman (1992), Brickley, Coles, and
Terry (1994), Bhagat and Black (1999), Core, Holthausen, Larcker (1999), Fich and Shivdasani (2006),
Adams and Ferreira (2009), Hwang and Kim (2009), Coles, Daniel, and Naveen (2010), and Nguyen and
Nielsen (2010). See Hermalin and Weisbach (2003) and Adams, Hermalin, and Weisbach (2009) for
surveys of this literature.
7
Our study also adds to a growing literature on the effect of geographic proximity on
information flow and economic decision making.9 Our results suggest that geography plays an
important role in the corporate governance arena as geographic remoteness impedes the
performance of independent directors as monitors of management. In this sense, our evidence is
consistent with the findings of Kang and Kim (2008) that acquirers in partial block acquisitions
engage in more corporate governance activities and create more value at targets when acquirers
and targets are geographically closer.
Finally, our findings have implications for boards considering appointments of foreign
independent directors and shareholders who must approve them. Given the evidence on the
monitoring deficiencies of FIDs, a careful cost-benefit analysis is warranted to assess whether
their appointments can improve firm performance and increase shareholder value.
The remainder of the paper is organized as follows. Section II describes the procedures
for sample construction and identification of FIDs and presents summary statistics of our sample.
Sections III, IV, V, VI, and VII analyze firms’ cross-border acquisition decisions, directors’ board
meeting attendance records, firms’ financial reporting quality, CEO compensation policy, and
CEO turnover decisions, respectively. Section VIII presents results from firm performance
regressions. Section IX conducts an event study of FID appointments. Section X presents the
results from several auxiliary analyses. Section XI summarizes our findings and conclusions.
II. Sample Construction and Identification of Foreign Independent Directors
We start with the universe of firms in the IRRC (now RiskMetrics) Directors Database,
which covers firms in the S&P 1500 index. Our sample period is from 1998 to 2006, since prior
to 1998, information on the country of a director’s primary employer, which we use to identify
foreign independent directors, is largely missing along with some other important director
9 See, e.g., Coval and Moskowitz (1999, 2001), Huberman (2001), Grinblatt and Keloharju (2001), Zhu
(2002), Ivkovich and Weisbenner (2005), Malloy (2005), Bae, Stulz, and Tan (2008), and Uysal, Kedia,
and Panchapagesan (2008).
8
information such as director shareholdings and committee memberships. IRRC classifies
directors into inside, gray and independent directors. Inside directors are the company’s
executives and officers. Independent directors are those who have no business, financial, familial,
or interlocking relationship that could compromise their ability or incentives to perform board
oversight duties in the best interests of shareholders. The remaining directors are considered
gray.10
We focus on independent directors since inside and gray directors cannot be relied upon to
carry out the board’s monitoring function given their conflicts of interest.
To identify firm-years with foreign independent directors, we first use the IRRC variable
COUNTRY_OF_EMPL to tentatively classify an independent director as foreign (domestic) if
her primary employer is a non-U.S. (U.S.) company. For directors who are retired, the database
reports the country of their last primary employment.11
We correct obvious coding errors by
IRRC in 1,077 director-firm-year observations in which a director is classified as foreign in one
year and domestic in another, while the director maintains the same employer and the employer
has not change the location of its headquarters.12
Given our focus on directors’ geographic location, there are two concerns about the first-
step identification due to the large number of multinational corporations around the world. It is
possible that independent directors initially classified as foreign may in fact be domestic if they
are affiliated with the U.S. operation of their foreign employers.13
To address this first concern,
10 According to IRRC, gray directors include former employees, family members of current employees,
owners of majority voting control, and individuals with disclosed conflicts of interest such as outside
business dealings with the company, receipt of charitable contribution from the company, and interlocking
director relationship with the CEO. 11 We recognize that individuals may move away from the location of their last primary employment after
retirement, but these relocations seem much more likely to be within national border than cross border.
Given our focus on whether a director is located in or outside the U.S., this post-retirement migration is less
of a concern to us. 12 For example, David Li was on the board of Campbell Soup during 1998 and 1999. IRRC classifies him as a foreign director in 1998 and a domestic director in 1999. However, David Li was Chairman and CEO
of Bank of East Asia, a bank in Hong Kong, in both years. We correct IRRC’s coding and reclassify him as
foreign for 1999. 13 For example, A.D. Frazier, Jr., president and chief executive officer of Invesco Inc., was on the board of
Apache Corp in 1999. Invesco Inc. is a U.S. subsidiary of AMVESCAP PLC., a London-based independent
9
we obtain from proxy statements detailed biographies of directors initially classified as foreign,
and reclassify them as domestic if they are employed in U.S. affiliates of foreign multinational
corporations.
It is also possible that independent directors initially classified as domestic may actually
be located abroad if they are primarily stationed in foreign subsidiaries of their U.S. employers. 14
This concern is much more difficult to deal with due to the very large number of independent
directors whose primary employers are U.S. firms according to IRRC (over 80,000 director-firm-
year observations). We randomly checked about one eighth of these observations and find a
misclassification frequency of about 1%, but virtually all these cases are due to IRRC’s
misclassification of a director’s primary employer as U.S. company when it is in fact foreign. To
address the second concern in a more systematic manner, we obtain director addresses by locating
director insider trading disclosures from the Thomson Financial Insider Trading Database. This
approach helps us reclassify some domestic director-year observations as foreign, though it is
unlikely to correct all the misclassifications since not all independent directors in our sample
reported insider trading activities during the sample period and some of the filings simply use the
address of corporate headquarters as a director’s address. To the extent that some foreign
independent directors remain misclassified as domestic, our statistical tests will have less power
to detect significant differences between firm-years with and without FIDs. However, given the
low frequency of such misclassification, we consider this a minor concern. For each firm-year,
we construct two measures to capture the presence of FIDs. The first is an indicator variable that
equals one if a firm has at least one FID on its board, and the second is the percentage of FIDs
among all independent directors.
global investment management firm. IRRC classifies Mr. Frazier as a UK director and we reclassify him as
domestic. 14 For example, Takeo Shiina, Chairman of IBM Japan Ltd., was on the board of Air Products & Chemicals
in 1999. IRRC classifies him as domestic, and we reclassify him as foreign, since he was most likely based
in Japan.
10
We merge the IRRC sample with Compustat annual files and geographic segment files.15
We exclude firms incorporated in foreign countries, firm-years in which the sum of sales from a
firm’s reported geographic segments is not within one percent of the firm’s total reported sales
for that year, and firms with a dual-class share structure.16
We end up with a sample of 9,979
firm-year observations during the period of 1998-2006, and observe FIDs in 1,271 (12.74%) firm-
year observations, 250 of which have multiple FIDs. Conditional on FID presence, on average
about 18% of independent directors are FIDs. Panel A of Table I displays the sample frequency
distribution by year, which shows no sign of clustering in any particular year for either the overall
sample or the subsample with FIDs. Panel B of Table I presents the country distribution of FIDs
in our sample. We observe a large cross section of FID source countries, with U.K., Canada,
Germany, Netherland, and Mexico having the most representations. We explore potential cross-
country differences among FIDs later in our analysis in Section IX and find little evidence of
differential effects.
Table II presents summary statistics of some key financial and governance variables of
firms in our sample. Detailed definitions of the variables are given in the Appendix. All
continuous variables are winsorized at their 1st and 99
th percentiles to reduce the influence of
outliers. The median firm in our sample has 9 board members, 70% of which are independent
directors. About 80% of our firms have a majority of independent directors. We observe
CEO/Chairman duality in 66% of firm years. On average, about 17% of independent directors are
15 U.S. firms are required to report geographic segments that account for 10% of consolidated sales, profits,
or assets. Compustat classifies firms’ geographic segments into the following regions: Africa, Asia-Pacific,
Europe, Middle East, North America, and South/Latin America. For a detailed description of Compustat’s
geographic segment data, please refer to Denis, Denis, and Yost (2002). 16 The reason we exclude dual-class companies from our analysis is that at these firms insiders tend to control most of the voting rights, which enable them to elect a majority of the directors and block any
hostile takeover attempt (Gompers, Ishii, and Metrick (2009) and Masulis, Wang, and Xie (2009)).
Therefore, boards are unlikely to be an effective internal corporate governance mechanism that limits
managerial agency problems. As a robustness check, we also exclude from our sample single-class firms
whose CEOs own more than 10%, 20%, … or 50% of the equity. Our results are unchanged.
11
classified as busy, i.e., they hold at least three directorships.17
The equity ownership of directors
as a whole averages about 8.3%, with a median of 3.3%. Only 3.5% of firms have an independent
director who is also a blockholder, defined as an investor holding at least 5% of firm equity. Our
sample firms have a mean (median) ROA of 12.7% (12.3%), Tobin’s Q of 1.89 (1.44), market
capitalization of $7.98 (1.66) billion, R&D to sales ratio of 3.9% (0), and foreign sales percentage
of 19% (7.8%). In the last two columns of Table II, we report Pearson correlations between our
measures of FID presence and other firm characteristics. We observe a higher frequency of FIDs
on larger, more independent, and busier boards and boards whose members own a smaller
percentage of their firm’s stock. FIDs are also more likely to appear at firms that are larger and
have more growth opportunities (proxied by both Tobin’s Q and R&D intensity) and whose
foreign operations generate a larger percentage of their total sales.
III. Analysis of Cross-border Acquisition Decisions
One purported benefit of FIDs is that they provide knowledge and insights about certain
foreign markets and help firms make more informed investment, operating, and distribution
decisions overseas. One type of such decisions is cross-border acquisitions, as suggested by
Adams, Hermalin, and Weisbach (2009). Cross-border acquirers face significant challenges since
they must contend with unfamiliar political, regulatory and industry conditions, limited
information about potential targets, and foreign legal, cultural and social norms. Consistent with
these difficulties, both Eckbo and Thorburn (2000) and Moeller and Schlingemann (2005) find
that acquirers perform significantly worse in cross-border deals than in domestic deals. FIDs
could prove valuable to cross-border acquirers, since they can leverage their international
expertise to provide unique perspectives on important issues such as target selection, deal
structure and negotiation, and post-transaction integration, and they can do so either formally at a
17 Our results are robust to using the average number of board seats held by independent directors as an
alternative measure of board busyness (Ferris, Jagannathan, and Pritchard (2003)).
12
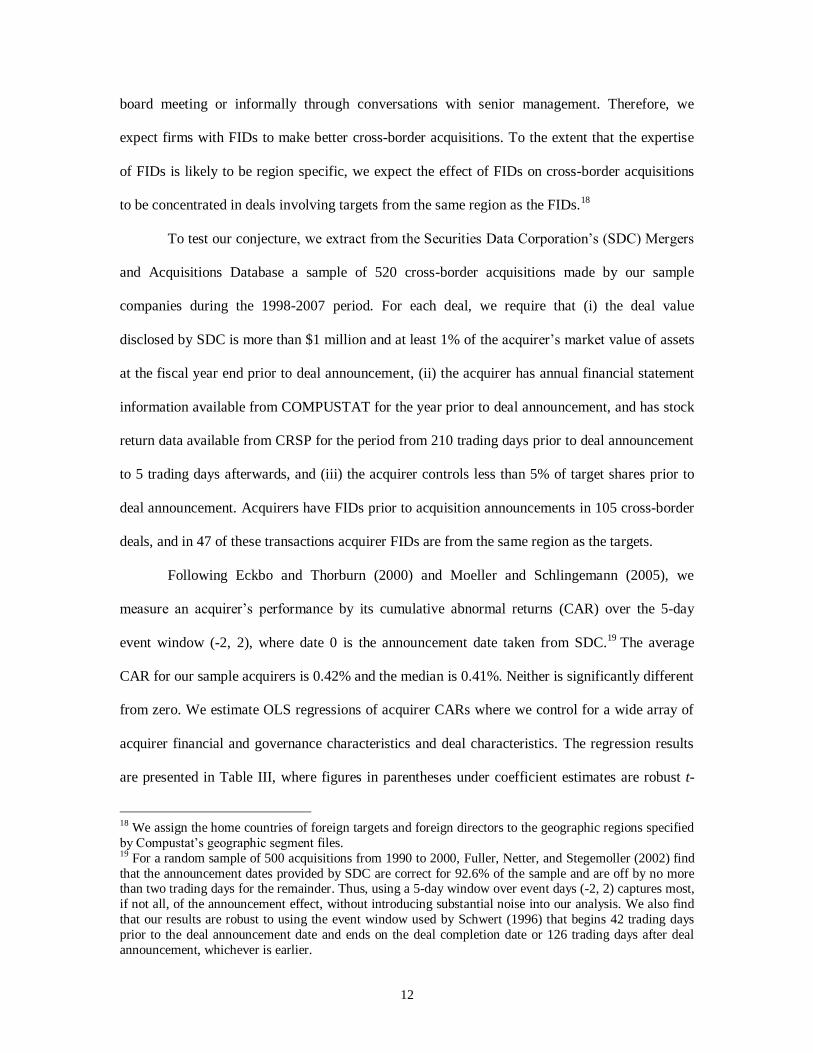
board meeting or informally through conversations with senior management. Therefore, we
expect firms with FIDs to make better cross-border acquisitions. To the extent that the expertise
of FIDs is likely to be region specific, we expect the effect of FIDs on cross-border acquisitions
to be concentrated in deals involving targets from the same region as the FIDs.18
To test our conjecture, we extract from the Securities Data Corporation’s (SDC) Mergers
and Acquisitions Database a sample of 520 cross-border acquisitions made by our sample
companies during the 1998-2007 period. For each deal, we require that (i) the deal value
disclosed by SDC is more than $1 million and at least 1% of the acquirer’s market value of assets
at the fiscal year end prior to deal announcement, (ii) the acquirer has annual financial statement
information available from COMPUSTAT for the year prior to deal announcement, and has stock
return data available from CRSP for the period from 210 trading days prior to deal announcement
to 5 trading days afterwards, and (iii) the acquirer controls less than 5% of target shares prior to
deal announcement. Acquirers have FIDs prior to acquisition announcements in 105 cross-border
deals, and in 47 of these transactions acquirer FIDs are from the same region as the targets.
Following Eckbo and Thorburn (2000) and Moeller and Schlingemann (2005), we
measure an acquirer’s performance by its cumulative abnormal returns (CAR) over the 5-day
event window (-2, 2), where date 0 is the announcement date taken from SDC.19
The average
CAR for our sample acquirers is 0.42% and the median is 0.41%. Neither is significantly different
from zero. We estimate OLS regressions of acquirer CARs where we control for a wide array of
acquirer financial and governance characteristics and deal characteristics. The regression results
are presented in Table III, where figures in parentheses under coefficient estimates are robust t-
18 We assign the home countries of foreign targets and foreign directors to the geographic regions specified
by Compustat’s geographic segment files. 19 For a random sample of 500 acquisitions from 1990 to 2000, Fuller, Netter, and Stegemoller (2002) find
that the announcement dates provided by SDC are correct for 92.6% of the sample and are off by no more than two trading days for the remainder. Thus, using a 5-day window over event days (-2, 2) captures most,
if not all, of the announcement effect, without introducing substantial noise into our analysis. We also find
that our results are robust to using the event window used by Schwert (1996) that begins 42 trading days
prior to the deal announcement date and ends on the deal completion date or 126 trading days after deal
announcement, whichever is earlier.
13
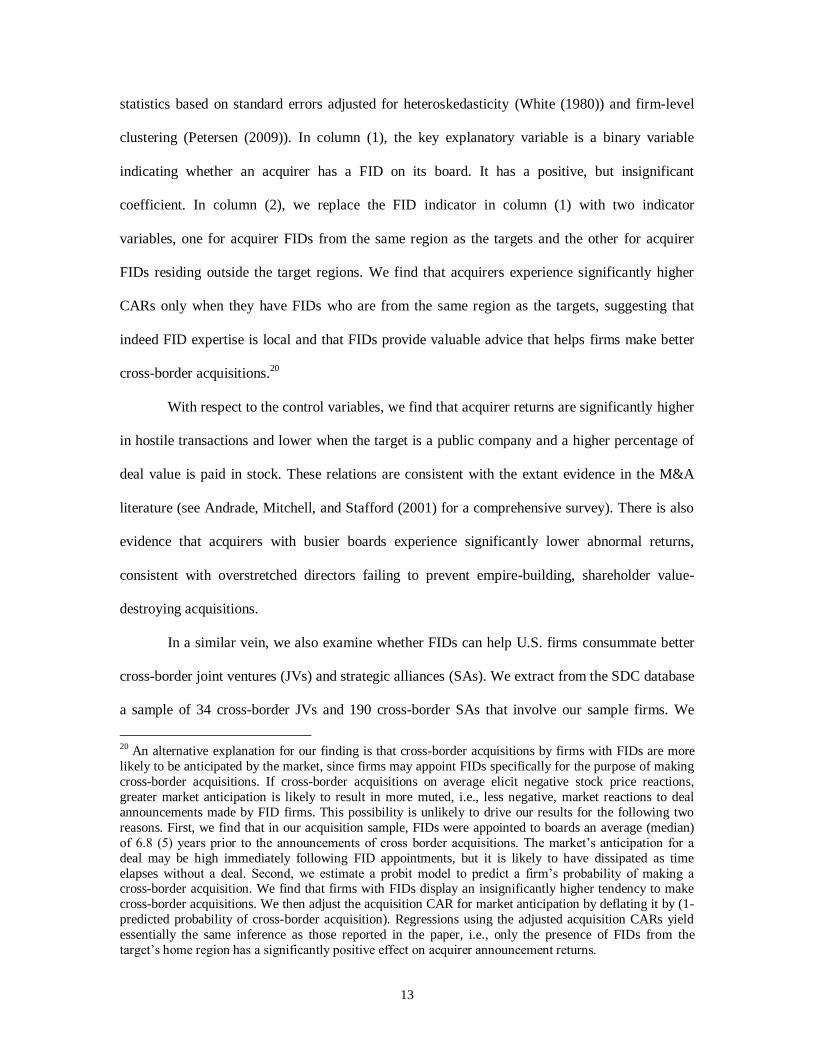
statistics based on standard errors adjusted for heteroskedasticity (White (1980)) and firm-level
clustering (Petersen (2009)). In column (1), the key explanatory variable is a binary variable
indicating whether an acquirer has a FID on its board. It has a positive, but insignificant
coefficient. In column (2), we replace the FID indicator in column (1) with two indicator
variables, one for acquirer FIDs from the same region as the targets and the other for acquirer
FIDs residing outside the target regions. We find that acquirers experience significantly higher
CARs only when they have FIDs who are from the same region as the targets, suggesting that
indeed FID expertise is local and that FIDs provide valuable advice that helps firms make better
cross-border acquisitions.20
With respect to the control variables, we find that acquirer returns are significantly higher
in hostile transactions and lower when the target is a public company and a higher percentage of
deal value is paid in stock. These relations are consistent with the extant evidence in the M&A
literature (see Andrade, Mitchell, and Stafford (2001) for a comprehensive survey). There is also
evidence that acquirers with busier boards experience significantly lower abnormal returns,
consistent with overstretched directors failing to prevent empire-building, shareholder value-
destroying acquisitions.
In a similar vein, we also examine whether FIDs can help U.S. firms consummate better
cross-border joint ventures (JVs) and strategic alliances (SAs). We extract from the SDC database
a sample of 34 cross-border JVs and 190 cross-border SAs that involve our sample firms. We
20 An alternative explanation for our finding is that cross-border acquisitions by firms with FIDs are more
likely to be anticipated by the market, since firms may appoint FIDs specifically for the purpose of making
cross-border acquisitions. If cross-border acquisitions on average elicit negative stock price reactions,
greater market anticipation is likely to result in more muted, i.e., less negative, market reactions to deal
announcements made by FID firms. This possibility is unlikely to drive our results for the following two
reasons. First, we find that in our acquisition sample, FIDs were appointed to boards an average (median)
of 6.8 (5) years prior to the announcements of cross border acquisitions. The market’s anticipation for a
deal may be high immediately following FID appointments, but it is likely to have dissipated as time
elapses without a deal. Second, we estimate a probit model to predict a firm’s probability of making a cross-border acquisition. We find that firms with FIDs display an insignificantly higher tendency to make
cross-border acquisitions. We then adjust the acquisition CAR for market anticipation by deflating it by (1-
predicted probability of cross-border acquisition). Regressions using the adjusted acquisition CARs yield
essentially the same inference as those reported in the paper, i.e., only the presence of FIDs from the
target’s home region has a significantly positive effect on acquirer announcement returns.

14
measure each participating U.S. firm’s abnormal returns over a 5-day event window centering the
announcement date provided by SDC, and regress it against the FID indicator along with an array
of firm financial and governance variables used in our cross-border acquisition analysis.
Interestingly, we find no evidence that FID presence significantly improves the market
expectation of the shareholder value impact of cross-border JVs or SAs, even for deals in the
home region of FIDs.21
This suggests that FIDs do not play an important advisory role in cross-
border JV and SA deals.
IV. Analysis of Board Meeting Attendance
In this section, we conduct a direct test to assess the monitoring effectiveness of FIDs.
Specifically, we examine the board meeting attendance of independent directors. Board meetings
are the primary mechanism for outside directors to keep informed of a firm’s operations, business
conditions and managerial decision making, so that they can effectively participate in a firm’s
governance. Consistent with the importance of board meetings, Vafeas (1999) finds that stock
price declines tend to prompt a higher frequency of board meetings, which subsequently lead to
operating performance improvement. Institutional investors and governance activists have used
board meeting attendance records to evaluate director performance, and directors who frequently
miss board meetings are often criticized as being ineffective monitors and receive significantly
fewer votes for their re-election (Cai, Garner, and Walkling (2009)).
Theoretical predictions on foreign directors’ incentive to attend board meetings are
inconclusive. Compared to domestic directors, FIDs face greater logistical difficulties and time
and energy drains from international travel, and thus may be more likely to miss board meetings.
However, given their informational disadvantage, FIDs may consider board meetings as an
especially important channel that provides valuable opportunities to have direct contact with other
21 We obtain qualitatively similar results when we use longer event windows and adjust announcement
returns for market anticipation.
15
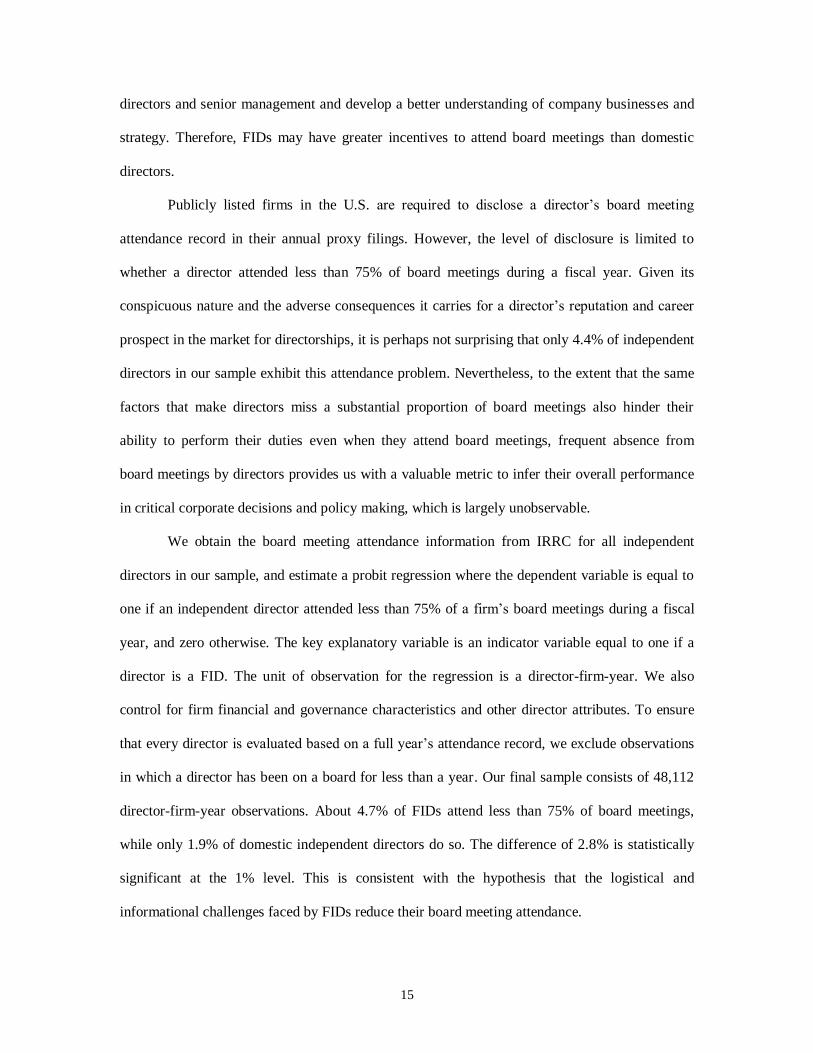
directors and senior management and develop a better understanding of company businesses and
strategy. Therefore, FIDs may have greater incentives to attend board meetings than domestic
directors.
Publicly listed firms in the U.S. are required to disclose a director’s board meeting
attendance record in their annual proxy filings. However, the level of disclosure is limited to
whether a director attended less than 75% of board meetings during a fiscal year. Given its
conspicuous nature and the adverse consequences it carries for a director’s reputation and career
prospect in the market for directorships, it is perhaps not surprising that only 4.4% of independent
directors in our sample exhibit this attendance problem. Nevertheless, to the extent that the same
factors that make directors miss a substantial proportion of board meetings also hinder their
ability to perform their duties even when they attend board meetings, frequent absence from
board meetings by directors provides us with a valuable metric to infer their overall performance
in critical corporate decisions and policy making, which is largely unobservable.
We obtain the board meeting attendance information from IRRC for all independent
directors in our sample, and estimate a probit regression where the dependent variable is equal to
one if an independent director attended less than 75% of a firm’s board meetings during a fiscal
year, and zero otherwise. The key explanatory variable is an indicator variable equal to one if a
director is a FID. The unit of observation for the regression is a director-firm-year. We also
control for firm financial and governance characteristics and other director attributes. To ensure
that every director is evaluated based on a full year’s attendance record, we exclude observations
in which a director has been on a board for less than a year. Our final sample consists of 48,112
director-firm-year observations. About 4.7% of FIDs attend less than 75% of board meetings,
while only 1.9% of domestic independent directors do so. The difference of 2.8% is statistically
significant at the 1% level. This is consistent with the hypothesis that the logistical and
informational challenges faced by FIDs reduce their board meeting attendance.
16
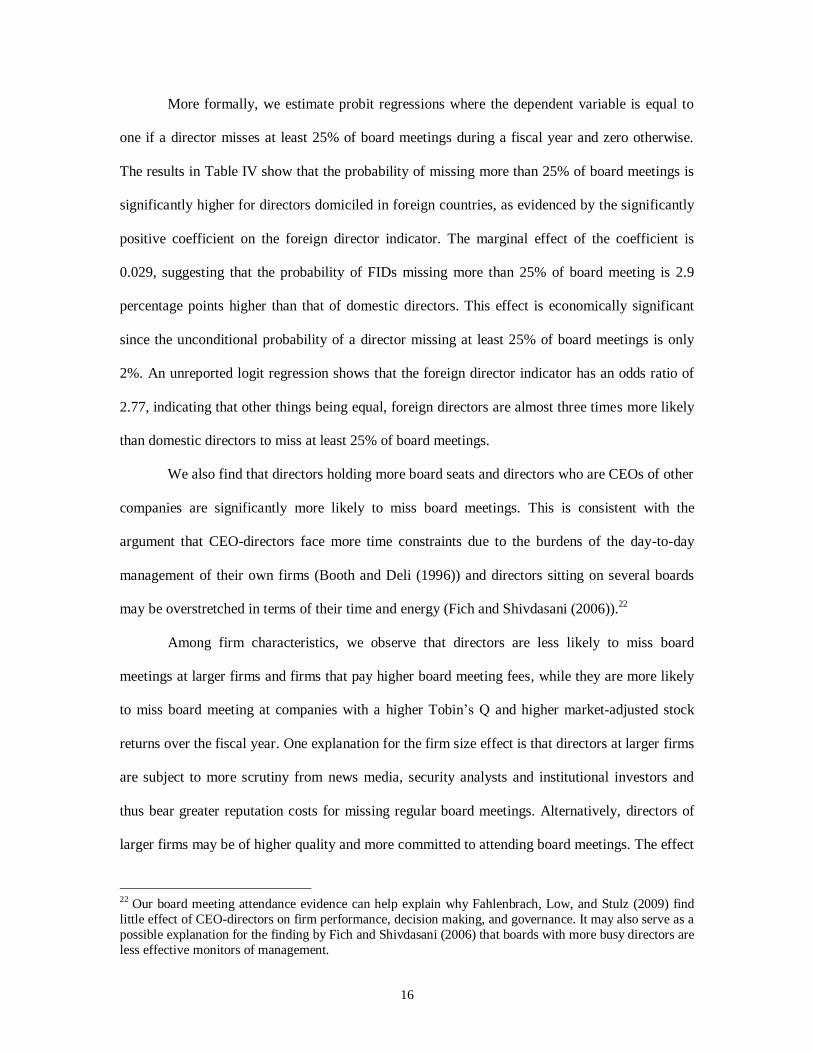
More formally, we estimate probit regressions where the dependent variable is equal to
one if a director misses at least 25% of board meetings during a fiscal year and zero otherwise.
The results in Table IV show that the probability of missing more than 25% of board meetings is
significantly higher for directors domiciled in foreign countries, as evidenced by the significantly
positive coefficient on the foreign director indicator. The marginal effect of the coefficient is
0.029, suggesting that the probability of FIDs missing more than 25% of board meeting is 2.9
percentage points higher than that of domestic directors. This effect is economically significant
since the unconditional probability of a director missing at least 25% of board meetings is only
2%. An unreported logit regression shows that the foreign director indicator has an odds ratio of
2.77, indicating that other things being equal, foreign directors are almost three times more likely
than domestic directors to miss at least 25% of board meetings.
We also find that directors holding more board seats and directors who are CEOs of other
companies are significantly more likely to miss board meetings. This is consistent with the
argument that CEO-directors face more time constraints due to the burdens of the day-to-day
management of their own firms (Booth and Deli (1996)) and directors sitting on several boards
may be overstretched in terms of their time and energy (Fich and Shivdasani (2006)).22
Among firm characteristics, we observe that directors are less likely to miss board
meetings at larger firms and firms that pay higher board meeting fees, while they are more likely
to miss board meeting at companies with a higher Tobin’s Q and higher market-adjusted stock
returns over the fiscal year. One explanation for the firm size effect is that directors at larger firms
are subject to more scrutiny from news media, security analysts and institutional investors and
thus bear greater reputation costs for missing regular board meetings. Alternatively, directors of
larger firms may be of higher quality and more committed to attending board meetings. The effect
22 Our board meeting attendance evidence can help explain why Fahlenbrach, Low, and Stulz (2009) find
little effect of CEO-directors on firm performance, decision making, and governance. It may also serve as a
possible explanation for the finding by Fich and Shivdasani (2006) that boards with more busy directors are
less effective monitors of management.
17
of board meeting fees is consistent with the finding of Adam and Ferreira (2009) that directors
respond to the incentives and signals provided by a firm’s director compensation structure. The
effects of Tobin’s Q and abnormal stock returns are consistent with the evidence in Vafeas (1999)
that boards tend to become more active following poor stock price performance, which would
lower Tobin’s Q. 23
Regarding the effects of governance variables, we find significantly better attendance
records at firms with more antitakeover provisions (weaker shareholder rights) proxied by the
GIM index. This suggests a substitute relationship between internal and external governance;
when managers are subject to less pressure from the market for corporate control, monitoring by
independent directors tends to make up for the slack. There is strong evidence that directors
sitting on larger boards have poorer attendance records, which is consistent with the notion that
larger boards suffer greater free-rider problems (Lipton and Lorsch (1992), Jensen (1993),
Yermack (1996), and Eisenberg, Sundgren, and Wells (1998)). We also find that directors are less
likely to miss board meetings when there is an independent blockholder on board, suggesting that
independent director-blockholders serve as monitors of not only corporate managers, but also
fellow board members. Finally, it appears that directors are significantly less likely to miss board
meetings after the passage of the Sarbanes-Oxley Act in 2002, which could be a response to
heightened public scrutiny of corporate governance and boards of directors as well as higher
personal costs to directors of corporate scandals.24
Overall, our examination of directors’ board meeting attendance records yields results
indicative of FID monitoring deficiencies. We show that frequently missing board meetings is
one consequence of the difficulties confronting FIDs, and it is one potential channel through
23 We do not include firms’ foreign operations as a control variable in the regression, because there is no
theory predicting how it might affect independent director’s board meeting attendance. As a robustness check, we find that foreign sales percentage has an insignificant coefficient, and including it does not affect
other parameter estimates. 24 Former outside directors of Enron and WorldCom agreed to pay $13 million and $18 million,
respectively, out of their own pockets to settle shareholder lawsuits stemming from the corporate
governance scandals at these two companies.
18
which the presence of FIDs could negatively impact board effectiveness and reduce shareholder
value and firm performance.25
We recognize that regularly attending board meetings is not a
sufficient condition for an independent director to be effective. This is especially true when CEOs
largely control the flow of information before and during board meetings. As a supplement to
board meetings, independent directors may choose to acquire more information by visiting
corporate headquarters and plants and meeting with rank-and-file employees and senior managers
(Lerner (1995)). However, these actions likely entail even greater costs than attending board
meetings and thus are unlikely to be undertaken by FIDs given their poor board meeting
attendance records.
V. Analysis of Earnings Restatements
As a further test of the monitoring effectiveness of FIDs, we next examine whether
having a FID increases a firm’s propensity to misreport earnings. Managers have incentives to
overstate earnings to meet or beat analysts’ forecasts, to increase their bonuses and the value of
their stock and stock option holdings, and to avoid being fired for poor firm performance. One of
the board’s main responsibilities is to ensure the integrity of a company’s financial statements and
related disclosures. Certain board characteristics, such as board independence and the presence of
financial experts on the board, are shown to rein in firms’ earnings management behavior and
reduce the probability of earnings restatements (Klein (2002) and Agrawal and Chadha (2005)).
In addition, directors of restating companies experience abnormally high rates of turnover, and
have a higher probability of losing board seats at other companies (Srinivasan (2005)), suggesting
that directors are held at least partially accountable for restatements.
25 In unreported analysis, we find that when a FID has attendance problems, domestic independent directors
from the same board tend to have attendance problems as well. This positive relation is inconsistent with
the notion that domestic independent directors exert more effort to offset the monitoring limitations of
FIDs.
19
Our sample of firms misreporting accounting earnings comes from two reports issued by
the U.S. General Accounting Office (GAO) in 2003 and 2007, which include a list of companies
that restated their financial statements during the period from January 1997 to June 2006.
According to the GAO, “a restatement occurs when a company, either voluntarily or prompted by
auditors or regulators, revises public financial information that was previously reported.” The
GAO sample includes both financial reporting frauds or irregularities (intentional misreporting)
and accounting errors (unintentional misstatements). Hennes, Leone, and Miller (2008) partition
the restatements by classifying a restatement as an irregularity if it satisfies at least one of the
three criteria: (i) variants of the words “irregularity” or “fraud” were explicitly used in
restatement announcements or relevant filings in the four years around the restatement; (ii) the
misstatements came under SEC or DOJ investigations; and (iii) independent investigations were
launched by boards of directors of restatement firms. They demonstrate the importance and
effectiveness of their classification scheme by showing that compared to error restatements,
restatements due to accounting irregularities are met with significantly more negative
announcement returns (on average: -14% vs. -2%), are followed at a significantly higher rate by
shareholder class action lawsuits, and lead to significantly more CEO/CFO turnovers.
The GAO reports provide the names of restating firms and the years during which the
restatements are announced. We obtain the misreported fiscal years and quarters from Burns and
Kedia (2006) for restatements announced between 1997 and 2002, and manually collect the same
information for restatements announced between 2003 and 2006.26
Merging the restatement data
with our sample generates a sample of 8,924 firm-year observations from 1998 to 2005.27
In 821
or about 9% of the firm-years, firms misreport earnings that require future restatements. In 271 or
about 3% of the firm years, firms deliberately manipulate earnings that necessitate later
restatements.
26 We thank Natasha Burns and Simi Kedia for kindly sharing their data. 27 The latest restated fiscal year is 2005.
20
We conduct a probit analysis of the likelihood of a firm misreporting its earnings and
present the results in Table V. In column (1), the dependent variable is equal to one for restated
firm years without differentiating between restatements due to errors or irregularities. The key
explanatory variable is the FID indicator,28
with a large number of firm financial and governance
characteristics as controls. We find that the probability of misreporting is not significantly related
to the presence of FIDs on a board.
However, in column (2), when we redefine the dependent variable as equal to one for
firms years restated due to irregularities only, we find that the FID indicator has a significantly
positive coefficient, consistent with FIDs reducing the intensity of board monitoring of
management and increasing the likelihood of firms committing intentional financial misreporting.
The costs to shareholders of this lapse in board oversight are substantial, since disclosures of
financial misreporting and announcements of earnings restatements usually result in large stock
price declines (Karpoff, Lee, and Martin (2008)).
Given the importance of the audit committee in a firm’s financial reporting process, we
also replace the FID indicator with two indicator variables, one for firms with FIDs on their audit
committees at the time of financial misreporting, and the other for firms that have FIDs on their
boards, but not on their audit committees at the time of financial misreporting.29
As shown in
column (3), both indicator variables have positive coefficients, but only the coefficient of the
indicator for FIDs on audit committees is statistically significant. Its magnitude is more than
twice as large as that of the indicator for FIDs not on audit committees. This evidence is
consistent with the view that given FIDs' likely unfamiliarity with US accounting rules and
regulations, their appointment to a firm’s audit committee is expected to weaken board oversight
28 As with the rest of our analysis, results based on the FID percentage measure are qualitatively similar and
available upon request. 29 About 46% of FIDs sit on audit committees.

21
over the firm’s financial reporting process and reduce the quality and reliability of its financial
disclosures.30
Our results are significant not only statistically, but also economically. The marginal
effects reported in columns (2) and (3) indicate that ceteris paribus, the presence of FIDs on
boards increases the probability of a firm intentionally misreporting earnings by 1% (in absolute
terms), while the presence of FIDs on audit committees increases the probability of intentional
earnings manipulation by 1.4% (in absolute terms as well). Both figures are economically
meaningful considering that the unconditional probability of intentional financial misreporting in
our sample is only about 3%.
Among the control variables, we find that larger firms are more likely to restate earnings,
probably because their accounting disclosures are under more scrutiny by institutional investors,
security analysts and the business press. Better performing firms are less likely to misreport
earnings, presumably because their superior performance makes it unnecessary for them to do
so.31
Firms with larger foreign operations are associated with a higher probability of intentional
financial reporting, probably because their operational and financial complexities provide
managers with more opportunities for earnings manipulation.32
Consistent with the evidence in
Agrawal and Chadha (2005), board size, board independence, CEO/Chairman duality and director
ownership do not have significant effects on the probability of financial misreporting in general.
But once we focus on intentional financial misreporting, we find that board independence and
stock ownership significantly reduce the likelihood of deliberate earnings manipulation.
30 We also find that firms with FIDs on their audit committees are not more likely to have major foreign
operations in the region that the FID resides. This suggests that FID appointments to audit committees
cannot be explained as utilizing their foreign expertise. 31 This evidence needs to be interpreted with caution, since not all misreporting firms have been caught and
have to restate their earnings. 32 To further ensure that the effect of FIDs on the probability of financial misreporting is not an artifact of FIDs sitting on boards of firms with more overseas business operations or transactions, we include the
following additional control variables in the probit regressions: a firm’s number of geographic segments as
reported by Compustat and indicator variables for whether a firm has engaged in a cross-border acquisition,
strategic alliance, or joint venture over the previous three years. Our findings on the effect of FIDs continue
to hold.
22
In summary, firms with foreign independent directors on their boards and especially audit
committees are more likely to commit intentional financial reporting. This additional evidence
supports the hypothesis that foreign directors are associated with lax monitoring of management
and a failure to prevent aggressive accounting reporting practices.
VI. Analysis of CEO Compensation
In this section, we examine how the presence of FIDs affects CEO compensation policy.
To the extent that lax monitoring by FIDs contributes to poor governance and leads to more
agency problems, we expect firms with FIDs to pay their CEOs significantly higher compensation
than firms without FIDs.
To test whether FIDs are associated with higher CEO pay unexplained by known
determinants, we merge the IRRC sample with the ExecuComp database to obtain information on
CEO compensation. We exclude firm-year observations with multiple CEOs and those in which
CEOs have been in office for less than one year, since the compensation received by these CEOs
is for only part of a fiscal year. We also require firms to have stock return data from CRSP and
accounting data from Compustat for each fiscal year. The final sample consists of 7,665 firm-year
observations during the period from 1998 to 2006.
The dependent variable in our regressions is the log of CEO total compensation
(ExecuComp variable: TDC1), while the key explanatory variable is the indicator for FID
presence on the board. We control for other determinants of CEO compensation previously found
to be empirically important. In particular, we control for a firm’s market-adjusted abnormal stock
returns during both the current and the previous year, since some components of CEO pay such as
salary and equity grants are often determined by prior year’s performance. We use the standard
deviation of monthly stock returns during past five years as a proxy for firm risk to capture
possible CEO demand for higher compensation for bearing greater firm risk. We control for a
firm’s foreign sales percentage, since firms with greater international operations may require
23
more qualified CEOs or alternatively, CEOs may demand higher pay for managing more complex
and geographically dispersed operations. To the extent that higher-quality CEOs command higher
compensation, we directly control for managerial quality measured by a firm’s industry-adjusted
operating income growth over the previous three years, following Morck, Shleifer, and Vishny
(1990).
Column (1) in Panel A of Table VI presents coefficient estimates from the CEO
compensation regression. We find that FID presence has a significantly positive effect on CEO
compensation, which is consistent with the hypothesis that boards with FIDs are less effective in
controlling CEOs’ self serving behavior and tend to approve overly generous CEO pay packages.
In economic terms, everything else being equal, CEO compensation at firms with FIDs is about
10% higher than that at firms without FIDs. In column (2), we examine the effect of FIDs sitting
on the board’s compensation committee. We replace the FID indicator with two indicator
variables, one for firms with FIDs on their compensation committees, and the other for firms that
have FIDs on their boards, but not on their compensation committees.33
We find that both
indicator variables have significant and positive coefficients, with the one for compensation
committee FIDs being about 55% larger in magnitude, though the difference is not statistically
significant.
An alternative to the agency interpretation of our finding is an optimal contracting
perspective, which posits that higher CEO compensation simply reflects competitive-level pay for
either higher managerial quality or greater managerial risk aversion. Although the CEO
compensation regressions in Panel A include explicit linear controls for managerial quality and
firm risk, we conduct additional tests to distinguish the agency interpretation from the optimal
contracting explanation. Specifically, we follow the approach of Core, Holthausen, and Larcker
(1999) and compute the portion of CEO compensation explained by FID presence based on the
coefficient estimates from the regression in column (1) of Panel A of Table VI. We then estimate
33 About 39% of FIDs sit on compensation committees.
24
regressions of ROA and Tobin’s Q against the FID-driven portion of CEO compensation, while
controlling for a number of firm financial and governance characteristics related to firm
performance. If the FID-driven portion of CEO compensation reflects optimal contracting, we
expect it to have either a positive or zero impact on future firm performance and value. However,
if it reflects excessive compensation due to agency problems, we expect it to have a negative
effect on future firm performance and value. Untabulated results indicate that the imputed CEO
compensation due to FID presence has a significantly negative effect on both ROA and Tobin’s
Q, thus supporting the agency interpretation of the higher CEO compensation associated with
FIDs. Despite the evidence from these additional tests, we recognize that the possibility remains
that the higher CEO compensation associated with FID presence could reflect differences in
managerial quality or risk aversion, attributes that are either unobservable or very difficult to
measure with precision.
As the final analysis of this section, we examine whether FID presence affects another
dimension of executive compensation, i.e., the distribution of CEO pay between equity based and
cash based. We start by estimating separate regressions of CEO cash-based compensation, which
includes annual salary and bonus, and equity-based compensation, which includes restricted stock
and stock option awards received by CEOs during a fiscal year. Results in Panel B of Table VI
show that the presence of FIDs significantly increases CEO cash pay, but its effect on CEO
equity-based pay is insignificant. We then analyze the percentage of equity-based compensation
in total CEO pay, which is equal to the value of annual restricted stock and stock option awards
scaled by total annual compensation. Unreported regression results show that the FID indicator
has a negative, albeit insignificant, effect on the percentage of equity-based compensation. We
obtain similar findings when we replace the percentage of equity-based pay by the pay-for-
performance sensitivity generated by annual stock and option grants to CEOs scaled by total CEO
compensation. This evidence suggests that the higher CEO total pay associated with FID presence
is not compensation for bearing greater risk due to a higher proportion of equity-based pay.
25
Overall, it appears that firms with FIDs pay their CEOs significantly higher compensation,
especially the cash-based portion. These results reinforce the notion that FIDs weaken the
management oversight by boards and lead to more agency problems.
VII. Analysis of CEO turnovers
In this section, we examine how the presence of FIDs impacts the effectiveness of boards
in disciplining poorly performing CEOs, since evaluating managerial performance and replacing
underperforming CEOs is one of the major responsibilities of boards. This is also a continuation
of our analyses from earlier sections that show that boards with FIDs are less effective in
monitoring and disciplining CEOs, which is likely to lead to weaker firm performance. How
boards respond to poor managerial performance is the focus of our investigation in this section.
Prior research finds that poorly governed firms characterized by, for example, less independent
boards (Weisbach (1988)) and busier boards (Fich and Shivdasani (2006), are less likely to
terminate poorly performing CEOs. We hypothesize that the logistical difficulties, information
deficiency, and lack of familiarity with U.S. management, accounting, and corporate governance
practices impair FIDs’ ability to evaluate managerial competence and make them more reluctant
to either instigate or support management changes.
To test our conjecture, we construct a sample of 8,461 firm-year observations by merging
our IRRC sample with the ExecuComp database. Jenter and Kanaan (2010) identify all CEO
turnovers for ExecuComp firms from 1993 to 2001 by comparing the identity of a firm’s CEO in
two consecutive years. For each turnover event, they locate its announcement date by searching
new reports in Factiva, and then follow the criteria used by Parrino (1997) to classify whether the
turnover is voluntary or forced. Specifically, a turnover is classified as forced if the press reports
that the departing CEO is fired, forced out, or retires/resigns due to policy differences or pressure.
In addition, for departing CEOs below age 60, a turnover is also classified as forced if either the
press does not report the reason for departure as death, poor health, or the acceptance of another
26
position (including the chairmanship of the board), or the press reports that the CEO is retiring,
but does not announce the retirement at least six months before the succession. We follow the
same data collection procedure and expand Jenter and Kanaan’s turnover dataset to 2006.34
In our
IRRC-ExecuComp merged sample, there are a total of 988 CEO turnovers, of which 265 (or
27%) are forced. The unconditional probability of either a voluntary or forced turnover is almost
12% and forced turnovers have an unconditional probability of a little over 3%.
We estimate a probit model where the dependent variable is equal to one if a firm
experiences a forced CEO turnover in a given year. The key explanatory variables are the firm’s
industry-adjusted return on assets (ROA) over the previous fiscal year and its interaction term
with the indicator variable for FID presence. We use accounting returns rather than stock returns
as our performance metric because the latter also incorporates the probability of future CEO
turnovers and thus, suffers from a look-ahead bias (Weisbach (1988)). We expect the probability
of forced CEO turnovers to be negatively related to prior operating performance. Our main focus,
however, is on the coefficient of the interaction term, as a positive coefficient would indicate that
FID presence reduces a board’s responsiveness to poor firm performance relative to its industry
peers in making CEO retention/dismissal decisions and vice versa. The probit model also controls
for the same set of firm financial and governance characteristics used in the earnings restatement
and CEO compensation regressions.
We present the results from the CEO dismissal regressions in Table VII. In column (1),
we find that the industry-adjusted ROA has a significantly negative coefficient, indicating that
poorly performing CEOs are more likely to be terminated. This is consistent with the evidence
from numerous prior studies (see, e.g., Coughlan and Schmidt (1985), Weisbach (1988), and Fich
and Shivdasani (2006)). In column (2), we find that the interaction term between FID presence
and industry-adjusted ROA has a significantly positive coefficient, suggesting that boards with
FIDs are less likely to remove poorly performing CEOs. Untabulated results show that the
34 We thank Dirk Jenter and Fadi Kanaan for generously sharing their CEO turnover data.

27
coefficient on the interaction term remains significantly positive, even when we include
interaction terms between operating performance and all the major governance variables used in
the probit regression. This suggests that the effect of FID presence on the sensitivity of forced
CEO turnover to performance is not due to other governance mechanisms. To further ensure that
our findings are not driven by any spurious correlation between FID presence and the CEO
turnover-performance sensitivity, we run a placebo test by estimating a probit model of voluntary
CEO turnovers. Results presented in columns (3) and (4) show that FID presence is not
significantly related to the relation between voluntary CEO turnovers and firm performance.35
Overall, the evidence we present in this section suggests that FID presence undermines the
effectiveness of boards in handling one of its most important tasks, i.e., critically evaluating
managerial performance and replacing underperforming CEOs when necessary.
VIII. Analysis of Firm Performance
Evidence in the prior sections indicates that FIDs bring firms both benefits (through
valuable counsel) and costs (through lax monitoring). In this section, we evaluate the net impact
of FIDs on firm performance. Our primary measure of firm performance is ROA, defined as the
ratio of earnings before interest, taxes, depreciation and amortization (EBITDA, Compustat item
13) over year-end book value of total assets (item 6).36
If the value added by FIDs’ international
expertise outweighs the elevated agency costs caused by their lax monitoring, we should observe
a positive relation between FID presence and ROA; otherwise, a negative relation.
VIII-A. OLS Regressions of ROA
We first estimate OLS regressions of ROA against the presence of FIDs while controlling
for a wide array of firm financial and governance characteristics found in the prior literature to be
35 The number of observations is reduced to 8,196 since we exclude firm-years with forced turnovers. 36 Our results are robust to computing ROA as net income (item 18) divided by total assets.
28
related to firm performance. In particular, we control for the percentage of a firm’s total sales
from foreign operations, which measures the importance of the firm’s foreign operations and/or
its degree of global diversification. This variable is positively correlated with the presence of
FIDs (see Table II), consistent with firms with substantial foreign operations being more likely to
hire foreign independent directors for their expertise, and it may be negatively correlated with
firm performance, based on the evidence in Denis, Denis, and Yost (2002) that globally
diversified firms exhibit underperformance. Therefore, without controlling for the percentage of
foreign sales, we may uncover some spurious relationship between FID presence and firm
performance.
Panel A of Table VIII presents the OLS regression results. In column (1), we find that the
FID indicator has a negative effect on ROA that is significant at the 1% level. In economic terms,
everything else being equal, the ROA of firms with FIDs is about 0.01 lower than that of firms
without FIDs. This evidence suggests that the costs of FIDs appear to outweigh the benefits,
resulting in firm underperformance.
In column (2), we explore whether the effect of FIDs on firm performance varies with the
importance of a firm’s operations in the FID home region. Our conjecture is that firms derive
more benefits from FIDs if they have more significant operations in their FID’s home region. To
test this hypothesis, we construct an interaction term between the FID indicator and a firm’s
percentage of sales from its FID’s home region, and re-estimate the regression in column (1) with
the interaction term as an additional explanatory variable.37
Results presented in column (2) offer
some support for our conjecture. Specifically, the FID indicator itself continues to have a
significantly negative coefficient, but the coefficient estimate on the interaction term is positive,
albeit insignificant.
37 About 50% of firm-year observations with FIDs report sales from their FID’s home region and the
average percentage of sales from the FID’s home region is about 12.4%.
29
With respect to control variables, we find that larger firms tend to be more profitable,
while companies engaging in more R&D activities are less profitable presumably as a result of
the immediate expensing of R&D expenditures. In addition, foreign sales contribute negatively to
firm profitability, offering a possible explanation for the finding in Denis, Denis and Yost (2002)
that globally diversified firms tend to trade at a discount. Both stock beta and stock return
volatility have significantly negative associations with ROA. The coefficients on the governance
variables such as board structure and stock ownership are consistent with the evidence from
Morck, Shleifer, and Vishny (1988), McConnell and Servaes (1990), Yermack (1996), Fich and
Shivdasani (2006), and Masulis, Wang, and Xie (2007).
VIII-B. Endogeneity of Foreign Directors on Board
A common problem that plagues OLS regressions of firm performance is the endogeneity
issue. In our context, the problem arises when FIDs are not randomly distributed among firms and
their presence in a firm may be determined by factors related to the firm’s demand for FIDs and
the willingness of FID candidates to join the firm. If some of these factors correlate with firm
performance, but are not adequately controlled for in performance regressions, then measures of
FID presence could be correlated with the error terms of performance regressions, thereby biasing
the OLS coefficient estimates. For example, it is possible that entrenched CEOs enjoy more
managerial slack and extract greater private benefits, which hurt firm performance, and such
CEOs may also encourage the appointment of outside directors with constrained monitoring
ability, such as foreign directors and busy directors, to preserve their control.
We employ two econometric approaches to address the endogeneity problem.38
The first
one is a firm fixed-effects regression, which controls for any time-invariant firm-specific factors
38 The ideal strategy to deal with this endogeneity problem is to utilize natural or quasi-natural experiments
in which the value of the endogenous variable is driven by an exogenous shock. However, these
experiments are rare in the finance realm with very few exceptions such as the 1980 oil price increase
examined by Lamont (1997) and the passage of the Sarbanes-Oxley Act (2002).
30
that relate to both firm performance and FID presence, mitigating concerns about omitted
variables. However, firm fixed-effects regressions may lack power to detect the effects of slow-
changing explanatory variables such as ownership structure and board characteristics (Zhou
(2001)). In addition, it is unclear whether the within-firm time-series variations of the explanatory
variables, which these regressions rely on, are exogenous themselves.39
With these caveats in
mind, we estimate a firm fixed-effects regression of ROA against FID presence and its interaction
with the percentage of sales from the FID home region. The results are reported in column (3) of
Panel A, Table VIII. We find that firm performance is negatively related to the FID indicator, but
positively related to the interaction term, with both relations statistically significant. This
evidence paints a more nuanced picture of the effect of FIDs. For firms with low presence in their
FID’s home region, the benefits brought forth by FIDs are dominated by the agency costs of their
lax monitoring. However, FIDs make increasingly greater contributions to firm performance as
firms generate a larger percentage of sales from operations in the FID’s home region, reflecting
the benefits of FID local expertise.
We complement the firm fixed-effects regression with an instrumental variable (IV)
approach where we estimate ROA regressions in a two-stage least square (2SLS) framework. We
construct two instrumental variables. The first variable captures the intuition that FIDs may prefer
to sit on boards of firms whose headquarters they can more easily reach, and it is defined as an
indicator variable equal to one if a firm’s headquarters is located within 100 kilometers of one of
the top-10 international airports in the U.S. 40, 41
The second variable captures the idea that firms
39 Another limitation of the fixed effects regression is that in order to eliminate the endogeneity problem,
both firm and CEO fixed effects may be required, along with matching equations that account for
endogenous sorting between firms and managers. We thank the referee for pointing this out. 40 The top-10 U.S. airports in terms of international passenger traffic are New York (JFK, La Guardia, and
Newark), Miami, Los Angeles, Chicago, San Francisco, Atlanta, Washington DC (Dulles), Boston, Detroit, and Houston. We exclude Honolulu and Orlando due to their tourist destination status and Agana, Guam
due to its geographic separation from the continental U.S. We thank Richard Champley at the United States
Department of Commerce (DOC) for providing us the information. The DOC started compiling such
information from 2003. Other than occasional shuffles in relative ranking, there was no change in the list’s
composition between 2003 and 2006.
31
with a greater overseas reputation may be more likely to attract FIDs. To measure a firm’s
overseas reputation, we create an indicator variable equal to one for firms that are cross-listed on
a foreign exchange at the beginning of our sample period and expect it to be positively related to
FID presence. To qualify as proper instruments, these variables need to be correlated with the
endogenous regressors (i.e., the validity requirement), but uncorrelated with the error terms from
ROA regressions (i.e., the exclusion restriction).42
In the first stage, we estimate a probit model where the dependent variable is the FID
indicator and report the results in Panel B of Table VIII. We find that our IVs satisfy the validity
requirement since they are significantly and positively related to FID presence. The marginal
effects of the IVs are 0.031 and 0.046, respectively, suggesting that all else being equal, the
probability of having a FID is 3.1 percentage points higher for firms located within 100
kilometers of a top-10 U.S. international airport and 4.6 percentage points higher for cross-listed
firms. These effects are economically meaningful, given that the unconditional probability of FID
presence is about 12.7% for our sample. In addition, when we estimate the probit model as a
linear probability model, we find that the adjusted partial R-squared attributable to the IVs is
highly significant at the 1% level.
In Panel C of Table VIII, we estimate the second-stage regressions where the dependent
variable is ROA and the FID indicator is replaced by its instrumented value from the first stage.
The model specifications are otherwise identical to those in Panel A. Results presented in column
(1) show that FID presence on average continues to have a significant and negative effect on
ROA, reaffirming the evidence from the OLS regressions in Panel A. An advantage of having
41 A growing body of research uses geography-base variables to explain cross-sectional variations in firm
characteristics and policies. See, e.g., Kedia and Rajgopal (2009), Hochberg and Lindsey (2010), Becker,
Cronqvist, and Fahlenbrach (2010), and Knyazeva, Knyazeva, and Masulis (2011). 42 Prior studies, e.g., Doidge, Karolyi, and Stulz (2004), show that foreign firms cross listed in the U.S. are associated with higher valuations, but there is no evidence that U.S. firms are worth more when listed
aboard, probably because the high standards of corporate governance and disclosure and the developed
capital markets in the U.S. make any potential benefits from cross listing in a foreign country minimal.
Nevertheless, we conduct an over-identification test later to ensure that our cross-listing variable passes the
exclusion restriction.
32
two IVs and only one endogenous regressor is that we can conduct an overidentification test of
whether the IVs satisfy the exclusion restriction. We find that they do; the Hansen-Sargan J
statistic for the overidentification test has a p-value of 0.20, which means we are unable to reject
the null hypothesis that both instruments are exogenous. Column (2) of Panel C presents the
results from the second-stage ROA regression that include the interaction term between FID
presence and a firm’s percentage of sales from its FID’s home region as an additional regressor.
The FID indicator continues to have a significantly negative coefficient and the coefficient
estimate on the interaction term is significantly positive, echoing the results from the firm fixed-
effects regression.
VIII-C. Regression Analysis of Tobin’s Q
We also estimate regressions of Tobin’s Q as a measure of firm value.43
We calculate
Tobin’s Q as a firm’s market value of assets over its book value of assets, where we compute the
market value of assets as the book value of assets (item 6) plus the market value of common stock
(item 25 × item199) minus the book value of common stock (item 60). The first two columns in
Panel A of Table IX present the coefficient estimates from OLS regressions controlling for year
and industry fixed effects. In column (1), when the FID indicator itself is included as an
explanatory variable, it has a significant and negative effect on Tobin’s Q. This result suggests
that FID presence lead to a discount in firm valuation, consistent with the negative effect of FID
presence on firm operating performance found earlier. In column (2), when both the FID indicator
and its interaction with the firm’s percentage of sales from the FID’s home region are included as
regressors, the FID indicator itself retains its significantly negative coefficient, and the coefficient
for the interaction term is positive, but insignificant.
43 We recognize that Tobin’s Q can also proxy for investment opportunities and may at times be subject to
the influence of market misvaluations. Erickson and Whited (2006) also discuss the measurement issues
with different constructs of Tobin’s Q. Nonetheless, we examine the relation between FID presence and
Tobin’s Q as a supplement to our analysis of ROA so as to provide a more complete picture about the
effect of FIDs on firm performance.
33
To address the endogeneity of FID presence, we first estimate a firm fixed-effects
regression and report the results in column (3) of Panel A of Table IX. Consistent with the OLS
results, the FID indicator has a positive coefficient and its interaction term has a negative one,
although both are insignificant, most likely due to a lack of sufficient time-series variation. We
then resort to 2SLS regressions using the two IVs introduced in the previous section. The second-
stage results reported in Panel B of Table IX show that the FID indicator has a significant and
negative effect on Tobin’s Q, while its interaction term has a significant and positive coefficient,
echoing the evidence from the operating performance analysis. Our findings on the control
variables are largely in line with the prior literature (Morck, Shleifer, and Vishny (1988),
McConnell and Servaes (1990), Yermack (1996), Gompers, Ishii, and Metrick (2003), and Fich
and Shivdasani (2006)).
Overall, our analysis of ROA and Tobin’s Q suggests that firms reap more benefits from
having FIDs when they have larger operations in the FID’s home region, but FID presence has a
negative effect on firm performance when a strong business presence in the FID’s home region is
lacking, indicating that in such instances the costs of FIDs’ lax monitoring outweigh the benefits
from their expertise. The existence of a negative relation between FID presence on the board and
firm performance suggests that there are some transaction costs or impediments that make it
difficult for firms to remove FIDs from their boards.44
Several constraints of this nature come to
mind. First, removing a director before his/her term expires may negatively impact a firm’s
reputation in the corporate director labor market and hinder its future director recruiting efforts.
Second, in about 60% of our sample firms, director terms are staggered, so only one third of
directors stand for election every year. Thus, it can take up to three years for directors to be
removed through the election process. Finally, the evidence in our paper suggests that CEOs
benefit from lax monitoring by FIDs. They appear to be able to extract more private benefits of
control and become more entrenched with FIDs on board. Therefore, CEOs have little or no
44 For further discussion of this issue, see Coles (2008). We thank the referee for suggesting this point.
34
incentive to agitate for the removal of FIDs and in fact can have substantial incentives to
recommend including them. Given the important role that CEOs can play in the director
appointment process, it is not surprising that firms continue to employ FIDs despite the adverse
effects we identify.
IX. Announcement Effects of Foreign Independent Director Appointments
As our final test of the net effect of FIDs, we construct an uncontaminated sample of
announcements of FID appointments and examine how the stock market reacts to such events.
Previous studies beginning with Rosenstein and Wyatt (1990) have used this approach to evaluate
a director’s contribution to board effectiveness and firm value.
For FIDs in our sample, we gather information on when they joined their current boards
and search Lexis-Nexis Academic around that time for the first public disclosure date of the
appointments. We exclude appointments whose initial public disclosure is through a proxy
statement filing, since proxy statements contain myriad of other information such as corporate
ownership structure and executive compensation and perquisite commitments, making it difficult
to attribute any stock price reactions around proxy mailing date to any particular piece of
information in the proxy. This initial process gives us 247 non-proxy announcements of FID
appointments. We then remove those contaminated by confounding events such as
announcements of earnings, management turnover, acquisitions, restructurings, dividends and
stock repurchases. We also drop announcements of multiple director appointments. Panel A of
Table X provides a complete list of confounding events and their frequency. The final sample
contains 91 “clean” announcements of FID appointments between 1982 and 2006, with 36% of
them taking place prior to our sample period.
We follow the event study methodology in Brown and Warner (1980) and estimate the
cumulative abnormal returns (CARs) over a 3-day event window (-1, +1) with event date 0 being
the announcement date. We estimate the coefficients of a standard market model using daily
35
stock returns over the period (-210, -11) and the CRSP value-weighted return as the market
return. Panel B of Table X presents the event study results. On average the market reacts
negatively to firms’ decision to bring FIDs on board, as the 3-day CARs have a mean of -0.56%
and a median of -0.46%, both statistically significant with two-sided p-values of 0.054 and 0.015,
respectively. This finding is consistent with the expectation by shareholders of U.S. companies
that the costs generated by FIDs in the form of weakened board effectiveness and increased
agency problems exceed the benefits their expertise will bring.
We then explore cross-sectional variations in the stock price reactions to FID
appointments by regressing announcement-period CARs against appointing-firm and FID-home
country characteristics. Specifically, the explanatory variables we use are the appointing firm’s
market capitalization, ROA, Tobin’s Q, and percentage of sales from the FID’s home region, and
the FID home country’s GDP per capita, GDP growth rate, and anti-director rights index (La
Porta et al. (1997) and Spamann (2010)). Firm-level variables are measured at the fiscal year end
prior to FID appointments, and GPD data are for the calendar year prior to FID appointments. We
expect the announcement effects to be positively related to a firm’s Tobin’s Q and the percentage
of sales from the FID’s home region, with the former proxying for the firm’s growth
opportunities and the latter capturing the extent to which the firm can benefit from FID
presence.45
We also expect FID-appointment announcement returns to increase with a FID home
country’s GDP growth rate and anti-director rights index, since faster growing economies can
offer greater opportunities for overseas expansion by U.S. firms and FIDs from countries with
better corporate governance are less likely to display lax monitoring that plague FIDs in general.
Despite the small sample size, we find ample support for our conjectures. Specifically,
results presented in Table XI show that Tobin’s Q, GDP growth rate, and the anti-director rights
index all have positive effects on announcement-period CARs that are significant at the 10%
45 FIDs’ knowledge and understanding of their home markets would be most valuable to U.S. firms making
an initial entry into those regions. Thus, ideally we would like to measure a U.S. firm’s plan to enter a
foreign market, but such an ex-ante proxy is difficult to construct.
36
level. As expected, the percentage of appointing firm’s sales from the FID’s home region has a
positive coefficient, but it is insignificant, likely due to the small sample size.
Finally, we compare FID appointments to domestic independent director (DID)
appointments by the same FID appointing firms. For each FID appointing firm analyzed in Panels
A and B of Table X, we determine when its DIDs were initially appointed and search Lexis-Nexis
Academic around that time for the first non-proxy public disclosure date of each appointment.
We identify 458 announcements of DID appointments. After removing those contaminated by
confounding events, we obtain a sample of 210 “clean” announcements (see Panel C of Table X).
The cumulative abnormal return over the 3-day event window (-1, 1) has a mean of 0.58% (two-
sided p-value: 0.019) and a median of 0.16% (two-sided p-value: 0.077). The mean difference in
announcement returns between FID and DID appointments is significant with a p-value of 0.012
and the median difference is also significant with a p-value of 0.008 (see Panel D of Table X).
The evidence indicates that shareholders view appointments of DIDs significantly more favorably
than those of FIDs.46
X. Additional Analysis47
X-A. Differentiating among foreign directors
46 An alternative explanation for the event study evidence is that FID appointments may signal a company’s
intention to pursue growth opportunities beyond its national border, which investors may view as an
indication of either the exhaustion of domestic growth opportunities or planned global empire building by
managers. Either interpretation could cause the company’s stock price to drop. We examine the 3-year
average domestic sales growth before FID appointments to see whether FID appointments tend to follow
declines in domestic businesses. We also examine the 3-year average domestic sales growth after FID
appointments to see whether FID appointments tend to foreshadow declines in domestic operation. Neither
analysis yields a significant difference between FID appointing firms and their industry peers, indicating
that FID appointing firms do not experienced any slowdown in domestic businesses in comparison to their
industry peers. We further examine whether FID appointments tend to be followed by significant growth in foreign operation, and again find no evidence of greater foreign sales growth rate for FID appointing firms
compared to their industry peers. While it is difficult to completely rule out this signaling explanation, our
analysis indicates that it is unlikely to be entirely responsible for the negative market reactions to FID
appointments. 47 All results in this section are available upon request.
37
We delve into the cross section of countries where FIDs come from and single out
Canada and Mexico. Canada stands out from other foreign countries for two reasons. First, most
major Canadian cities are near the Canada-U.S. border, and there are few restrictions on traveling
from Canada to the U.S., especially for Canadian citizens. The geographic proximity coupled
with being in the same time zones also makes it easier for Canadian directors to follow news
development in the U.S., especially in areas near the Canada-U.S. border. Therefore, the time and
energy drain is less for Canadian directors to perform their oversight and advisory functions at
U.S. companies. Second, Canada shares many similarities with the U.S. in terms of culture,
political and economic systems, commercial laws, shareholder protections and accounting
standards. For example, both countries are governed by a common law legal system, have the
same level of shareholder rights index and similar accounting disclosure quality, and have strong
systems of law enforcement (La Porta et al. (1997)). Mexico also warrants separate attention
because it shares a long border with the U.S. However, unlike Canada, many large Mexican cities
are not located close to the U.S. border, and traveling to U.S. from Mexico requires a visa. In
addition, Mexico differs from the U.S. in nearly as many aspects as Canada is similar to the U.S.,
such as economic development, legal system, investor protection, language, and culture.
A re-examination of directors’ board meeting attendance indicates that the attendance
records of Canadian directors are significantly better than those of other FIDs and are
indistinguishable from those of domestic directors, while Mexican directors miss board meetings
as often as other non-Canadian FIDs. In light of the similar board meeting attendance behavior of
Canadian directors and domestic directors, we reclassify Canadian directors as domestic and
redefine the FID presence measures accordingly. This lowers the percentage of firm-year
observations with FIDs to 11%. We repeat all our earlier analysis using the revised FID presence
measures, and find that our results continue to hold. As another robustness check, we also create
two indicator variables for the presence of Canadian FIDs and non-Canadian FIDs, respectively,
and use them to substitute for the FID indicator in our regressions. We find that the Canadian-FID
38
indicator has insignificant effects on specific corporate policies and overall firm value and
performance, while the indicator for non-Canadian FIDs has significant and adverse impact on
board decision making and corporate performance and value.
We also separately examine FIDs from the U.K. Despite the similarities in language,
culture, legal origin and investor protection between the U.S. and U.K., we find that U.K.
directors are still significantly more likely to miss board meetings than domestic directors, and
their presence contributes to a greater likelihood of earnings restatement, higher CEO
compensation, lower CEO turnover-performance sensitivity, and poorer firm performance. These
results are consistent with geographic distance preventing FIDs from being effective monitors of
management, even when they come from countries similar to the U.S.
X-B. Corporate Governance in FIDs’ Home Countries
Our explanation for the lax monitoring by FIDs is that the logistical difficulties and
information disadvantage that FIDs face due to their geographic location undermine their
incentives and ability to provide adequate management oversight. Another dimension of FIDs’
geography location is the corporate governance of their home countries. Given the strength of
U.S. shareholder rights and law enforcement (La Porta et al. (1997)), many FIDs are from
countries with weaker investor protections and legal systems. As a result, they may be less
sensitive to poor corporate governance and managerial self-serving behavior than U.S. based
independent directors, who are accustomed to higher standards. This low sensitivity toward
protecting shareholder interests may contribute to the negative effects of FID presence on
corporate decision making, firm performance, and shareholder value.
We examine this conjecture by creating interaction terms between FID presence and the
FID home country’s anti-director rights index (La Porta et al. (1997) and Spamann (2010)) and
anti-self dealing index (Djankov et al. (2008)). We include these interaction terms as additional
explanatory variables in earnings restatement, CEO compensation, CEO turnover, and firm
39
performance regressions, but none of these interaction terms has a significant coefficient.
However, we do find that FIDs from weak corporate governance countries display an even
greater tendency to miss board meetings than FIDs from strong corporate governance countries.
Therefore, there is some evidence that the corporate governance environment of a FID’s home
country matters, but it is primarily the logistical and informational challenges created by
geographic distance that drive the monitoring deficiencies of FIDs.
X-C. FIDs from Cross-border Acquisitions
One potential source of a negative relation between FID presence and firm performance
is cross-border acquisitions. Specifically, when a U.S. firm acquires a relatively large foreign
target, some target directors may join the acquirer’s board. To the extent that the acquisition
destroys shareholder value and causes the U.S. firm to underperform (Moeller and Schlingemann
(2005)), a negative correlation between FID presence and firm performance would result.48
To
rule out this alternative explanation, we obtain from SDC a list of U.S. companies that acquired at
least one foreign target from 1995 to 2006.49
We also require that the deal value exceed 5% of the
acquirer’s market value of assets, so that some target board members are likely to be appointed to
the board of the combined firm. There are 284 such firms in our sample. We repeat our analyses
excluding these observations and obtain very similar results. Therefore, cross-border acquisitions
do not appear to drive our findings on the relation between firm performance and FID presence.
XI. Conclusions
In this study we examine independent directors of U.S. firms who are based in foreign
countries, and investigate how their geographic location affects their ability to perform their
48 Note that this explanation cannot explain our evidence on board meeting attendance, earnings
restatement, CEO compensation, and FID appointment announcement returns. 49 To the extent that cross-border acquisitions have long-term effects on firm performance, acquisitions that
occur prior to our sample period of 1998 to 2006 may continue to affect firm performance during our
sampler period. To account for this possibility, we include the three years preceding our sample period.
40
monitoring and advisory duties. About 13% of U.S. firms have foreign independent directors on
their boards. On the positive side, FIDs can utilize their international background and expertise to
enhance the advisory function of boards and benefit firms with substantial foreign operations or
plans for overseas expansion. On the negative side, the geographic distance between FIDs and
corporate headquarters, as well as national borders with passport and custom controls create
significant obstacles for FIDs to effectively participate in the governance of U.S. firms.
Our analysis of specific actions undertaken by directors and corporate policies they help
formulate indicates that FIDs bring both benefits and costs to the firms they serve. Specifically,
we find that firms with FIDs make better cross-border acquisitions when they pursue targets from
the home regions of FIDs, evidence of the value added by FID expertise. However, we also find
that FIDs are more likely to miss board meetings than domestic independent directors, and that
firms with FIDs pay their CEOs excessively high compensation, are more likely to engage in
intentional financial misreporting, and are less responsive in replacing poorly performing CEOs.
These findings point to the monitoring deficiencies of FIDs and suggest that they undermine the
effectiveness of board oversight and contribute to more managerial slack and misbehavior.
We next evaluate the net effect of FIDs on firm performance. Our results show that firms
with FIDs exhibit significantly poorer performance, especially when they do not have significant
business presence in the FID’s home region, consistent with costs of FIDs outweighing benefits
in such instances. But, as firms generate a higher percentage of total sales from their operation in
the FID’s home region, they derive more benefits from FID expertise. We also find that the
announcements of FID appointments elicit significantly negative stock market reactions,
signaling shareholder skepticism about FID contributions to firm value. Overall, our findings call
for a balanced approach toward the hiring of foreign independent director by U.S. firms, and
suggest that a careful cost-benefit analysis is warranted in such decisions.
The same considerations should also apply to non-U.S. firms. Companies from countries
with weak investor protection may benefit from appointing outside directors from countries with

41
stronger investor protection as a way of improving board monitoring and overall corporate
governance. However, given the obstacles faced by foreign directors as accentuated by our study
and the experiences of Korean companies, it is unclear if the expected benefits outweigh the
expected costs. Further research on this issue is clearly needed. In the short run, any foreign
director appointment decision needs to be well thought out, since it may have the unintended
negative consequence of weakening corporate governance rather than strengthening it.
42
References
Adams, R.B., and Ferreira, D., 2007. A theory of friendly boards. Journal of Finance 62, 217-
250.
Adams, R.B., and Ferreira, D., 2009. Women in the boardroom and their impact on governance
and performance. Journal of Financial Economics 94, 291-309.
Adams, R.B., Hermalin, B.E., and Weisbach, M.S., 2009. The role of boards of directors in
corporate governance: A conceptual framework & survey. Journal of Economic
Literature, forthcoming
Agrawal, A., and Chadha, S., 2005. Corporate governance and accounting scandals. Journal of
Law and Economics 48, 371-406.
Agrawal, A., and Knoeber, C., 2001. Do some outside directors play a political role? Journal of
Law and Economics 44, 179-198.
Andrade, G., Mitchell, M., and Stafford, E., 2001. New evidence and perspectives on mergers,
Journal of Economic Perspectives 15, 103-120.
Bae, K., Stulz, R.M., and Tan, H., 2008. Do local analysts know more? A cross-country study of
performance of local analysts and foreign analysts. Journal of Financial Economics 88,
581-606.
Becker, B., Cronqvist, H., and Fahlenbrach, R., 2010. Estimating the effects of large shareholders
using a geographic instrument. Journal of Financial and Quantitative Analysis,
forthcoming.
Bertrand, M., and Mullainathan S., 1999. Corporate governance and executive pay: Evidence
from takeover legislation. Working paper, University of Chicago and Harvard University.
Bhagat, S., and Black, B., 1999. The uncertain relationship between board composition and firm
performance. Business Lawyer 54, 921-963.
43
Boone, A., Field, L., , Karpoff, J., and Raheja, C., 2007. The determinants of corporate board size
and composition: an empirical analysis. Journal of Financial Economics 85, 66–101.
Booth, J.R., and Deli, D.N., 1996. Factors affecting the number of outside directorships held by
CEOs. Journal of Financial Economics 40, 81-104.
Borokhovich, K.A., Brunarski, K.R., and Parrino, R., 1997. CEO contracting and antitakeover
amendments. Journal of Finance 52, 1495-1517.
Brickley, J.A., Coles, J.L., and Terry, R.L., 1994. Outside directors and the adoption of poison
pills. Journal of Financial Economics 35, 371-390.
Brickley, J.A., and Zimmerman, J.L., 2010. Corporate governance myths: Comments on
Armstrong, Guay, and Weber. Working Paper, University of Rochester.
Brown, S., and Warner, J., 1980. Measuring security price performance. Journal of Financial
Economics 8, 205-258.
Burns, N., and Kedia, S., 2006. The impact of performance-based compensation on misreporting.
Journal of Financial Economics 79, 35-67.
Byrd, J.W., and Hickman, K.A., 1992. Do outside directors monitor managers? Evidence from
tender offer bids. Journal of Financial Economics 32, 195–221.
Cai, J., Garner, J.L., and Walkling R.A., 2009. Electing directors. Journal of Finance 64, 2389-
2421.
Chhaochharia, V., and Grinstein, Y., 2007. Corporate governance and firm value: The impact of
the 2002 governance rules. Journal of Finance 62, 1789-1825.
Coles, J., 2008. Disclosure policy: A discussion of Leuz, Triantis, and Wang (2008) on “going
dark.” Journal of Accounting and Economics 45, 209-220.
Coles, J., Daniel, N., and Naveen, L., 2010. Co-opted boards. Working paper, Arizona State
University.

44
Core, J.E., Holthausen, R.W., and Larcker, D.F., 1999. Corporate governance, chief executive
officer compensation, and firm Performance. Journal of Financial Economics 51, 371-
406.
Coughlan, A., and Schmidt, R., 1985. Executive compensation, management turnover, and firm
performance: An empirical investigation. Journal of Accounting and Economics 7, 43-66.
Coval, J., and Moskowitz, T., 1999. Home bias at home: Local equity preference in domestic
portfolios. Journal of Finance 54, 2045-2073.
Coval, J., and Moskowitz, T., 2001. The geography of investment: Informed trading and asset
prices. Journal of Political Economy 109, 811-841.
Denis, D.J., Denis, D.K., and Yost, K., 2002. Global diversification, industrial diversification, and
firm value. Journal of Finance 57, 1951-1979.
Djankov, S., La Porta, R., Lopez-de-Silanes, F., and Shleifer, A., 2008. The law and economics of
self-dealing. Journal of Financial Economics 88, 430-465.
Doidge, C., Karolyi, G.A., and Stulz, R.M., 2004. Why are foreign firms listed in the U.S. worth
more? Journal of Financial Economics 71, 205-238.
Eckbo, E., Thorburn K., 2000. Gains to bidder firms revisited: Domestic and foreign acquisitions
in Canada. Journal of Financial and Quantitative Analysis 35, 1-25.
Eisenberg, T., Sundgren, S., and Wells, M.T., 1998. Larger board size and decreasing firm value
in small firms. Journal of Financial Economics 48, 35-54.
Erickson, T., and Whited, T., 2006. On the accuracy of different measures of Q. Financial
Management 35, 5-33.
Fahlenbrach, R., 2009. Shareholder rights, boards, and CEO compensation. Review of Finance
13, 81-113.
Fahlenbrach, R., Low, A., and Stulz, R.M., 2009. Why do firms appoint CEOs as outside
directors? Journal of Financial Economics forthcoming.

45
Fama, E.F., and French, K.R., 1997. Industry costs of equity. Journal of Financial Economics 43,
153-194.
Fich, E.M., and Shivdasani, A., 2006. Are busy boards effective monitors? Journal of Finance
61, 689-724.
Fuller, K., Netter, J., and Stegemoller, M., 2002. What do returns to acquiring firms tell us?
Evidence from firms that make many acquisitions. Journal of Finance 57, 1763-1794.
Gompers, P., Ishii, J., and Metrick, A., 2003. Corporate governance and equity prices. Quarterly
Journal of Economics 118, 107-155.
Gompers, P., Ishii, J., and Metrick, A., 2009. Extreme governance: An analysis of dual-class
companies in the United States. Review of Financial Studies forthcoming.
Grinblatt, M., and Keloharju, M., 2001. Distance, language, and culture bias: The role of investor
sophistication. Journal of Finance 56, 1053-1073.
Harris, M., and Raviv, A., 2008. A theory of board control and size. Review of Financial Studies
21 (4): 1797-1832.
Hennes, K. M., Leone, A.J., and Miller, B.P., 2008. The importance of distinguishing errors from
irregularities in restatement research: The case of restatements and CEO/CFO turnover.
The Accounting Review 83, 1487-1519.
Hermalin, B.E., and Weisbach, M.S., 2003. Boards of directors as an endogenously determined
institution: A survey of the economic literature. FRBNY Economic Policy Review 9, 7-26.
Hochberg, Y., and Lindsey, L., 2010. Incentives, targeting, and firm Performance: An analysis of
non-executive options. Review of Financial Studies, forthcoming.
Huberman, G., 2001. Familiarity breeds investment. Review of Financial Studies 14, 659-680.
Hwang, B., and Kim, S., 2009. It Pays to Have Friends. Journal of Financial Economics 93, 138-
158.
46
Ivkovich, Z., and Weisbenner, S., 2005. Local does as local Is: Information content of the
geography of individual investors common stock investments. Journal of Finance 60,
267-306.
Jensen, M., 1993. The modern industrial revolution, exit and the failure of internal control
systems. Journal of Finance 48, 831-880.
Jenter, D., and Kanaan, F., 2010. CEO turnover and relative performance evaluation. Journal of
Finance, forthcoming.
Kang, J., and Kim, J., 2008. The geography of block acquisitions. Journal of Finance 63, 2817-
2858.
Karpoff, J.M. Lee, D.S., and Martin, G.S., 2008. The cost to firms of cooking the books. Journal
of Financial and Quantitative Analysis 43, 581-612.
Kedia, S., and Rajgopal, S., 2009. Neighborhood matters: The impact of location of broad-based
option plans. Journal of Financial Economics 92 (1), 109-127.
Klein, A., 2002. Audit committee, board of director characteristics, and earnings management.
Journal of Accounting and Economics 33, 375-400.
Knyazeva, A., Knyazeva, D. and Masulis, R., 2011. Local director talent and board composition.
Working paper, University of Rochester.
Lamont, O.A., 1997. Cash flow and investment: Evidence from internal capital markets. Journal
of Finance 52, 83-109.
La Porta, R., Lopez-de-Silanes, F., Shleifer, A., and Vishny, R., 1997. Legal determinants of
external finance. Journal of Finance 52, 1131-1150.
Lehn, K.M., Patro, S., and Zhao, M., 2009. Determinants of the size and composition of US
corporate boards: 1935-2000. Financial Management 38 (4), 747-780.
Lerner, J., 1995. Venture capitalists and the oversight of private firms. Journal of Finance, 50,
320-318.
47
Linck, J.S., Netter, J.M., and Yang, T., 2008. The determinants of board structure. Journal of
Financial Economics 87, 308-328.
Lipton, M., and Lorsch, J.W., 1992. A modest proposal for improved corporate governance.
Business Lawyer 1, 59-77.
Nguyen, B.D., and Nielsen, K., 2010. The value of independent directors: Evidence from sudden
death. Journal of Financial Economics 98, 550-567.
Malloy, C., 2005. The geography of equity analysis. Journal of Finance 60, 719-755.
Masulis, R., Wang, C., and Xie, F., 2007. Corporate governance and acquirer returns. Journal of
Finance 62, 1851-1889.
Masulis, R., Wang, C., and Xie, F., 2009. Agency problems at dual-class companies. Journal of
Finance 64, 1695-1725.
McConnell, J., and Servaes, H., 1990. Additional evidence on equity ownership and corporate
value. Journal of Financial Economics 27, 595-612.
Moeller, S.B., and Schlingemann, F.P., 2005. Global diversification and bidder gains: A
comparison between cross-border and domestic acquisitions. Journal of Banking and
Finance 29, 533-564.
Morck, R., Shleifer, A., and Vishny, R.W., 1990. Do managerial incentives drive bad
acquisitions? Journal of Finance 45, 31-48.
Morck, R., Shleifer, A., and Vishny, R.,W., 1988. Management ownership and market valuation.
Journal of Financial Economics 20, 293-315.
Parrino, R., 1997. CEO turnover and outside succession: A cross-sectional analysis. Journal of
Financial Economics 46 (2), 165-197.
Petersen, M., 2009. Estimating standard errors in finance panel data sets: Comparing approaches.
Review of Financial Studies 22, 435-480.
Rosenstein, S., and Wyatt, J.G., 1990. Outside directors, board independence and shareholder
wealth. Journal of Financial Economics 26, 175-191.

48
Sarkissian, S., and Schill, M.J., 2009. Are there permanent valuation gains to overseas listing?
Review of Financial Studies 22, 371-412.
Sarkissian, S., and Schill, M.J., 2004. The overseas listing decision: New evidence of proximity
preference. Review of Financial Studies 17, 769-809.
Schwert, W., 1996. Markup pricing in mergers & acquisitions. Journal of Financial Economics
41, 153-192.
Spamann, H., 2010. The “antidirector rights index” revisited. Review of Financial Studies 23,
467-486.
Srinivasan, Suraj, 2005, Consequences of financial reporting failure for outside directors:
Evidence from accounting restatements, Journal of Accounting Research 43, 291-
334.
Uysal, V.B., Kedia, S., and Panchapagesan, V., 2008. Geography and acquirer returns. Journal of
Financial Intermediation 17, 256-275.
Vafeas, N., 1999. Board Meeting Frequency and Firm Performance. Journal of Financial
Economics 53, 113-142.
Weisbach, M.S., 1988. Outside directors and CEO turnover. Journal of Financial Economics 20,
431-460.
White, H., 1980. A heteroskedasticity-consistent covariance matrix estimator and a direct test for
heteroskedasticity. Econometrica 48, 817-838.
Yermack, D., 1996. Higher market valuation of companies with a small board of directors.
Journal of Financial Economics 40, 185-212.
Zhou, X., 2001. Understanding the determinants of managerial ownership and the link between
ownership and performance: Comment. Journal of Financial Economics 62, 559-571.
Zhu, N., 2002. The local bias of individual investors. Working Paper, University of California at
Davis.
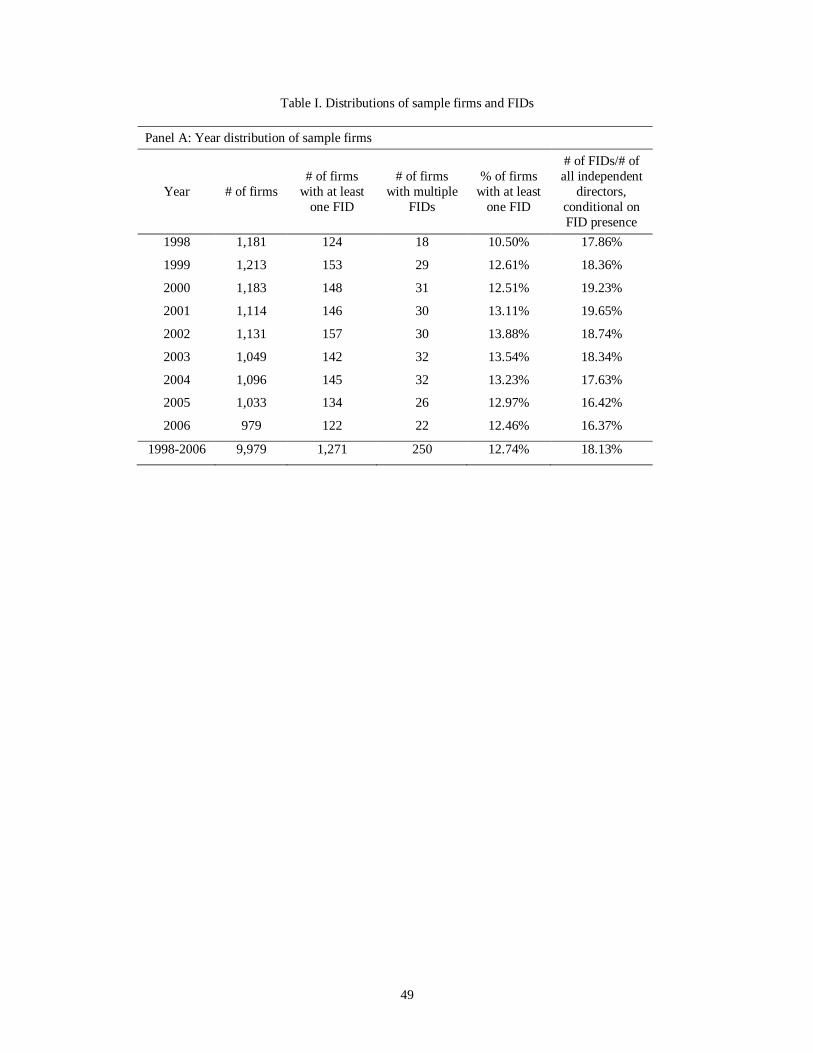
49
Table I. Distributions of sample firms and FIDs
Panel A: Year distribution of sample firms
Year # of firms
# of firms
with at least
one FID
# of firms
with multiple
FIDs
% of firms
with at least
one FID
# of FIDs/# of
all independent
directors,
conditional on
FID presence
1998 1,181 124 18 10.50% 17.86%
1999 1,213 153 29 12.61% 18.36%
2000 1,183 148 31 12.51% 19.23%
2001 1,114 146 30 13.11% 19.65%
2002 1,131 157 30 13.88% 18.74%
2003 1,049 142 32 13.54% 18.34%
2004 1,096 145 32 13.23% 17.63%
2005 1,033 134 26 12.97% 16.42%
2006 979 122 22 12.46% 16.37%
1998-2006 9,979 1,271 250 12.74% 18.13%
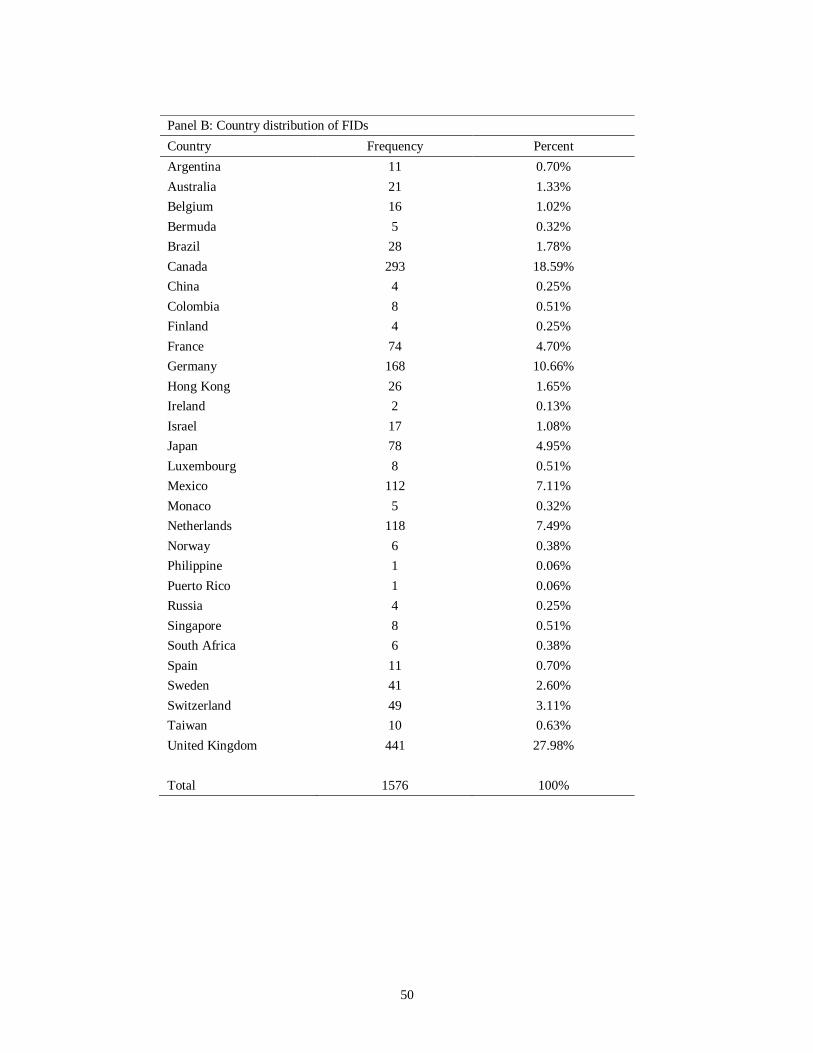
50
Panel B: Country distribution of FIDs
Country Frequency Percent
Argentina 11 0.70%
Australia 21 1.33%
Belgium 16 1.02%
Bermuda 5 0.32%
Brazil 28 1.78%
Canada 293 18.59%
China 4 0.25%
Colombia 8 0.51%
Finland 4 0.25%
France 74 4.70%
Germany 168 10.66%
Hong Kong 26 1.65%
Ireland 2 0.13%
Israel 17 1.08%
Japan 78 4.95%
Luxembourg 8 0.51%
Mexico 112 7.11%
Monaco 5 0.32%
Netherlands 118 7.49%
Norway 6 0.38%
Philippine 1 0.06%
Puerto Rico 1 0.06%
Russia 4 0.25%
Singapore 8 0.51%
South Africa 6 0.38%
Spain 11 0.70%
Sweden 41 2.60%
Switzerland 49 3.11%
Taiwan 10 0.63%
United Kingdom 441 27.98%
Total 1576 100%
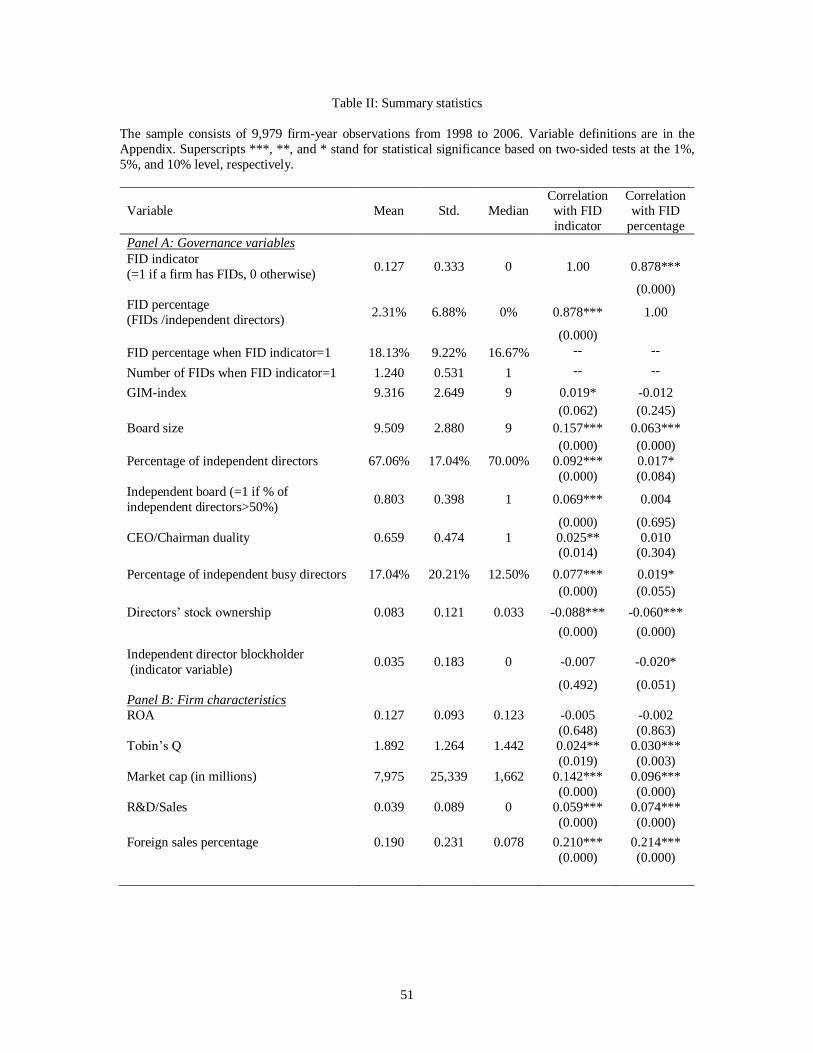
51
Table II: Summary statistics
The sample consists of 9,979 firm-year observations from 1998 to 2006. Variable definitions are in the
Appendix. Superscripts ***, **, and * stand for statistical significance based on two-sided tests at the 1%,
5%, and 10% level, respectively.
Variable Mean Std. Median Correlation with FID
indicator
Correlation with FID
percentage
Panel A: Governance variables
FID indicator
(=1 if a firm has FIDs, 0 otherwise) 0.127 0.333 0 1.00 0.878***
(0.000)
FID percentage
(FIDs /independent directors) 2.31% 6.88% 0% 0.878*** 1.00
(0.000)
FID percentage when FID indicator=1 18.13% 9.22% 16.67% -- --
Number of FIDs when FID indicator=1 1.240 0.531 1 -- --
GIM-index 9.316 2.649 9 0.019* -0.012
(0.062) (0.245)
Board size 9.509 2.880 9 0.157*** 0.063***
(0.000) (0.000)
Percentage of independent directors 67.06% 17.04% 70.00% 0.092*** 0.017*
(0.000) (0.084)
Independent board (=1 if % of
independent directors>50%) 0.803 0.398 1 0.069*** 0.004
(0.000) (0.695)
CEO/Chairman duality 0.659 0.474 1 0.025** 0.010
(0.014) (0.304)
Percentage of independent busy directors 17.04% 20.21% 12.50% 0.077*** 0.019*
(0.000) (0.055)
Directors’ stock ownership 0.083 0.121 0.033 -0.088*** -0.060***
(0.000) (0.000)
Independent director blockholder
(indicator variable) 0.035 0.183 0 -0.007 -0.020*
(0.492) (0.051) Panel B: Firm characteristics
ROA 0.127 0.093 0.123 -0.005 -0.002
(0.648) (0.863)
Tobin’s Q 1.892 1.264 1.442 0.024** 0.030***
(0.019) (0.003)
Market cap (in millions) 7,975 25,339 1,662 0.142*** 0.096***
(0.000) (0.000)
R&D/Sales 0.039 0.089 0 0.059*** 0.074***
(0.000) (0.000)
Foreign sales percentage 0.190 0.231 0.078 0.210*** 0.214***
(0.000) (0.000)
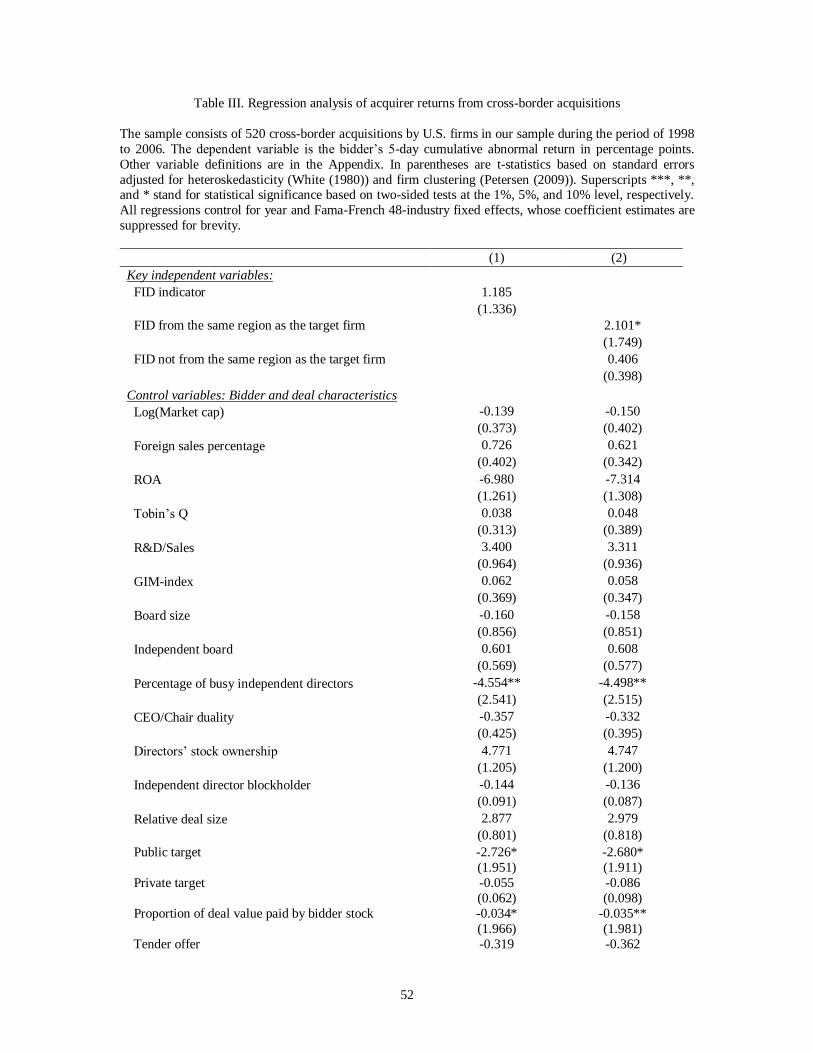
52
Table III. Regression analysis of acquirer returns from cross-border acquisitions
The sample consists of 520 cross-border acquisitions by U.S. firms in our sample during the period of 1998
to 2006. The dependent variable is the bidder’s 5-day cumulative abnormal return in percentage points.
Other variable definitions are in the Appendix. In parentheses are t-statistics based on standard errors
adjusted for heteroskedasticity (White (1980)) and firm clustering (Petersen (2009)). Superscripts ***, **, and * stand for statistical significance based on two-sided tests at the 1%, 5%, and 10% level, respectively.
All regressions control for year and Fama-French 48-industry fixed effects, whose coefficient estimates are
suppressed for brevity.
(1) (2)
Key independent variables:
FID indicator 1.185
(1.336)
FID from the same region as the target firm 2.101*
(1.749)
FID not from the same region as the target firm 0.406
(0.398)
Control variables: Bidder and deal characteristics
Log(Market cap) -0.139 -0.150
(0.373) (0.402)
Foreign sales percentage 0.726 0.621
(0.402) (0.342)
ROA -6.980 -7.314
(1.261) (1.308)
Tobin’s Q 0.038 0.048
(0.313) (0.389)
R&D/Sales 3.400 3.311
(0.964) (0.936)
GIM-index 0.062 0.058
(0.369) (0.347)
Board size -0.160 -0.158
(0.856) (0.851)
Independent board 0.601 0.608
(0.569) (0.577)
Percentage of busy independent directors -4.554** -4.498**
(2.541) (2.515)
CEO/Chair duality -0.357 -0.332
(0.425) (0.395)
Directors’ stock ownership 4.771 4.747
(1.205) (1.200)
Independent director blockholder -0.144 -0.136
(0.091) (0.087)
Relative deal size 2.877 2.979
(0.801) (0.818)
Public target -2.726* -2.680*
(1.951) (1.911)
Private target -0.055 -0.086
(0.062) (0.098)
Proportion of deal value paid by bidder stock -0.034* -0.035**
(1.966) (1.981)
Tender offer -0.319 -0.362
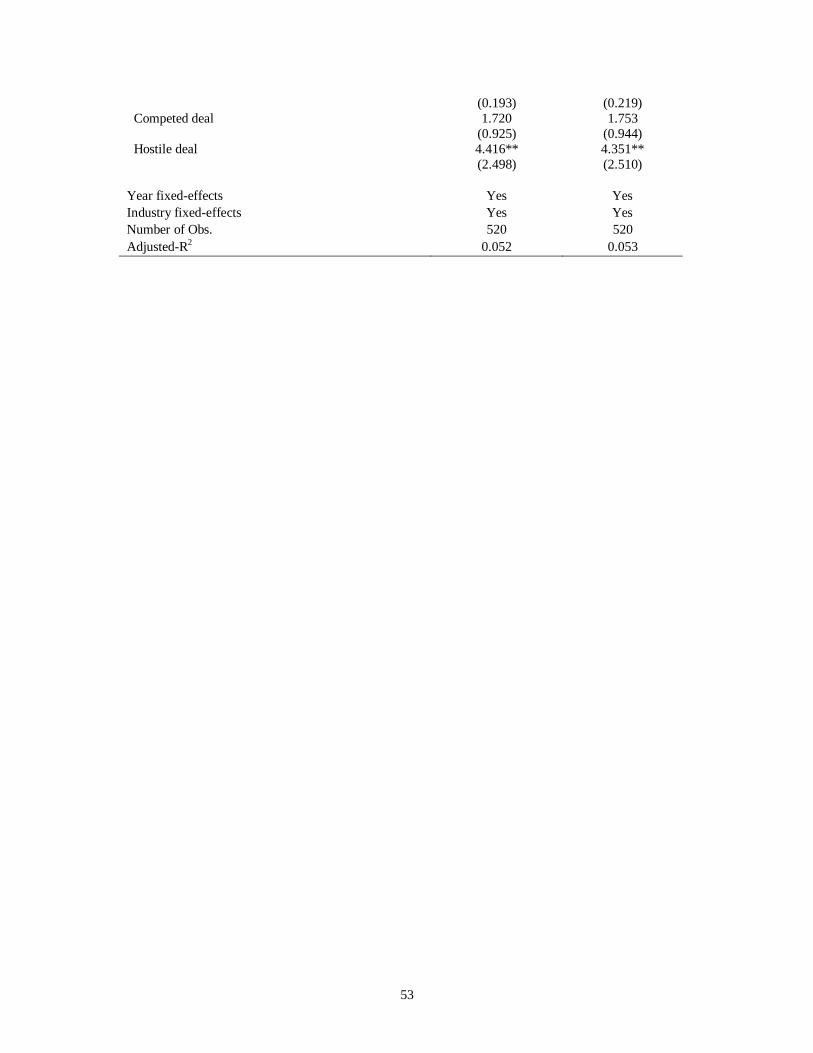
53
(0.193) (0.219)
Competed deal 1.720 1.753
(0.925) (0.944)
Hostile deal 4.416** 4.351**
(2.498) (2.510)
Year fixed-effects Yes Yes
Industry fixed-effects Yes Yes
Number of Obs. 520 520
Adjusted-R2 0.052 0.053
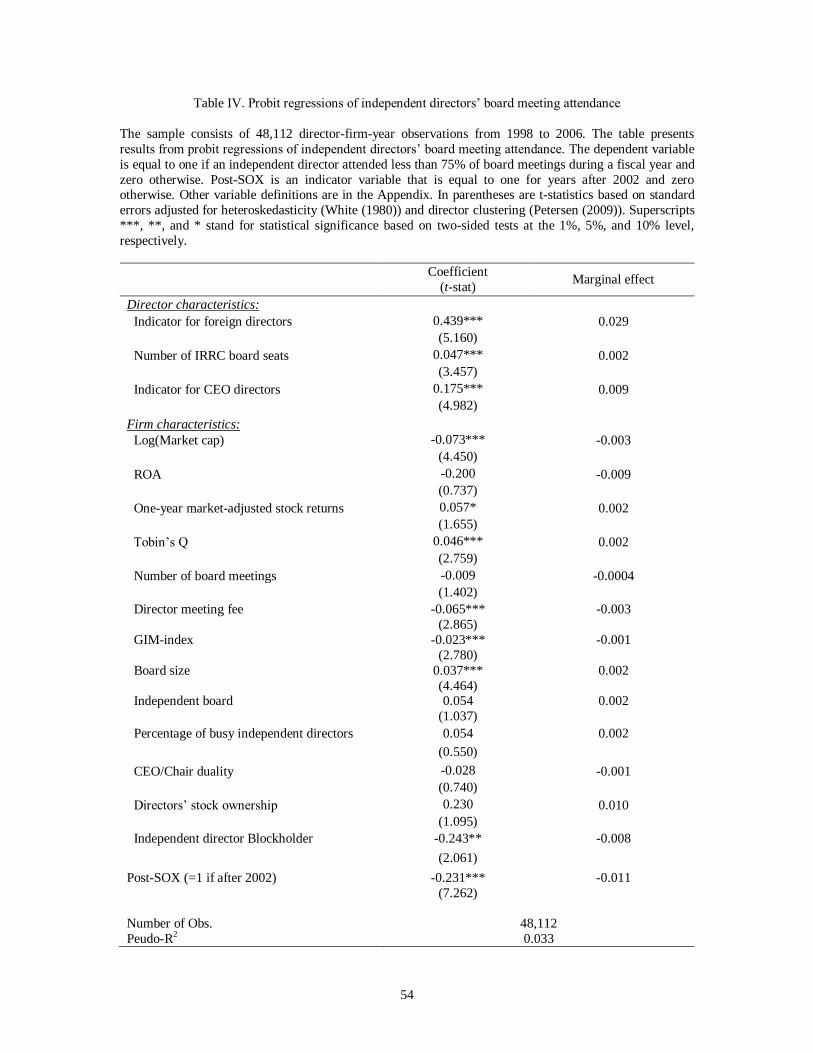
54
Table IV. Probit regressions of independent directors’ board meeting attendance
The sample consists of 48,112 director-firm-year observations from 1998 to 2006. The table presents
results from probit regressions of independent directors’ board meeting attendance. The dependent variable
is equal to one if an independent director attended less than 75% of board meetings during a fiscal year and
zero otherwise. Post-SOX is an indicator variable that is equal to one for years after 2002 and zero otherwise. Other variable definitions are in the Appendix. In parentheses are t-statistics based on standard
errors adjusted for heteroskedasticity (White (1980)) and director clustering (Petersen (2009)). Superscripts
***, **, and * stand for statistical significance based on two-sided tests at the 1%, 5%, and 10% level,
respectively.
Coefficient
(t-stat) Marginal effect
Director characteristics:
Indicator for foreign directors 0.439*** 0.029
(5.160)
Number of IRRC board seats 0.047*** 0.002
(3.457)
Indicator for CEO directors 0.175*** 0.009
(4.982)
Firm characteristics:
Log(Market cap) -0.073*** -0.003
(4.450)
ROA -0.200 -0.009
(0.737)
One-year market-adjusted stock returns 0.057* 0.002
(1.655)
Tobin’s Q 0.046*** 0.002
(2.759)
Number of board meetings -0.009 -0.0004
(1.402)
Director meeting fee -0.065*** -0.003
(2.865)
GIM-index -0.023*** -0.001
(2.780)
Board size 0.037*** 0.002
(4.464) Independent board 0.054 0.002
(1.037)
Percentage of busy independent directors 0.054 0.002
(0.550)
CEO/Chair duality -0.028 -0.001
(0.740)
Directors’ stock ownership 0.230 0.010
(1.095)
Independent director Blockholder -0.243** -0.008
(2.061)
Post-SOX (=1 if after 2002) -0.231*** -0.011
(7.262)
Number of Obs. 48,112
Peudo-R2 0.033
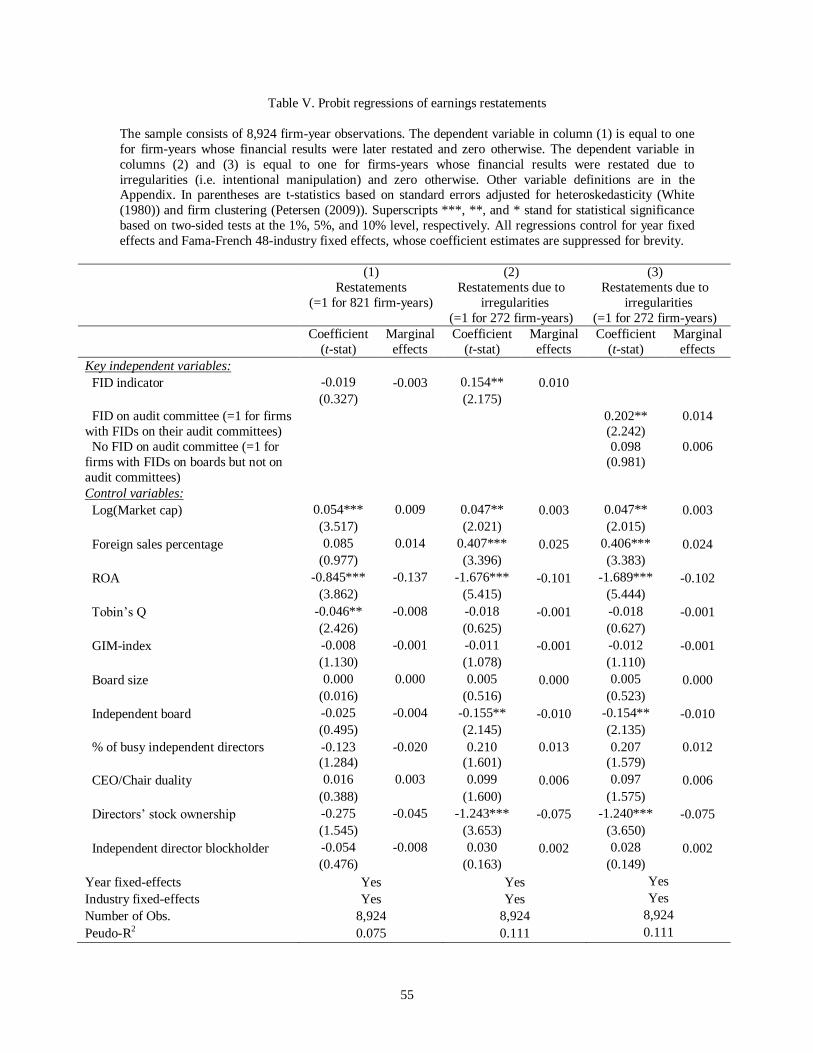
55
Table V. Probit regressions of earnings restatements
The sample consists of 8,924 firm-year observations. The dependent variable in column (1) is equal to one
for firm-years whose financial results were later restated and zero otherwise. The dependent variable in
columns (2) and (3) is equal to one for firms-years whose financial results were restated due to
irregularities (i.e. intentional manipulation) and zero otherwise. Other variable definitions are in the Appendix. In parentheses are t-statistics based on standard errors adjusted for heteroskedasticity (White
(1980)) and firm clustering (Petersen (2009)). Superscripts ***, **, and * stand for statistical significance
based on two-sided tests at the 1%, 5%, and 10% level, respectively. All regressions control for year fixed
effects and Fama-French 48-industry fixed effects, whose coefficient estimates are suppressed for brevity.
(1)
Restatements
(=1 for 821 firm-years)
(2)
Restatements due to
irregularities
(=1 for 272 firm-years)
(3)
Restatements due to
irregularities
(=1 for 272 firm-years)
Coefficient
(t-stat)
Marginal
effects
Coefficient
(t-stat)
Marginal
effects
Coefficient
(t-stat)
Marginal
effects
Key independent variables:
FID indicator -0.019 -0.003 0.154** 0.010
(0.327) (2.175)
FID on audit committee (=1 for firms
with FIDs on their audit committees)
0.202**
(2.242)
0.014
No FID on audit committee (=1 for
firms with FIDs on boards but not on
audit committees)
0.098
(0.981)
0.006
Control variables:
Log(Market cap) 0.054*** 0.009 0.047** 0.003 0.047** 0.003
(3.517) (2.021) (2.015)
Foreign sales percentage 0.085 0.014 0.407*** 0.025 0.406*** 0.024
(0.977) (3.396) (3.383)
ROA -0.845*** -0.137 -1.676*** -0.101 -1.689*** -0.102
(3.862) (5.415) (5.444)
Tobin’s Q -0.046** -0.008 -0.018 -0.001 -0.018 -0.001
(2.426) (0.625) (0.627)
GIM-index -0.008 -0.001 -0.011 -0.001 -0.012 -0.001
(1.130) (1.078) (1.110)
Board size 0.000 0.000 0.005 0.000 0.005 0.000
(0.016) (0.516) (0.523)
Independent board -0.025 -0.004 -0.155** -0.010 -0.154** -0.010
(0.495) (2.145) (2.135)
% of busy independent directors -0.123 -0.020 0.210 0.013 0.207 0.012
(1.284) (1.601) (1.579)
CEO/Chair duality 0.016 0.003 0.099 0.006 0.097 0.006
(0.388) (1.600) (1.575)
Directors’ stock ownership -0.275 -0.045 -1.243*** -0.075 -1.240*** -0.075
(1.545) (3.653) (3.650)
Independent director blockholder -0.054 -0.008 0.030 0.002 0.028 0.002
(0.476) (0.163) (0.149)
Year fixed-effects Yes Yes Yes
Industry fixed-effects Yes Yes Yes
Number of Obs. 8,924 8,924 8,924
Peudo-R2 0.075 0.111 0.111
56
Table VI. Regression analysis of CEO compensation
The sample consists of 7,296 firm-year observations. In Panel A, the dependent variable is the logarithmic
transformation of CEO total compensation in million dollars. In Panel B, the dependent variable is the
logarithmic transformation of CEO cash compensation (i.e. salary plus bonus) in million dollars in columns
(1) and (2) and the logarithmic transformation of CEO equity-based compensation in million dollars in columns (3) and (4). Managerial quality is measured by a firm’s industry-adjusted operating income growth
over the previous three years, which is defined as (EBITDAt-1 - EBITDAt-4)/EBITDAt-4, adjusted for
industry median for the same performance measure. Other variable definitions are in the Appendix. In
parentheses are t-statistics based on standard errors adjusted for heteroskedasticity (White (1980)) and firm
clustering (Petersen (2009)). Superscripts ***, **, and * stand for statistical significance based on two-
sided tests at the 1%, 5%, and 10% level, respectively. All regressions control for year and Fama-French
48-industry fixed effects, whose coefficient estimates are suppressed for brevity.
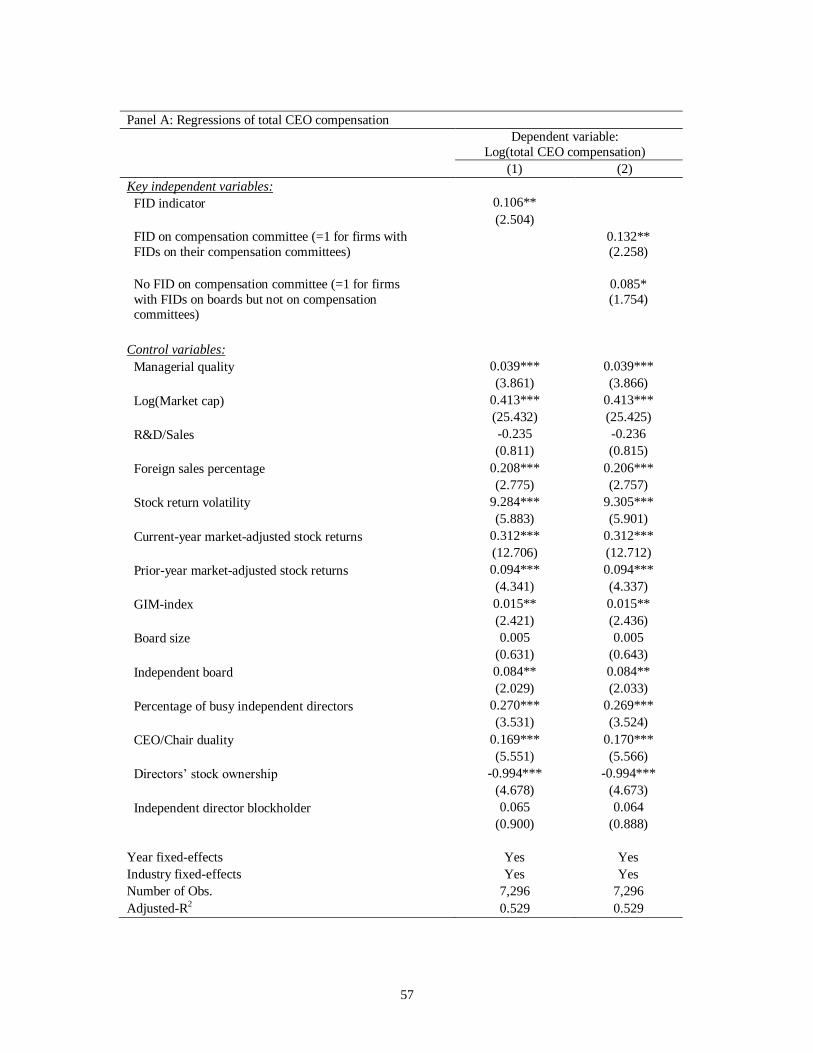
57
Panel A: Regressions of total CEO compensation
Dependent variable:
Log(total CEO compensation)
(1) (2)
Key independent variables:
FID indicator 0.106**
(2.504)
FID on compensation committee (=1 for firms with
FIDs on their compensation committees)
0.132**
(2.258)
No FID on compensation committee (=1 for firms
with FIDs on boards but not on compensation committees)
0.085*
(1.754)
Control variables:
Managerial quality 0.039*** 0.039***
(3.861) (3.866)
Log(Market cap) 0.413*** 0.413***
(25.432) (25.425)
R&D/Sales -0.235 -0.236
(0.811) (0.815)
Foreign sales percentage 0.208*** 0.206***
(2.775) (2.757)
Stock return volatility 9.284*** 9.305***
(5.883) (5.901)
Current-year market-adjusted stock returns 0.312*** 0.312***
(12.706) (12.712)
Prior-year market-adjusted stock returns 0.094*** 0.094***
(4.341) (4.337)
GIM-index 0.015** 0.015**
(2.421) (2.436)
Board size 0.005 0.005
(0.631) (0.643)
Independent board 0.084** 0.084**
(2.029) (2.033)
Percentage of busy independent directors 0.270*** 0.269***
(3.531) (3.524)
CEO/Chair duality 0.169*** 0.170***
(5.551) (5.566)
Directors’ stock ownership -0.994*** -0.994***
(4.678) (4.673)
Independent director blockholder 0.065 0.064
(0.900) (0.888)
Year fixed-effects Yes Yes
Industry fixed-effects Yes Yes
Number of Obs. 7,296 7,296
Adjusted-R2 0.529 0.529
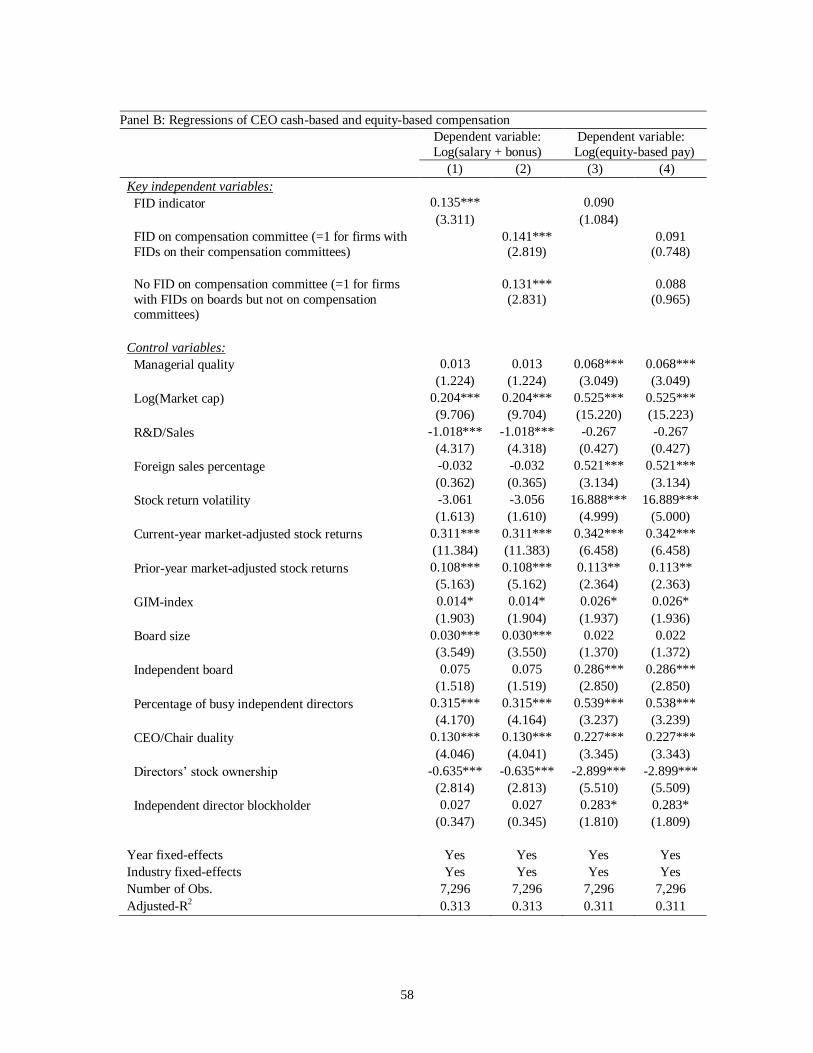
58
Panel B: Regressions of CEO cash-based and equity-based compensation
Dependent variable:
Log(salary + bonus)
Dependent variable:
Log(equity-based pay)
(1) (2) (3) (4)
Key independent variables:
FID indicator 0.135*** 0.090
(3.311) (1.084)
FID on compensation committee (=1 for firms with
FIDs on their compensation committees)
0.141***
(2.819)
0.091
(0.748)
No FID on compensation committee (=1 for firms
with FIDs on boards but not on compensation committees)
0.131***
(2.831)
0.088
(0.965)
Control variables:
Managerial quality 0.013 0.013 0.068*** 0.068***
(1.224) (1.224) (3.049) (3.049)
Log(Market cap) 0.204*** 0.204*** 0.525*** 0.525***
(9.706) (9.704) (15.220) (15.223)
R&D/Sales -1.018*** -1.018*** -0.267 -0.267
(4.317) (4.318) (0.427) (0.427)
Foreign sales percentage -0.032 -0.032 0.521*** 0.521***
(0.362) (0.365) (3.134) (3.134)
Stock return volatility -3.061 -3.056 16.888*** 16.889***
(1.613) (1.610) (4.999) (5.000)
Current-year market-adjusted stock returns 0.311*** 0.311*** 0.342*** 0.342***
(11.384) (11.383) (6.458) (6.458)
Prior-year market-adjusted stock returns 0.108*** 0.108*** 0.113** 0.113**
(5.163) (5.162) (2.364) (2.363)
GIM-index 0.014* 0.014* 0.026* 0.026*
(1.903) (1.904) (1.937) (1.936)
Board size 0.030*** 0.030*** 0.022 0.022
(3.549) (3.550) (1.370) (1.372)
Independent board 0.075 0.075 0.286*** 0.286***
(1.518) (1.519) (2.850) (2.850)
Percentage of busy independent directors 0.315*** 0.315*** 0.539*** 0.538***
(4.170) (4.164) (3.237) (3.239)
CEO/Chair duality 0.130*** 0.130*** 0.227*** 0.227***
(4.046) (4.041) (3.345) (3.343)
Directors’ stock ownership -0.635*** -0.635*** -2.899*** -2.899***
(2.814) (2.813) (5.510) (5.509)
Independent director blockholder 0.027 0.027 0.283* 0.283*
(0.347) (0.345) (1.810) (1.809)
Year fixed-effects Yes Yes Yes Yes
Industry fixed-effects Yes Yes Yes Yes
Number of Obs. 7,296 7,296 7,296 7,296
Adjusted-R2 0.313 0.313 0.311 0.311
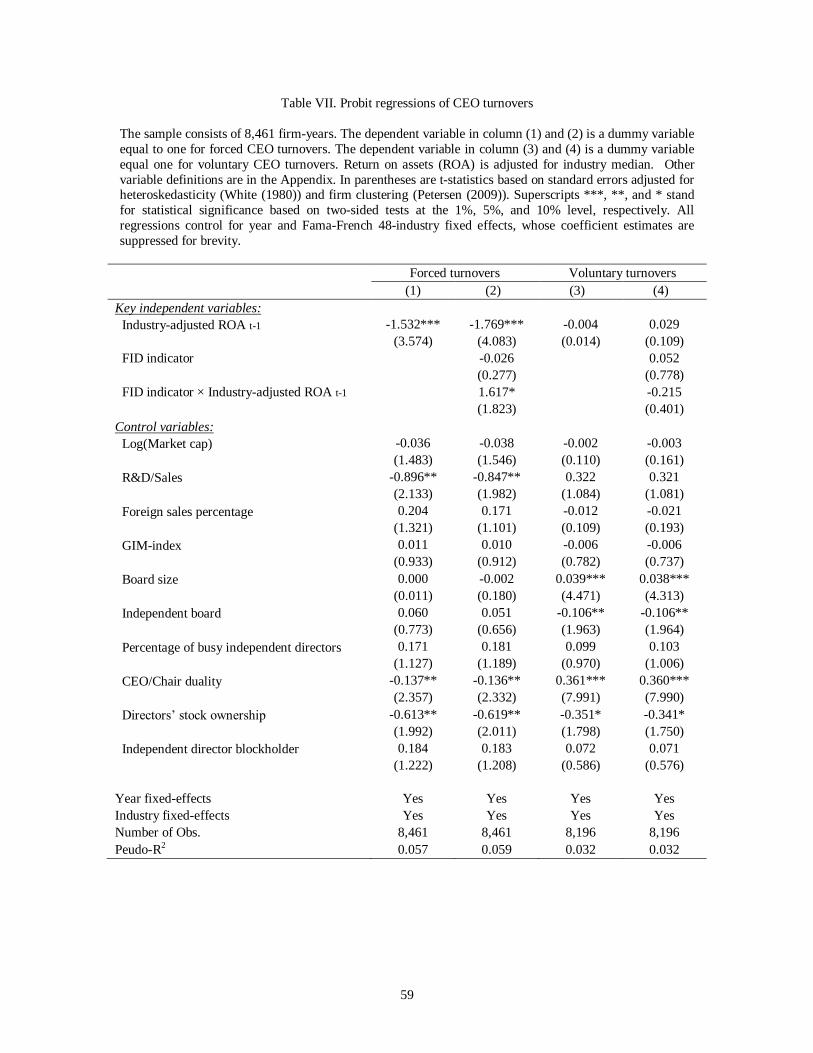
59
Table VII. Probit regressions of CEO turnovers
The sample consists of 8,461 firm-years. The dependent variable in column (1) and (2) is a dummy variable
equal to one for forced CEO turnovers. The dependent variable in column (3) and (4) is a dummy variable
equal one for voluntary CEO turnovers. Return on assets (ROA) is adjusted for industry median. Other
variable definitions are in the Appendix. In parentheses are t-statistics based on standard errors adjusted for heteroskedasticity (White (1980)) and firm clustering (Petersen (2009)). Superscripts ***, **, and * stand
for statistical significance based on two-sided tests at the 1%, 5%, and 10% level, respectively. All
regressions control for year and Fama-French 48-industry fixed effects, whose coefficient estimates are
suppressed for brevity.
Forced turnovers Voluntary turnovers
(1) (2) (3) (4)
Key independent variables:
Industry-adjusted ROA t-1 -1.532*** -1.769*** -0.004 0.029
(3.574) (4.083) (0.014) (0.109)
FID indicator -0.026 0.052
(0.277) (0.778)
FID indicator × Industry-adjusted ROA t-1 1.617* -0.215
(1.823) (0.401)
Control variables:
Log(Market cap) -0.036 -0.038 -0.002 -0.003
(1.483) (1.546) (0.110) (0.161)
R&D/Sales -0.896** -0.847** 0.322 0.321
(2.133) (1.982) (1.084) (1.081)
Foreign sales percentage 0.204 0.171 -0.012 -0.021
(1.321) (1.101) (0.109) (0.193)
GIM-index 0.011 0.010 -0.006 -0.006
(0.933) (0.912) (0.782) (0.737)
Board size 0.000 -0.002 0.039*** 0.038***
(0.011) (0.180) (4.471) (4.313)
Independent board 0.060 0.051 -0.106** -0.106**
(0.773) (0.656) (1.963) (1.964)
Percentage of busy independent directors 0.171 0.181 0.099 0.103
(1.127) (1.189) (0.970) (1.006)
CEO/Chair duality -0.137** -0.136** 0.361*** 0.360***
(2.357) (2.332) (7.991) (7.990)
Directors’ stock ownership -0.613** -0.619** -0.351* -0.341*
(1.992) (2.011) (1.798) (1.750)
Independent director blockholder 0.184 0.183 0.072 0.071
(1.222) (1.208) (0.586) (0.576)
Year fixed-effects Yes Yes Yes Yes
Industry fixed-effects Yes Yes Yes Yes
Number of Obs. 8,461 8,461 8,196 8,196
Peudo-R2 0.057 0.059 0.032 0.032
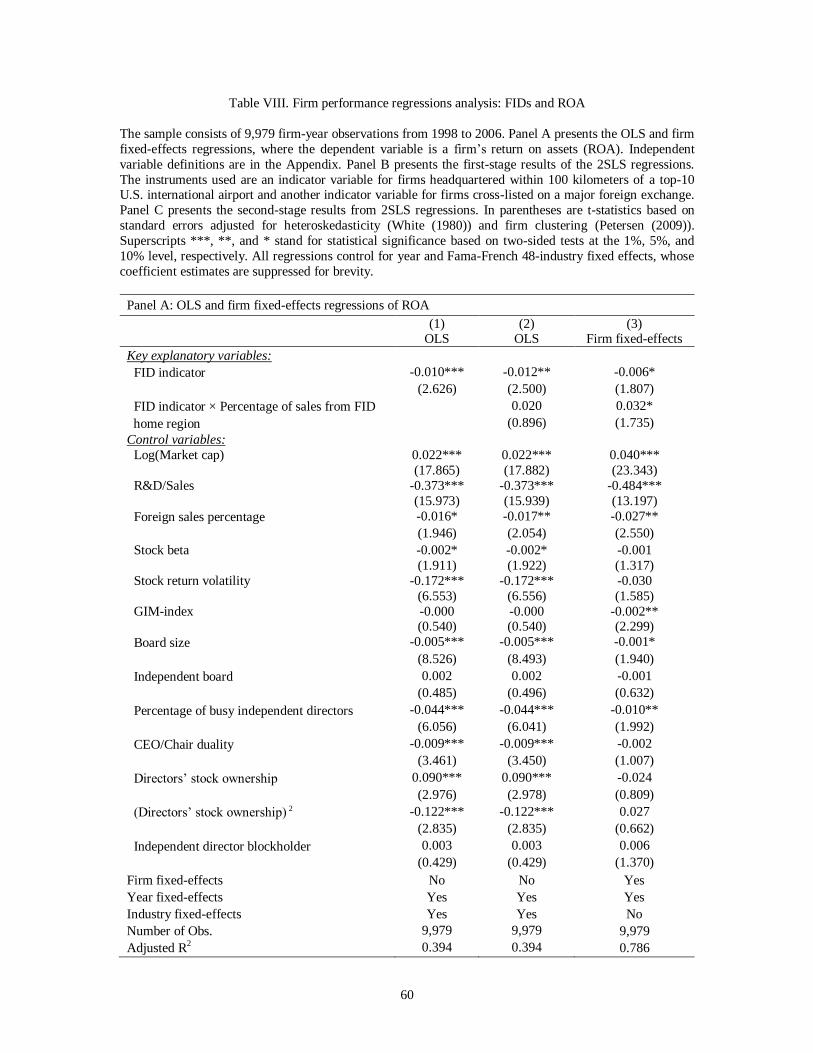
60
Table VIII. Firm performance regressions analysis: FIDs and ROA
The sample consists of 9,979 firm-year observations from 1998 to 2006. Panel A presents the OLS and firm
fixed-effects regressions, where the dependent variable is a firm’s return on assets (ROA). Independent
variable definitions are in the Appendix. Panel B presents the first-stage results of the 2SLS regressions.
The instruments used are an indicator variable for firms headquartered within 100 kilometers of a top-10 U.S. international airport and another indicator variable for firms cross-listed on a major foreign exchange.
Panel C presents the second-stage results from 2SLS regressions. In parentheses are t-statistics based on
standard errors adjusted for heteroskedasticity (White (1980)) and firm clustering (Petersen (2009)).
Superscripts ***, **, and * stand for statistical significance based on two-sided tests at the 1%, 5%, and
10% level, respectively. All regressions control for year and Fama-French 48-industry fixed effects, whose
coefficient estimates are suppressed for brevity.
Panel A: OLS and firm fixed-effects regressions of ROA
(1)
OLS (2)
OLS (3)
Firm fixed-effects
Key explanatory variables:
FID indicator -0.010*** -0.012** -0.006*
(2.626) (2.500) (1.807)
FID indicator × Percentage of sales from FID 0.020 0.032*
home region (0.896) (1.735)
Control variables:
Log(Market cap) 0.022*** 0.022*** 0.040***
(17.865) (17.882) (23.343)
R&D/Sales -0.373*** -0.373*** -0.484***
(15.973) (15.939) (13.197)
Foreign sales percentage -0.016* -0.017** -0.027**
(1.946) (2.054) (2.550)
Stock beta -0.002* -0.002* -0.001
(1.911) (1.922) (1.317)
Stock return volatility -0.172*** -0.172*** -0.030
(6.553) (6.556) (1.585)
GIM-index -0.000 -0.000 -0.002** (0.540) (0.540) (2.299)
Board size -0.005*** -0.005*** -0.001*
(8.526) (8.493) (1.940)
Independent board 0.002 0.002 -0.001
(0.485) (0.496) (0.632)
Percentage of busy independent directors -0.044*** -0.044*** -0.010**
(6.056) (6.041) (1.992)
CEO/Chair duality -0.009*** -0.009*** -0.002
(3.461) (3.450) (1.007)
Directors’ stock ownership 0.090*** 0.090*** -0.024
(2.976) (2.978) (0.809)
(Directors’ stock ownership) 2 -0.122*** -0.122*** 0.027
(2.835) (2.835) (0.662)
Independent director blockholder 0.003 0.003 0.006
(0.429) (0.429) (1.370)
Firm fixed-effects No No Yes
Year fixed-effects Yes Yes Yes
Industry fixed-effects Yes Yes No
Number of Obs. 9,979 9,979 9,979
Adjusted R2 0.394 0.394 0.786
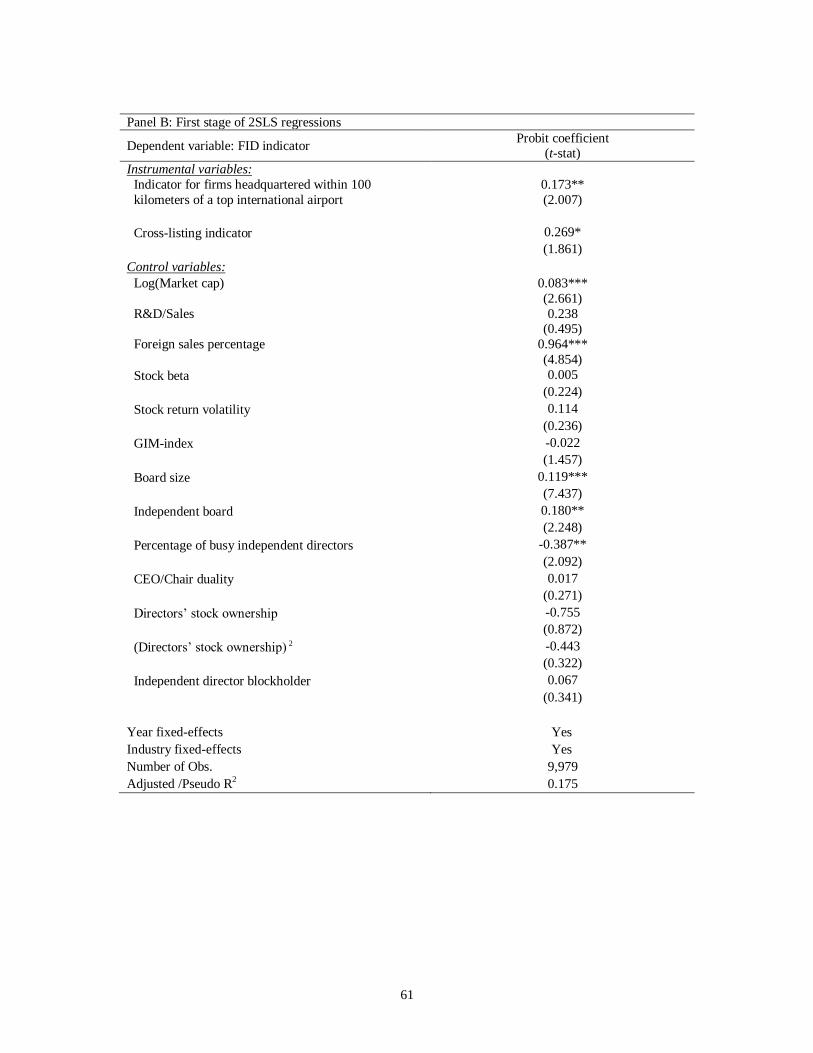
61
Panel B: First stage of 2SLS regressions
Dependent variable: FID indicator Probit coefficient
(t-stat)
Instrumental variables:
Indicator for firms headquartered within 100
kilometers of a top international airport
0.173**
(2.007)
Cross-listing indicator 0.269*
(1.861)
Control variables:
Log(Market cap) 0.083***
(2.661)
R&D/Sales 0.238 (0.495)
Foreign sales percentage 0.964***
(4.854)
Stock beta 0.005
(0.224)
Stock return volatility 0.114
(0.236)
GIM-index -0.022
(1.457)
Board size 0.119***
(7.437)
Independent board 0.180**
(2.248)
Percentage of busy independent directors -0.387**
(2.092)
CEO/Chair duality 0.017
(0.271)
Directors’ stock ownership -0.755
(0.872)
(Directors’ stock ownership) 2 -0.443
(0.322)
Independent director blockholder 0.067
(0.341)
Year fixed-effects Yes
Industry fixed-effects Yes
Number of Obs. 9,979
Adjusted /Pseudo R2 0.175
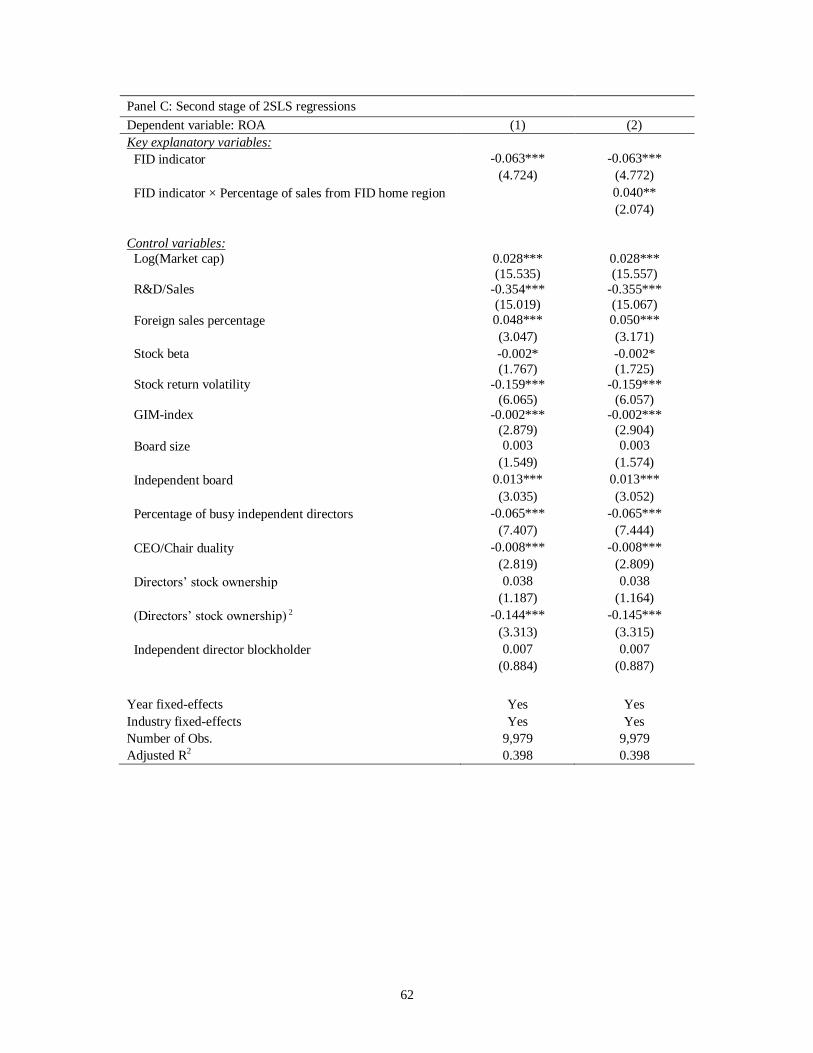
62
Panel C: Second stage of 2SLS regressions
Dependent variable: ROA (1) (2)
Key explanatory variables:
FID indicator -0.063*** -0.063***
(4.724) (4.772)
FID indicator × Percentage of sales from FID home region 0.040**
(2.074)
Control variables:
Log(Market cap) 0.028*** 0.028***
(15.535) (15.557)
R&D/Sales -0.354*** -0.355***
(15.019) (15.067)
Foreign sales percentage 0.048*** 0.050***
(3.047) (3.171)
Stock beta -0.002* -0.002*
(1.767) (1.725)
Stock return volatility -0.159*** -0.159***
(6.065) (6.057) GIM-index -0.002*** -0.002***
(2.879) (2.904)
Board size 0.003 0.003
(1.549) (1.574)
Independent board 0.013*** 0.013***
(3.035) (3.052)
Percentage of busy independent directors -0.065*** -0.065***
(7.407) (7.444)
CEO/Chair duality -0.008*** -0.008***
(2.819) (2.809)
Directors’ stock ownership 0.038 0.038
(1.187) (1.164)
(Directors’ stock ownership) 2 -0.144*** -0.145***
(3.313) (3.315)
Independent director blockholder 0.007 0.007
(0.884) (0.887)
Year fixed-effects Yes Yes
Industry fixed-effects Yes Yes
Number of Obs. 9,979 9,979
Adjusted R2 0.398 0.398
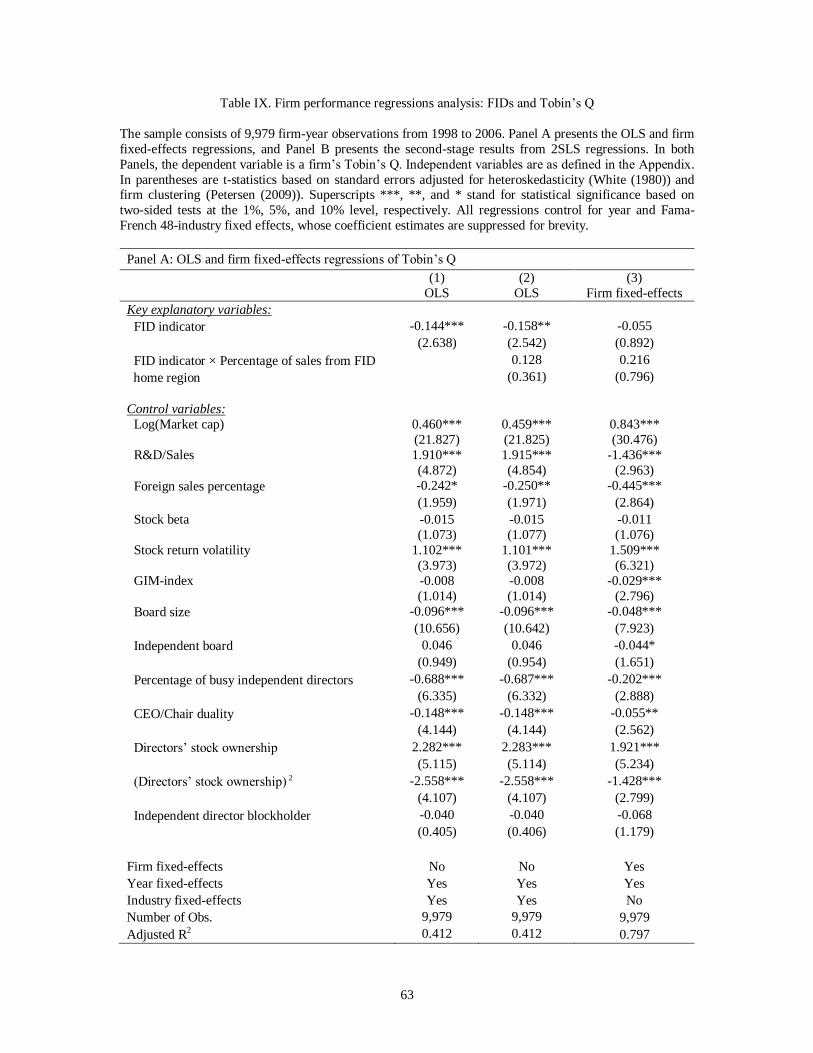
63
Table IX. Firm performance regressions analysis: FIDs and Tobin’s Q
The sample consists of 9,979 firm-year observations from 1998 to 2006. Panel A presents the OLS and firm
fixed-effects regressions, and Panel B presents the second-stage results from 2SLS regressions. In both
Panels, the dependent variable is a firm’s Tobin’s Q. Independent variables are as defined in the Appendix.
In parentheses are t-statistics based on standard errors adjusted for heteroskedasticity (White (1980)) and firm clustering (Petersen (2009)). Superscripts ***, **, and * stand for statistical significance based on
two-sided tests at the 1%, 5%, and 10% level, respectively. All regressions control for year and Fama-
French 48-industry fixed effects, whose coefficient estimates are suppressed for brevity.
Panel A: OLS and firm fixed-effects regressions of Tobin’s Q
(1)
OLS
(2)
OLS
(3)
Firm fixed-effects
Key explanatory variables:
FID indicator -0.144*** -0.158** -0.055
(2.638) (2.542) (0.892)
FID indicator × Percentage of sales from FID 0.128 0.216
home region (0.361) (0.796)
Control variables:
Log(Market cap) 0.460*** 0.459*** 0.843***
(21.827) (21.825) (30.476)
R&D/Sales 1.910*** 1.915*** -1.436***
(4.872) (4.854) (2.963)
Foreign sales percentage -0.242* -0.250** -0.445***
(1.959) (1.971) (2.864)
Stock beta -0.015 -0.015 -0.011
(1.073) (1.077) (1.076)
Stock return volatility 1.102*** 1.101*** 1.509***
(3.973) (3.972) (6.321)
GIM-index -0.008 -0.008 -0.029***
(1.014) (1.014) (2.796)
Board size -0.096*** -0.096*** -0.048***
(10.656) (10.642) (7.923)
Independent board 0.046 0.046 -0.044*
(0.949) (0.954) (1.651)
Percentage of busy independent directors -0.688*** -0.687*** -0.202***
(6.335) (6.332) (2.888)
CEO/Chair duality -0.148*** -0.148*** -0.055**
(4.144) (4.144) (2.562)
Directors’ stock ownership 2.282*** 2.283*** 1.921***
(5.115) (5.114) (5.234)
(Directors’ stock ownership) 2 -2.558*** -2.558*** -1.428***
(4.107) (4.107) (2.799)
Independent director blockholder -0.040 -0.040 -0.068
(0.405) (0.406) (1.179)
Firm fixed-effects No No Yes
Year fixed-effects Yes Yes Yes
Industry fixed-effects Yes Yes No
Number of Obs. 9,979 9,979 9,979
Adjusted R2 0.412 0.412 0.797
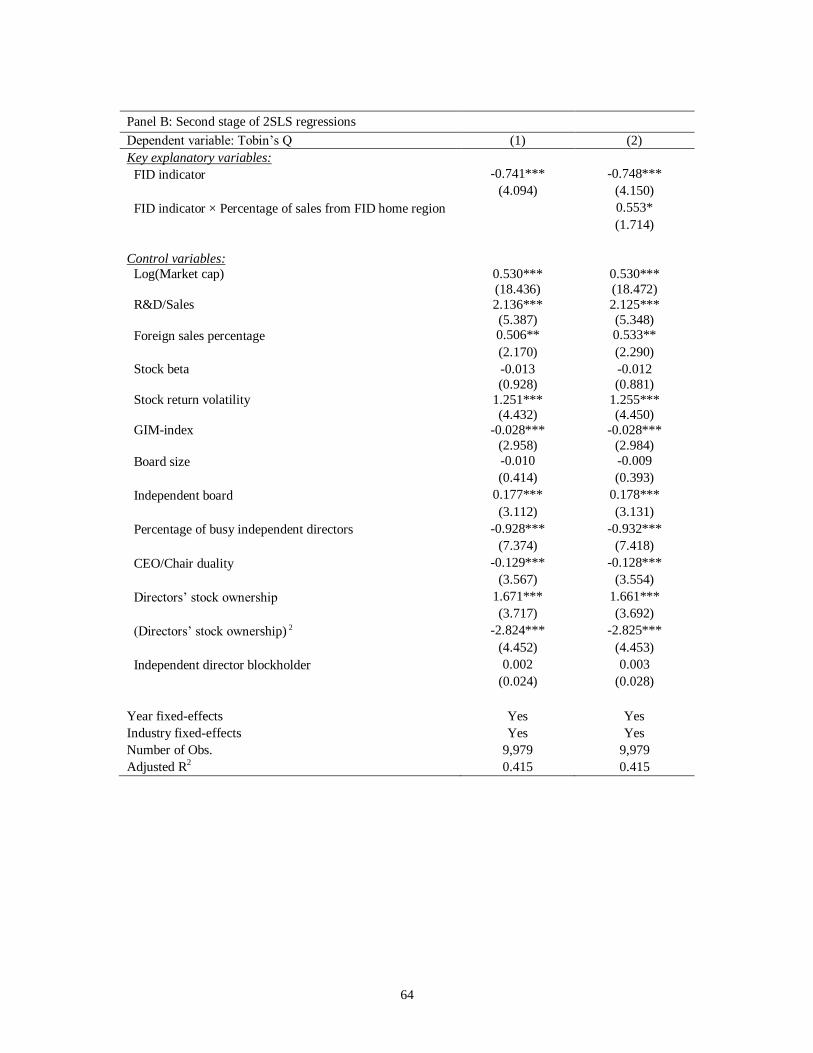
64
Panel B: Second stage of 2SLS regressions
Dependent variable: Tobin’s Q (1) (2)
Key explanatory variables:
FID indicator -0.741*** -0.748***
(4.094) (4.150)
FID indicator × Percentage of sales from FID home region 0.553*
(1.714)
Control variables:
Log(Market cap) 0.530*** 0.530***
(18.436) (18.472)
R&D/Sales 2.136*** 2.125***
(5.387) (5.348)
Foreign sales percentage 0.506** 0.533**
(2.170) (2.290)
Stock beta -0.013 -0.012
(0.928) (0.881)
Stock return volatility 1.251*** 1.255*** (4.432) (4.450)
GIM-index -0.028*** -0.028***
(2.958) (2.984)
Board size -0.010 -0.009
(0.414) (0.393)
Independent board 0.177*** 0.178***
(3.112) (3.131)
Percentage of busy independent directors -0.928*** -0.932***
(7.374) (7.418)
CEO/Chair duality -0.129*** -0.128***
(3.567) (3.554)
Directors’ stock ownership 1.671*** 1.661***
(3.717) (3.692)
(Directors’ stock ownership) 2 -2.824*** -2.825***
(4.452) (4.453)
Independent director blockholder 0.002 0.003
(0.024) (0.028)
Year fixed-effects Yes Yes
Industry fixed-effects Yes Yes
Number of Obs. 9,979 9,979
Adjusted R2 0.415 0.415
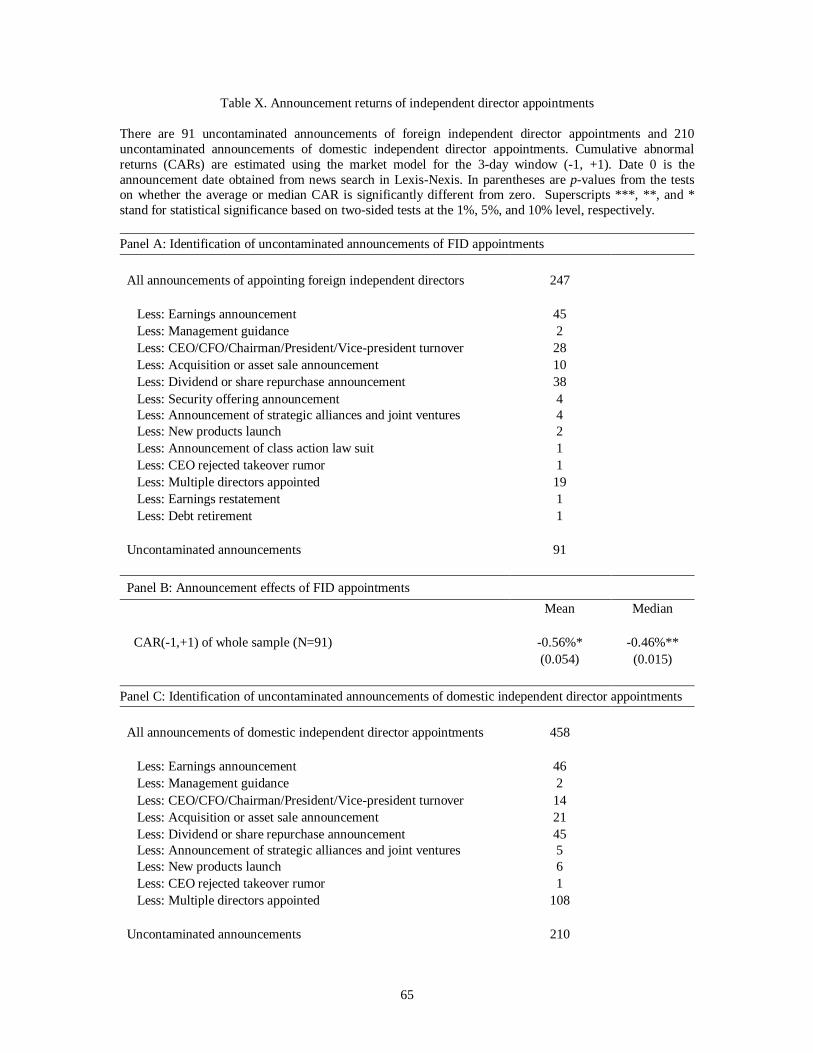
65
Table X. Announcement returns of independent director appointments
There are 91 uncontaminated announcements of foreign independent director appointments and 210
uncontaminated announcements of domestic independent director appointments. Cumulative abnormal
returns (CARs) are estimated using the market model for the 3-day window (-1, +1). Date 0 is the
announcement date obtained from news search in Lexis-Nexis. In parentheses are p-values from the tests on whether the average or median CAR is significantly different from zero. Superscripts ***, **, and *
stand for statistical significance based on two-sided tests at the 1%, 5%, and 10% level, respectively.
Panel A: Identification of uncontaminated announcements of FID appointments
All announcements of appointing foreign independent directors 247
Less: Earnings announcement 45
Less: Management guidance 2
Less: CEO/CFO/Chairman/President/Vice-president turnover 28
Less: Acquisition or asset sale announcement 10
Less: Dividend or share repurchase announcement 38
Less: Security offering announcement 4
Less: Announcement of strategic alliances and joint ventures 4
Less: New products launch 2
Less: Announcement of class action law suit 1
Less: CEO rejected takeover rumor 1
Less: Multiple directors appointed 19
Less: Earnings restatement 1
Less: Debt retirement 1
Uncontaminated announcements 91
Panel B: Announcement effects of FID appointments
Mean Median
CAR(-1,+1) of whole sample (N=91) -0.56%* -0.46%**
(0.054) (0.015)
Panel C: Identification of uncontaminated announcements of domestic independent director appointments
All announcements of domestic independent director appointments 458
Less: Earnings announcement 46
Less: Management guidance 2
Less: CEO/CFO/Chairman/President/Vice-president turnover 14
Less: Acquisition or asset sale announcement 21
Less: Dividend or share repurchase announcement 45
Less: Announcement of strategic alliances and joint ventures 5
Less: New products launch 6
Less: CEO rejected takeover rumor 1
Less: Multiple directors appointed 108
Uncontaminated announcements 210
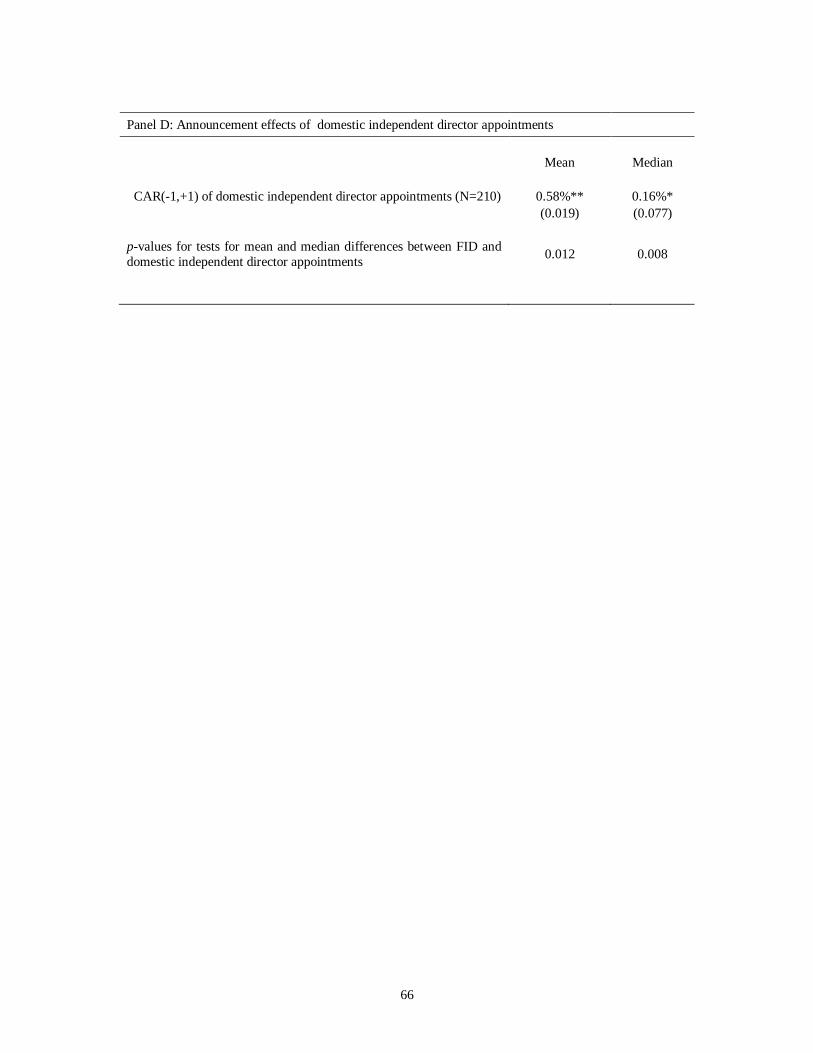
66
Panel D: Announcement effects of domestic independent director appointments
Mean Median
CAR(-1,+1) of domestic independent director appointments (N=210) 0.58%** 0.16%*
(0.019) (0.077)
p-values for tests for mean and median differences between FID and
domestic independent director appointments 0.012 0.008
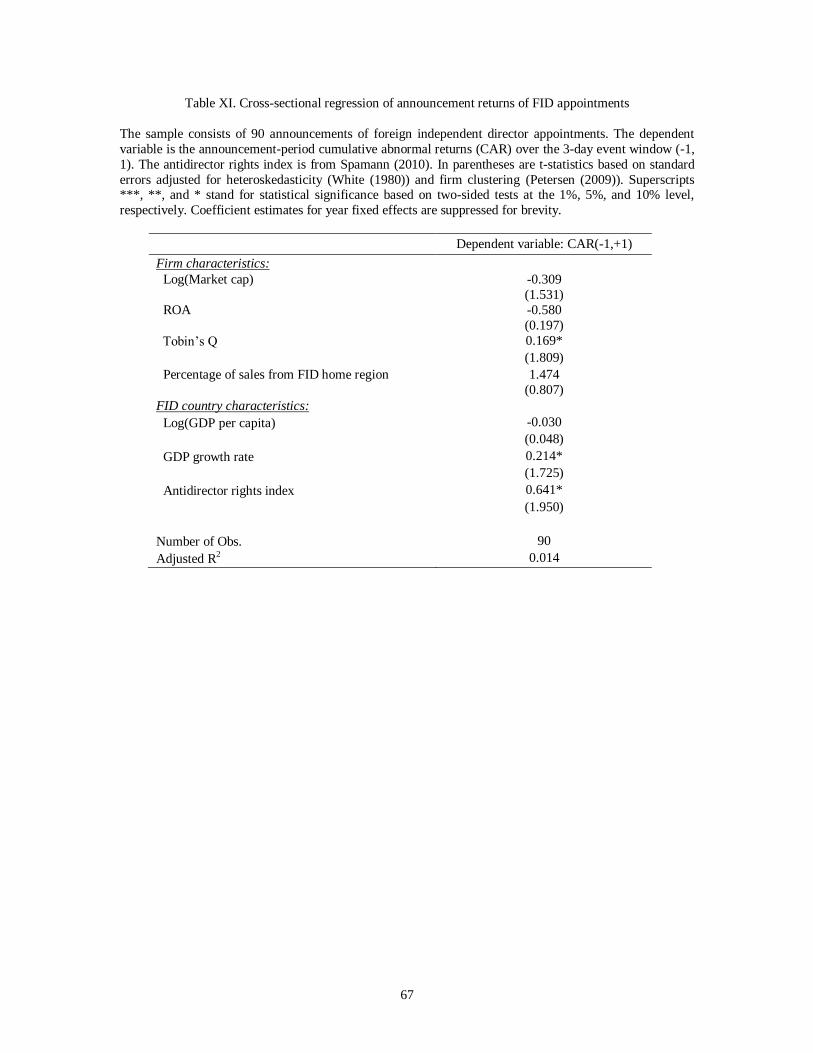
67
Table XI. Cross-sectional regression of announcement returns of FID appointments
The sample consists of 90 announcements of foreign independent director appointments. The dependent
variable is the announcement-period cumulative abnormal returns (CAR) over the 3-day event window (-1,
1). The antidirector rights index is from Spamann (2010). In parentheses are t-statistics based on standard
errors adjusted for heteroskedasticity (White (1980)) and firm clustering (Petersen (2009)). Superscripts ***, **, and * stand for statistical significance based on two-sided tests at the 1%, 5%, and 10% level,
respectively. Coefficient estimates for year fixed effects are suppressed for brevity.
Dependent variable: CAR(-1,+1)
Firm characteristics:
Log(Market cap) -0.309
(1.531)
ROA -0.580
(0.197)
Tobin’s Q 0.169*
(1.809)
Percentage of sales from FID home region 1.474
(0.807)
FID country characteristics:
Log(GDP per capita) -0.030
(0.048)
GDP growth rate 0.214*
(1.725)
Antidirector rights index 0.641*
(1.950)
Number of Obs. 90
Adjusted R2 0.014
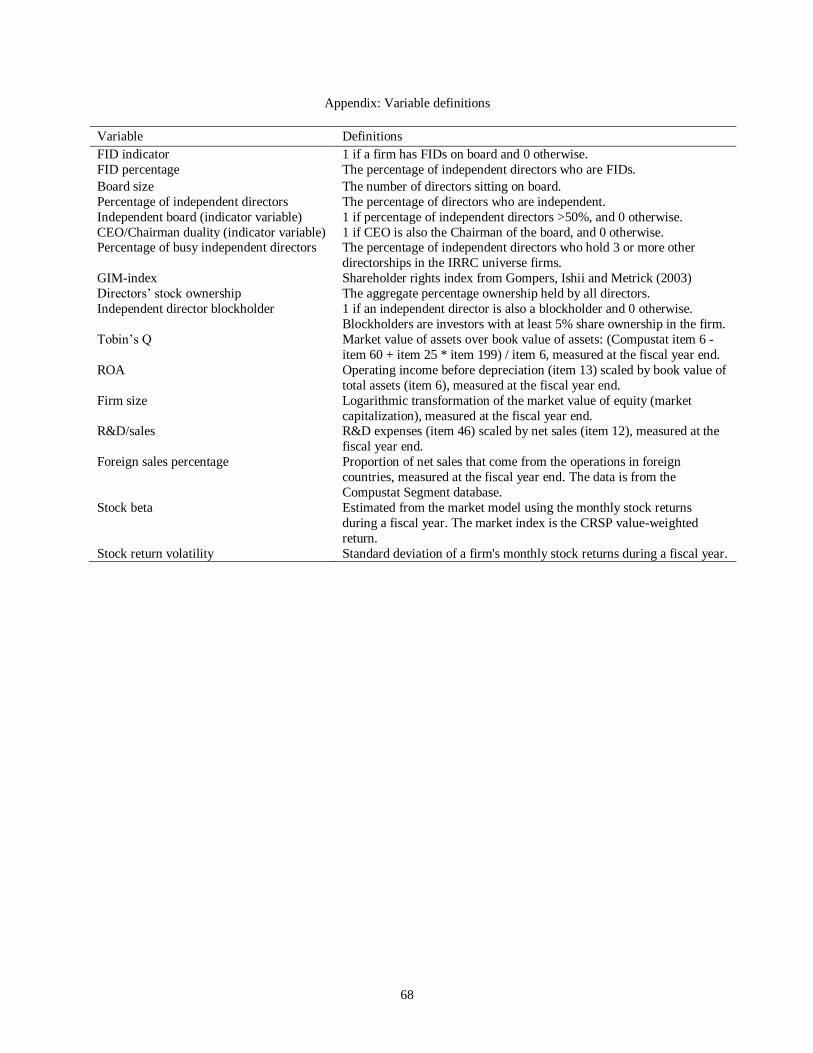
68
Appendix: Variable definitions
Variable Definitions
FID indicator 1 if a firm has FIDs on board and 0 otherwise.
FID percentage The percentage of independent directors who are FIDs.
Board size The number of directors sitting on board.
Percentage of independent directors The percentage of directors who are independent.
Independent board (indicator variable) 1 if percentage of independent directors >50%, and 0 otherwise.
CEO/Chairman duality (indicator variable) 1 if CEO is also the Chairman of the board, and 0 otherwise. Percentage of busy independent directors The percentage of independent directors who hold 3 or more other
directorships in the IRRC universe firms.
GIM-index Shareholder rights index from Gompers, Ishii and Metrick (2003)
Directors’ stock ownership The aggregate percentage ownership held by all directors.
Independent director blockholder 1 if an independent director is also a blockholder and 0 otherwise.
Blockholders are investors with at least 5% share ownership in the firm.
Tobin’s Q Market value of assets over book value of assets: (Compustat item 6 -
item 60 + item 25 * item 199) / item 6, measured at the fiscal year end.
ROA Operating income before depreciation (item 13) scaled by book value of
total assets (item 6), measured at the fiscal year end.
Firm size Logarithmic transformation of the market value of equity (market
capitalization), measured at the fiscal year end. R&D/sales R&D expenses (item 46) scaled by net sales (item 12), measured at the
fiscal year end.
Foreign sales percentage Proportion of net sales that come from the operations in foreign
countries, measured at the fiscal year end. The data is from the
Compustat Segment database.
Stock beta Estimated from the market model using the monthly stock returns
during a fiscal year. The market index is the CRSP value-weighted
return.
Stock return volatility Standard deviation of a firm's monthly stock returns during a fiscal year.
Top Related