


Languages
Pages
Legal

Global Smart Spaces
The Smart Traveller Information System
Shane Brennan
A dissertation submitted to the University of Dublin, in partial fulfilment of the
requirements for the degree of Master of Science in Computer Science
September 2006

Declaration
I declare that the work described in this dissertation is, except where otherwise stated,
entirely my own work, and has not been submitted as an exercise for a degree at this
or any other university.
Signed:
Shane Brennan
8th September, 2006

Permission to lend and/or copy
I agree that Trinity College Library may lend or copy this dissertation upon request.
Signed:
Shane Brennan
8th September, 2006

Acknowledgements
I would like to take the opportunity to thank my supervisor, Dr. René Meier, for his
enthusiasm and guidance during the course of this project. Also, I would like to
acknowledge Pat O’Callaghan and Kai Beckmann for their help and assistance.

Summary
The essential character of a travel information system is a service which assists a
traveller in choosing, refining, and then following the route of a pre-determined
journey from a chosen starting point to a destination.
The Smart Traveller Information Service aims to provide users with a means of
planning a journey through the Dublin metropolitan area, using multiple modes of
transport. The project goal is to bridge the co-ordination gap between public and
private modes of transportation by suggesting journey routes according to various
traveller preferences.
The secondary goal is to demonstrate that spatial context can be exploited to provide a
basis for offering pervasive information services to users. The proposed service aims
to use a spatial programming model, in order to offer useful travel information
services based on the data from this model.
The Smart Traveller Information Server (STIS) supports multi-modal journeys using
up to five different modes of transportation. All the data supporting this service is
taken from an existing spatially-enabled database, formatted and presented to the
requesting user in the form of a detailed journey travel plan.
The STIS system was originally proposed to provide a stand-alone service taking user
requests and returning responses over an XML interface. This project scope was later
enlarged to encompass a presentation layer capable of displaying the route data
visually. In addition the system provides a means of route refinement, both by
waypoint location and transport type, and a device-independent journey plan capable
of display on multiple devices.

Table of Contents
1 INTRODUCTION.........................................................................................................................2
1.1 GOAL .....................................................................................................................................4
1.2 APPROACH .............................................................................................................................6
1.2.1 Roadmap...........................................................................................................................7
2 STATE OF THE ART ..................................................................................................................8
2.1 WEB-BASED MAPPING AND ROUTING SERVICE .....................................................................9
2.1.1 Dublin City Live (Traffic Congestion Map)......................................................................9
2.1.2 Dublin Transportation Office (Route Search) ................................................................11
2.1.3 Transport for London (Integrated Travel Planner) ........................................................13
2.1.4 AA Roadwatch – Route Planning Service.......................................................................15
2.1.5 Washington State Commuter Map (Traffic Congestion Map) ........................................16
2.1.6 Google Maps (Route and Map Search) ..........................................................................17
2.1.7 Map 24 Service (Route and Map Search) .......................................................................19
2.2 WEB-BASED PUBLIC TRANSPORTATION INFORMATION........................................................21
2.2.1 Dublin Bus (Timetable and Route Search) .....................................................................21
2.2.2 Dublin Area Rapid Transit (DART)................................................................................23
2.2.3 Luas (Timetable and Route Search)................................................................................26
2.3 COMPARISON WITH EXISTING TRAVEL SYSTEMS...................................................................28
3 ARCHITECTURE DESIGN......................................................................................................30
3.1 SYSTEM REQUIREMENTS ......................................................................................................31
3.2 INITIAL ARCHITECTURE .......................................................................................................33
3.3 SYSTEM DESIGN ...................................................................................................................35
3.3.1 Class Diagram................................................................................................................36
3.3.2 Presentation Layer .........................................................................................................36
3.3.3 Communications Layer...................................................................................................38
3.3.4 STIS Server and Service Layer .......................................................................................41
3.3.5 STIS Client Interface ......................................................................................................43
3.3.6 Spatial API Interface ......................................................................................................48
3.3.7 Concurrent User Requirements ......................................................................................49
3.3.8 Design Features added during Implementation Phase...................................................50
3.4 DESIGNING THE TRANSPORT NETWORK MODEL ..................................................................51
3.4.1 Modelling Dublin’s Transport Links ..............................................................................52
3.4.2 Interconnection between Transport Links ......................................................................53
3.4.3 Generating Traffic Congestion Data ..............................................................................53
3.4.4 Changes in Network Topology........................................................................................54
3.5 ROUTING ALGORITHMS........................................................................................................55
3.5.1 Dynamic Route Calculation............................................................................................56

3.5.2 Exhaustive Shortest Path Algorithms .............................................................................57
3.5.3 Table-based Routing Algorithms ....................................................................................58
3.5.4 Heuristic Driven Shortest Path Algorithms ....................................................................59
3.5.5 Finding Multi-modal Routes...........................................................................................60
4 ARCHITECTURE IMPLEMENTATION...............................................................................62
4.1 SOFTWARE IMPLEMENTATION HISTORY...............................................................................63
4.2 SOFTWARE RELEASES ..........................................................................................................64
4.3 IMPLEMENTATION ISSUES ....................................................................................................66
4.3.1 Coordinate Transformation ............................................................................................66
4.3.2 Associating street-names with junctions/links ................................................................67
4.3.3 Route Validation .............................................................................................................67
4.3.4 Map Visualisation...........................................................................................................68
4.4 SECURITY CONSIDERATIONS ................................................................................................68
4.4.1 Dependencies on Third-Party Software..........................................................................68
4.4.2 Insecure Default Configurations ....................................................................................69
4.4.3 Server Hardening ...........................................................................................................69
4.4.4 STIS Software Security ...................................................................................................70
4.4.5 STIS Failure semantics ...................................................................................................70
4.4.6 Insecure Properties Files................................................................................................71
4.5 IMPLEMENTATION RESULTS .................................................................................................72
4.5.1 Map Viewer application .................................................................................................72
4.5.2 STIS Servlet web-service.................................................................................................73
5 EVALUATION ...........................................................................................................................76
5.1 SYSTEM EVALUATION ..........................................................................................................77
5.1.1 Evaluation of the Spatial API .........................................................................................77
5.1.2 Route Retrieval Latency..................................................................................................78
5.2 ROUTE EVALUATION............................................................................................................80
5.2.1 Evaluating Multi-modal Routes ......................................................................................80
5.3 EVALUATION SUMMARY ......................................................................................................81
5.3.1 Evaluation Elements .......................................................................................................81
6 CONCLUSION ...........................................................................................................................84
6.1 FUTURE WORK.....................................................................................................................85
6.1.1 Additional Routing Functionality ...................................................................................85
6.1.2 Adding more information to the database ......................................................................85
6.1.3 Integrating System with Mobile Location Services.........................................................86
7 BIBLIOGRAPHY.......................................................................................................................87

Tables and illustrative material
Figure 1 Illustration of Bradshaw’s combined train timetable (1850) Page 2
Figure 2 Dublin City Council Travel Map Page 9
Figure 3 Dublin City Council Camera View Page 9
Figure 4 Dublin Transport Office Journey Planner Page 11
Figure 5 TfL Journey Planner Page 13
Figure 6 AA Ireland Journey Planner Page 15
Figure 7 Google Maps Screenshot Page 18
Figure 8 Map24 Route Map Page 19
Figure 9 Dublin Bus Search Interface Page 21
Figure 10 Dublin Bus Images Page 21
Figure 11 Map of Dublin City Centre Bus Stops Page 22
Figure 12 DART Journey Planner Page 24
Figure 13 Luas Search Interface Page 26
Figure 14 Luas Stop Map Page 27
Figure 15 High-Level Architecture Diagram Page 33
Figure 16 Project Design Diagram Page 35
Figure 17 STIS Class Diagram Page 36
Figure 18 Route Request Example XML Page 44
Figure 19 Route Response Example XML Page 46
Figure 20 STIS Communications Structure Page 50
Figure 21 OSI Irish National Mapping Datum Page 52
Figure 22 Exhaustive and Bounded Search Space Page 58
Figure 23 Distance-based Search Heuristic Page 59
Figure 24 Travel Mode Graph Examples Page 60
Figure 25 Map Viewer Application Screenshot Page 72
Figure 26 STIS Servlet Interface Screenshot Page 74
Figure 27 STIS Servlet Response Page 75
Figure 28 Graph of the response latency and number of route links Page 79
Figure 29 Multi-modal route screenshots Page 80


2
1 Introduction
“Under his (Phileas Fogg’s) arm might have been observed a red-bound copy of
Bradshaw’s Continental Rail and Steam Transport and General Guide, with its
timetable showing the arrival and departure of steamers and railways” – from
‘Around the World in 80 days’ by Jules Verne (1872)
The origins of the travel information service can be traced back to the initial
advancements in mass transit systems, first realised during the industrial revolution of
the 19th century. Canal barges and steam-driven locomotives provided a cheap,
reliable and affordable means hauling goods and passengers over relatively long
distances. The steam-driven locomotive especially, opened up new opportunities of
travel to the average person and ushered in the first commuter services.
The rapid expansion of those early mass transit systems created a new set of problems
to be overcome. With the increasing complexity of the early railway infrastructures, a
standard (universal) time had to be introduced, as well as a rigorous codification of
train departure and arrival times.
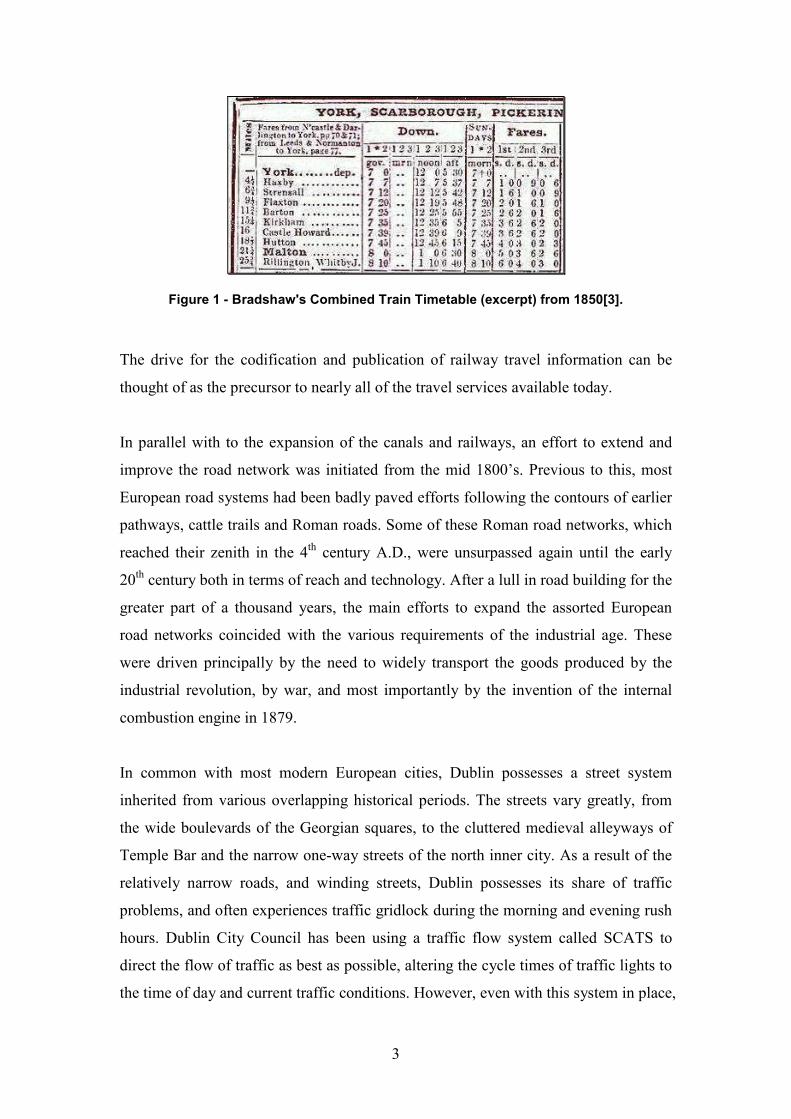
Starting in the early 1840’s, one George Bradshaw of Lancashire, England, began
producing the first combined volume of railway timetables, including large-scale area
maps, describing the times and movements on the new railway network in Britain[3].
This almanac of travel data was later expanded to include many more countries, and
shortly before the outbreak of hostilities in 1914 it contained a reference guidebook to
nearly every train service in mainland Europe, along with a companion hotel and
travel guide.
3
Figure 1 - Bradshaw's Combined Train Timetable (excerpt) from 1850[3].
The drive for the codification and publication of railway travel information can be
thought of as the precursor to nearly all of the travel services available today.
In parallel with to the expansion of the canals and railways, an effort to extend and
improve the road network was initiated from the mid 1800’s. Previous to this, most
European road systems had been badly paved efforts following the contours of earlier
pathways, cattle trails and Roman roads. Some of these Roman road networks, which
reached their zenith in the 4th century A.D., were unsurpassed again until the early
20th century both in terms of reach and technology. After a lull in road building for the
greater part of a thousand years, the main efforts to expand the assorted European
road networks coincided with the various requirements of the industrial age. These
were driven principally by the need to widely transport the goods produced by the
industrial revolution, by war, and most importantly by the invention of the internal
combustion engine in 1879.
In common with most modern European cities, Dublin possesses a street system
inherited from various overlapping historical periods. The streets vary greatly, from
the wide boulevards of the Georgian squares, to the cluttered medieval alleyways of
Temple Bar and the narrow one-way streets of the north inner city. As a result of the
relatively narrow roads, and winding streets, Dublin possesses its share of traffic
problems, and often experiences traffic gridlock during the morning and evening rush
hours. Dublin City Council has been using a traffic flow system called SCATS to
direct the flow of traffic as best as possible, altering the cycle times of traffic lights to
the time of day and current traffic conditions. However, even with this system in place,

4
and a dedicated traffic control office, the physical limitations of the Dublin road
network continue to cause commuter headaches.
The principal mode of commuter travel remains the automobile, however there a
number of complementary means of public transport available such as Dublin Bus,
the Luas tram system, and the DART light rail network. By and large these networks
are separated from the private road users by reserved lanes and tracks, however some
Luas and Dublin Bus route do occasionally get delayed by traffic congestion along
Dublin streets.
The goal of many commuters in Dublin is to minimise the likely delay encountered
whilst driving or using public transport in Dublin. Typically most commuters stagger
their journeys to travel outside of peak hours, or avoid well known traffic bottlenecks.
In addition, commuters may access some existing information sources giving traffic
and public transport updates, however at the present time these services are still rather
limited in their scope.
This project is the logical progression arising from two distinct ideas, firstly that the
road transport network in Dublin is becoming more constricted by the growing
volume of daily commuters, and secondly that the increasing inter-connectedness of
both public and private transportation modes is under-utilised by commuters currently
when planning journeys. The impetus behind this project therefore, is to take existing
information about Dublin transport networks, derive useful journey routes for
travellers using the available data, and allow for the addition of new data streams at a
later date.
1.1 Goal
The central idea behind Global Smart Spaces is to leverage an IT-rich environment in
order to extract information about the context or the location of “services” available to
a user within their immediate physical surroundings. This project, the Smart Traveller
Information Service (STIS), is part of a larger research effort into Global Smart
Spaces, and arises out of previous work done in the iTransIT project.
5
The goal of this project is to provide urban and sub-urban commuters in Dublin with
up-to-date travel information, taken from a number of disparate legacy travel data
sources, supporting a number of different modes of transport, from public bus services
to trams, automobiles and cycling/walking. The output of this project is to be travel
information, provided to the user, and taking the form of a journey itinerary using
multiple modes of transport to comprise a single route.
In Dublin currently, the main modes of public transport, car, bus, metro (DART), train
and tram (Luas) each have a web-site each dedicated to the provision of timetable
information, route information, ticketing, etc. However, although the Irish national
transportation company, Corás Iompair Eireann (CIE), manages Dublin Bus, Intercity
coaches, Intercity trains and the DART metro, there is no single CIE web-service
which permits users to plan a journey using all these modes of transport in the same
route plan. For example a user wishing to travel from Heuston station to Donnybrook
in Dublin (a journey of approximately 8km), must independently search the tram
(Luas) timetables, the Dublin bus timetables, and in addition find the location of the
Luas stop relative to the bus stop and the walking route between these two.
If a user is to truly benefit from the latent information available across many existing
transport networks, the data must be retrieved in (near) real-time from many
heterogeneous data sources, tabulated, and presented quickly and simply to a
requesting user. In addition the requesting user must be able to refine the search
parameters according to imprecise inputs, spatial coordinates or other travel
preferences. The differences between the underlying transportation options should be
presented to the user in as similar a fashion as possible, so as to encourage multi-
mode journeys, and to guard against over-reliance on one or other form of transport
information.
The long-term goal of providing this type of integrated travel planning service, would
be to increase the number of commuters using public transport, reducing the number
of single-occupant vehicles from the road network, decreasing the reliance on fossil
fuels, improving government interest in the funding of public transportation and
benefiting the overall environment.

6
1.2 Approach
Early Internet travel services were typically presented in a static fashion, similar to
their paper-based counterparts, with perhaps a limited query interface. However as the
popularity of the Internet grew, these travel services began providing dynamic content,
for example, by offering users route maps, hyper-linked route timetables, multi-mode
transport options and estimates on the expected journey time for a user-defined route.
In tandem with the ever increasing availability of user-searchable travel applications,
the increased processing power and connectivity of wireless mobile devices has began
to replace the typical urban/sub-urban traffic information sources, such as guidebooks,
street-maps, and other paper-based travel information, with networked travel
applications residing on personal computing devices such as mobile phones and
PDA’s.
In addition, with the high levels of Internet availability, especially in Ireland, there has
been an equal focus on the provision of web-based travel information systems.
Current web-based applications, some presented here in this document, have the
capability to provide route guides (both textual and graphical) over the Irish road
network, with some specifically tailored towards the Dublin metropolitan area.
For mobile devices, many static train, bus and metro timetables are available via SMS
short-codes and WAP/CHTML. These services are being improved on steadily,
allowing some GPS-equipped mobile devices to act as dynamic routing and mapping
units, most notably installed in automobiles and other road vehicles.
The approach towards this project is to study the current state of the art in travel
information services, applying this knowledge towards the design of a multi-modal
travel planner for the Dublin metropolitan area. The software implementation will
reflect the constraints and specifications outlined in section 3.1 of this document. The
principal approach is to take the existing travel data (in a spatial model of Dublin’s
travel services), and construct a journey planning service which goes farther than the
existing travel planning services available for Dublin.
7
1.2.1 Roadmap
Chapter 2 introduces the concept of a Smart Traveller Information Service, and
presents an overview of the current state of the art in traffic information services,
focussing on web-based mapping and routing services. In this chapter there is also a
comparison of each traffic information services against the Smart Traveller
Information Service (STIS) to be implemented for this project.
Chapter 3 is a description of the initial architecture design, an outline of the potential
problems this architecture may have to overcome, and a description of the design
decisions taken for the various logical components of the system.
Chapter 4 illustrates the issues involved implementing the Smart Traveller
Information Service, the difficulties encountered, and how they were overcome.
Chapter 5 describes the means used to evaluate the software developed for this
project, the results of these evaluations, and a discussion on how the system as a
whole could be improved.
Chapter 6 is a summary of the main conclusions of this project, its implementation,
design and performance. Included this chapter is a discussion of potential future work,
which could build upon the work done in the project.
Chapter 7 is a bibliography, listing all the resources, both printed and electronic,
touched upon during the project.

8
2 State of the Art
"The journey, not the arrival matters." – quote attributed to T.S. Elliot
There are a large number of, mostly web-based, routing and mapping applications
available currently, allowing both mobile and web-based users to plan their journey
online before setting out. Some more advanced mobile applications incorporate
positioning, and real-time traffic information to give users the ability find routes
dynamically, whilst travelling.
The main focus of this chapter is to evaluate the network-based journey planning
services currently deployed on the Internet. In addition this section will compare and
contrast these existing services with the proposed scope of Smart Traveller
Information Service.
The majority of routing services deliver relatively static map, timetable, or route data
for user-defined journeys through the road network mostly, with a heavy focus on
vehicle traffic routing. Some vehicle routing services use dedicated in-vehicle routing
and mapping units, e.g. GPS car kits, however most of these are not network
connected, and provide, in essence, interactive route maps based on the vehicles
current location.
Typically most currently available journey planning web services offer only an
extremely limited routing service, in general based on a single transportation method.
However there are a number of integrated transportation systems offering commuters
multimodal journey plans using a variety of public transportation options. The
impetus behind these multi-modal routing services tends to be where there is a
centralised public transportation strategy for a city, a single state-owned
transportation company, or where the transportation services have such large
networks that users require assistance planning journeys. Most major European cities
are beginning to make these types of integrated travel services available, as the
burgeoning public transport infrastructure offers more choice to commuters and
visitors travelling around a city.

9
2.1 Web-Based Mapping and Routing Service
2.1.1 Dublin City Live (Traffic Congestion Map)
This web-based service is provided by Dublin City Council, ostensibly to give
commuters a graphical view of the road traffic congestion on Dublin city’s streets.
Dublin City Council themselves say on the web-site that the services aims “to deliver
real-time traffic information to DCC website users”[4].
The road network is represented as a web of
unnamed lines representing the main roads
around the city centre, with place names for
outlying districts, e.g. Phibsboro, Cabra,
Rathmines etc.
The congestion levels of the roads are
represented using four colours, green for
light traffic, yellow and red for progressively
heavier traffic and grey for no data. On the map are also some icons indicating
parking facilities and traffic cameras. The traffic camera icons can be selected to show
the current view of the traffic. However the images can often be quite out of date.
The web-site limits itself just to a dynamic
traffic congestion display, there are no
indications about the effect of congestion on
public transport, nor are there any facilities
for the web service to suggest alternative
routes around congestion areas. The provision
of public transportation is overlooked, and the
web-site itself can take quite a while to load at
peak times (evening rush hour).
Figure 2 - DCC Travel Map
Figure 3 - DCC Traffic Camera View
10
The underlying XML data is accessible, so there is a possible security implication of
having the “raw” traffic data available for public viewing.
In a somewhat related service, Dublin City Council also provides a broadcast service
over FM radio, providing general traffic updates to users at peak times [5]. This
service utilises the same traffic camera images which are available in the web-site, as
well as providing radio listeners with a dial in number to leave traffic information.
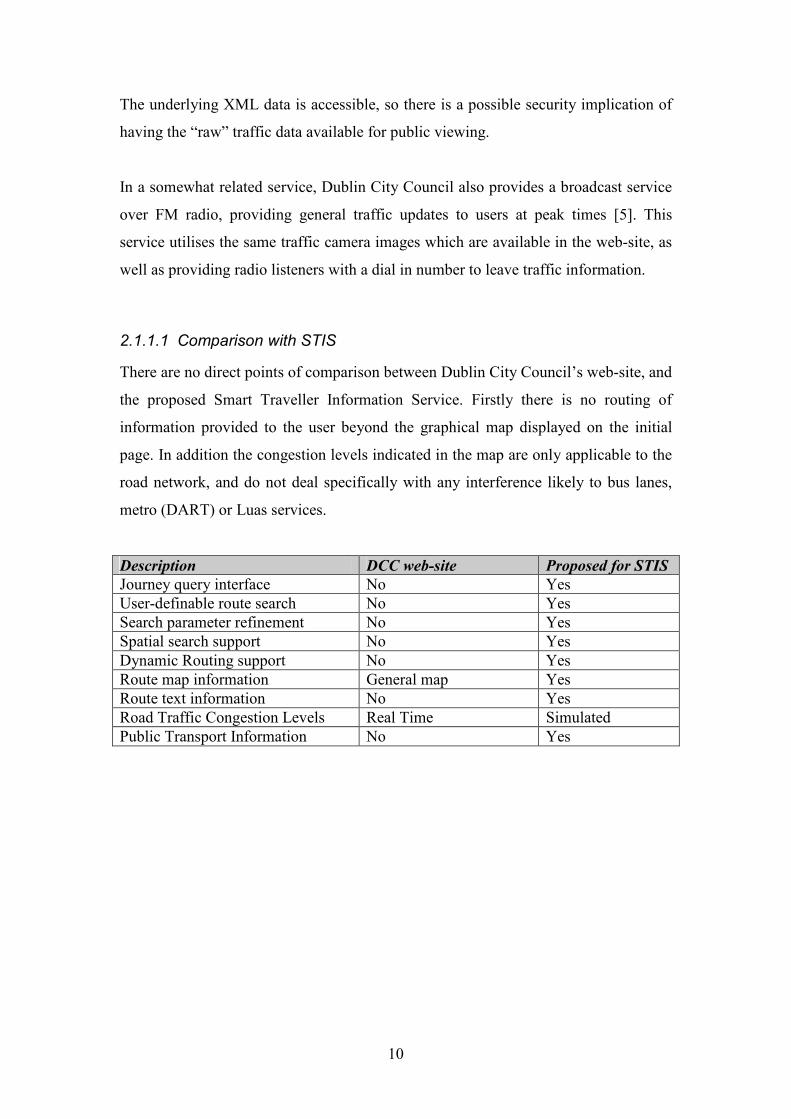
2.1.1.1 Comparison with STIS
There are no direct points of comparison between Dublin City Council’s web-site, and
the proposed Smart Traveller Information Service. Firstly there is no routing of
information provided to the user beyond the graphical map displayed on the initial
page. In addition the congestion levels indicated in the map are only applicable to the
road network, and do not deal specifically with any interference likely to bus lanes,
metro (DART) or Luas services.
Description DCC web-site Proposed for STIS
Journey query interface No Yes
User-definable route search No Yes
Search parameter refinement No Yes
Spatial search support No Yes
Dynamic Routing support No Yes
Route map information General map Yes
Route text information No Yes
Road Traffic Congestion Levels Real Time Simulated
Public Transport Information No Yes

11
2.1.2 Dublin Transportation Office (Route Search)
Dublin Transportation Office (DTO) web-site provides a journey planner to help
commuters in the Dublin greater metropolitan area [6]. The DTO organisation is
dedicated to implementing the Irish government’s Dublin Transport Initiative, and as
such can be considered an organisation within the Department of Transport.
Figure 4 - DTO journey planner map and route
The DTO journey-planner provides a walking and cycling routing planner, allowing
the user to input a start and an end point for the journey. The user input can be refined,
as the system returns a list of address possibilities (if they exist) for both inputs. This
selection process allows a user to quickly filter out undesired way-points, or correct
mistakes. The search results returned give the user the route both as a textual
description, and graphically with the route marked on a map.
The system is somewhat limited in that the journey route proposed by the system is
limited to cycling or walking – there is no travel information regarding public
transportation data into the route suggestions by the system (aside from some
waypoint routing via DART stations). It is possible that drivers could use the service
to plan routes across the city; however the web-site does not provide any traffic
congestion information.
2.1.2.1 Comparison with STIS
The DTO journey planner provides a simplistic but useful routing and mapping
interface. The web service limits the user to one of three modes of travel – walking,
cycling or automobile. Someone using the service can enter a search parameter, and

12
be provided with a number of options to refine the search parameter. For example,
typing “LEESON” as a search parameter yields a number of options including
LEESON STREET, LEESON PLACE, etc. This feature is very useful in allowing a
commuter to refine vague search parameters into more definite search items.
Description DTO web-site Proposed for STIS
Journey query interface Yes Yes
User-definable route search Yes Yes
Search parameter refinement Yes Yes
Spatial search support No Yes
Dynamic Routing support No Yes
Route map information General map Yes
Route text information Yes Yes
Road Traffic Congestion Levels No Simulated
Public Transport Information Limited Yes
13
2.1.3 Transport for London (Integrated Travel Planner)
The Transport for London (TfL) web-service appears to be a more expansive, and
elaborate version of the DTO travel planner, focusing on commuter journeys in
London using a number of means of public transport [7]. The public transportation
options in a major urban centre such as London are varied and well supported, with a
well developed infrastructure and good integration between different modes of
transport.
The principal public transportation modes under the direction of the TFL are
• London Busses
• London Underground
• River Transportation Services (River Ferries)
• Light Railway Services
In addition to the public transportation services, the TFL organisation manages the
London congestion charging scheme, whereby road users within the city limits are
charged a fixed daily rate, which at time of writing is £5 GBP. The main focus of the
TfL web-site however is the provision of a commuter journey planning tool, which
integrates all the public transport options into a single relatively seamless travel plan.
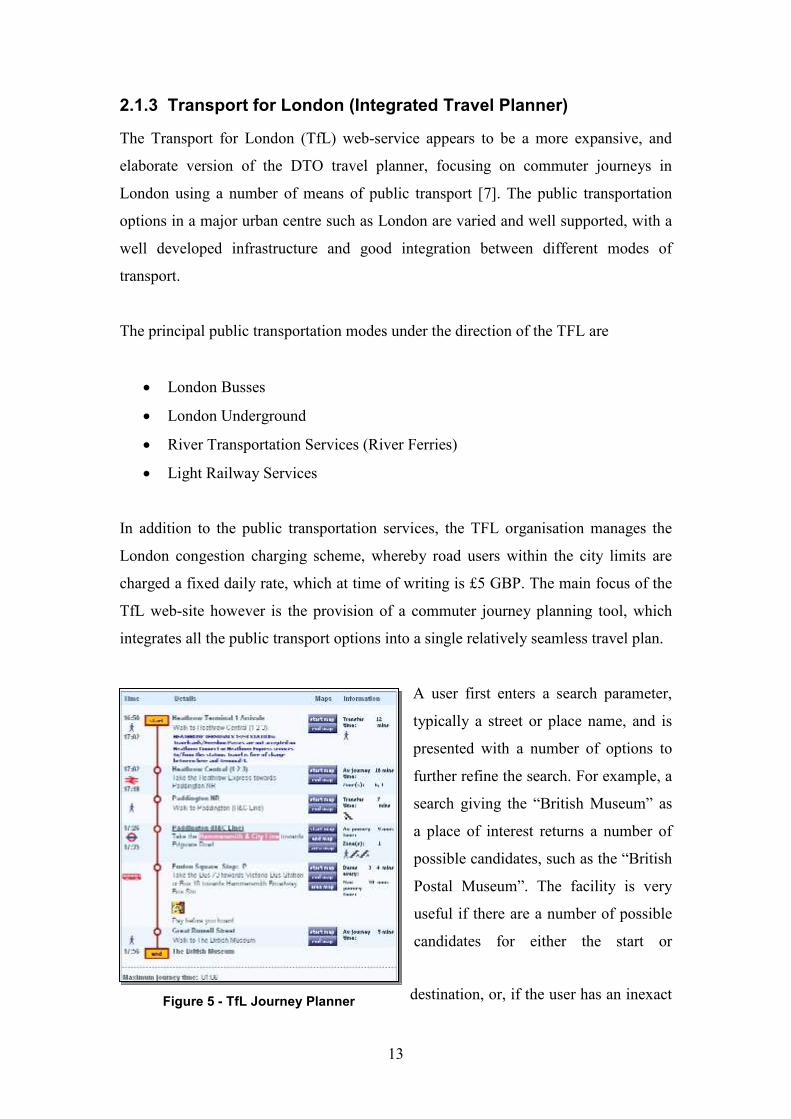
A user first enters a search parameter,
typically a street or place name, and is
presented with a number of options to
further refine the search. For example, a
search giving the “British Museum” as
a place of interest returns a number of
possible candidates, such as the “British
Postal Museum”. The facility is very
useful if there are a number of possible
candidates for either the start or
destination, or, if the user has an inexact Figure 5 - TfL Journey Planner

14
idea of their name or address. It could also be argued that a comprehensive listing of
all the available options could also lead to some confusion when selecting route
waypoints.
Once a journey origin and destination are fixed upon, the user is presented with a
number of options based on the type of travel connections possible to complete the
journey - with various times, distances and travel mode differences outlined.
2.1.3.1 Comparison with STIS
Of the various web-based journey planners available, the TfL service is perhaps the
most well implemented, and user friendly. The scale of the public transportation in
London is enviable, and the service does an especially good job of integrating various
transportation modes into a single user-defined journey.
There are however a number of drawbacks to the system, including some omissions
which are included in the proposed STIS system. Chiefly among the limitations is the
requirement to “know” your current location, journey origin and destination before
you begin a search. There is no support for spatial queries, and the graphical map
returned to the user is more a logical representation than being geographically
accurate.
Description TfL web-site Proposed for STIS
Journey query interface Yes Yes
User-definable route search Yes Yes
Search parameter refinement Yes Yes
Spatial search support No Yes
Dynamic Routing support Yes Yes
Route map information Logical map Yes
Route text information Yes Yes
Road Traffic Congestion Levels Some Simulated
Public Transport Information Yes Yes

15
2.1.4 AA Roadwatch – Route Planning Service
The Irish Automobile Association (AA) provides a limited road route-planning
service, which allows users to enter a start and destination place-name, and be
provided with a textual description of the route of their journey [8]. The service is
tailored predominantly towards vehicle commuters, and the routing parameters
provided give drivers succinct information to get to their destination. The routing
parameters list the road identifier, e.g. N7, the cumulative distance in miles, and
turning/junction directions. The information returned from the routing service
suggests the service is more tailored towards inter-city journey planning along
national roads than routing within an urban environment.
Figure 6 - A composite of two images from the AA Route Finder Service [8].
The AA routing service does provide users with the ability to refine their search,
according to a list of street and place names. The fact that the AA routing system
encompasses the entire Irish road network, or so it seems, has a drawback in that
refinement options can often list very different areas in the country.

16
2.1.4.1 Comparison with STIS
The AA journey planner offers a similar, but much more basic, service than what is
proposed for the STIS system. The principal area of similarity is the provision of a
textual description of the journey from start to destination. There is, more than likely,
a detailed spatial database behind the AA routing service, however there is no
mapping or graphical component to the service. This lack of a route map is possibly
due to either complexity in implementation or, more likely, high costs associated with
providing graphical maps to the public.
Description AA web-site Proposed for STIS
Journey query interface Yes Yes
User-definable route search Limited Yes
Search parameter refinement Yes Yes
Spatial search support No Yes
Dynamic Routing support No Yes
Route map information No Yes
Route text information Yes Yes
Road Traffic Congestion Levels No Simulated
Public Transport Information No Yes
2.1.5 Washington State Commuter Map (Traffic Congestion Map)
The Washington State Department of Transport provides a traffic congestion map via
its web-site. Being based in the united states, the target consumers for this service are
almost entirely automobile-based commuters using the state’s highway system [9].
A user can view a graphical map representing the traffic density on the main
motorways, as well as textual information on planned roadworks, and expected delays
depending on the time of day and traffic density.
In addition to labelling the principal towns and motorways in the area, there are
placed throughout the state, a number of publicly accessible traffic cameras which are
focused on major roads and intersections.

17
There is no functionality available on the web-site for routing around traffic
bottlenecks, but at least a user can get a reasonably good idea of traffic conditions
both with the map information, the text description, and the traffic camera images.
2.1.5.1 Comparison with STIS
Similarly with the Dublin City Council traffic map, there are few points of
comparison between this service and the STIS system. The main areas of similarity
are the provision of traffic congestion information, and a textual summary of the
likely journey duration and distances for a user-defined search.
Description Present in DTO web-site Proposed for STIS
Journey query interface Limited Yes
User-definable route search No Yes
Search parameter refinement No Yes
Spatial search support No Yes
Dynamic Routing support No Yes
Route map information Graphical map Yes
Route text information Limited Yes
Road Traffic Congestion Levels Yes – Highways Simulated
Public Transport Information Very Limited Yes
2.1.6 Google Maps (Route and Map Search)
The Google Maps service was launched in 2005, and initially provided map
information restricted to the continental united states. Shortly thereafter map
information was made available covering Ireland and the UK, providing detailed
urban street maps and satellite images [10].
This type of mapping service is not unique, in that there were online mapping and
routing Internet applications before it appeared, but it is perhaps one of the best
executed web services of its kind at the moment, second only perhaps to the Map 24
service [11].

18
The Google Maps interface uses Java Ajax
technology to provide an interactive
interface to users, allowing route searches,
as well as very detailed street-maps and
satellite imagery.
Routing information is provided both in a
graphical map format, as well as text
describing the directions for the journey.
The principal disadvantages of the Google Maps web service is the complete
exclusion of any public transportation routing options. In addition there seems to be
no address lookup functionality for Dublin (or other Irish) street addresses. A user
searching for even a relatively well known address such as “College Green, Dublin,
Ireland” will not be successful with the current incarnation of the Google Maps
service, as of September 2006.
There are plans to expand the service to include some public transportation options
when responding to a route query. However Google state that this service, when it is
launched, will be limited to the “Portland, Oregon metro area, but we plan to expand
to cities throughout the United States and around the world” [12].
At the time of writing Google are planning have launched a beta-version of their web
service specifically designed for mobile devices. This service optimises the Google
Maps functionality and graphics for display on more restrictive mobile screens, but
provides the same overall type of service and content [13].
2.1.6.1 Comparison with STIS
Google Maps is primarily a source of map information, with routing and public
transportation very much a secondary consideration. There are limited areas of
overlap between the STIS service and the Google Map offering. Outside of the united
Figure 7 - Google Maps Example

19
states, the recognition of place-names is very poor, and it appears there is no
European GIS database offering address validation or lookup.
Description Google Maps web-site Proposed for STIS
Journey query interface Limited Yes
User-definable route search No Yes
Search parameter refinement No Yes
Spatial search support No Yes
Dynamic Routing support No Yes
Route map information Graphical map Yes
Route text information Limited Yes
Road Traffic Congestion Levels Yes – Highways Simulated
Public Transport Information Very Limited Yes
2.1.7 Map 24 Service (Route and Map Search)
The Map 24 web-site hosts a route search and mapping application [11], for both the
US and a number of European countries, much like Google Maps. The interface
provides a slightly better user experience than Google Maps, mostly by providing
users with a toolbar giving scaling, rotation and zoom options, as well as novel
features such as a ruler to measure distance (overlaid) on a map, and multiple distance
waypoints to trace non-linear routes.
Figure 8 - Map24 route showing journey from Capel St. to the Phibsboro Road in
Dublin[11]
20
2.1.7.1 Comparison with STIS
The Map24 service is an improvement on the Google Maps web-service, and contains
a reasonably well executed map interface, and routing service, and detailed content.
Unlike its Google counterpart, Map24 has a well furnished place-name database,
covering the Dublin metropolitan area. It does not however offer the same satellite
imagery as the Google Maps web-service.
The site graphics, especially the graphical description of the route, was an inspiration
for the design of the web-front end in the STIS service. Since the STIS service is not
predominantly concerned with presentation, but journey planning, it was felt much
work could be done in a similar vain to Map24 interface with respect to the STIS
web-front end.
Similarly with the majority of web-based routing applications, there is no
consideration for public transport services when performing route searches. This
restriction contrasts with the goal of the STIS system of integrating public and private
transport mechanisms into a single journey plan.
Description Map24 web-site Proposed for STIS
Journey query interface Yes Yes
User-definable route search Yes Yes
Search parameter refinement Limited Yes
Spatial search support No Yes
Dynamic Routing support No Yes
Route map information Graphical map Yes
Route text information Yes Yes
Road Traffic Congestion Levels No Simulated
Public Transport Information No Yes

21
2.2 Web-based Public Transportation Information
2.2.1 Dublin Bus (Timetable and Route Search)
The Dublin Bus company [1] operates under the umbrella of the CIE group of
companies [14], which are state owned transport companies providing much of the
national bus and rail services for the country. Bus Eireann and Irish Rail also form
part of CIE, and in a sense each of these public transport services can be seen as a
different operating arm of the same company.
Dublin Bus operates many services in and around
Dublin City, as well as some services to more
outlying areas (for example Blessington in Wicklow).
Generally speaking however, Dublin Bus routes are
largely confined to the Dublin metropolitan area,
with Bus Eireann operating inter-city services across
the country.
As with many urban bus services elsewhere, Dublin Bus assigns each of its routes a
unique number/letter combination, which may not be immediately understood by
tourists and other visitors to the city.
Figure 10 - Dublin Bus Stops (Left) and Route Numbers on Dublin Bus Services (Right)
Figure 9 - Dublin Bus
Route Search
22
This route number can be found printed on timetables at each bus stop, but unless a
commuter is acquainted with the route number in advance, there is no information to
suggest where a particular bus will stop. This requires an uncertain commuter to find
the route number by other means, such as the internet, at a particular bus stop, or by
enquiring elsewhere.
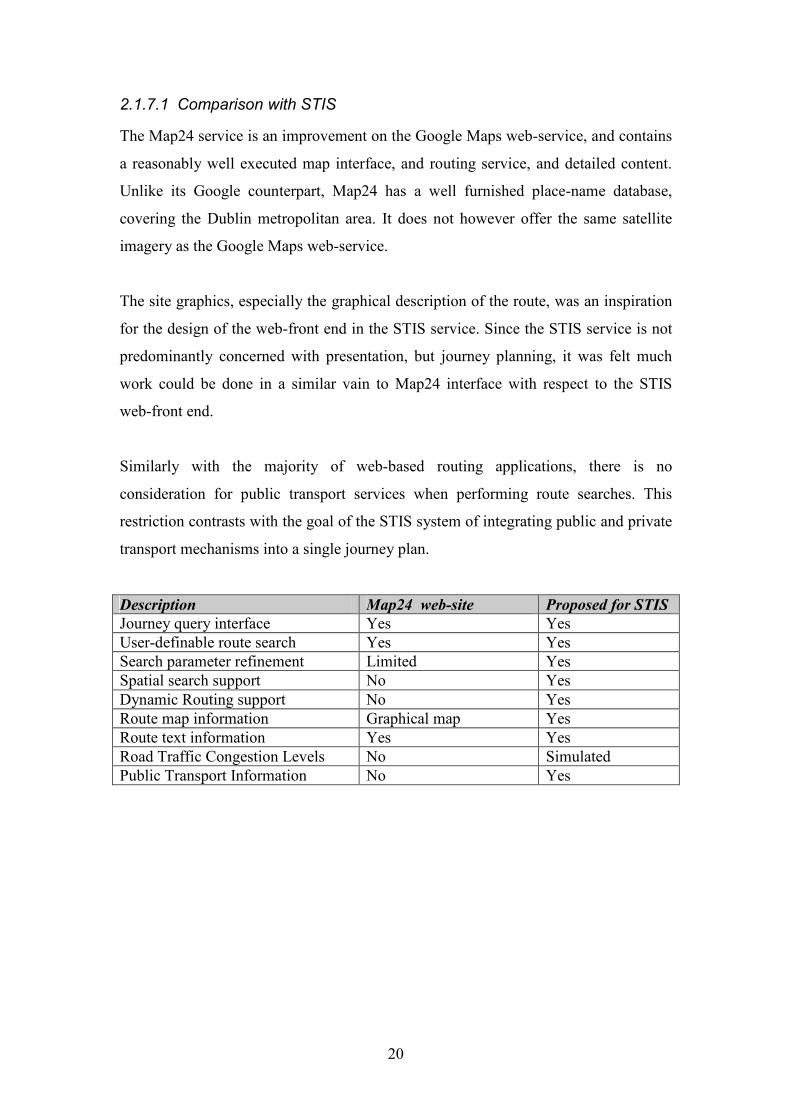
The Dublin Bus web-site provides a very limited search function (see Figure 9) which
will provide bus stop and timetable information for a particular route, or a particular
place name.
In addition, the web-site provides a
map (pictured on the left) showing the
position of particular bus stops in the
city centre, again listing each stop
according it’s the route number.
The routes themselves are not
represented graphically, and the
information provided about bus stops
along the route is very minimal, listing
a street-name or general area typically.
This has the effect of leaving first time
commuters unsure about the likely
direction a particular route will take, or what intermediate stops they may encounter
along the route.
Figure 11 - Dublin City Centre Bus Stops [1]

23
2.2.1.1 Comparison with STIS
The Dublin Bus web-service is not much advanced from a digitised form of their
paper-based timetable information. The location of bus-stops outside the city centre is
not immediately available, nor is there any location information about areas not
directly on a bus route.
Description Dublin bus web-site Proposed for STIS
Journey query interface Yes Yes
User-definable route search Limited Yes
Search parameter refinement No Yes
Spatial search support No Yes
Dynamic Routing support No Yes
Route map information Textual/Limited Map Yes
Route text information Limited Yes
Road Traffic Congestion Levels No Simulated
Public Transport Information Some Yes
2.2.2 Dublin Area Rapid Transit (DART)
The Dublin Area Rapid Transit (DART) system was installed in the early 1980’s and
skirts Dublin bay in a wide arc, from Howth in the north to Bray and Greystones in
the south. Currently the DART network provides public transport to 90,000
commuters daily, and runs from 6am until midnight seven days a week.
The DART system is integrated with the Irish rail network, and uses the same gauge
rail lines as Intercity trains. The DART system connects to the rest of the Irish railway
grid at a number of key points, such as Connolly Station. At the time of writing there
are no DART services connecting to Heuston Station, however there are plans to
connect Heuston with the DART network by building a tunnel under the city starting
from the IFSC, with work beginning in 2009 and scheduled to be complete in 2015.
Rail connections to the south and west of Ireland are provided via Heuston station,
and while there is a Luas stop, a DART connection would greatly ease the traffic
congestion on the city’s streets.

24
Figure 12 - DART Journey Planner [15]
The information available on the DART website, http://www.dart.ie, provides mostly
static timetables, as well as information about ongoing disruptions, scheduled
maintenance work, and ticket information. As was the authors experience of five
years commuting to work on the DART, most disruptions to the service are neither
expected ahead of time, nor quickly posted on the DART web-site. Chief among the
disruptions occasionally experienced by commuters are vehicles hitting level-
crossings and unscheduled industrial action by employees.
The search functionality incorporated into the DART web-site is linked with other rail
services, and provides requesting users with a broad range of travel options,
timetables, and details of Inter-City trains, Light Rail services and the DART. The
web-site allows users to request a “multi-modal” journey, in the sense that both
DART and regular train services can be queried and added to a single journey
itinerary.
CIE provides a limited inter-working facility with Dublin’s Luas network, in that
travellers can purchase a combined Luas/Train ticket, however timetable information
is not meshed for both services (possibly due to the difference in frequency of rail and
Luas services).
There is also a combined DART/coach service to Dublin Airport, which again
provides users with an all-in-one ticket to cover the cost of a DART journey to the
Howth junction stop, with a coach transfer to Dublin airport. The information about

25
this special “AirDART” service can be found on the main web-page, but the
frequency of service is not made clear for the coach transfer.
As the DART network is perhaps one of the more reliable (in terms of adherence to
published timetables) it lends itself more towards web-applications targeting mobile
subscribers. At the moment there is a service available using SMS short codes to
retrieve timetable information for any DART station, and provide the next 5 outbound
trains from that station.
The dynamic information, giving commuters news about delays in the DART service
are available within DART stations on electronic signs, however the same service is
not available over the Internet.
2.2.2.1 Comparison with STIS
The DART system does provide a better service than it’s counterparts in the CIE
group of companies, in that it’s web-site features an interactive map giving the DART
stations relative to the map of the Dublin metropolitan area.
Timetable information is available, and there is a good linkage with Intercity rail
services, and some information about linkage with some Dublin bus and other coach
services.
Description DART web-site Proposed for STIS
Journey query interface Yes Yes
User-definable route search Limited Yes
Search parameter refinement No Yes
Spatial search support No Yes
Dynamic Routing support No Yes
Route map information Limited Yes
Route text information No Yes
Road Traffic Congestion Levels No Simulated
Public Transport Information No Yes

26
2.2.3 Luas (Timetable and Route Search)
The Luas tram system is a light urban railway/tramway service in Dublin which began
operating in 2004 [16]. The name “Luas” is derived from the Irish Gaelic adjectival
word meaning “fast” or “speed”, for example “ag dul thart ar luas”, is the phrase “to
pass at speed”.
Previously there had been an extensive tramway system in Dublin up until the 1950’s,
however the thinking in urban planning at the time was more focussed on automobiles
as the future transportation trend, and the tramways were paved over for road traffic.
The Luas system operates two tram
lines, the red line, from Tallaght
into the city centre, and the green
line, from Leopardstown into St.
Stephen’s green. There are
approximately 23 stops on the red
line, and 13 on the green line.
Travel times, and the frequency of
service can vary somewhat but the
typical travel time from one end of
the line to the other is approximately 30-40 minutes, with a tram leaving
approximately every 5 minutes at peak times.
There is some limited information available from the Luas web-site (www.luas.ie),
providing details on routes, timetables and ticketing details. The Luas timetable
information is somewhat vague, giving only frequencies of the service (measured in
minutes), rather than any particular fixed timetable. Perhaps, since the frequency of
service is comparatively large, and the journey time is small compared to train
services, the lack of a strict timetable is not a great issue for commuters.
Figure 13 - Luas web-site

27
Located at each Luas stop (both inbound and outbound platforms) is an electronic
board showing the estimated arrival time of the next tram and its ultimate destination.
The presence of these boards at the Luas stops, and the regularity of the service
(typically a tram arrives every 10-15 minutes), somewhat negates the need for
commuters to consult a timetable to prior to commencing their journey.
Figure 14 - Luas routes (Left) and a typical Luas Stop with information board (Right)
There is only a partial link up with other public transport services from the Luas mass
transit system. At best a commuter may purchase a Luas ticket in addition to their
train ticket, however there is no web-service available from the Luas home-page
offering any multi-modal journey planning. The only extra information available on
the Luas web-site is restricted to some web links to other travel operator sites, such as
Dublin Bus, CIE and various national coach companies.
2.2.3.1 Comparison with STIS
Similar to the Dublin Bus web-site, the Luas web page seems to be focussed on
providing an Internet version of the static timetable information for the service. The
timetables provided are not particularly convenient, in that there are only frequencies
of service published.
There is very limited information about how a traveller would find there way from an
outlying Luas stop (or even a city centre one) to their final destination. In summary,
the Luas web-site does not provide any further directional or routing information for
its user’s once they leave the Luas Stop.
28
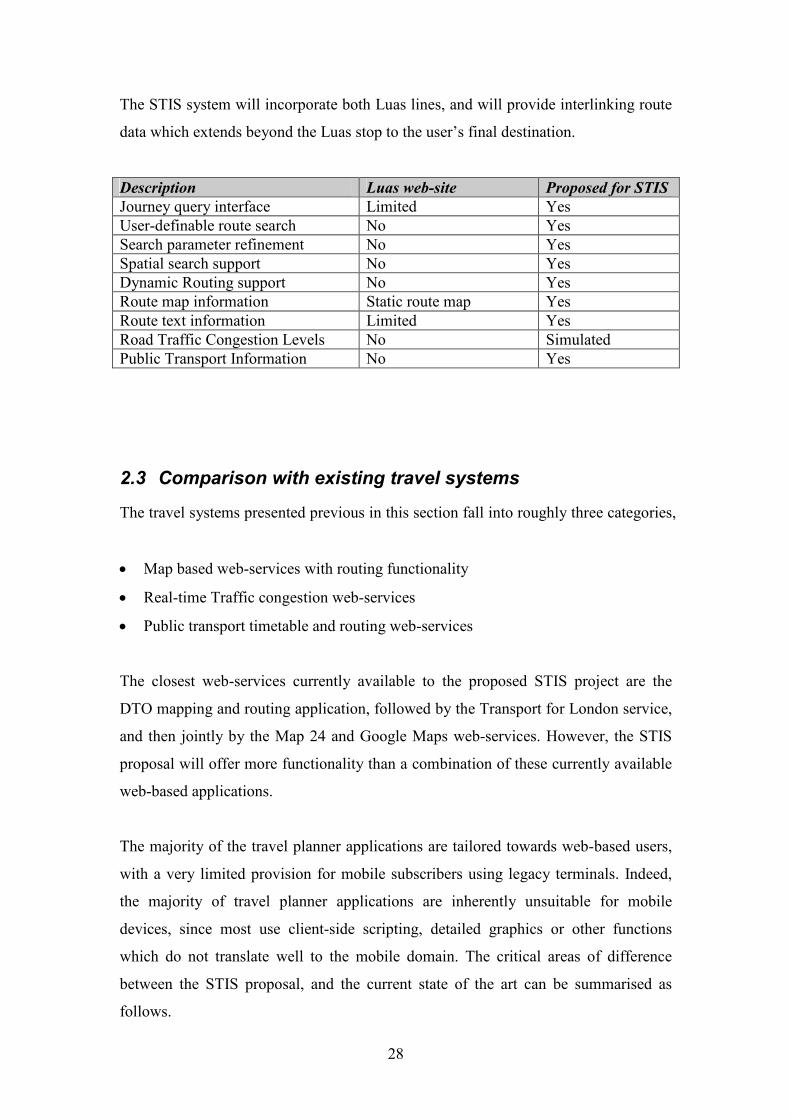
The STIS system will incorporate both Luas lines, and will provide interlinking route
data which extends beyond the Luas stop to the user’s final destination.
Description Luas web-site Proposed for STIS
Journey query interface Limited Yes
User-definable route search No Yes
Search parameter refinement No Yes
Spatial search support No Yes
Dynamic Routing support No Yes
Route map information Static route map Yes
Route text information Limited Yes
Road Traffic Congestion Levels No Simulated
Public Transport Information No Yes
2.3 Comparison with existing travel systems
The travel systems presented previous in this section fall into roughly three categories,
• Map based web-services with routing functionality
• Real-time Traffic congestion web-services
• Public transport timetable and routing web-services
The closest web-services currently available to the proposed STIS project are the
DTO mapping and routing application, followed by the Transport for London service,
and then jointly by the Map 24 and Google Maps web-services. However, the STIS
proposal will offer more functionality than a combination of these currently available
web-based applications.
The majority of the travel planner applications are tailored towards web-based users,
with a very limited provision for mobile subscribers using legacy terminals. Indeed,
the majority of travel planner applications are inherently unsuitable for mobile
devices, since most use client-side scripting, detailed graphics or other functions
which do not translate well to the mobile domain. The critical areas of difference
between the STIS proposal, and the current state of the art can be summarised as
follows.

29
1. Routing functionality will incorporate routes across different individual
public transport services, providing a single query interface, and a “holistic”
journey plan incorporating individual sub-journeys.
2. The STIS system will accept inputs based on undefined, inexact search criteria.
Unlike most traditional systems the physical location of a user can be provided
as a search parameter, not merely a text input, but the co-ordinates of a user in
a specific geographic format (e.g. OSI, WGS-84 etc.).
3. The STIS system will mix public transport travel information with private
commuter (automobile) routing. The STIS system will be theoretically capable
of handling input from Dublin Corporation’s traffic congestion server (SCATS
system), as well as other inputs from legacy travel data sources.
4. Timetable and route information from the underlying travel data sources will
be parsed, and the information will be tailored relevant to a particular (single)
journey.
5. The STIS system XML output can be tailored according to the display
parameters of the target device. Hence the level of detail can be changed
depending on what is required by the user.
Another difference, but not a crucial one, is that the STIS system will provide an
XML interface, allowing the visualisation of the travel data (presentation layer) to
take any form required. This feature will allow the STIS system to support any
number of travel services, be they web-based services using web-browsers, or
bespoke J2ME applications residing on mobile phones and PDA’s.
30
3 Architecture Design
“Good puzzle would be cross Dublin without passing a pub” – James Joyce (Ulysses)
The early architecture design was begun in December 2005 when the project proposal
was finalised. This proposal called for the development of a Smart Traveller
Information System (STIS) capable of responding to user requests (originating in a
separate presentation layer), with multi-modal journey plans encompassing the Dublin
metropolitan area. Initially the presentation layer was outside the scope of the project,
with the focus of the project was solely on determining the appropriate route, over
multiple modes of travel, which would satisfy a given request.
There are a large number of available public mass transit systems, ranging from
airliners and private cars, to public busses, cyclists and pedestrian routes. The types of
public mass transit systems considered for this project were the Dublin Bus network
(or part of), the Luas tram network and the Dublin road network as used by vehicles,
cyclists and pedestrians. The DART [15] rail network was not included in the scope
of this project, with the focus being mainly on the transportation methods which use
(to some degree) the road network in Dublin, and which were already existent in the
spatial database.
The decision to incorporate only these modes of travel, and not other, was primarily
due to the fact large amounts of data already existed in these areas to provide a basis
for implementing the system. Including extra modes of transportation can be done
reasonably easily, provided the “raw” data is first available. In addition, there was
earlier substantial work done in the area, specifically within the iTransIT project. The
iTransIT project is a collective project between Trinity College Dublin, and Dublin
Corporation, looking at various technologies and transport schemes affecting the city.
The Smart Traveller Information System was therefore borne out of the work done in
the iTransIT project, especially earlier research work done with indexing and storing
spatial objects [17], and the travel data already available from this previous work.
31
The system architecture for the newly designated Smart Traveller Information System,
was initially designed on an informal basis. Later improvements and modifications to
the design were added in an incremental fashion, which refined the overall design,
and improved the overall implementation of the final system. The methodology
applied to the initial design, was to iterative over the initial design, refining and
testing the design assumptions until a final system implementation was produced.
This process had the benefit of being quick to incorporate improvements in the design,
whilst removing implementation obstacles.
Initially, taking the project proposal as a starting point, there were a number of ‘open
questions’ left to complete before the final system architecture design could proceed.
These uncertainties included:
1. How to implement the interfaces to the user layer on one side, and the travel data
sources on the other.
2. Whether to provide the interface in a bespoke manner, or using a common
technology.
3. What would be the best way to construct a journey request, and a journey
response, so it could be understood by the user/presentation layer.
4. The appropriate way to represent (internally) the public transport networks.
5. How to calculate a multi-modal route through this model of the transport
networks.
This chapter deals with the design choices faced during the early stages of the project,
and the reasoning behind the important decisions.
3.1 System Requirements
The requirements the STIS system was obliged to fulfil, were worked out at a high
level, in the early stages of the project. The amendments made to the initial system
requirements were due to a combination of the original project proposal, the previous
work done in the area, and from a number of project meetings with the project
supervisor, Dr. René Meier.

32
At a high level, the system was described as a “service enabling travellers to plan
journeys across Dublin involving multiple modes of transportation” [18]. This
implication was that the user would somehow interact with the system (directly or
indirectly), providing some journey parameters, and receive a reasonable, coherent
response, which contains journey information. The interaction between user and
service must allow for the refinement of various travel options, and a mechanism to
present completed journey plans back to the requesting user.
This type of system, which was to act as a journey planner and routing service, must
respond to the requesting user in an understandable (common) format, in addition to
making sense of the user’s inputs and calculating the journey route. The presentation
of the journey information to the end user was the subject of a related MSc.
dissertation project [19], however due to technical difficulties, this project was not
implemented in full, and consequently a “presentation-layer” was added, as a
requirement, for the Smart Traveller Information Service.
The system was not required to be a publicly accessible, nor be industrialised in any
sense, but would server as more of a demonstration platform which could be used as a
visualisation tool, and proof of concept by the travel data model in iTransIT. There
was a requirement that the system should be capable of handling multiple clients, with
a maximum of several (i.e. < 10) concurrent users.
Since the system was to be deployed on a 1.6GHz Dell laptop with 512 MB of
memory, the STIS software was designed to be relatively efficient in the usage of
system resources, and provide a reasonable response time to user requests, similar to
existing web-services. The system was required to dynamically calculate all travel
plans, thus excluding any pre-compilation of the information in the travel data sources.
The project proposal did not stipulate any technologies to be used within the project,
with the single exception of using the existing spatial programming model to access
the spatial objects representing roads, bus routes and Luas information. A design
choice was taken to develop as much of the system as possible using the Java
programming language and related technologies. This was done for a number of
33
reasons which are outlined in more detail in chapter 4, but in essence Java lends itself
more towards rapidly developing web-services some other technologies.
3.2 Initial Architecture
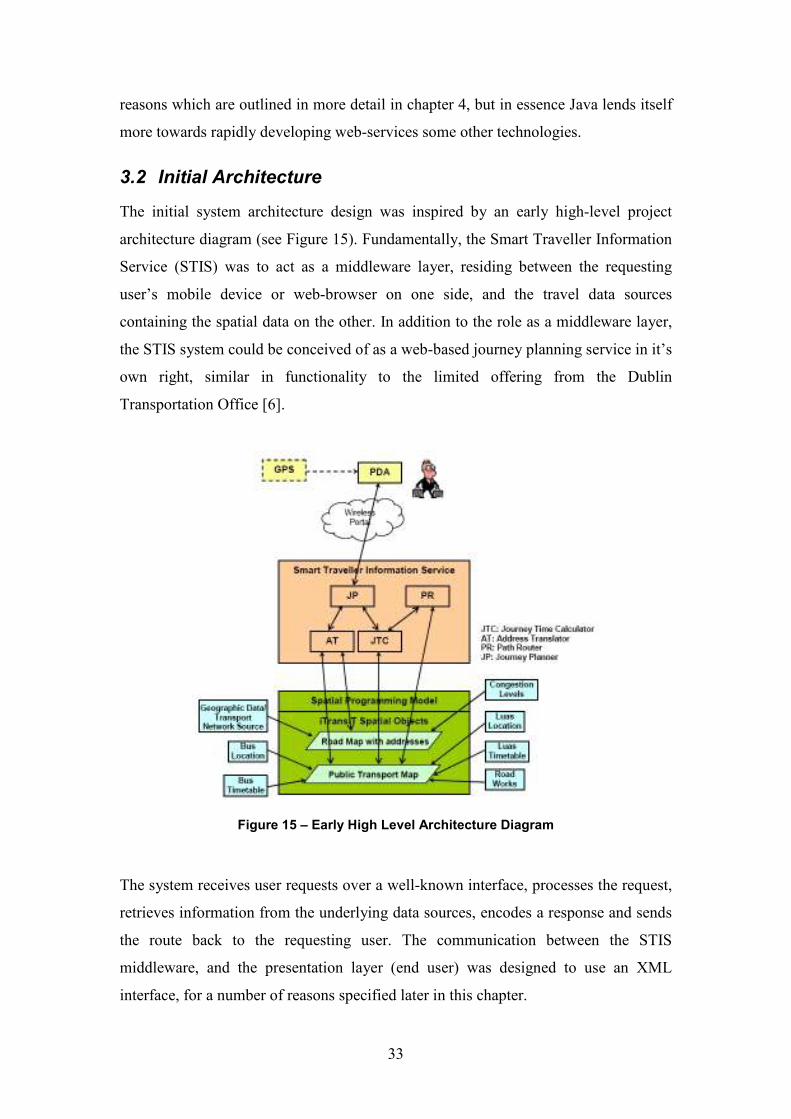
The initial system architecture design was inspired by an early high-level project
architecture diagram (see Figure 15). Fundamentally, the Smart Traveller Information
Service (STIS) was to act as a middleware layer, residing between the requesting
user’s mobile device or web-browser on one side, and the travel data sources
containing the spatial data on the other. In addition to the role as a middleware layer,
the STIS system could be conceived of as a web-based journey planning service in it’s
own right, similar in functionality to the limited offering from the Dublin
Transportation Office [6].
Figure 15 – Early High Level Architecture Diagram
The system receives user requests over a well-known interface, processes the request,
retrieves information from the underlying data sources, encodes a response and sends
the route back to the requesting user. The communication between the STIS
middleware, and the presentation layer (end user) was designed to use an XML
interface, for a number of reasons specified later in this chapter.
34
The interface to the spatial and transport data was designed to utilise as much of the
existing spatial API’s as possible.
There are a number of areas of common functionality described in the high-level
system architecture, such as the address translator, path router, journey time calculator
and journey planner. The idea was to separate as much as possible the handling of the
user’s request from the underlying data sources, and the calculation of the journey
route.
The presentation of the STIS output to the requesting user was originally outside the
scope of the project, however in the early stages of the design it became apparent that
some rudimentary presentation layer was needed. As a result the amount of time
available to work on the STIS system was reduced by the added requirements. Overall
the time spent working on the presentation layer/applications compared to the time
spent working on the STIS service proper, was in the ratio of approximately 40:60.

35
3.3 System Design
The STIS system was designed to act as a middleware platform, residing between the
presentation layer (applications) and the travel data sources (spatial database). The
responsibility of the STIS system would be to convert the user’s input into a journey
request, retrieve the relevant information from the travel data sources, calculate the
journey, and present the result back to the requesting user.
The system design called for two main interfaces, a client-facing interface which
would respond to user requests, and a database facing interface, where it was hoped
the STIS system could use the existing Spatial API implementation to retrieve
information from the database.
The spatial database, which formed the corner stone of the STIS project, was already
existent thanks to previous work in a related project, as was the Spatial API (S-API)
which provided an interface to this database. The work required to implement the
STIS system was helped considerable by the fact that many of these relevant pieces of
the design were already in place before the project was begun.
Presentation Layer
STIS System
Spatial Database/iTransIT Spatial Database
Client Requests (XML)
S-API Requests S-API Responses
STIS Responses (XML)
Figure 16 – High-Level View Of The Project Design
Scope of Project

36
3.3.1 Class Diagram
Figure 17 - STIS Class Diagram
The STIS architecture is comprised of a number of distinct logical blocks, each with a
clear-cut focus and set of responsibilities. The system as a whole consists of four such
logical elements,
1. User Interfaces which facilitate the display of journey information as well as
allowing route requests to be constructed and refined (Presentation Layer).
2. Communications functionality, both internally and externally (Communications
Layer).
3. Journey planning and spatial data caching functionality (Service Layer).
4. Data encapsulation and formatting functions.
3.3.2 Presentation Layer
The presentation layer was originally conceived as a typical GUI interface providing
means to access the underlying STIS system. To support this presentation layer, the
STIS system was required to provide a user front-end, in order to allow user inputs,

37
and to graphically interpret the spatial information/journey routes produced by the
STIS service.
The original project proposal for the Smart Traveller Information Service (STIS),
called for the provision of a stand-alone journey planning and routing service,
communicating with the outside world over a well-known interface in an agreed
format. This view of the system was changed in the early stages of the project due to
technical difficulties with another dependent project. Consequently a visualisation
mechanism, or presentation layer, was required for the STIS system, both to construct
journey plan requests, and display the STIS output in a graphical form. For
verification purposes alone, a graphical means of displaying a route improves error
detection, and reduces implementation time considerably.
There was no firm design requirement for the presentation layer, other than it should
be capable of displaying the output of the STIS service graphically, overlaid on a map
of Dublin. This freedom in the early design process resulted in a presentation layer
divided into two distinct user interfaces, a stand-alone GUI application (Map Viewer)
and a web service (STIS Servlet). The Map Viewer application was developed in
response to the requirement to have a tool available during the implementation phase
which could be used to display nascent STIS system outputs. This tool developed into
the Map Viewer application, and was designed to have more functionality than the
more limited web-based user interface. This STIS servlet web interface was designed
as a proof-of-concept example of how a web-service which could use the STIS
routing functionality.
With this in mind, the STIS servlet design goals were to allow users to remotely
access the STIS journey planning service from a web-browser, connect to the STIS
system over HTTP, and display the resulting route graphically within the web-
browser. As a proof of concept web-service, the STIS Servlet was not intended to
offer the same level of routing functionality, as other existing web-services, e.g.
Google Maps.
The web-service was designed to offer users the choice of inputting a number of
relevant journey parameters, such as the journey start/destination, waypoints along the
38
route, as well as a preferred means of travel. These initial inputs were intended to be
first refined, and a choice of options presented back to the user. Once the final journey
options were selected the servlet was expected to display the journey response both
graphically and textually in the user’s web-browser.
As a later addition during the design process, the STIS Server was also re-modelled to
also provide an application-level communications end-point, facilitating HTTP
communication between remote applications an the STIS service layer.
In contrast to the STIS servlet, the Map Viewer application was designed primarily as
a development tool, to assist in the testing and verification of the STIS journey
planner. This application was expanded during the design process, eventually
becoming a stand-alone journey-planning application in its own right. The Map
Viewer, as the name suggests, was planned to display the various spatial elements,
such as junctions, Bus-stops and Luas-stops, overlaid on a street-map of Dublin. This
composite map could be browsed by the user, and a journey request could be
constructed, refined, and eventually displayed in the application.
3.3.3 Communications Layer
In order to provide a viable, timely service to requesting applications in the
Presentation Layer, a communications layer was vital to convey requests for spatial
information from the user to the STIS service layer, and reply with appropriate data
back to the requesting user/application. A number of classes were developed to cope
with the communications requirements placed on the system, such as the user-facing
STIS Client and the server-side STIS Servlet and STIS Socket Client.
The role of the STIS Client was to provide applications in the presentation layer a
simple means of sending data to the STIS Server, retrieving responses and passing
this information back to the requesting application in an agreed form. The STIS Client
responsibilities included setting up a HTTP connection to the STIS Servlet, formatting
application requests into XML, sending the requests over the HTTP link, parsing the
XML responses, and passing the parsed information back to the application. The STIS
Client could be thought of as a remote “stub” of the STIS Servlet class, in that it

39
removes the complexity of communication from the application/presentation layer,
supporting data is formatted correctly both in sending it to the service layer, and
changing its format, where appropriate on return.
The STIS Servlet class provided the HTTP communication endpoint on the server
side. This class, which used the standard javax.servlet API’s, was chiefly concerned
with HTTP communications on the client-side, and TCP/IP socket communications
on the server-side. The STIS Servlet was designed as a web-front end, bridging the
different communications modes between client and server.
The STIS Socket Client provided the socket communications functionality to the
STIS servlet, in a similar form to the STIS Client class. The role of the STIS Socket
Client was to open a socket connection between the servlet and the STIS Server. Data
was then read from the HTTP request, and sent over the socket connection to the STIS
Server. Unlike the STIS Client, the STIS Socket Client would not be required to
perform any parsing or re-formatting actions on the data, since the body of the HTTP
request was already an XML string. This XML could be sent directly to the STIS
Server without modification. Likewise any responses send over the socket channel
from the STIS server would also be encoded as XML strings, and could be directly
fed back to the STIS Client over the HTTP connection.
3.3.3.1 HTTP Communications
The initial design called for a communications interface, preferably using a well-
established communications mechanism, capable of efficient operation and low-
latency. A decision was made early in the project to provide all remote
communications to and from the STIS server front end using HTTP where possible,
with a TCP socket for the server back end communication. This choice was due
mostly to the widespread support of HTTP, low overhead, and the existing integration
of HTTP within Java web technologies, especially the association between HTTP
request and Java Servlet technology. It was hoped this design could be leveraged to
allow both local and remote users to access the STIS system, as they would access a
typical web-service. When a HTTP request reached the STIS Servlet, it was planned
that the request data should be extracted, and a new servlet instance and socket

40
spawned to deal with the request. Socket communication was designed in the system
architecture, since it would allow an efficient means of communicating internally with
the STIS Server, and for retrieving the data from the underlying spatial database.
The HTTP communication link exists between the STIS Client and the STIS Servlet
and was designed to use header information in HTTP POST requests to indicate the
type of service request being made. Three types of service request were initially
designed,
- A client data-request, where an application would request specific information,
e.g. coordinates for a particular junction or junctions.
- A client data refinement request, allowing an application to get a list of
options for a specific input, e.g. listing all the junctions in a particular area, or
all the spatial elements with a given name.
- A journey route request, which would signal to the STIS server that a route
must be calculated from the route request information provided, and a route
response returned.
HTTP POST messages were chosen as they are not as restrictive (and are slightly
more secure) than HTTP GET. HTTP GET requests were used only to indicate a web-
based request, and responded with a fixed HTML response, to be displayed in the
requesting user’s web-browser. HTTP POST requests were only used with application
requests, or in transmitting HTML form information back to the STIS Server.
3.3.3.2 Socket Communications
While chain of communication was defined at an early stage as being HTTP between
the client and the servlet, TCP/IP (Java) Socket communications were preferred
between the servlet and STIS server. There were several factors leading in to this
design choice,

41
1. Memory was limited, and any system required to handle several concurrent
users must either reduce the memory taken up by each thread, or have all
threads access a single shared data source.
2. It was envisaged that the STIS system would be deployed on a server in the
same local domain as the web-server, but not necessarily on the web-server
itself. Therefore some communication was likely required between web-server
and STIS-server.
3. Sockets were well-supported in Java, and work reasonably well within a single
TCP/IP domain, but tend to suffer with firewall and port issues in intra-
domain communication.
This separation of communication mechanisms facilitates a distribution of the STIS
system between a dedicated journey planning and routing server, a web-server
responsible for HTTP communication with the outside world, and various
applications residing remotely, making requests over the HTTP connection to the
STIS web-server front end.
3.3.4 STIS Server and Service Layer
The service layer is a grouping of classes whose function is to service the user request,
and respond with appropriate data, in an expected format. Additional responsibilities
of the service layer include retrieving data from the spatial database, formatting and
caching this data, and facilitating data to be sent to the routing planning class to
calculate journey routes.
There are a number of main classes which compose the service layer, chief amongst
these the STIS Server, which accepts incoming requests (sockets) from the STIS
Servlet, and spawns a dedicated thread (STIS Server Thread) to work on the request,
and develop an appropriate response. Since it is not known when the next socket
request may be made, the STIS Server is put in a permanent loop, waiting for all
incoming connections, instantiating new STIS Server Threads when needed.

42
Early project designs did not originally provide a caching functionality, however it
was decided to implement a cache which could hold all the relevant spatial data from
the Spatial Database, alleviating any load on the database, and improving lookup
speeds. This caching functionality was added to the Geographic Information System
(GIS) class, which was initially concerned with only providing geographic lookup
functionality, e.g. finding the coordinates of a junction with a give junction ID. The
caching of the data required a number of method calls to get and set the data, as well
as functionality to retrieve data from the database, and refresh the cache when needed.
The GIS class was selected as the obvious place to situate the cache, since it
communicated directly with the spatial database, and already contained functions
capable of operating on the spatial data. There are a number of possible caching
policies, but it was decided that for simplicity, the GIS should cache all relevant data
at run-time, and only refresh the cache on a specific command from the STIS Server.
This design choice was made, since the database uses a set of primary keys to index
each row in the database tables. Should a row be added to the database without
updating the primary keys in the cache, and cache lookups would return inconsistent
data.
This pre-emptive caching reduces the complexity of the system somewhat, and
provides the requesting user with a level of assurance about the quality of the data
provided from the cache.
The GIS class was designed to communicate with the underlying Spatial Database
using the Spatial API. The Spatial API is a Java API developed in 2005 by Thomas
Thermin during an internship in the Distributed Systems Group in Trinity College
Dublin [17]. This API provides a number of methods for selecting information from
the iTransIT spatial database, and is specifically designed to use a spatial context in
this selection. For example, a spatial area, or geometry, can be defined, and any
entries in the database with spatial coordinates within this geometry are returned (see
section 3.3.6).
The final, and most important element within the STIS Service Layer, is the STIS
Routing Engine, which is used to calculate journey plans and routes, according to the

43
parameters set by the user. The STIS Routing Engine was designed not hold any
routing data itself, such as routing tables, but calculate all journey plans dynamically
at run time. The STIS Routing Engine must traverse a route through the Dublin road,
Luas and bus networks, and provide a response back to the user in an acceptable
format. Each transportation method has its own peculiar routing problems and issues,
so initially is was planned to develop a separate routing engine for each transport type,
however this idea was dropped later on in the design process. The routing engine in
essence, polls the GIS cache for spatial data relating to the particular transport
network, and decides on a route which would best match the journey requested by the
user.
3.3.5 STIS Client Interface
The client interface is responsible for establishing connections to incoming client
requests and sending responses back to the client in a commonly understood format.
Since the STIS system is an “on-request” system, it does not spontaneously establish
connections to applications and clients, but instead listens for incoming requests,
responding to the request over the same communications channel. In this respect the
STIS system resembled a web-server responding to requests from users.
It was decided in the early design stage to implement some type of XML interface
between the STIS system and the requesting user. This was an early requirement, as
the initial project scope did not include any display elements or presentation layer.
Due to technical problems in a related project, the proposed XML interface was
deemed insufficient, and the client interface was extended to add application data
requests and responses. These application requests were included to allow the design
of applications in the presentation-layer which did not have to generate XML route
requests to display spatial data.
The STIS XML user interface is used to summarise route requests made by the user,
and encapsulate the request information in a well recognised format for later retrieval
by the routing engine. The resulting journey plane, or route response, is also encoded
using XML so the user’s presentation layer may get back the information by parsing
the XML file.

44
An XML interface was chosen for a number of reasons including its usefulness as a
means of data encapsulation, its broad acceptance generally and the fact that client
applications can extract only the information they need, allowing a level of device
independence. Against this XML can sometimes prove to be too verbose, that is, too
much room is taken up with formatting that could more easily be used for useful data.
Sending large amounts of XML-encoded data to a mobile device with limited
processing resources and memory could lead to the device being, for practical
purposes, rendered useless.
3.3.5.1 Route Request XML
Two XML schemas were designed for this project, one to describe journey routes, and
the second the route response. Since both the presentation layer and the STIS system
would have to agree on the data, a number of terms were specified to help define
routes, and spatial information. The “start” point was defined as the user-specified
point of origin for the journey, and the “destination” point was the user-specified end-
point for the journey. The waypoints are intermediate journey goals, which must be
visited on the journey, between the start and the destination, in a pre-determined order.
The Route Request XML basically describes the route request, detailing the time
when the request was first made, the preferred travel mode, the start, destination and
various waypoints, which combine to describe the request.
<?xml version="1.0"?>
<RouteRequest>
<details>
<date>Mon Jun 16 11:00:00 BST 2006</date>
<requestType>1004</requestType>
<travel-mode>cycling</travel-mode>
</details>
<start>
<type>Street-Name</type><value>Phibsboro Road</value>
</start>
<destination>
<type>Luas-Stop</type><value>Museum</value>
</destination>
<waypoints>
<waypoint>
<type>Junction-ID</type><value>1295z</value>
</waypoint>
</waypoints>
Figure 18 - Route Request Example XML

45
There are a number of subtle nuances contained in the Route Request XML file,
which are not immediately obvious. Firstly each start, destination and waypoint value
has an associated “type”, which is used to identify elements as being a street-name,
junction-id, bus-stop, OSI coordinate value or Luas-stop. The design allows for the
types to be extended to include elements such as other modes of transport (e.g. DART
stations), area names, or even area geometries. Since there were only three types of
spatial data in the iTransIT database (roads/bus/Luas), there was no opportunity to
include other modes of transportation, but these can be added quite easily to the
system. The only changes required to the system would be to create a new table in the
iTransIT database, and associate that with a given type.
The route request also lists the preferred mode of transport separately from route
waypoints, which allows the freedom to route between any number of points in a
preferred mode. This would allow for example, a user to specify two bus stops as
journey parameters and yet walk between them. An extension of this preferred mode
of travel would be to list the preferred modes of transport in order, routing between
journey waypoints according to the available options. Due to time constraints this was
not implemented but is supported in the design.
The waypoints are listed in order, so that the first waypoint encountered in the Route
Request XML will be the first point visited directly after the starting point. Likewise
the last waypoint listed in the XML file is the last visited point before the destination.
The route traversal, from the starting point to the destination via any number of
waypoints, allows sub-routes to be calculated independently and eventually
concatenated to form the overall journey. It was planned to allow different preferred
transportation modes between specified waypoints, but this flexibility was not
required, instead a single preferred mode of transport was deemed enough to provide
a means of routing according to the user’s wishes.

46
3.3.5.2 Route Response XML
The Route Response XML is the output from the STIS System, and is used to
describe the route elements, and route links individually, which when added together
constitute the journey. A route link was considered to be the link between two
adjacent route elements in the XML.
The main goal of the route response XML file is to list, in order, the link elements
along the journey. To do this the route response contains all the necessary data to
match each link element back to it’s originating entry in the spatial database, as well
as providing the information necessary to re-construct the route on the client side. It
was intended that the route response XML should contain enough data so that the
route could be re-constructed even if the spatial database was not accessible by the
client. To this end, the spatial coordinates of each point along the route would be
<?xml version="1.0"?>
<RouteResponse>
<response>
<date>Mon Jun 16 11:00:00 BST 2006</date>
<latency>10 ms</latency>
</response>
<route>
<details>
<duration>
<total>1 hour, 21 minutes</total>
<mode type="walking">30 minutes</mode>
<mode type="luas">51 minutes</mode>
</duration>
<distance>
<total>700.0m</total>
<mode type="walking">555.0</mode>
<mode type="luas">145.0</mode>
</distance>
</details>
<links>
<linkElement>
<id>874</id>
<name>O'Connell Street</name>
<type>street-name</type>
<geometry>POINT(123456 123456)</geometry>
</linkElement>
<link>
<mode>walking</mode>
<duration>10.0</duration>
<distance>155.0</distance>
</link>
.
.
Figure 19 - Route Response XML example
47
provided, along with the mode of travel, and the pre-calculated link distance and
duration.
A client receiving the route response XML file would be able, to a large extent, to
recreate the route using only the information available in the XML response. No
spatial calculations would be required at the client-side, neither would any summary
calculation of the journey distance or duration be required.
This design decision was made to facilitate the construction of “light-weight” client
applications, which needed to know little or nothing about the underlying routing
functionality or travel modes. The multi-modal aspect of the route response is support
by listing each link according to it’s mode of transport, as well as providing a
synopsis at the beginning of the XML file, describing the total distance, and period of
time taken by each different mode of transport. This approach means that the system
is readily able to adapt to changes, and can add new modes of travel, or spatial objects,
quite easily the route response.
3.3.5.3 Application-Level Requests
In addition to an XML routing interface, there was an emerging requirement during
the design phase, to support an application level request/response interface, which
would query for individual pieces of data rather than whole routes. Again these were
encoded in small XML strings, using <Client-Request> tags, along with type and
value to distinguish the piece of information being sought.

48
3.3.6 Spatial API Interface
All the information required by the STIS system is stored in a database, accessible via
a Spatial API. The Spatial API was developed from work done in the iTransIT project
[20]. This Spatial API, implemented in Java and using various JDBC third party
libraries, was designed to fetch data from the “spatial” database, allowing data
retrieval based solely on user-provided spatial coordinates, or other parameters.
Initially, since the project called for a rapid prototyping approach towards system
design and implementation, it was essential that the travel data sources be accessible
locally, as the development work was principally carried out off-line. The design plan
called for an initial implementation using a locally installed database, connecting to
the remote (live) database server when a sufficient level of functionality was
developed. The early prototypes connected directly to the spatial database using
standard Java Database Connectivity (JDBC) libraries to set up a remote connection,
and execute SQL queries. When the JDBC was established, and the database link
verified, the next stage was to implement the Spatial API in place of the “direct”
JDBC link.
This process of first testing with the “direct” database connection, followed by the
Spatial API connection allowed applications and routing algorithms to be verified, as
well as providing an insight into the strengths and weaknesses of the Spatial API.
The Spatial API implementation provided a number of operations which were used to
insert and update data in the database, as well as retrieving information based on a
user-provided primary key, table name and column name. There was no use, in this
project, for the retrieval of spatial objects based on their location, since the majority of
requests to the API were for either all the elements of a particular type, or a named
(and indexed) element of a particular type. This, coupled with caching the spatial data
within the GIS class, made this feature of the spatial API redundant.
The table and column names in the spatial database are required in order to provide
parameter values to the spatial API methods. The tables used in the spatial database
are outlined in the documentation [17], but in essence there are four main tables,
49
- R_D_Junction table containing all the junction data.
- R_Link table containing all the link information to do with junctions.
- R_LuasStop table giving Luas stop information.
- R_BusStop table giving Bus stop information.
There were also a number of secondary tables used to list the routes between Luas and
Bus stops, but these were used less than the other parameters. The parameters are
entered in the spatial API information retrieval methods. There are a number of
retrieve methods specified by the API, but two in particular proved invaluable to the
STIS system design. The first retrieve method takes in as parameters, the table name,
and parameter name, identifying a particular column in the spatial database, (e.g. the
junctions table “R_D_Junction” and “geometry”). A call to this method would return
the list of all column elements of this parameter type. The second useful retrieve
method used by the STIS system is similar to the bulk retrieve method, except it
allows the row as well as the column to be specified in the database. A retrieve
request made to the “R_D_Junction” table listing the row auto ID (primary key) and
parameter value (column name) would return the contents of a particular “cell” within
a row in the database. The combination of these two retrieve methods formed the
back-bone of the STIS communications layer.
3.3.7 Concurrent User Requirements
There was a requirement from the outset to support an unspecified number of
concurrent users. This required that multiple communications streams must be
supported, in parallel, to the STIS system. In addition, the travel information need to
be distributed to each requesting client, so that journey routes could be calculated.
This proved somewhat of a design headache since Java does not allow references to
data structures to be shared outside a single class, but instead passes a copy of the data
structure, as a complete instance, between classes. Due to the large amounts of data
being cached by the STIS system, duplication of this data (by passing instances of the
cache between classes) would quickly have consumed the all the available memory.

50
Rather than duplicate data for each separate thread, it was intended to use a STIS
server to maintain (and cache) all the spatial data in a single place, allowing
concurrent clients to connect to the shared data in parallel. Socket communication,
specifically server sockets and multi-threading, are well supported in Java, and
allowed an efficient means to take incoming HTTP requests, and spawn a thread and
onward socket dedicated to servicing the request. This socket communication was
supported on the server side by the STIS Socket Client, which would tie together the
STIS Servlet (support the HTTP connections to the clients) with the STIS Server
containing the single instance of the cached spatial data.
A client connection to the STIS Server would initially use a HTTP connection to the
STIS Servlet, and would in turn connect to the STIS Server via TCP/IP sockets. The
data transmitted over both communications protocols would remain the same, i.e.
XML. A HTTP connection was designed to provide a communications front end since
HTTP more easily evades problems associate with socket communications – mostly
because of the way HTTP is accepted over most networks whereas “raw” TCP/IP
packets are rejected.
3.3.8 Design Features added during Implementation Phase
In common with most substantial coding projects, there is a degree of addition to the
design as the implementation phase progresses. This project was no different, and a
number of extra design features were added as a direct result of observations made
during the initial prototype implementation.
Client GIS
(shared data cache)
STISServlet STISServlet
Client
STIS Server STIS Server
Thread
Routing Engine
HTTP
HTTP
Socket Socket STIS Server
Thread
Figure 20 - STIS Communication Structure

51
Since the design and implementation of the GUI interface is the most “ad-hoc” design
process in the project, most of the additional features added during the
implementation phase, were added to the GUI interface.
There were a number of predecessors which provided an example of how mapping
and routing web-applications should be implemented. Foremost amongst these were
the two leading internet map providers, Map24 and GoogleMaps. Features such as
dragging the map, and providing refinement feedback to the user were inspired by
features present in these existing web services.
Unlike both of these web-services, the Map Viewer front-end was designed as a
standalone application, and draws it’s inspiration from high quality open source Java
applications such as SQuirreL[21].
3.4 Designing the Transport Network Model
Finding a route through a city streets requires two essential elements, firstly a model
of the streets themselves, and secondly an algorithm to find an efficient route through
this model.
Each node in the transport network (junction, Bus stop, Luas stop) must be
represented using its geographic position, and unique node identifier. In the case of
road junctions, a naming system existed in the spatial database uniquely describing
each junction with an alpha-numeric code, such as “1255” or “981z”. Luas Stops are
identified by their unique names, taken from the Luas network routes themselves.
Dublin bus stops are more complex, in that many bus routes can use the same bus-
stop, and there can be many bus stops located on a single street. The bus stop
identifiers used are a combination of the street-name of the bus stop and integer, in
order to uniquely each bus stop.
Extra information about each transport network node is also required to model the
network correctly, this begin the list of all links between nodes in the network. In the
case of the road network these links are the streets connecting neighbouring junctions.
Luas and Bus networks, while using some existing road junctions, are conceptually
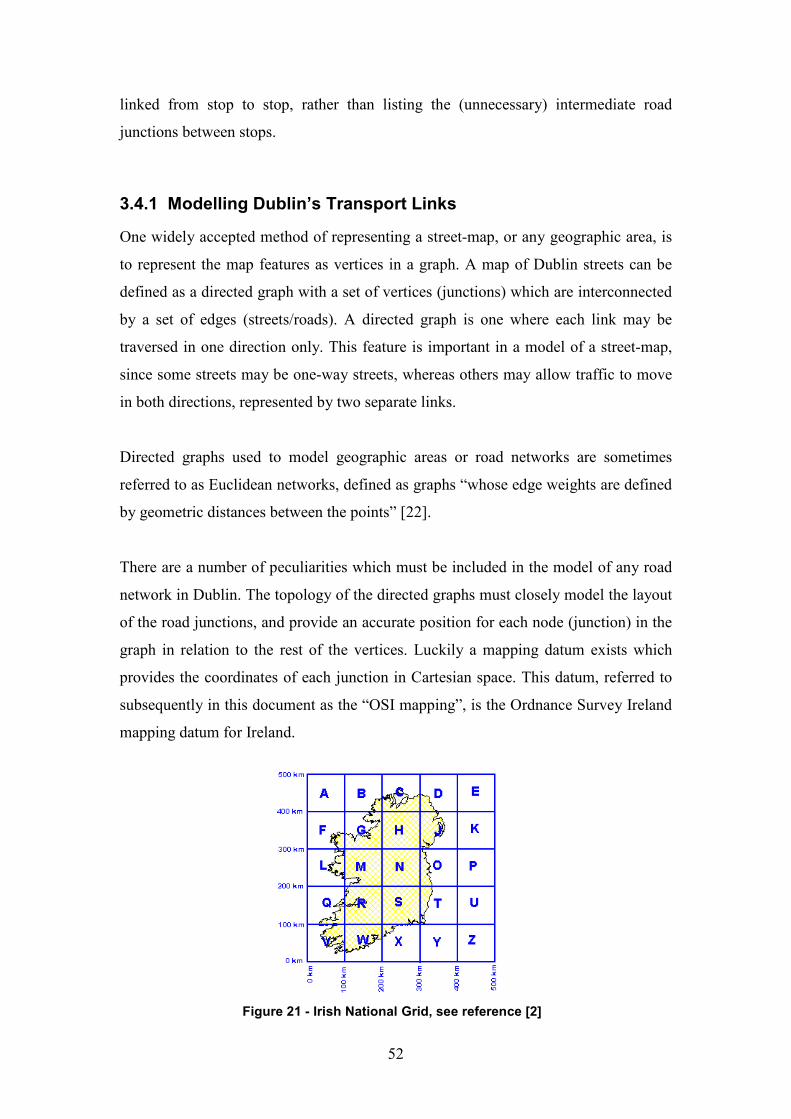
52
linked from stop to stop, rather than listing the (unnecessary) intermediate road
junctions between stops.
3.4.1 Modelling Dublin’s Transport Links
One widely accepted method of representing a street-map, or any geographic area, is
to represent the map features as vertices in a graph. A map of Dublin streets can be
defined as a directed graph with a set of vertices (junctions) which are interconnected
by a set of edges (streets/roads). A directed graph is one where each link may be
traversed in one direction only. This feature is important in a model of a street-map,
since some streets may be one-way streets, whereas others may allow traffic to move
in both directions, represented by two separate links.
Directed graphs used to model geographic areas or road networks are sometimes
referred to as Euclidean networks, defined as graphs “whose edge weights are defined
by geometric distances between the points” [22].
There are a number of peculiarities which must be included in the model of any road
network in Dublin. The topology of the directed graphs must closely model the layout
of the road junctions, and provide an accurate position for each node (junction) in the
graph in relation to the rest of the vertices. Luckily a mapping datum exists which
provides the coordinates of each junction in Cartesian space. This datum, referred to
subsequently in this document as the “OSI mapping”, is the Ordnance Survey Ireland
mapping datum for Ireland.
Figure 21 - Irish National Grid, see reference [2]
53
The OSI mapping datum can be used to specify a coordinate tuple for each node in the
directed graph, using the easting and northing coordinate system. This is essentially
an x-y Cartesian projection, which uses the X and Y coordinates as measured in
meters, with an origin point in the south-west corner of each sub-grid. The x-axis
increments positively from west to east, whereas the y-axis increments (in meters)
going from south to north. It is useful at this time to point out that this mapping datum
is specific to Ireland, and has no direct correlation to the WGS-84 mapping datum
(more usually knows as latitude/longitude).
Coordinates specified using the OSI map projection, are typically of the form
(315000, 235000), the first value described is always the X-coordinate, and the
second the Y-coordinate. The values themselves are meters from the origin point.
3.4.2 Interconnection between Transport Links
In addition to a specific mapping datum for Dublin, there are also separate junctions
assigned for varying types of transport services. This project covers three main
transport services, the road network (walking, cycling, driving etc.), the Dublin bus
network (which sometimes uses special bus lanes), and the Luas tram network, which
runs on special tracks along certain roads, sometimes shared with vehicle traffic.
The design process called for a graph for each transport mode, but obviously walking,
cycling and driving will share the same road network. The Luas tram service uses
separate lanes to the regular road network, however the Dublin Bus network, whilst
utilising the road network, can be described using a reduced directed graphs, since the
direction of travel is pre-ordained for each bus route.
3.4.3 Generating Traffic Congestion Data
The iTransIT database is supplied with congestion data taken from a traffic simulator,
developed as part of a related study within the iTransIT project. This traffic simulator
was used to produce numeric traffic congestion information, matched to a particular
junction. This numeric data was then inserted in the appropriate row in the spatial
database, in the "congestionLevel" column.
54
The congestion levels range from 0 indicating light traffic, to a maximum of 7,
indicating heavy traffic congestion. The simulator itself was very processor intensive,
and did not produce much in the way of congestion information. Ideally, if there was
an interface from the iTransIT spatial database to Dublin Corporation’s traffic
measurement system, the real-time traffic data could have been used for this project.
The design of the system reflected the potential for expanding the spatial database to
include more current congestion data. Since the link between the source of traffic
congestion data is abstracted behind the iTransIT spatial database, and changes to the
system would be at the database layer, and not impinge on the operation of the STIS
system (beyond providing better congestion information).
3.4.4 Changes in Network Topology
The topology of the road network is assumed to be relatively static. Changes to the
road network are typically very slow, and any such changes that do usually occur
(such as changing one-way street directions etc.) can be easily modified in the model
of the road network. The routing functionality was designed to be dynamic (see
section 3.5), so any changes to the network topology which are committed to the
spatial database, will be automatically reflected in the STIS system. This has a great
benefit, in that there is no need to re-compile any routing tables, or make any changes
to the routing algorithm.
Occasionally, certain dynamic topology changes, due to traffic accidents, road
closures, etc. can occur quickly and revert to their “normal” state in a matter of hours
or days. These changes also could be committed to the database, and noted by the
STIS routing functionality.
The bus network is subject to two likely sources of change, the bus company
changing routes, schedules and timetables, and changes forced on various routes due
to road closures, and other traffic measures. Again, the design of the system can
accommodate changes, once the changes are made to the database.

55
The two Luas routes are not interconnected, and any route or timetable changes are
most often localised on only one Luas route. Sometimes, the Luas routes are subjected
to delays at tram/road intersections, and very rarely due to traffic accidents at or near
intersections. It is likely that the Luas Green line will be expanded in the short term
by adding extra stops, again similarly to the Bus routes this change can be easily
accommodated by the system.
3.5 Routing Algorithms
The type of route finding problem outlined by the STIS project requirements, is a
classic problem in the area of computer science and graph theory. Finding the most
efficient path between two connected nodes in a network has been well studied, and
much material existed in the area which was incorporated into the routing algorithm
design. These types of routing problem included such diverse areas as the
mathematician Euler’s travels across the bridges of Königsberg, the well-known
travelling salesman problem, and the design of microchips and PCB’s, all of which
require the optimal route to be found. This optimal route is typically the route which
minimises the associated cost of travelling between the two nodes, often expressed as
a function of shortest distance covered, or fastest time.
A shortest path routing algorithm would use various inputs to select the optimal route,
for example by evaluating a number of factors such as:-
• The overall distance covered by the route.
• The modes of travel to be used.
• The overall route duration.
• The number of intervening waypoints.
• The general direction of travel.
• The size of the roads.
• The direction of the roads (i.e. one-way traffic systems).
• The local traffic congestion.
• The public transport times/schedule.
56
A weighting associated with a path through the network can be found using a function
of one or more of these metrics. The shortest path through the network would be the
one which minimises this combined weighting.
When researching the way similar traffic routing functions were implemented [23], it
was found that user’s typically were assumed to select the route taking the least time,
rather than the route with the shortest distance travelled. This core assumption formed
the basis for the implementation of the routing algorithm.
3.5.1 Dynamic Route Calculation
In a closed network, such as the Dublin road network as contained in the spatial
database, it is possible to pre-calculated route information, by compiling tables giving
the shortest paths between all neighbouring nodes in the network. This pre-processing,
whilst providing a degree of efficiency at runtime, has drawbacks, primarily the static
nature of the information once calculated.
A design decision was taken therefore to consider only dynamic routing calculation,
rather than pre-processed, or table-driven, routing algorithms. This was due to the fact
that the system was planned to reflect rapidly changing conditions (such as traffic
congestion) as inputs into the routing algorithm. Additionally, it was expected that
any routing algorithm developed for the STIS server should be capable of deal with an
expansion of the road networks without having to be re-written.
Dynamic route calculation has an extra cost associated with the performance of the
algorithm. While this means a dynamic routing algorithm proves less efficient overall,
it does provides a freedom and an extensibility necessary for this project. The STIS
system is a middleware platform, designed for use with legacy travel data sources,
and as such must accommodate change within its design, and allow the for the
addition of information to the database without adverse effects to the STIS system as
a whole.

57
3.5.2 Exhaustive Shortest Path Algorithms
There are a large number of exhaustive shortest path algorithms, which all share a
number of common features. The basic operating principal of each of these algorithms
is to traverse the graph a link at a time, spiralling out from the starting point, until
either the destination point is reached, or the entire graph is traversed. The partial
paths built up from the graph traversal are used to construct the shortest path. These
algorithms are exhaustive, in that all links are traversed in until the destination vertex
is arrived at.
An exhaustive search algorithm is guaranteed to produce the most efficient path, i.e.
that which is guaranteed to be the shortest path. This guarantee comes at a significant
cost, chiefly their extensive time-consuming traversal of the graph, as well as
consuming large amounts of memory and processing resources during the search.
Except in very small graphs, or where the finding the absolute shortest path is critical,
the drawbacks of exhaustive search algorithms all but preclude their usage in large
directed graph structures.
Exhaustive shortest path algorithms include breadth-first and depth-first search, as
well as more complex algorithms such as Dijkstra’s algorithm[24], Lee’s Algorithm
[25] and the Bellman-Ford routing algorithm [26]. The most well known of these,
Dijkstra’s algorithm, has computational costs equivalent to the square of the number
of vertices (i.e. (Vertices)2 ) to be searched. Other algorithms, such as the Bellman-
Ford routing algorithm, have similar costs, on the order of Vertices x Edges, where the
edges are the links between vertices in the graph [22].
For large graphs, such as the model of Dublin streets, there are approximately 1300
vertices and 2800 edges. It is not too surprising therefore to conclude that exhaustive
search algorithms do not provide a shortest-path route in an efficient manner through
such a large graph structure.

58
Figure 22 - Exhaustive Search Space, and Bounded Search Area
There are means to reduce the computation costs, such as by selecting a subset of the
vertices deemed relevant to a given search. This directive can be used to restrict the
search space, creating a sub-set of all the vertices in a bounded area between the start
and end points, thereby limiting the shortest path search to this area. Again, this pre-
selection, while reducing the time spend traversing the graph nodes, still contains an
inherent inefficiency since a certain number of the nodes traversed in the bounded
area will not prove useful.
3.5.3 Table-based Routing Algorithms
There are many internet routing algorithms, but a popular early routing algorithm
involved regularly calculating the cost of traversing the links to all its neighbours, and
saving this data in a table which could be then used to quickly route data packets to
their destination. This table-based, or table-driven routing method has the advantages
of being very efficient when setup correctly, with the main disadvantage of poor
performance where the topology of the network changes or the cost of taking a
particular route alters.
A table-based routing algorithm for traffic routing would implement a similar scheme,
pre-computing the likely cost of each link in the graph, then using this pre-compiled
information to select links for a route. A draw-back of this calculation is that it would
be required every time a change was detected in the network. For this reason
principally, the use of table-driven routing algorithms was ruled out for the STIS
routing algorithm, due to the dynamic content in the database (e.g. traffic congestion
information), and the expected frequent updates to the data.
End point
Start point
Shortest Path
Bounded Search Area
Unbounded
Search Area

59
3.5.4 Heuristic Driven Shortest Path Algorithms
A heuristic driven shortest path algorithm is one which does not exhaustively trawl
the entire search space, but instead selects vertices along the route based on some rule,
building up a shortest path a node at a time. The rule used to select the next vertex
along the route is, in effect, a sorting of the candidate nodes according to a given
fitness criteria.
This type of algorithm is sometimes referred to as a priority-first search, since at each
step the various routing options are prioritised, and the “best” candidate selected.
For the STIS routing algorithm, it was decided that the best strategy would be to
implement a simplistic priority first search, which sorts the candidate links based on
the sum of the link distance, and remaining distance to the final journey destination.
This type of heuristic ensures that vertices are only visited once along the route,
reducing the amount of time spent finding the route. What the heuristic does not do is
ensure the route selected is the shortest path between the two points, however due to
the high node density of the graph representing Dublin streets, the margin between the
shortest part and the route produced by this algorithm is very small.
This approach was selected as the routing algorithm, as it will find a route through a
graph in a time which is proportional to the number of links along the route, rather
than the size of the overall graph. For a graph representing the Dublin road network
this is a paramount consideration, as it allows road to be added without affecting the
performance of the algorithm. The graphs representing the bus and Luas networks
were much more sparsely populated, and a slightly different approach was required,
which added a number of extra checks to ensure the routing considered lines/bus
routes as well as overall direction of travel.
Line Distance1
Line Distance2
Link
Distance1
Link
Distance2 Start
Destination
Figure 23 - Distance-based search heuristic

60
Originally it was intended to implement a look-ahead feature within the routing
algorithm which would advance a route calculation to ensure that the overall direction
of travel was towards the destination. However due to time pressures caused by the
development of the presentation layer, there was insufficient time to test and deploy
this functionality.
3.5.5 Finding Multi-modal Routes
Multi-modal routes were defined as those which utilised at least two different modes
of travel during a single journey. This requirement increased the complexity of the
routing problem, since the various transport modes where described using separate
directed graphs representing the travel links, with the only “key” tying each graph
together being the spatial coordinates of the links within each graph/travel mode. For
example, the bus and Luas routes could be associated with junctions using their
spatial coordinates.
To further complicate matters, some networks, such as the Luas and Bus networks
were disjoint, with various separate links forming completely separate sub-graphs.
The spatial coordinates were designed to “stitch together” the various routes and
combine to form a multi-modal route. For example, in a disjoint network, such as the
bus network, any unconnected vertices in the graph (bus-stops) would be linked by
finding the nearest road junction to the spatial coordinates of each vertex, next
calculating the road route between the two junctions. A notional connection would be
Figure 24 - Fully connected graph (left) and a disjointed graph (right)

61
added then between the bus-stop and the nearest junction. The typical distance from a
bus stop to a nearby junction would be typically on the order of several meters.
The road network was a fully connected graph, where each vertex (junction) in the
graph could be reached from any other. The Luas and Bus networks were disjoint
graphs, with “gaps” between some vertices. To further complicate matters, the links
between vertices in all graphs were often “one-way” links, which would impact upon
the allowed direction of travel between different vertices.
The design of the routing algorithm needed to ensure that a link between two separate
points be traversed using one or a number of modes of travel. A design decision was
taken early in the project to allow the user to select a preferred mode of travel, and
calculate a route using this mode as must as possible. Where an entire route between
two points couldn’t be achieved using the preferred mode of travel, the remaining
sub-routes were added using a default pedestrian mode. This meant that any Luas or
Bus route between two specified points would either be on bus or tram, defaulting to a
walking route where needed. This choice simply reflected the modes of travel which
were specified by the project proposal, as well as the simple fact that cyclists and
vehicle users are more likely to complete their route using their respective means of
travel.
While the STIS system was designed with only one preferred mode of travel to be
specified (defaulting to walking when required), the core functionality is easily
adaptable to allow users to list different preferred modes between different waypoints
along the same route, or even providing a number of preferred modes of travel listed
in order of preference.
62
4 Architecture Implementation
“I don’t wanna live in a city where the only cultural advantage is that you can make a
right turn on a red light” – Woody Allen
The software for this project was planned, from the beginning, to be executed in a
Java (J2SE) environment. This implementation decision was taken due to the
popularity of the Java, its platform independence, and its straight-forward integration
with existing web and database technologies.
Related technologies, such as Java Servlets, and Java Database Connectivity (JDBC)
libraries allowed a smooth implementation process, reducing any inter-working
problems between components in the design. The implementation process itself, was a
rapid prototyping model, whereby software was created, tested, and any lessons
learned were fed back into the next design cycle. In total twelve such design-
implement-refactor cycles were completed for the project, producing in the end over
10,000 lines of code.
In parallel with the rapid prototyping model, a number of automated test-cases were
constructed to ensure the software produced was (reasonably) reliable, and performed
as expected. JUnit test cases were produced, and used extensively to verify the
operation of various classes implemented for the STIS project [27]. JUnit was
especially adept at verifying the operation of data retrieval and spatial calculation
functionality such as was present in the GIS class, and STIS routing engine. JUnit did
not provide any benefit when it came to the testing system’s graphical components,
and many hours were spent manually testing various GUI interfaces, image generation
functionality and graphic layouts.
There was no early design road-map or work-plan, however the overall intention was
to create an early stable prototype(s), moving on then to the final software
implementation for mid to late August 2006.
There were three essential elements to the architecture implementation,

63
1. A means of accessing the spatial data held in a database, and translating
this data into a useable form.
2. Develop a multi-modal routing engine, which would evaluate a route
based on a number of user-input parameters.
3. Create a means of visualising the routes returned from the routing engine.
There were a number of early (rapid) prototypes developed as proof of concept and as
a means of refining the design for the final software implementation. The tool used to
test the output from the STIS system, the Map Viewer application, was eventually
included in the overall project output.
4.1 Software Implementation History
The software implemented as part of the STIS project was based on work done earlier
[17]. As part of this earlier implementation, a number of XML files were used to
describe the junctions in the road network, as well as data listing Dublin bus stops.
These XML files were used in the early stages of this project to provide some
workable static data for initial early prototype implementations. When the
implementation developed, the static data read from the XML files was replaced by
the Spatial API connecting directly to the database.
The software implementation can be divided into roughly three phases, or iterations.
The first stage, known as the Alpha prototype, was used as a test-bed for some of the
GUI elements of the design, and as a means of providing workable data for the later
prototypes. The first prototype was a relatively simple map frame GUI which
displayed the location of the junction data on the screen, overlaid on a static graphical
map. It was found that the road junctions, when drawn on the map, were offset
(skewed) by a variable distance from their correct position on the map. To correct this
disparity, a fixed skew or rotational value was applied to each junction OSI co-
ordinate to place it correctly on the map. This OSI to X, Y coordinate conversion was
done visually, using a bespoke mapping tool to scale, skew and translate the
coordinates until a correct “fit” was achieved. The OSI coordinates themselves were
64
not altered in any way, and the coordinate conversion operations were contained in a
method in the GUI class.
The principal implementation phase added to the work done on the Alpha prototype,
introducing a number of new features such as JDBC connections, Spatial API (S-API)
requests, and improved user features. This Beta prototype re-factored the previous
Java code to improve the overall performance, and add new functionality. Typically a
new release of the software was made once a week, or whenever a sufficient amount
of new functionality had been added and tested. Initially the spatial information, such
as the junction coordinates, the link information, and the data on Luas and Bus stops,
were taken (parsed) from the Paramics XML files. However a JDBC connection was
integrated allowing a direct retrieval of the data from the spatial database, followed by
the integration of the spatial API’s to perform the same type of function. After
evaluating both methods, it was decided to keep both the JDBC and S-API
functionality for evaluation purposes, and implementation efficiencies. The time taken
for the JDBC “direct” connection to retrieval all the required spatial data from the
database was on the order of 2-3 seconds, however the performance of the S-API was
much slower, and prone to exceptions, so the JDBC connection was largely used
during implementation. The Beta Prototype added a web front-end to the existing map
frame GUI, as a means of allowing remote users to access the system. In addition
various releases included new features such as street-name lookups, journey
waypoints, and route distance/time estimates.
The final phase of implementation was a complete re-factoring of the Beta prototype
code, and introduced some important design features such as complementary
JDBC/S-API requests, a standalone STIS Server, and the caching of spatial data in
memory for efficient retrieval later.
4.2 Software Releases
22nd May 2006, Alpha prototype test, which displayed the junction and link
information overlaid on a zoom-able map of Dublin. This prototype also served as a
tool to re-align the coordinate system to correctly match the road layout.

65
3rd June 2006, Alpha prototype completed and released. A number of new
improvements to the GUI added, however all junction, bus and Luas data was still
retrieved from the Paramics XML files
6th June 2006, Beta prototype version 1.0 released. This added GUI improvements,
and displayed correctly the location of junctions, as well as Luas and bus stops. There
was no routing functionality as yet, and the Paramics XML data still provided all the
spatial information.
23rd June 2006, Beta prototype version 1.3 released, adding Servlet front end to the
system. Versions 1.1 and 1.2 were terminated early, and work continued with 1.3. An
early routing system was added allowing a route to be calculated between two named
junction ID’s. No multi-modal routes were supported, and a number of data
encapsulation classes were added, the Route Request and Route Response classes, to
describe information useful to the STIS system.
25th June 2006, version 1.4 improves the routing functionality, differentiating between
journeys compelled to use the one-way street-system (vehicles and cyclists), and
journeys which can go against the one-way street-system (pedestrians). In addition
methods were added to the Route Request/Response classes to generate an XML
string representing data in the object, as well as constructors to re-initialise the object
from the XML.
30th June 2006, version 1.5 all the spatial data request functionality was moved to a
new GIS (Geographic Information System) class. This class was to provide
convenient wrapper methods for requests to the spatial data.
12th July 2006, version 1.6, street-name validation methods added to allow a user to
initiate a route request by providing a street name as a string. This version required
creating a mapping file between street-names and junction ID’s, and a script to update
the spatial database with this extra information.

66
25th July 2006, Final Prototype version 1.8, addition of the Spatial API and extensive
code re-factoring. Version 1.7 was a non-working version, which was abandoned
earlier, allowing development work to be concentrated on finishing version 1.8.
5th August 2006, Final Prototype version 1.10, integrated a stand-alone STIS server
class, which would provide a cache for the spatial data after requesting the
information from the spatial database. Development work on version 1.9 was
abandoned in late July 2006, due to socket communication bugs.
10th August 2006, Final Prototype version 1.11. The communication between the
client application and the STIS server was changed from socket communications to
HTTP to allow remote testing of the application.
25th August 2006, Final (Demo) Prototype version 1.12. The software was re-factored,
and some bugs removed from the routing functionality. The servlet front-end scales
the graphics returned from the map generator, and the socket client was altered to be
more resilient in the event of failures.
4.3 Implementation Issues
A number of fundamental issues relating to routing and journey calculation were
exposed during the implementation process. Since the design and implementation
process used during the project was iterative, any findings were fed into subsequent
versions of the software. The following sections describe the main obstacles faced
during the implementation of the system.
4.3.1 Coordinate Transformation
The OSI coordinates, as provided by the database (and iTransIT Paramics data [20])
were found to be offset and skewed, when overlaid on a street-map of Dublin. Much
work was required to scale, translate and rotate the coordinate plane the road links as
described by the system corresponded to an accurate street map of Dublin.
A mapping tool was developed which assisted in calculating the offset and skew value
associated with coordinates retrieved from the database. It was found that a fixed
67
offset and skew value would correctly map the OSI coordinates to their apparent
correct position on the map of Dublin.
4.3.2 Associating street-names with junctions/links
The data provided as part of the original work did not associate any street-names with
the existing numeric junction identifiers. There were approximately 2800 streets
(links) available, of which only 470 were classified according to their street-name for
this project.
This mapping between junction identifiers and street-names required that each street-
name be matched to one or more appropriate rows in the "R_Link" table of the spatial
database. Finding this matching was accomplished using the Map Viewer tool,
manually recording the database junction id values for each street, and then entering
this data into the database. This tedious process required many hours of careful work,
so only a limited number of roads were input, mainly for demonstration purposes.
4.3.3 Route Validation
The route selected from a given set of user inputs is returned to the requesting user as
an XML string. This text output on its own cannot be readily validated, except for
comparing the start and destination points, and the overall mode of transport.
During the implementation part of the project, the validation of the overall correctness
of the route itself was performed by producing a route map from the XML data, and
visually inspecting this map. The Map Viewer application was capable of displaying
the routes, coloured coded according to the mode of transport.
There is a basic inbuilt routing check performed by the STIS routing engine class,
where a multi-modal route is compared to the road distance between the start and
destination points. If the multi-modal route distance is a much greater distance (at
least double) the road distance, the road distance is selected. There was not enough
time at the end of the project to implement an in-built route validation mechanism, but
given more time a number of route alternatives could be calculated in parallel, and the
“best” one returned.

68
4.3.4 Map Visualisation
For the purposes of this project, two large scale graphic maps of Dublin were
compiled from a well-known online map provider. These maps were used as the
underlying street-map of Dublin over which were overlaid the various junctions, bus
stops and journey routes.
The implementation of both the Map Viewer application and the STIS routing engine
use Java Graphics2D functionality to draw the overlay graphics on top of the
underlying static maps. This composite image is presented directly to the user in the
Map Application, but saved as a JPEG image in the case of the STIS Servlet.
The STIS Servlet uses an in-memory canvas on which to draw the composite image to
be saved to disc. This extra operation is required as there is no facility to directly
display the canvas in the frame of a web-browser.
4.4 Security Considerations
For the purposes of this project, the system not be “live” in the sense of a traditional
web-service, however it will be at a level sufficient for live operation. The following
sections will therefore assume the worst case scenario – i.e. the system is a publicly
assessable live web-service.
There are a number of security considerations which impact on the system, either
directly or indirectly. The operation of the Smart Traveller Information System is
somewhat analogous to a web-server connected to a back-office information system.
4.4.1 Dependencies on Third-Party Software
The STIS system makes use of a relational database to store information relating to
the travel information. The database chosen for the project was the open-source
MySQL server version 5.0.1. The benefit of using MySQL over a proprietary
database is in the fact that the open source nature of this popular software lead to any
bugs being readily exposed and corrected, limiting the number of potential flaws
which could be exploited by any malicious users.

69
The STIS server utilises the TomCat 5.5 web-server to facilitate communication with
both the clients in the presentation layer. Equally as with the database implementation,
being open source the web-server software can expect close scrutiny for security
vulnerabilities, and, it is hoped, timely interventions once security flaws are exposed.
4.4.2 Insecure Default Configurations
For ease of implementation the STIS system was designed to be deployed on a
Windows XP environment, accessing information from the remote SQL database,
using the TomCat web server to provide a web-based front end.
The TomCat web-server, is typically installed without security options enabled, and
comes initially installed with a well-known initial admin username and password
(root/root). This well-known initial login is also an issue with many database
installations. The obvious solution to this vulnerability is to deploy the system on the
network only when the root username and passwords have been changed to a secure
(non-guessable) text string, and this entrusted only to the system administrators.
4.4.3 Server Hardening
Typically, if a mission critical system is to be deployed, or made publicly available,
the server goes through a process known as hardening. This process does not usually
involve much in the way of changes to the system hardware, but usually requires
patching the operating system and system software components, as well as closing
communications mechanisms and ports which are surplus to requirements.
Unfortunately, the server used for the STIS system is a laptop in everyday use it is
more vulnerable to industry level servers. There area however benefits, mainly by the
fact the STIS server is protected primarily by the Trinity College firewall from
external users. Hardening the STIS service is not a strict requirement, and was largely
unnecessary for this project. However the system is slightly vulnerable to malicious
users inside the TCD firewall, or malicious users targeting the TCD domain as a
whole. A simple denial of service bug could be easily accomplished by sending
oversized XML requests to the system, which would slow the STIS system to a
standstill.

70
4.4.4 STIS Software Security
The code developed for the project could itself be the source of security loopholes.
There was extensive used of XML in this project, and some XML parser
implementations can cause errors and crashes when submitted with malformed XML
information. This vulnerability was described in a recent dissertation paper from
Trinity College Dublin [28]. Vulnerabilities caused by the XML parser are a product
of bad software within the parsers themselves, and can only be overcome by using
well tested parsers with known failure semantics.
This vulnerability was side-stepped by the STIS system, since all XML parsing is
performed using bespoke functionality in the software, rather than a well known third
party product.
4.4.5 STIS Failure semantics
The design of the system was intended to minimise the effects of a client failure on
the server side. Since a client connects via a HTTP interface to the STIS Servlet (and
on to the STIS Server), any client failures should result in no further HTTP requests
being received on the server side.
The STIS Servlet acts as a front end to the server side, and passes on HTTP requests
over a socket interface to the STIS Server. This socket interface is opened and closed
on the reception of messages from the Map Viewer client, and automatically in the
case of the web-browsers connecting to the STIS Servlet.
The failure of any socket connection results in the STIS Servlet attempting to re-
connect the socket connection on the next message received from the client. There is
no provision in the STIS system provided for socket timeouts given that there could
be large periods of time between a single client making consecutive requests.
There exists the potential for malicious applications to cause problems for the STIS
server by sending large number of requests, or by sending oversized requests in XML
format.

71
Since some user-layer applications will communicate over wireless links with the
STIS server there is a danger the travel information could be “snooped”, and
messages impersonated. This security, although largely the responsibility of the user-
layer application, could be prevented by implementing some content hash checking,
random challenges of the end-user, or using the WPA security protocol for the
wireless link. The HTTP connection between the client and server (STIS servlet)
could be upgraded easily to use HTTP/S further improving the security of the system
as a whole.
4.4.6 Insecure Properties Files
A major vulnerability of the system lies with the fact that the Spatial API requires
access to a number of plain text properties files to initialise the connection to the
spatial database. The JDBC drive, URL address of the database, and the
username/password are all stored in plain view on the STIS server, and could reveal
the database connection details to malicious users, or indicate JDBC drivers with
known security problems. These properties files would only become apparent if a
malicious user had access to the STIS server, and this scenario is not thought likely in
a well protected system.
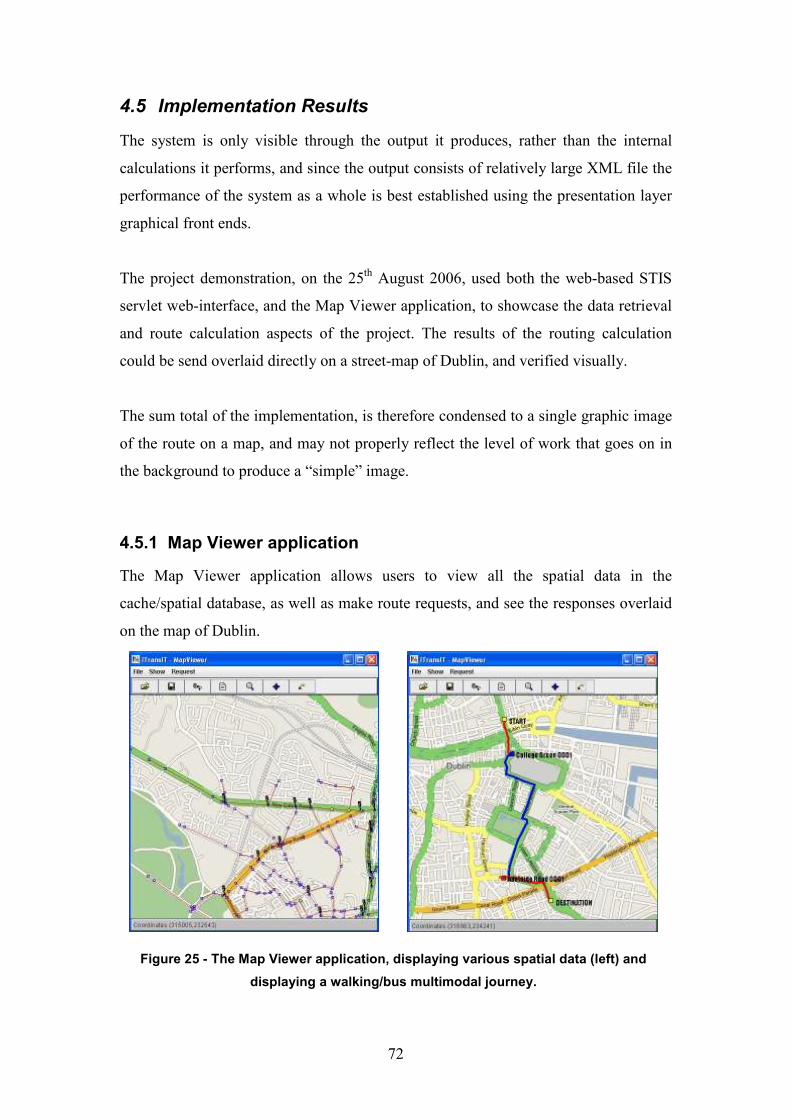
72
4.5 Implementation Results
The system is only visible through the output it produces, rather than the internal
calculations it performs, and since the output consists of relatively large XML file the
performance of the system as a whole is best established using the presentation layer
graphical front ends.
The project demonstration, on the 25th August 2006, used both the web-based STIS
servlet web-interface, and the Map Viewer application, to showcase the data retrieval
and route calculation aspects of the project. The results of the routing calculation
could be send overlaid directly on a street-map of Dublin, and verified visually.
The sum total of the implementation, is therefore condensed to a single graphic image
of the route on a map, and may not properly reflect the level of work that goes on in
the background to produce a “simple” image.
4.5.1 Map Viewer application
The Map Viewer application allows users to view all the spatial data in the
cache/spatial database, as well as make route requests, and see the responses overlaid
on the map of Dublin.
Figure 25 - The Map Viewer application, displaying various spatial data (left) and
displaying a walking/bus multimodal journey.

73
In addition to graphically displaying the spatial data, and journey routes, the Map
Viewer provides functionality to scroll and zoom the map, as well as the ability to
save routes to disc be re-opened and displayed later. For convenience, colours are
used to distinguish various modes of travel along a particular route. Red designates
road routes, while blue and magenta describe bus and Luas routes respectively.
Colours are also used to display the traffic congestion along various routes through
the city, red being the most congested roads, yellow moderate congestion and green
light congestion.
4.5.2 STIS Servlet web-service
The STIS web-service is a servlet-enabled web application which allows users with a
web-browser to access the STIS Server, and request a journey route. There is no
requirement placed on the web-browser other than it must be capable of displaying
jpeg images, and supports HTML forms.
The user initially specifies a URL to the web-service, which brings up the first
“welcome” screen, with a number of textboxes allowing a user to request start,
destination and waypoint lists, as well as specifying the preferred mode of travel.
Entering text (such as a street-name), coordinates of junction ID values, and clicking
the “Refine Route Parameters” button, will bring up the journey refinement screen.
This screen allows users to pick the desired start/destination/waypoint from a list of
available options, and once satisfied, can proceed by clicking on the “Calculate
Route” button.
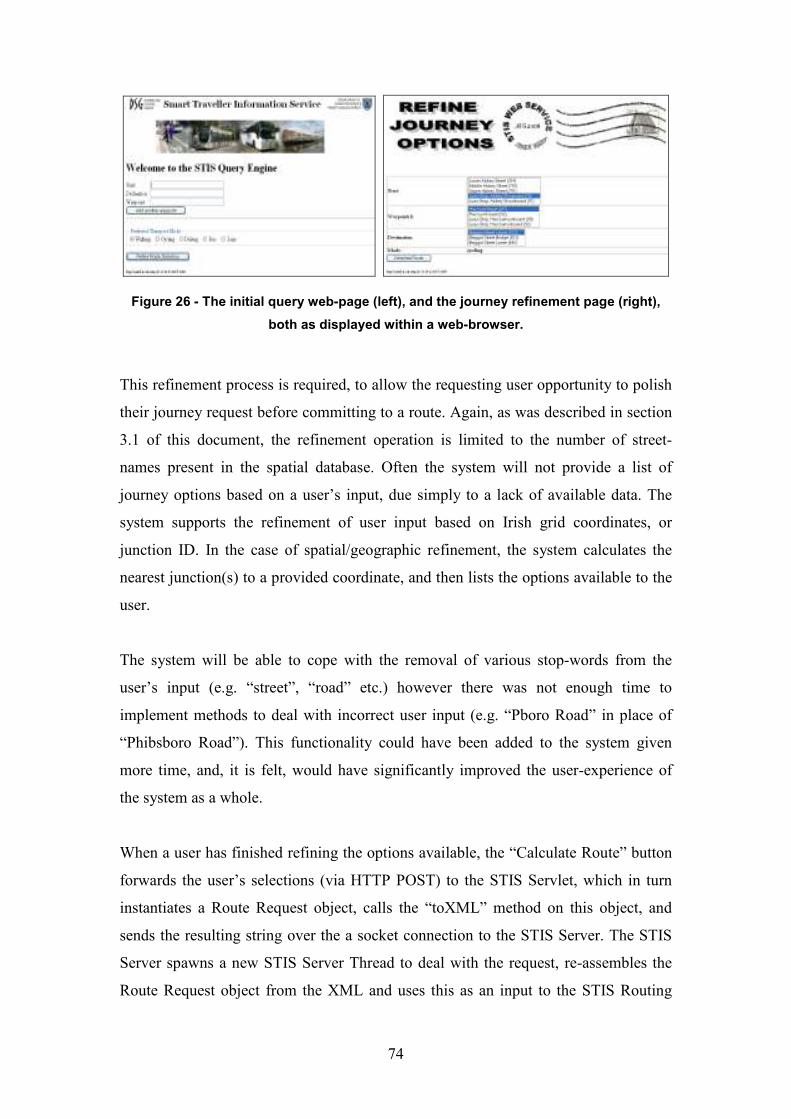
74
Figure 26 - The initial query web-page (left), and the journey refinement page (right),
both as displayed within a web-browser.
This refinement process is required, to allow the requesting user opportunity to polish
their journey request before committing to a route. Again, as was described in section
3.1 of this document, the refinement operation is limited to the number of street-
names present in the spatial database. Often the system will not provide a list of
journey options based on a user’s input, due simply to a lack of available data. The
system supports the refinement of user input based on Irish grid coordinates, or
junction ID. In the case of spatial/geographic refinement, the system calculates the
nearest junction(s) to a provided coordinate, and then lists the options available to the
user.
The system will be able to cope with the removal of various stop-words from the
user’s input (e.g. “street”, “road” etc.) however there was not enough time to
implement methods to deal with incorrect user input (e.g. “Pboro Road” in place of
“Phibsboro Road”). This functionality could have been added to the system given
more time, and, it is felt, would have significantly improved the user-experience of
the system as a whole.
When a user has finished refining the options available, the “Calculate Route” button
forwards the user’s selections (via HTTP POST) to the STIS Servlet, which in turn
instantiates a Route Request object, calls the “toXML” method on this object, and
sends the resulting string over the a socket connection to the STIS Server. The STIS
Server spawns a new STIS Server Thread to deal with the request, re-assembles the
Route Request object from the XML and uses this as an input to the STIS Routing

75
Engine. The STIS Routing Engine produces a Route Response object, which is sent
back to the STIS Server Thread, converted to an XML string, and sent back to the
STIS Servlet. The STIS Servlet re-assembles the Route Response object from the
XML, and provides this as input to the Map Generator class, which produces and
saves the image of the route response to disc. The path to this image is provided back
to the STIS servlet which builds a HTML response (using the HTML Builder class),
finally responding to the user’s request with a HTML message sent over HTTP. The
path to the map image is provided in the body to this request, and is stored in a
directory on the web-server as long as the servlet exists. When the servlet exits, its
destroy method deletes all files generated by the servlet during its lifetime, thus
keeping the disc space used by the servlet to a minimum.
Figure 27 - STIS Servlet response, as shown displayed in a web-browser
The HTML produced by the STIS Servlet was tested on multiple web-browsers, and
included some java scripting elements to allow multiple waypoints to be specified
dynamically by the user.

76
5 Evaluation
The evaluation scenarios for this project changed somewhat when the project scope
was extended. Previously the primary focus of the project proposal was to develop a
multi-modal routing capability, with a secondary goal of integrating this routing
functionality with the underlying spatial API to access the data in the iTransIT spatial
database [29]. These goals were extended to incorporate the correct display of the
spatial data, and the provision of a graphically correct route map outlining the journey
plan, along with the journey summary.
The final evaluation scenarios outlined in this document were created during the latter
stages of the system design process. Essentially the system is evaluated on a number
of criteria, such as:
• Routing correctness and applicability.
• Use of the spatial API for information retrieval.
• Utilisation of multiple transportation modes in routing.
• STIS response times.
• Device independence.
• Presentation of route information.
The system was designed to operate in as close a manner as possible with a
contemporary routing or mapping web-service. Typically responses are handled in a
number of seconds, and multiple users can connect to the service in parallel. The
hardware for the STIS system would not be at the same level as a commercial web-
service, however the design of the system reflected the hope that the response times
and user acceptance would be of a similar standard.

77
5.1 System Evaluation
5.1.1 Evaluation of the Spatial API
The Spatial API was a Java API developed in a previous project [17], and allows
users to access travel-related information from a database. This database is configured
to use spatial information, such as geographic coordinates, as a feature of the retrieval
operation.
In the early stages of the implementation there was an open question about just what
advantages the spatial API (S-API) gave in terms of information retrieval over a direct
JDBC connection to the database. The JDBC/SQL direct query has the benefits of a
finer control over the scope of the particular search operation, but loses out on the
level of abstraction provided by the S-API. Certain features of the S-API, such as the
listing of junctions/bus stops inside a geographic boundary, would be a useful feature
more difficult to express in a direct SQL query.
The S-API however proved to have some quite substantial drawbacks, principally the
speed and reliability of relatively simple retrieval operations. As an example a test
class was developed using both the S-API and an equivalent JDBC/SQL query. The
S-API was timed retrieving all 1306 junction identifiers and associated junction
coordinates from the database in approximately 13-14 seconds. The equivalent
“direct” JDBC/SQL retrieval operation to the same database for the same information
was measured taking on the order of 1-2 seconds. Therefore there is roughly a ten-
fold increase in retrieval times using the S-API for bulk retrieval operations. The
system was checked to find if there were any mitigating factors for this slow
performance. The retrieval time was achieved using the locally installed copy of the
iTransIT database, when the CPU load was less than 5% and when the memory usage
was also at a minimum. It was suspected the slow performance of the spatial API was
due to the use of the SpringFrameWork JDBC libraries to connect to the database, and
execute SQL queries.
More worryingly for the performance of the S-API, it would occasionally throw
exceptions if a bulk read of data was performed, due to the constant setting up and
tearing down of sockets to connect to the database. This was an issue more with the
78
SpringFrameWork libraries than the S-API itself, but could be easily rectified by
changing the S-API to use a better JDBC library.
In addition to performance issues, there were some limitations to the scope of the API
itself. Currently the spatial API can retrieve objects within a user-definable spatial
area. What is not present in the database, and what would be very useful, would be the
extension of this functionality to allow users to retrieve objects by specifying a
minimum or maximum distance from a fixed point.
Originally, when the spatial API was first implemented, the spatial database did not
include any street name information. When type of lookup operation was required
later for the STIS Server, there was limited support for retrieving street-name values,
and no functionality to return multiple possible matches. For example the SQL query,
SELECT * FROM TABLENAME WHERE NAME LIKE “A%ROAD”;
would return a list of names (if they existed in the database) beginning with the letter
‘A’ and ending with the text ‘ROAD’. This simple SQL lookup could not be
performed via the Spatial API, and as a consequence any street-name matching was
performed on the server side rather than the database side.
5.1.2 Route Retrieval Latency
An important aspect of the overall system design was that the calculation of a route
response, should not take more than several seconds, in order to provide a good user-
experience of the system. This requirement tailored the overall design, and ruled out
using certain exhaustive (and time-consuming) routing algorithms, in favour of
dynamic route calculation heuristic-driven algorithms. In addition, to minimise the
CPU load, and keep the memory footprint small (to allow multiple concurrent users)
features such as constructing multiple parallel routes, evaluating them and returning
the most appropriate, were ruled out.
By analysing a relatively small number of route responses, it was found that the
outputs from the STIS system had a delay directly proportion number of links that

79
have been included in the route response. Typically there was a slight increase in the
latency of the initial route response, due to the initialisation and setup of the socket
connection between the STIS servlet/socket client and the STIS server. The response
latency gives the average response time being approximately 1.86ms per route-link.
0
50
100
150
200
250
300
Latency(m
s)/Num. Links
Latency (ms)
Number of Links
Figure 28 - The response delay (latency) compared to the number of links in the route.
The quickest route returned from the sample of 20 route requests made, was 90ms, for
a Luas route between Luas Stops on the same line. The route response with the
highest latency was 251ms, for a multi-modal Luas route with 138 links in total. The
graph above (Figure 28) shows the latency more or less proportional to the number of
links in the resulting route.
The variations in latency versus the number of links are caused by the various
transport types. For example the array used to hold the junction data is far larger than
the same array for the (limited) bus and Luas data available to the STIS system. The
number of potential candidates from one Luas stop to the next is small (i.e. one stop
either side), whereas for junctions there could be four or more candidates when
planning a route from junction to junction. The differences in node density between
the graph of the road junctions, and the Bus/Luas networks means that a road route
will on average require more computation to get from start to destination, and hence a
higher overall latency in servicing the response. The slight increase in latency as the

80
number of route links grows is due in most part to the size of the XML string returned
describing the longer route.
5.2 Route Evaluation
5.2.1 Evaluating Multi-modal Routes
One of the major requirements for the system was to provide a multi-modal route
though Dublin. This goal was, on the whole, accomplished, since the final
implementation of the STIS software will return to a multi-modal route using any of
five separate modes of transport.
Figure 29 - Various routes between Pearse St. and Rathmines Road. Walking route
(left), Luas route (middle), Bus route (right).
The evaluation of multi-modal journeys proves a more difficult problem. The issue is
further complicated by the sparse route data for the Luas and Dublin Bus networks in
the spatial database. A route was selected which could be used to demonstrate Luas
and Bus routes travelling in the same direction.
The specific route for each mode of transport is determined by a large number of
factors, such as the one-way street system in the case of vehicles and cyclists, and the
location of stops in the case of the Luas and Bus networks. In addition multi-modal
routes can be connected together where the start and end points are not serviced by
the same mode of transport.

81
Transport Mode Start Destination Mode Duration Total Distance
Walking Pearse Street Rathmines Road 26 minutes 2,823m
Cycling Pearse Street Rathmines Road 11 minutes 3,399m
Driving Pearse Street Rathmines Road 8 minutes 3,399m
Walking/Luas Pearse Street Rathmines Road 14mins/4mins 3,507m
Walking/Bus Pearse Street Rathmines Road 10mins/7mins 3,327m
The table above describes five routes each using one or more of the supported means
of transport. The Luas and Bus routes, which can be observed in Figure 29, utilise
some walking components in the overall route. The disparity in distances between the
various routes taken is explained by the fact that each route deviates slightly from the
other.
5.3 Evaluation Summary
The system was found to perform up to the initial expectation as was outlined during
the design and implementation phase of the project. The high level goal of the system,
providing users with a multi-modal travel plan through Dublin, was achieved, as was
the extra goal of providing a means to display this route graphically.
The basic routing functionality incorporated into the system, whilst not guaranteeing
the shortest path, performs much better than any exhaustive search algorithm capable
of calculating the shortest path. The route response returned will be, for most routes,
the shortest path between those points. The design decision taken at the beginning of
the project gave a preference this type of dynamic routing algorithm capable of
dealing with large search spaces.
5.3.1 Evaluation Elements
Task Description Status Comments
1. Integrate the STIS system with the Spatial-API to
provide route planning information about the
different travel data sources.
Done The Spatial API is used
to provide the spatial
data for the STIS
system.
2. Provide a caching mechanism to store the
information retrieved from the spatial database.
Done
3. Develop an XML interface to handle user requests. Done
4. Develop XML schemas for request/response travel
data.
Done All information passed
to the STIS is
encapsulated in XML.

82
5 Provide road routing functionality
(driving/cycling/walking) using the Dublin street
network.
Done Road routes can be
found using the system,
respecting the one-way
street system.
6. Provide bus routing functionality. Done Bus routing
functionality is
available, however the
routing is limited to the
sparse data set
available in the spatial
database.
7. Provide Luas routing functionality. Done Both Luas lines
available, and routes
are possible between
different lines. Only 10
Luas stops listed in the
spatial database.
8. Provide multi-modal routing functionality. Done The system will allow a
user to construct a
multi-modal route,
using the various
modes of transport
supported by the
system.
9. Provide route description summary. Done Total distance, and
duration, along with the
distance/duration of
each mode of transport
used it listed. The
system also provides
graphical route
descriptions, in
conjunction with the
presentation layer
applications.
10. Provide street-name route description. Partially
Complete
480 roads out of 2800
does not facilitate a
street-by-street route
description, however
the street-names where
encountered are listed
in the response XML.
11. Allow for user input of imprecise information, and
journey refinement.
Done The system will
respond to incorrect or
imprecise user inputs
with appropriate
options.
12. Allow spatial coordinates to be provided as input. Partially
Complete
OSI coordinates can be
provided by the user as
input, however
direction of travel
using polar coordinates
is not supported.
13. System response times within typical web-service
expectations
Done The typical average
response time is on the
order of 150-200ms
locally.
14. System is scalable. Done The system supports
multiple clients, and
can be hosted from
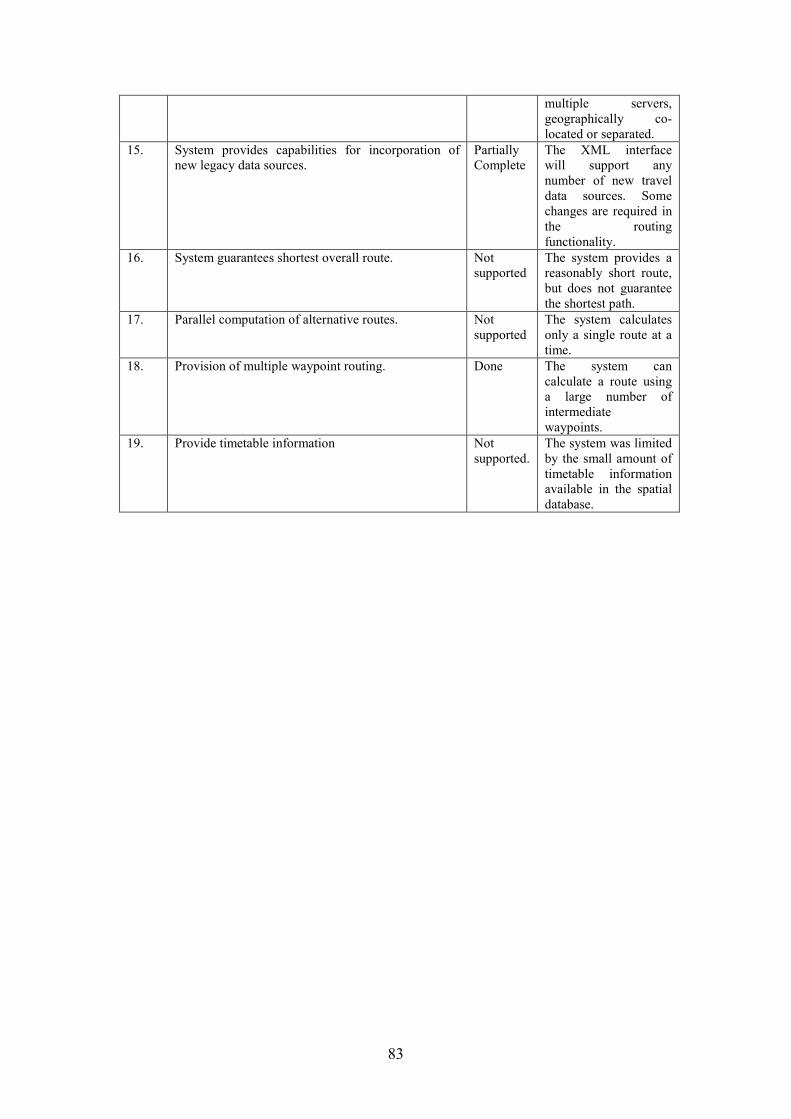
83
multiple servers,
geographically co-
located or separated.
15. System provides capabilities for incorporation of
new legacy data sources.
Partially
Complete
The XML interface
will support any
number of new travel
data sources. Some
changes are required in
the routing
functionality.
16. System guarantees shortest overall route. Not
supported
The system provides a
reasonably short route,
but does not guarantee
the shortest path.
17. Parallel computation of alternative routes. Not
supported
The system calculates
only a single route at a
time.
18. Provision of multiple waypoint routing. Done The system can
calculate a route using
a large number of
intermediate
waypoints.
19. Provide timetable information Not
supported.
The system was limited
by the small amount of
timetable information
available in the spatial
database.

84
6 Conclusion
The Smart Traveller Information System revealed a number of findings which were
not immediately apparent at the beginning of the project. Foremost amongst these was
the complexity involved in implementing a dynamic, efficient and correct multi-
modal routing algorithm, and the challenges posed in creating a means of displaying
route information correctly and clearly for the user.
The contribution of this project was threefold, firstly to demonstrate that multi-modal
routing was possible using only the information present in the iTransIT spatial
database, secondly to exhibit how the existing spatial API could be used to retrieve
and update this data, and lastly to provide a means to display this journey planning
functionality in a graphical form.
The system implementation proved that multi-modal routes could be calculated, using
the spatial API to retrieve the underlying travel data from the spatial database. In
addition the two GUI interfaces developed for this project enabled the graphical
display of these multi-mode routes, as well as allowing users to formulate, and refine
route requests.
The goals outlined at the start of the project were largely accomplished, and the basic
multimodal routing functionality developed can quite easily be extended to produce
better routes and journey plans, over many different modes of transportation. Due to
the way the routing algorithm works, the transport networks (road/bus/Luas) can be
expanded without adding any delay to the route calculation. Exhaustive search
algorithms would suffer considerably, since the time it takes to calculate a route is
directly proportional to the number of links present in the network as a whole.
The performance of the system, in terms of response time and availability, was of
secondary importance, to the provision of route planning functionality. However, due
to the design of the system as a whole, it was found that the availability of the STIS
server, and the response time for requests to this server, compared favourably to
existing web-based journey planning services.

85
6.1 Future Work
This section describes areas in which future work could be directed, to improve and
expand upon the work done during this project.
6.1.1 Additional Routing Functionality
The STIS system implemented a basic multi-modal route planning service. There
exist many opportunities to expand the system to both improve the route planning
service as it exists, potentially adding new routing algorithms, or improving the
existing algorithm. Currently the heuristic used to find routes through Dublin does not
guarantee that the route returned is the shortest, nor the quickest. This was due to the
requirement that all routing should be dynamic, and return a result in a reasonable
time. Exhaustive search algorithms, ruled out due to their inability to cope well with
large networks, could be useful if the search space was reduced by pre-selecting a
certain area.
6.1.2 Adding more information to the database
The principal limitation of the system was the amount, and type, of data present in the
iTransIT spatial database. During the course of the project implementation, various
additions to the data set were required in order to implement functions in the software,
namely the addition of street-names to the database to assist in journey waypoint
refinement.
The STIS system was also restricted to some extent by the lack of more data in the
iTransIT spatial database. Overall the system would be improved by the addition of
more data, especially extra transportation links such as the DART system, Bus
Eireann, and taxi information. During the implementation of the project, the spatial
database contained,
- 10 Luas Stops from potential 30 or more.
- 15 Bus Stops from several hundred in Dublin
- 2 Bus Routes over a limited distance.

86
Since the routing functionality could only work with the information present in the
database, it was felt that the routes produced by the system would have been greatly
improved by the supplementing the database with more data elements. The bus
routing functionality especially, would have significantly benefited from more bus
stops and bus routes in the database. The Luas information could likewise be added to,
to improve the STIS routing functionality.
The traffic congestion information, which was produced by a simulator and inserted
in the database, was limited to only 51 points of information, from a potential pool of
1300 junctions. A useful extension to the project would be to produce a more detailed
list of traffic congestion information for Dublin, or better yet, connect to a real-time
traffic information system.
Some other information, which was lacking from the underlying data, could be added
at a later date. This included information regarding the location of pedestrian areas in
Dublin, and larger area names in general (e.g. Rathmines, City Centre etc.).
6.1.3 Integrating System with Mobile Location Services
At the moment the capability exists for standard GSM/GPRS, as well as 3G handsets,
to be geographically positioned using the radio signal between the handset and the
base-station to describe a “location area” in which the handset is located. In addition,
some handset manufacturers are providing GPS support within some newer mobile
handsets to refine the location area to a radius of several meters.
There is the possibility of quite quickly opening up the STIS system to be accessed
via a modified presentation layer which takes handset location information as an input
to calculating a route. An example of this type of service would include a handset-
based tourist guide, automatically directing a mobile user around a city’s landmarks in
a user-specified language. This type of service is already present in various Asian
markets, and was recently introduced to the UK to support mobile navigate services,
using GPS positioning [30].

87
7 Bibliography
1. Dublin Bus - Homepage. [cited June 2006]; Available from:
http://www.dublinbus.ie/.
2. Wikipedia. Irish National Grid Reference System. [cited 19th July 2006];
Available from:
http://en.wikipedia.org/wiki/Irish_national_grid_reference_system.
3. Wikipedia. Biography of George Bradshaw. [cited 13th July 2006];
Available from: http://en.wikipedia.org/wiki/George_Bradshaw.
4. Live Traffic Information from Dublin City Council. [cited 13th July 2006];
Available from: http://www.dublintraffic.com/.
5. Dublin City Council - FM Radio Traffic Updates. [cited 20th August 2006];
Available from: http://www.dublincityannaliviafm.com/livedrive.html.
6. DTO. Walk & Cycle Journey Planner. [cited 13th July 2006]; Available
from: http://www.dto.ie/web2006/jp.htm.
7. TfL. Transport for London - Journey Planner. [cited 13th July 2006];
Available from: http://journeyplanner.tfl.gov.uk/.
8. AA Roadwatch : Route Planning. [cited 13th July 2006]; Available from:
http://www.aaroadwatch.ie/routes/.
9. Seattle Area Traffic Conditions. [cited May 2006]; Available from:
http://www.wsdot.wa.gov/traffic/seattle/.
10. Google Maps, UK & Ireland. [cited 14th July 2006]; Available from:
http://maps.google.co.uk.
11. Map24 Mapping Service. [cited June 2006]; Available from:
http://ie.map24.com/.
12. Google Transit - Portland Oregan Public Transport Planner. [cited 17th July
2006]; Available from: http://www.google.com/transit/help/faq_transit.html.
13. Mobile Google Maps. [cited June 2006]; Available from:
http://www.google.com/gmm.
14. Corás Iompair Eireann Homepage. [cited June 2006]; Available from:
http://www.cie.ie.
15. Dublin Area Rapid Transit (DART) Homepage. [cited June 2006]; Available
from: http://www.dart.ie/.
16. Luas Homepage. [cited June 2006]; Available from: http://www.luas.ie/.
17. Thermin, T., iTransIT - Internship Report. 2005, Trinity College Dublin.
18. Meier, R., Presentation on Global Smart Spaces - M.Sc. Dissertation Topic.
2005: Dublin.
19. O'Callaghan, P. Delivering Smart Traveller Information Service to Users.
2006 [cited 18th July 2006]; Available from: https://www.cs.tcd.ie/~ocallapj/.
20. iTransIT Project Homepage. 2005 [cited 18th July 2006]; Available from:
http://www.dsg.cs.tcd.ie/?category_id=-40.
21. SQuirreL SQL Client Home Page. [cited 8th August 2006]; Available from:
http://squirrel-sql.sourceforge.net/.
22. Sedgewick, R., Algorithms in Java. Part 5 - Graph Algorithms. 3rd ed. 2004,
Boston, Massachusetts: Addison-Wesley.
23. Dai, L., Fast Shortest Path Algorithm for Road Network and Implementation.
2005, School of Computer Science, Carelton University.
88
24. Bast, M., Mehlhorn, K., Schafer, G., Tarnaki, H., A Heuristic For Dijkstra's
Algorithm with Many Targets and Its Use in Weighted Matching Algorithms.
Algorithmica, 2003. Vol. 36(No. 1 - Feburary 2003): p. 75-88.
25. Lee, C.Y., An Algorithm for Path Connection and its Applications. IRE
Transactions on Electronic Computers, 1961. EC-10(346-365).
26. Fawcett, J., Robinson, P., Adaptive Routing for Road Traffic. IEEE Computer
Graphics and Applications, 2000(May/June).
27. JUnit Resource Homepage. [cited 28th July 2006]; Available from:
http://www.junit.org/index.htm.
28. O'Donnell, J., An Evaluation of XML Associated Vulnerabilities in the Xerces-
C++ Parser. 2005, Trinity College: Dublin.
29. Meier, R., Harrington, A., Termin, T., Cahill, V. A Spatial Programming
Model for Real Global Smart Space Applications. 2006 [cited 18th July
2006]; Available from: https://www.cs.tcd.ie/publications/tech-
reports/reports.06/TCD-CS-2006-18.pdf.
30. TomTom - Portable GPS navigation systems. [cited 28th July 2006];
Available from:
http://www.tomtom.com/products/product.php?ID=208&Language=1.
Top Related