


Languages
Pages
Legal


Global and China EMS/ODM Industry
Report, 2014-2015
Apr. 2015

METHODOLOGY
Both primary and secondary research methodologies were used
in preparing this study. Initially, a comprehensive and exhaustive
search of the literature on this industry was conducted. These
sources included related books and journals, trade literature,
marketing literature, other product/promotional literature, annual
reports, security analyst reports, and other publications.
Subsequently, telephone interviews or email correspondence
was conducted with marketing executives etc. Other sources
included related magazines, academics, and consulting
companies.
INFORMATION SOURCES
The primary information sources include Company Reports,
and National Bureau of Statistics of China etc.
STUDY GOAL AND OBJECTIVES
This report provides the industry executives with strategically significant
competitor information, analysis, insight and projection on the
competitive pattern and key companies in the industry, crucial to the
development and implementation of effective business, marketing and
R&D programs.
REPORT OBJECTIVES
To establish a comprehensive, factual, annually updated and cost-
effective information base on market size, competition patterns,
market segments, goals and strategies of the leading players in the
market, reviews and forecasts.
To assist potential market entrants in evaluating prospective
acquisition and joint venture candidates.
To complement the organizations’ internal competitor information
gathering efforts with strategic analysis, data interpretation and
insight.
To suggest for concerned investors in line with the current
development of this industry as well as the development tendency.
To help company to succeed in a competitive market, and
understand the size and growth rate of any opportunity.
Room 502, Block 3, Tower C, Changyuan Tiandi Building, No. 18, Suzhou Street, Haidian District, Beijing, China 100080 Phone: +86 10 82600828 ● Fax: +86 10 82601570 ● www.researchinchina.com ● [email protected]
Copyright 2012 ResearchInChina

Abstract
Global and China EMS/ODM Industry Report, 2014-2015 is primarily
concerned with the following:
1, Overview of EMS/ODM industry;
2, EMS/ODM market and industry;
3, Ranking in the EMS/ODM industry;
4, 27 typical EMS/ODM manufacturers.
In 2014, thanks to a surge in shipments of mobile phone vendors such
as Apple, Huawei, and Xiaomi, the EMS/ODM market rose by 5%,
in contrast to a 0.5% drop in 2013. In 2014, the growth in mobile
phone offset the drop in notebook computer market. In 2015, Apple
mobile phone will still have strong growth potential, but with the
growth rate dwarfed by that in 2014. The 4G construction of Radio
Access Networks reached the peak in 2014. It is projected that the
RAN market will be on the decline in 2015-2019. Moreover, the data
size of mobile Internet surged, data center or cloud computing
services market grew robustly. Consequently, the EMS/ODM
market in 2015 increased by 3.1%. In future, smartphones will be
saturated and RAN market will decline, which would prompt the
growth rate of EMS/ODM to drop year by year.
Room 502, Block 3, Tower C, Changyuan Tiandi Building, No. 18, Suzhou Street, Haidian District, Beijing, China 100080 Phone: +86 10 82600828 ● Fax: +86 10 82601570 ● www.researchinchina.com ● [email protected]
Copyright 2012ResearchInChina

IT infrastructure, with data center or cloud computing services as the core, will constitute the biggest driving force. The server shipments will
grow robustly in 2015, with an overall shipment estimated to increase by 13.5%. In particular, the ODM-Direct will rise by 20%. Server OEM
and ODM-Direct are basically monopolized by the Taiwanese vendors, with a global market share of over 90%. Taiwan has a complete
industrial chain of server, which is viewed as an extension of the computer. As the Taiwanese vendors have stronger and stronger technical
ability, the future equipment cabinet solution of Server+Routing+Storge+Switching will gain more market space.
However, the European and US EMS/ODM vendors are dedicated to improving profitability by reducing the revenue proportion of telecom
and communication infrastructure, and intensifying the expansion to industrial, medical, and automotive sectors. Meanwhile, they have also
strengthened the weakness in components, and ventured into the upstream sector of industrial chains. But compared with the Taiwanese
vendors, the European and US EMS/ODM peers lagged far behind in the field of components. They would make up for the shortcomings
through M&A, with, for example, Jabil’s acquisition of Nypro.
Room 502, Block 3, Tower C, Changyuan Tiandi Building, No. 18, Suzhou Street, Haidian District, Beijing, China 100080 Phone: +86 10 82600828 ● Fax: +86 10 82601570 ● www.researchinchina.com ● [email protected]
Copyright 2012ResearchInChina

1 Introduction to EMS and ODM
1.1 Definition
1.2 Background
2 EMS and ODM Downstream Market
2.1 EMS and ODM Market Size
2.2 Wireless Access Network Equipment
2.3 Cloud Service Market
2.3.1 Cloud Service Overview
2.3.2 Cloud Service Market Size
2.3.3 Datacenter Workload
2.4 Memory
2.4.1 Memory Market Size
2.4.2 Memory Industry
2.5 Data Center
2.6 Server
2.6.1 Server Market Size
2.6.2 Server Industry
2.7 Global Mobile Phone Market and Industry
2.8 China Mobile Phone Market
2.9 Laptop Computer Market
2.10 Tablet PC Market
2.11 HDD Market
2.12 HDD Industry
Table of contents
Room 502, Block 3, Tower C, Changyuan Tiandi Building, No. 18, Suzhou Street, Haidian District, Beijing, China 100080 Phone: +86 10 82600828 ● Fax: +86 10 82601570 ● www.researchinchina.com ● [email protected]
3 EMS and ODM Industry
3.1 Overview
3.2 Ranking
3.3 SMEs
4 EMS and ODM Vendors
4.1 Hon Hai
4.2 BYD Electronic
4.3 Flextronics
4.4 Jabil
4.5 Quanta Computer
4.6 Compal
4.7 Wistron
4.8 Inventec
4.9 Pegatron
4.10 Celestica
4.11 Cal-Comp
4.12 Benchmark
4.13 Sanmina
4.14 Universal Scientific Industrial (USI)
4.14.1 USI Shanghai
4.15 SIIX
4.16 Plexus
4.17 Shenzhen Kaifa Technology Co., Ltd.
4.18 Venture
4.19 Zollner
4.20 UMC
4.21 SUMITRONICS
4.22 GBM
4.23 VTech
4.24 3CEMS
4.25 Shenzhen Zowee Technology
4.26 PC Partner Group
4.27 FIH Mobile Limited
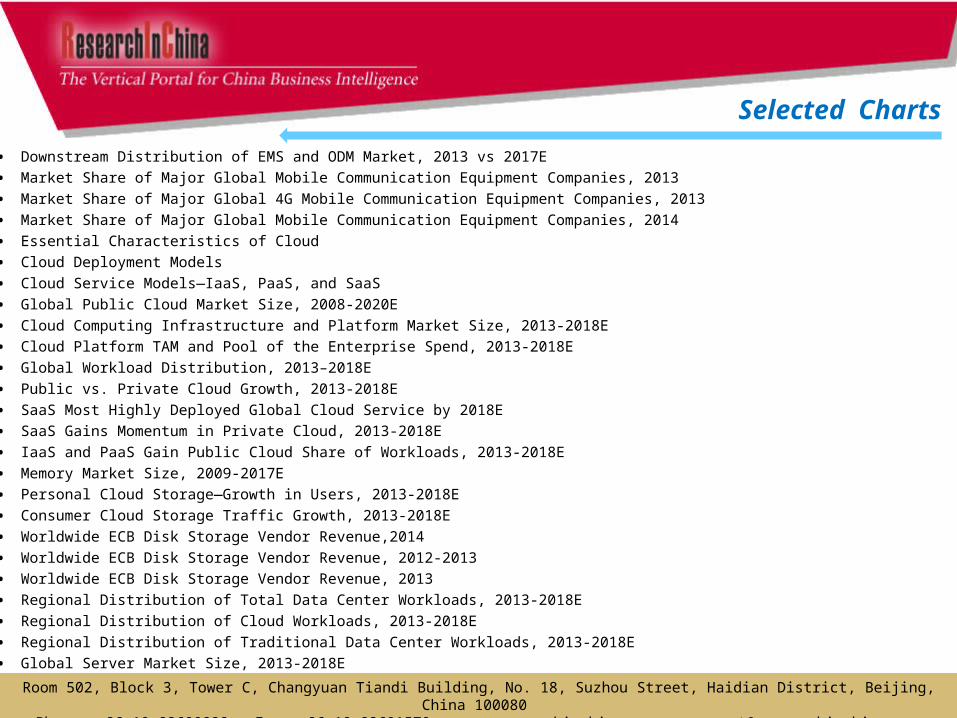
• Downstream Distribution of EMS and ODM Market, 2013 vs 2017E
• Market Share of Major Global Mobile Communication Equipment Companies, 2013
• Market Share of Major Global 4G Mobile Communication Equipment Companies, 2013
• Market Share of Major Global Mobile Communication Equipment Companies, 2014
• Essential Characteristics of Cloud
• Cloud Deployment Models
• Cloud Service Models—IaaS, PaaS, and SaaS
• Global Public Cloud Market Size, 2008-2020E
• Cloud Computing Infrastructure and Platform Market Size, 2013-2018E
• Cloud Platform TAM and Pool of the Enterprise Spend, 2013-2018E
• Global Workload Distribution, 2013–2018E
• Public vs. Private Cloud Growth, 2013-2018E
• SaaS Most Highly Deployed Global Cloud Service by 2018E
• SaaS Gains Momentum in Private Cloud, 2013-2018E
• IaaS and PaaS Gain Public Cloud Share of Workloads, 2013-2018E
• Memory Market Size, 2009-2017E
• Personal Cloud Storage—Growth in Users, 2013-2018E
• Consumer Cloud Storage Traffic Growth, 2013-2018E
• Worldwide ECB Disk Storage Vendor Revenue,2014
• Worldwide ECB Disk Storage Vendor Revenue, 2012-2013
• Worldwide ECB Disk Storage Vendor Revenue, 2013
• Regional Distribution of Total Data Center Workloads, 2013-2018E
• Regional Distribution of Cloud Workloads, 2013-2018E
• Regional Distribution of Traditional Data Center Workloads, 2013-2018E
• Global Server Market Size, 2013-2018E
•
Selected Charts
Room 502, Block 3, Tower C, Changyuan Tiandi Building, No. 18, Suzhou Street, Haidian District, Beijing, China 100080 Phone: +86 10 82600828 ● Fax: +86 10 82601570 ● www.researchinchina.com ● [email protected]

• Top 5 Corporate Family, Worldwide Server Systems Factory Revenue, 2013
• Top 5 Corporate Family, Worldwide Server Systems Factory Revenue, 2014Q4
• Worldwide Server Vendor Shipments, 2014Q4
• Worldwide Server Vendor Revenue, 2014Q4
• EMEA Server Vendor Revenue, 2014Q4
• EMEA Server Shipment, 2014Q4
• Market Share of Global Server Brand Vendors, 2015
• Market Share of Global Server Manufacturers, 2015
• Supply Relationship between OEM and Server Brand Vendors
• Global 3G/4G Mobile Phone Shipment by Region, 2011-2014
• Worldwide Smartphone Sales to End Users by Vendor, 2014
• Worldwide Smartphone Sales to End Users by Operating System, 2014
• Shipments of Global Top10 Mobile Phone Vendors, 2014
• Monthly Shipment of Mobile Phone in China, Jan.2013-Dec.2014
• Market Share of Major Vendors in Chinese Smart Phone Market, 2014
• Market Share of Major Vendors in Chinese 4G Mobile Phone Market, 2014
• Laptop Computer Shipments, 2008-2015E
• Shipments of Global Major Laptop Computer ODM Companies, 2010-2014
• Global Tablet PC Shipments, 2011-2016E
• Shipments of Top5 Tablet PC Vendors, 2014 Q4
• Shipments, Market Share, and Growth of Top5 Tablet PC Vendors, 2014
• Quarterly HDD Shipment, 2012Q4-2014Q4
• HDD Shipment, 2009-2015
• Market Share of Global Major HDD Vendors, 2014
• HDD Shipment by Application, 2010-2019E
Selected Charts
Room 502, Block 3, Tower C, Changyuan Tiandi Building, No. 18, Suzhou Street, Haidian District, Beijing, China 100080 Phone: +86 10 82600828 ● Fax: +86 10 82601570 ● www.researchinchina.com ● [email protected]

• Global EMS and ODM Output Value by Region, 2013
• Ranking of Global Top 20 EMS and ODM Vendors by Revenue, 2012-2014
• Gross Margin of Global Top 18 EMS and ODM Vendors, 2012-2014
• Hon Hai’s Revenue and Gross Margin, 2007-2015
• Hon Hai’s Monthly Revenue, Mar.2013-Mar.2015
• Hon Hai’s Revenue by Client, 2013
• Revenue and Gross Margin of BYD Electronic, 2008-2014
• Revenue of BYD Electronic by Business, 2006-2014
• Revenue of BYD Electronic’s Component & Module Division by Product,2013
• Revenue of BYD Electronic by Client, 2013
• Revenue of BYD Electronic by Client, 2014
• Revenue and Gross Profit of Flextronics, FY2009-FY2015
• Balance Sheet of Flextronics, FY2009-FY2014
• Quarterly Revenue and Gross Margin of Flextronics, Q1 2013-Q4 2014
• Revenue of Flextronics by Region, FY2011-FY2014
• Property and Equipment of Flextronics by Region, FY2012-FY2014
• Revenue of Flextronics by Business, FY2011-FY2014
• Top 10 Clients of Flextronics
• Revenue from INS Segment of Flextronics, FY2010-FY2014
• Revenue from IEI Segment of Flextronics, FY2010-FY2014
• Revenue from HRS Segment of Flextronics, FY2010-FY2014
• Revenue from CTG Segment of Flextronics, FY2010-FY2014
• Global Manufacturing Footprint of Flextronics
• Employee of Flextronics by Region, 2015
• Jabil’s Revenue and Operating Margin, FY2009-FY2015
Selected Charts
Room 502, Block 3, Tower C, Changyuan Tiandi Building, No. 18, Suzhou Street, Haidian District, Beijing, China 100080 Phone: +86 10 82600828 ● Fax: +86 10 82601570 ● www.researchinchina.com ● [email protected]
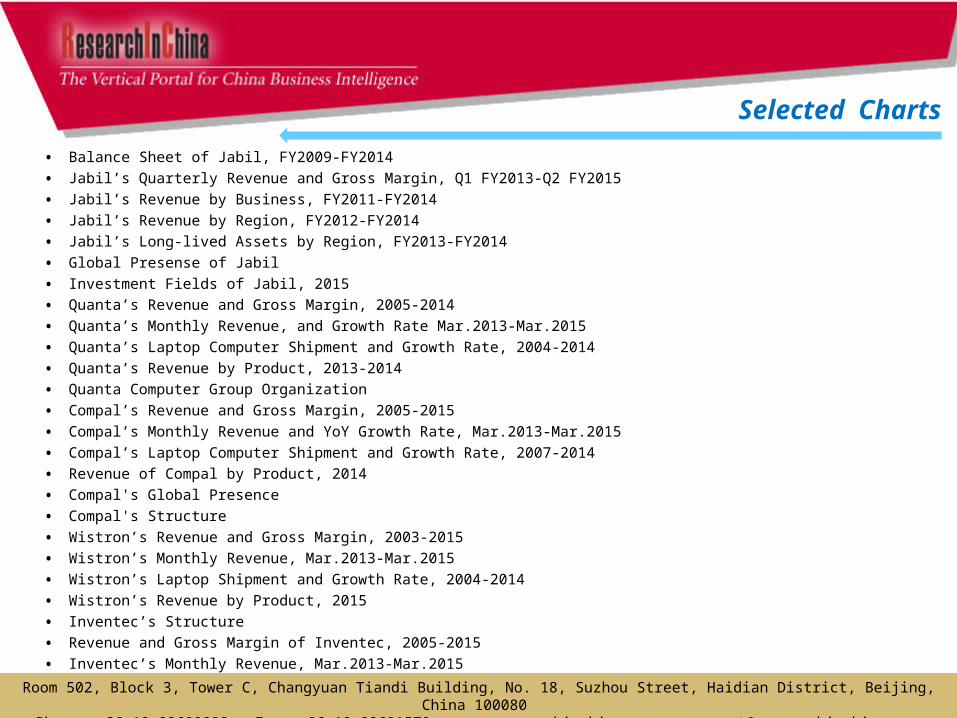
• Balance Sheet of Jabil, FY2009-FY2014
• Jabil’s Quarterly Revenue and Gross Margin, Q1 FY2013-Q2 FY2015
• Jabil’s Revenue by Business, FY2011-FY2014
• Jabil’s Revenue by Region, FY2012-FY2014
• Jabil’s Long-lived Assets by Region, FY2013-FY2014
• Global Presense of Jabil
• Investment Fields of Jabil, 2015
• Quanta’s Revenue and Gross Margin, 2005-2014
• Quanta’s Monthly Revenue, and Growth Rate Mar.2013-Mar.2015
• Quanta’s Laptop Computer Shipment and Growth Rate, 2004-2014
• Quanta’s Revenue by Product, 2013-2014
• Quanta Computer Group Organization
• Compal’s Revenue and Gross Margin, 2005-2015
• Compal’s Monthly Revenue and YoY Growth Rate, Mar.2013-Mar.2015
• Compal’s Laptop Computer Shipment and Growth Rate, 2007-2014
• Revenue of Compal by Product, 2014
• Compal's Global Presence
• Compal's Structure
• Wistron’s Revenue and Gross Margin, 2003-2015
• Wistron’s Monthly Revenue, Mar.2013-Mar.2015
• Wistron’s Laptop Shipment and Growth Rate, 2004-2014
• Wistron’s Revenue by Product, 2015
• Inventec’s Structure
• Revenue and Gross Margin of Inventec, 2005-2015
• Inventec’s Monthly Revenue, Mar.2013-Mar.2015
Selected Charts
Room 502, Block 3, Tower C, Changyuan Tiandi Building, No. 18, Suzhou Street, Haidian District, Beijing, China 100080 Phone: +86 10 82600828 ● Fax: +86 10 82601570 ● www.researchinchina.com ● [email protected]
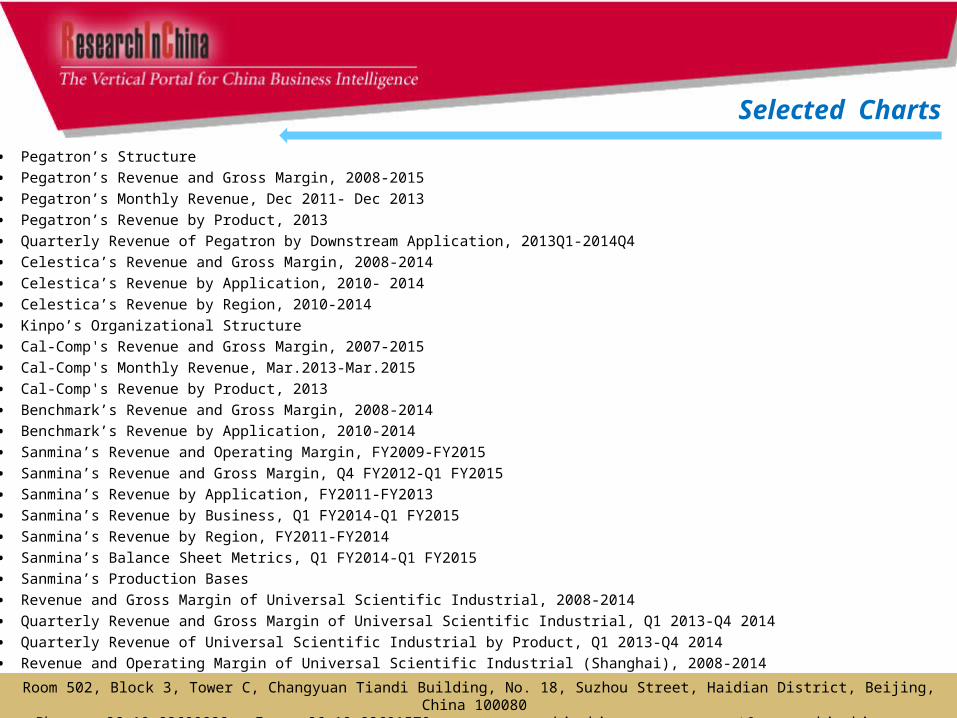
• Pegatron’s Structure
• Pegatron’s Revenue and Gross Margin, 2008-2015
• Pegatron’s Monthly Revenue, Dec 2011- Dec 2013
• Pegatron’s Revenue by Product, 2013
• Quarterly Revenue of Pegatron by Downstream Application, 2013Q1-2014Q4
• Celestica’s Revenue and Gross Margin, 2008-2014
• Celestica’s Revenue by Application, 2010- 2014
• Celestica’s Revenue by Region, 2010-2014
• Kinpo’s Organizational Structure
• Cal-Comp's Revenue and Gross Margin, 2007-2015
• Cal-Comp's Monthly Revenue, Mar.2013-Mar.2015
• Cal-Comp's Revenue by Product, 2013
• Benchmark’s Revenue and Gross Margin, 2008-2014
• Benchmark’s Revenue by Application, 2010-2014
• Sanmina’s Revenue and Operating Margin, FY2009-FY2015
• Sanmina’s Revenue and Gross Margin, Q4 FY2012-Q1 FY2015
• Sanmina’s Revenue by Application, FY2011-FY2013
• Sanmina’s Revenue by Business, Q1 FY2014-Q1 FY2015
• Sanmina’s Revenue by Region, FY2011-FY2014
• Sanmina’s Balance Sheet Metrics, Q1 FY2014-Q1 FY2015
• Sanmina’s Production Bases
• Revenue and Gross Margin of Universal Scientific Industrial, 2008-2014
• Quarterly Revenue and Gross Margin of Universal Scientific Industrial, Q1 2013-Q4 2014
• Quarterly Revenue of Universal Scientific Industrial by Product, Q1 2013-Q4 2014
• Revenue and Operating Margin of Universal Scientific Industrial (Shanghai), 2008-2014
Selected Charts
Room 502, Block 3, Tower C, Changyuan Tiandi Building, No. 18, Suzhou Street, Haidian District, Beijing, China 100080 Phone: +86 10 82600828 ● Fax: +86 10 82601570 ● www.researchinchina.com ● [email protected]

• Revenue of Universal Scientific Industrial (Shanghai) by Application, 2011-2014
• Output of Universal Scientific Industrial (Shanghai) by Product, 2011-2014
• Cost Structure of Universal Scientific Industrial (Shanghai), 2014
• SIIX’s Revenue and Gross Margin, 2008-2014
• SIIX’s Capital structure, 2010-2014
• SIIX’s Cash Flow, 2010-2014
• SIIX Organizational Structure
• SIIX’s Commercial Pattern
• SIIX’s Revenue by Application, 2014-2015
• SIIX’s Sales bridge, 2014-2015
• SIIX’s Sales Structure by Region,2014
• SIIX Distribution
• SIIX’s Expansion in Mexico
• Revenue and Gross Margin of Plexus, FY2009-FY2014
• Revenue of Plexus by Application, FY2011-FY2014
• Revenue of Plexus by Region, FY2011-FY2014
• Revenue and Gross Margin of Shenzhen Kaifa Technology Co., Ltd., 2007-2014
• Revenue of Shenzhen Kaifa Technology Co., Ltd. by Business, 2012-2014
• Venture’s Revenue and Gross Margin, 2008-2014
• Venture’s Revenue by Segment, 2013-2014
• Venture’s Revenue by Business, 2011-2014
• Zollner’s Major Clients
• Major Products of SUMITRONICS
• Global Presence of SUMITRONICS
• GBM’s Organizational Structure
Selected Charts
Room 502, Block 3, Tower C, Changyuan Tiandi Building, No. 18, Suzhou Street, Haidian District, Beijing, China 100080 Phone: +86 10 82600828 ● Fax: +86 10 82601570 ● www.researchinchina.com ● [email protected]

• GBM’s Revenue and Gross Margin, 2007-2015
• GBM’s Monthly Revenue, Mar.2012-Mar.2015
• VTech’s Revenue and Pre-tax Profit Margin, FY2009-FY2015
• Major Products and Services of Vtech
• Vtech’s Revenue by Business, FY2010-FY2015
• Revenue of Vtech’s ELP Business by Region, FY2014
• Revenue of Vtech’s Phone Business by Region, FY2014
• Revenue of Vtech’s CMS Business by Product, FY2012-FY2013
• Revenue of Vtech’s CMS Business by Region, FY2014
• Major Products of Vtech’s CMS Division
• CMS Manufacturing Capacity of Vtech
• Vtech’s CMS Manufacturing Capacity Expansion, FY2011-FY2014
• Major Products of 3CEMS
• PCB Capacity of 3CEMS
• Plants of 3CEMS
• Revenue and Gross Margin of Shenzhen Zowee Technology, 2009-2014
• Revenue of Shenzhen Zowee Technology by Product, FY2009-FY2014
• Revenue and Gross Margin of PC Partner Group, FY2009-FY2014
• Revenue of PC Partner Group by Product, FY2009-FY2014
• Revenue of PC Partner Group by Region, FY2009-FY2014
• Revenue and Operating Margin of FIH, 2006-2015
• Revenue Structure of FIH by Client, 2014
• Revenue Structure of FIH by Region, 2005-2014
Selected Charts
Room 502, Block 3, Tower C, Changyuan Tiandi Building, No. 18, Suzhou Street, Haidian District, Beijing, China 100080 Phone: +86 10 82600828 ● Fax: +86 10 82601570 ● www.researchinchina.com ● [email protected]

You can place your order in the following alternative ways:
1.Order online at www.researchinchina.com
2.Fax order sheet to us at fax number:+86 10 82601570
3. Email your order to: [email protected]
4. Phone us at +86 10 82600828/ 82601561
Party A:Name:Address:Contact Person: TelE-mail: Fax
Party B:Name: Beijing Waterwood Technologies Co., Ltd (ResearchInChina)Address: Room 502, Block 3, Tower C, Changyuan Tiandi Building, No. 18,
Suzhou Street, Haidian District, Beijing, China 100080Contact Person:
Liao Yan Phone:
86-10-82600828
E-mail: [email protected] Fax: 86-10-82601570Bank details:
Beneficial Name: Beijing Waterwood Technologies Co., LtdBank Name: Bank of Communications, Beijing BranchBank Address: NO.1 jinxiyuan shijicheng,Landianchang,Haidian District,BeijingBank Account No #: 110060668012015061217Routing No # : 332906Bank SWIFT Code: COMMCNSHBJG
Title Format Cost
Total
Choose type of format
PDF (Single user license) …………..2,300 USD
Hard copy ………………….……. 2,500 USD
PDF (Enterprisewide license)…....... 3,600 USD
※ Reports will be dispatched immediately
once full payment has been received.
Payment may be made by wire transfer or
credit card via PayPal.
How to Buy
Room 502, Block 3, Tower C, Changyuan Tiandi Building, No. 18, Suzhou Street, Haidian District, Beijing, China 100080 Phone: +86 10 82600828 ● Fax: +86 10 82601570 ● www.researchinchina.com ● [email protected]

About ResearchInChina
ResearchInChina (www.researchinchina.com) is a leading independent provider of China business intelligence. Our research is designed to meet the diverse planning and information needs of businesses, institutions, and professional investors worldwide. Our services are used in a variety of ways, including strategic planning, product and sales forecasting, risk and sensitivity management, and as investment research.
Our Major Activities
Multi-users market reports
Database-RICDB
Custom Research
Company Search
RICDB (http://www.researchinchina.com/data/database.html ), is a visible financial data base presented by map and graph covering global and China macroeconomic data, industry data, and company data. It has included nearly 500,000 indices (based on time series), and is continuing to update and increase. The most significant feature of this base is that the vast majority of indices (about 400,000) can be displayed in map.
After purchase of our report, you will be automatically granted to enjoy 2 weeks trial service of RICDB for free.
After trial, you can decide to become our formal member or not. We will try our best to meet your demand. For more information, please find at www.researchinchina.com
For any problems, please contact our service team at:
Room 502, Block 3, Tower C, Changyuan Tiandi Building, No. 18, Suzhou Street, Haidian District, Beijing, China 100080 Phone: +86 10 82600828 ● Fax: +86 10 82601570 ● www.researchinchina.com ● [email protected]
RICDB service
Top Related