


Languages
Pages
Legal


Get Better at IT
Key Aspects & Challenges?

Interactive Clicker Exchange

What is the balance between your people and systems for analyzing your patient health outcomes?
100
% p
eople
& 0
% s
...
75
% p
eopl
e & 2
5% ..
.
50
% p
eopl
e & 5
0% ..
.
25
% p
eopl
e & 7
5% ..
.
10
% p
eopl
e & 9
0% ..
.
21%
32%
11%
26%
11%
1. 100% people & 0% systems (no system)2. 75 % people & 25% systems3. 50 % people & 50% systems4. 25 % people & 75% systems5. 10 % people & 90% systems
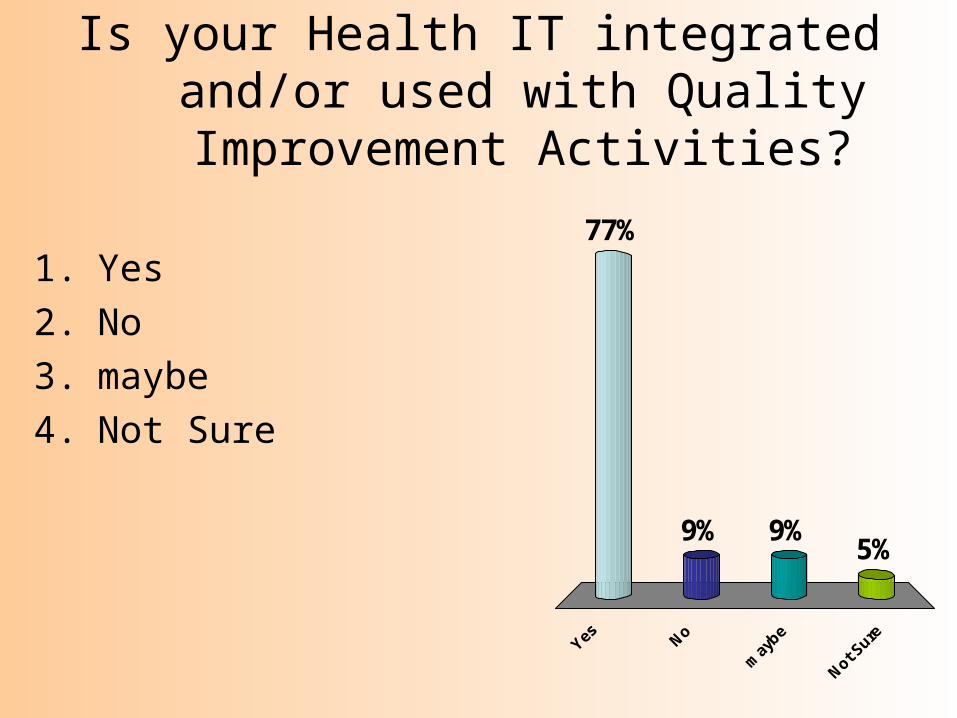
Is your Health IT integrated and/or used with Quality Improvement Activities?
Yes N
o
may
be
Not S
ure
77%
5%9%9%
1. Yes
2. No
3. maybe
4. Not Sure

Has your Health IT been able to track or
document better system’s Usage?
Yes N
o
Ofte
n
Not O
ften E
nough
53%
16%
5%
26%
1. Yes
2. No
3. Often
4. Not Often Enough

Which of the following areas has been most difficult for
continuous project or quality improvement?
Lea
dersh
ip (p
eople
)
Buy-
in (p
roce
ss)
Tec
hnolo
gy (s
yste
m...
Cap
acity
to U
se D
ata
...
16%
26%26%
32%1. Leadership (people)
2. Buy-in (process)
3. Technology (systems capabilities)
4. Capacity to Use Data for continuous improvement (project improvements)

What percentage of the data in your Health IT system do believe is useful for quality improvement tracking?
None
of it
Som
e of i
t
Most
of i
t
All
of it
0%
21%
42%37%1. None of it
2. Some of it
3. Most of it
4. All of it

Is your Health IT set up to facilitate or prompt quality patient care?
Yes N
o
Ofte
n
Not O
ften E
nough
42%
16%11%
32%1. Yes
2. No
3. Often
4. Not Often Enough

Strategy
ProcessPeople
Technology

Strong and continuous leadership in avoiding complacency and striving to take things to the next level is needed.
Little ways and big ways to get better.
PDSA cycles and performance improvement projects.
Draw on power users in your efforts again.
Use of third parties can help as well.
Getting Better at IT

Strategy
ProcessPeople
Technology

Is Is Customer Support ExcellenceCustomer Support Excellence
a key component of success toa key component of success to
Getting Better at IT?Getting Better at IT?

1. Any problems or barriers with using the system?
2. To what degree is the system saving you time?
3. To what degree is the system reporting effective for you?
4. How is technical assistance and support for you?
5. If not a “10”, what can we do to make it a “10”?
– “The fact that someone calls me to make sure that all is well and to see if I have any ideas is just great.”
Proactive Courtesy Calls and Evaluation

Results:Proactive Courtesy Calls and Evaluation
NYC HOPWA eCOMPAS
0%
20%
40%
60%
80%
100%
eCOMPAS as a TimeSaver
Value of eCOMPASReports
RDE Help Desk /Support

Results:Proactive Courtesy Calls and Evaluation
NYC Prevention Testing eCOMPAS
0%10%20%30%40%50%60%70%80%90%
100%
eCOMPAS as a TimeSaver
Value of eCOMPASReports
RDE Help Desk / Support

Results:Proactive Courtesy Calls and Evaluation
NYC EBI/DEBI eCOMPAS
0%10%20%30%40%50%60%70%80%90%
100%
eCOMPAS as a TimeSaver
Value of eCOMPASReports
RDE Help Desk / Support

Results:Paterson Medical and SPNS Agencies

– “Really easy to use.”– “It has taken days out of running reports.”– “You guys are wonderful.”– “The fact that we could do the rents is marvelous. The
fact that it keeps track of your contracts is just great.”
– “Shaking up a lot of people because now their bosses can see when work isn't done.”
– “Very easy to enter information. Only way to make it better is to have it read your mind.”
– “It's great! Very very easy, no issues, very straightforward. Issues with username and password in the beginning, but they were resolved. Doesn't think it could get any easier.”
– “It’s nice to work with such a responsive group of people.”– “This intensive TA truly makes a difference!”– “It’s great to have all this data at our fingertips.”– “You guys are awesome!”
NYC Qualitative Responses

– “I think it’s easy and practical compared to other systems we used such as <deleted>… This is the max, the best. I think you did a great job.”
– “It’s pretty cool. VERY easy to work with.”– “It's easy. No problems. Very simple. Very User friendly.”– “Great, the last changes are wonderful. I am really happy
about the last changes that were made that we had requested.”
– “It is going very good. You [RDE/DOHMH] are providing a good service.”
– “I love that it's web-based, so I’m not tied to a machine like other systems. I have no complaints.”
– “I like it. It is easy for me to work with, because everything is right THERE, I don’t have to look around for certain items; it tells you the next steps, etc.”
– “Your support [RDE] is very fast. Very helpful. Efficient.”
NYC Qualitative Responses cont’d
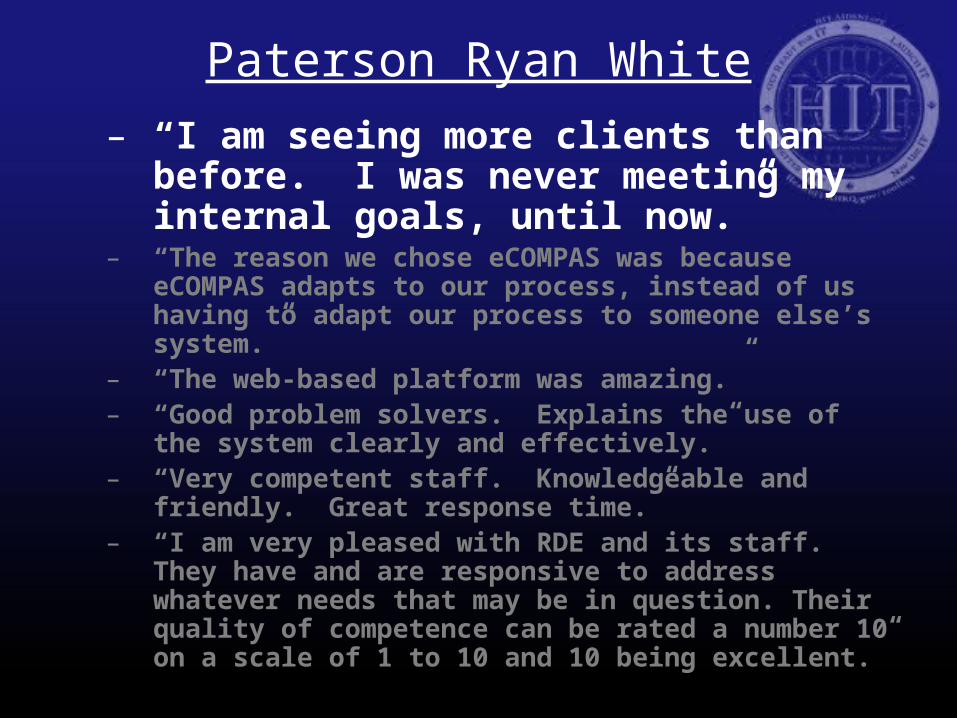
– “I am seeing more clients than before. I was never meeting my internal goals, until now.”
– “The reason we chose eCOMPAS was because eCOMPAS adapts to our process, instead of us having to adapt our process to someone else’s system.”
– “The web-based platform was amazing.”– “Good problem solvers. Explains the use of the system
clearly and effectively.”– “Very competent staff. Knowledgeable and friendly. Great
response time.”– “I am very pleased with RDE and its staff. They have and
are responsive to address whatever needs that may be in question. Their quality of competence can be rated a number 10 on a scale of 1 to 10 and 10 being excellent.”
Paterson Ryan White

Constructive feedback from TA, Proactive Calls, and QA provided to Administration.
Administration decides if worthy and priority.
Enhancements are reviewed, developed, deployed and announced.
Users see their feedback is taken seriously and increase their engagement and system compliance.
National shared best practices community.
User Group
User-Driven Enhancements

Users feel empowered that their ideas count.
Improvements (time savings, error reduction, etc) that are valuable to the front-line staff that would ordinarily get lost are actually implemented.
Other ideas are encouraged. Users have hope.
Buy-in is reinforced with the process of improvement.
Impact

Strategy
ProcessPeople
Technology

What did we do well, that we would do again?
What could we do better?
If we had to do it over again, what would we do differently?
After Action Reviews (AARs)

Policies, procedures, protocols may need to be created or amended.
Realignment of expectations may need to occur. Communication is the solution.
User capacities (including non-technical capacities) may need to be upgraded.
Not All HIT Challenges Have Technology Solutions
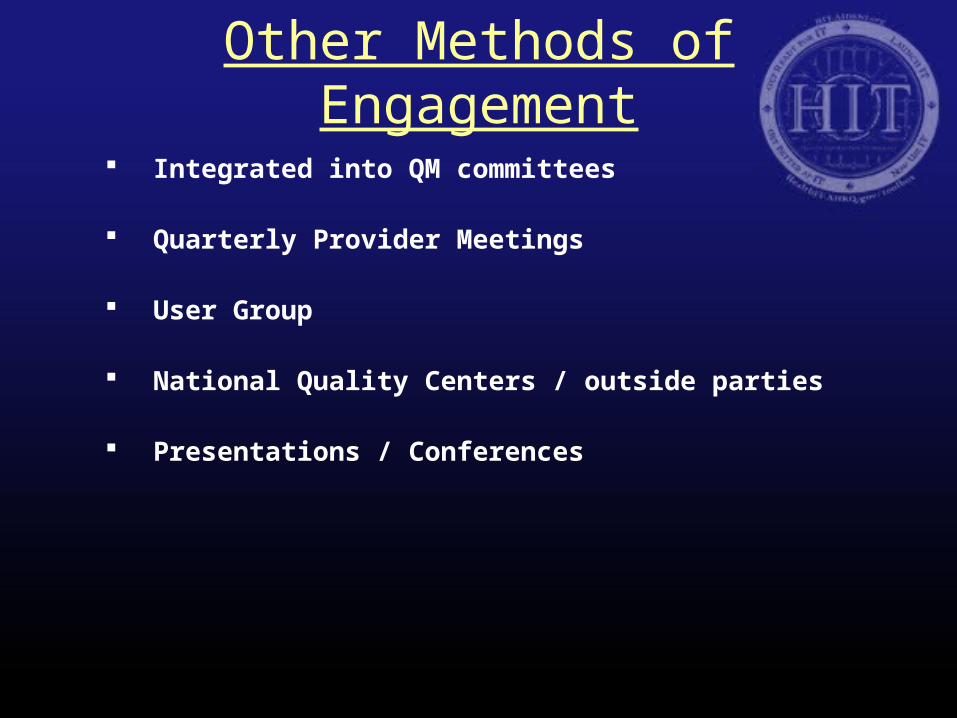
Integrated into QM committees
Quarterly Provider Meetings
User Group
National Quality Centers / outside parties
Presentations / Conferences
Other Methods of Engagement

"Application of Innovative Technology for Planning Bodies: Web-based Needs Assessment, real-time Graphic Data for Priority
Setting, and Web-based Client Satisfaction Surveys."
August 2008 HRSA All Grantees Meeting
Client Satisfaction Getting Better at IT
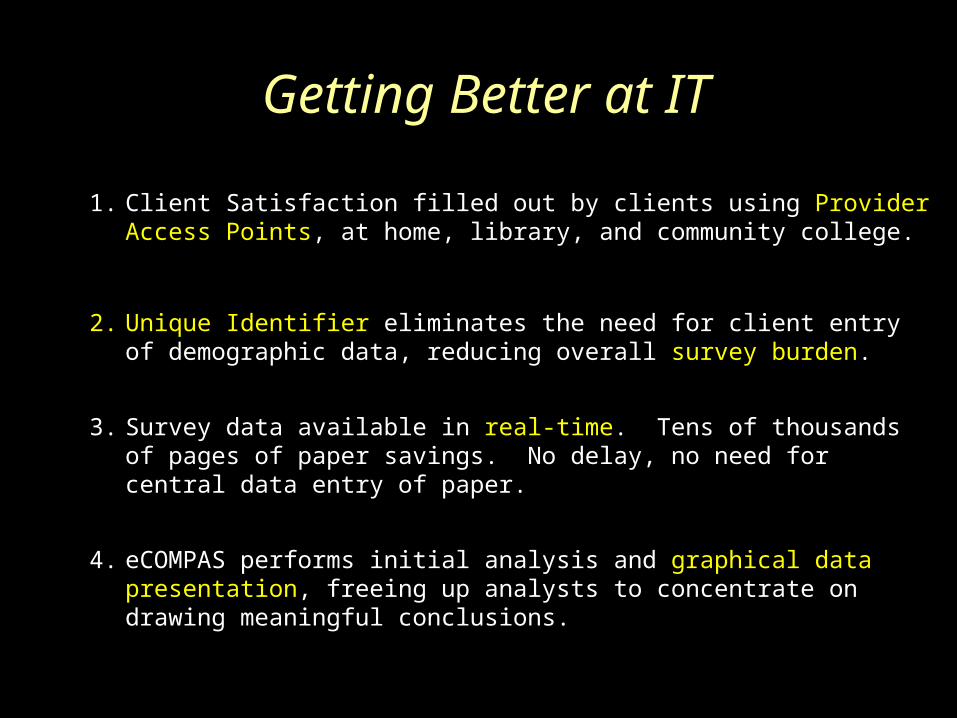
1. Client Satisfaction filled out by clients using Provider Access Points, at home, library, and community college.
2. Unique Identifier eliminates the need for client entry of demographic data, reducing overall survey burden.
3. Survey data available in real-time. Tens of thousands of pages of paper savings. No delay, no need for central data entry of paper.
4. eCOMPAS performs initial analysis and graphical data presentation, freeing up analysts to concentrate on drawing meaningful conclusions.

Client Satisfaction Getting Better at IT
5. eCOMPAS reporting facilitates data drill-down for multiple layers of analysis.
6. Data integrity is improved through the reduction of human error in data entry.
7. Data are available immediately to all stakeholders. This is useful feedback for providers who are now able to make midcourse corrections immediately, not 12+ months later.
8. Reports provided in an easy-to-use dynamic and visual format, allowing for instantaneous drilldown.

Consumer Participation: Existing Tools• Instruction Sheets
• Access Cards
• Access Point Signs
• Consumer Training Sessions and Locations
• On-line Help
• Provider Assistance: Train the Helper

Provider Kiosks
St. Paul’s CDC

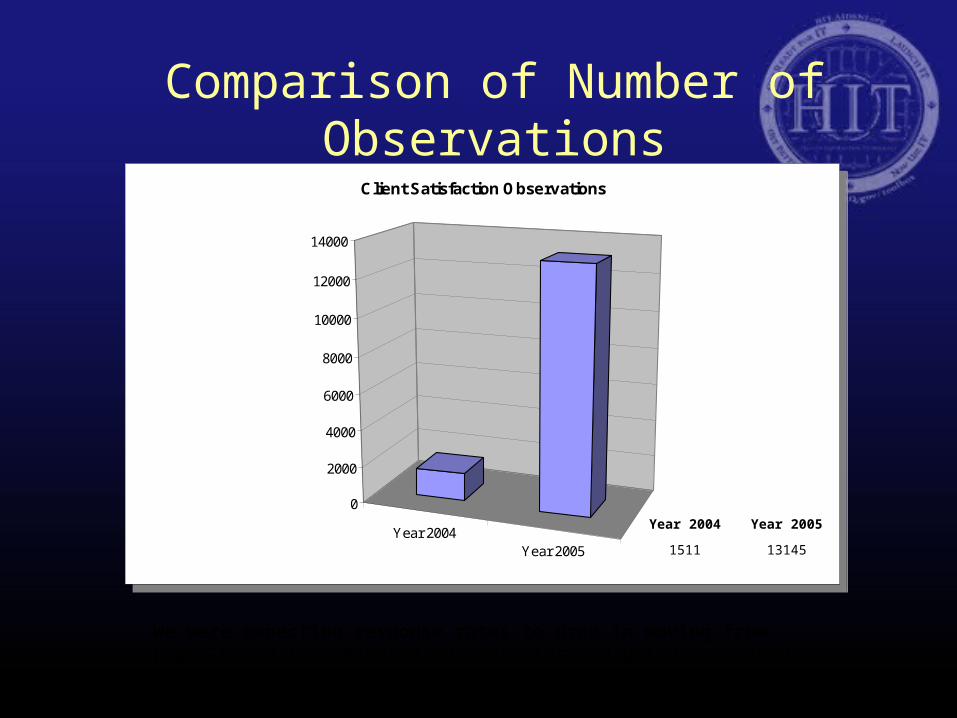
Comparison of Number of Observations
Year 2004Year 2005
0
2000
4000
6000
8000
10000
12000
14000
Client Satisfaction Observations
Year 2004Year 2005
0
2000
4000
6000
8000
10000
12000
14000
Client Satisfaction Observations
Year 2004 Year 2005
1511 13145
We were expecting response rates to drop in moving from paper-based to web-based surveys. Instead going web-based produced a surprising increase in response rates for a primarily urban, disadvantaged population, making internet access barriers a myth.


Needs Assessment Getting Better at IT
1. In-Care survey filled out by clients using Provider Access Points.
2. Out-of-care surveys administered via field teams.
3. In-Care Survey data available in real-time. No delay, no need for central data entry of paper.
4. Out-of-care surveys data entered into same central, integrated web-based database by field teams.
5. eCOMPAS performs initial analysis and graphical data presentation on both in-care and out-of-care, freeing up analysts to concentrate on drawing meaningful conclusions.
6. Data available immediately to all stakeholders.
7. Reports provided in an easy-to-use dynamic and visual format.
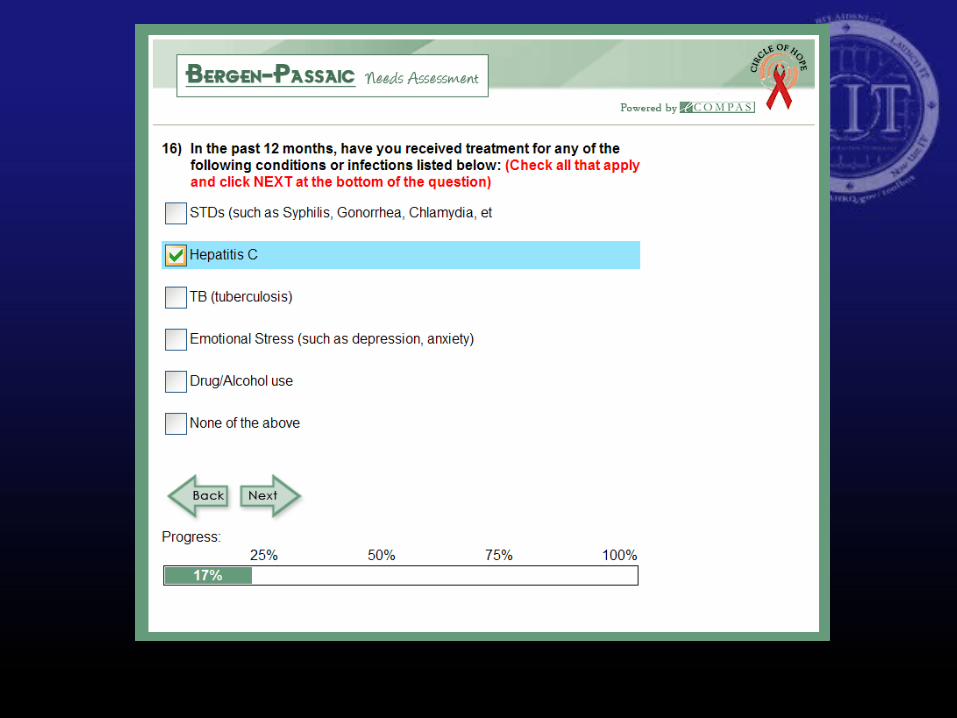

Complex Data
Collection

NextQuestion
NextQuestion
Getting Better at IT- The System does all the work behind the scenes.


Distribution of Time to Complete Online Survey
0
20
40
60
80
100
120
0-5 5-10 10-15 15-20 20+
Minutes
Nu
mb
er o
f S
urv
eys

Selected Outcomes
• Reduction / elimination of duplicate data entry.
• 50% reduction of time in fee-for-service billing and other activities for providers, enabling more clients to be seen each day (and more quality time with clients)
• Real-time feedback and improved data quality.
• Federal reporting went from being a “nightmare” to a tool used for real-time data quality improvement.
• Providers engaged in data analysis seeing its value for quality improvement.
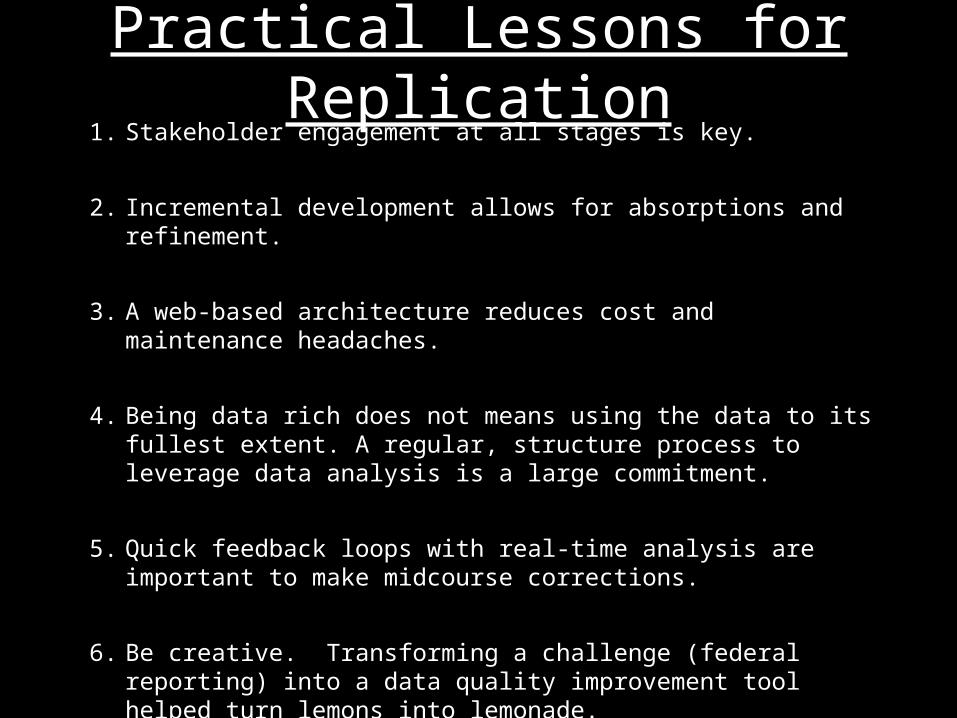
Practical Lessons for Replication1. Stakeholder engagement at all stages is key.
2. Incremental development allows for absorptions and refinement.
3. A web-based architecture reduces cost and maintenance headaches.
4. Being data rich does not means using the data to its fullest extent. A regular, structure process to leverage data analysis is a large commitment.
5. Quick feedback loops with real-time analysis are important to make midcourse corrections.
6. Be creative. Transforming a challenge (federal reporting) into a data quality improvement tool helped turn lemons into lemonade.

Be Flexible

Teamwork Makes a Difference

ProcessPeople
Technology
Strategy

SPNS Module UsePercentage of Active Clients in SPNS modules (St. Mary's
Hospital)
0.00%
10.00%
20.00%
30.00%
40.00%
50.00%
60.00%
70.00%
80.00%
90.00%
100.00%
3/31/2008 6/30/2008 9/30/2008 12/31/2008 3/31/2009 6/30/2009 9/30/2009
1/1/2008 4/1/2008 7/1/2008 10/1/2008 1/1/2009 4/1/2009 7/1/2009
Documents
Immunizations
STI
TBTST

Appointment Adherence Has an Impact
Average CD4 count of clients with cd4 < 200 during Q1 2008
0
50
100
150
200
250
3/31/08 6/30/08 9/30/08 12/31/08 3/31/09 6/30/09
1/1/08 4/1/08 7/1/08 10/1/08 1/1/09 4/1/09
Average CD4 count of subset group

ProcessPeople
Technology
Strategy

Implementing and sustaining HIT is challenging.
The costs of doing HIT wrong are significant.
HIT, done right, is worth time, energy, and investment.
Techniques, strategies, peers, and resources exist to help you.
The HIT Lifecycle Adoption Framework can help you touch the key bases in a structured way.
Focus on the process over the product, and choose your strategic partners and vendors wisely.
Conclusion

Workshop Evaluation

Workshop Evaluation

Final word of hope…

How can you accomplish ambitious goals?
One bite at a time.

Thank you for your time!
Top Related