


Languages
Pages
Legal


Spring 2017 – UAF Class GEOS 657
GEOS 657 – MICROWAVE REMOTE SENSINGSPRING 2017
Lecturer: F.J. Meyer, Geophysical Institute, University of Alaska Fairbanks; [email protected]
Lecture 14: On the Use of InSAR in Geophysics

Franz J Meyer, UAF
GEOS 657, Spring 2016 - 2
REVIEW OF INSAR WORKFLOW FOR A GEOPHYSICAL APPLICATION

Franz J Meyer, UAF
GEOS 657, Spring 2016 - 3
How InSAR Works
• InSAR phase is a function of distance from satellite to ground (range)
Path difference results in phase shift
780 k
m
By precisely measuring the phase difference 𝝓, the change in distance from satellite to ground can be calculated to an accuracy of sub-wavelength.
Franz J Meyer, UAF
GEOS 657, Spring 2016 - 4
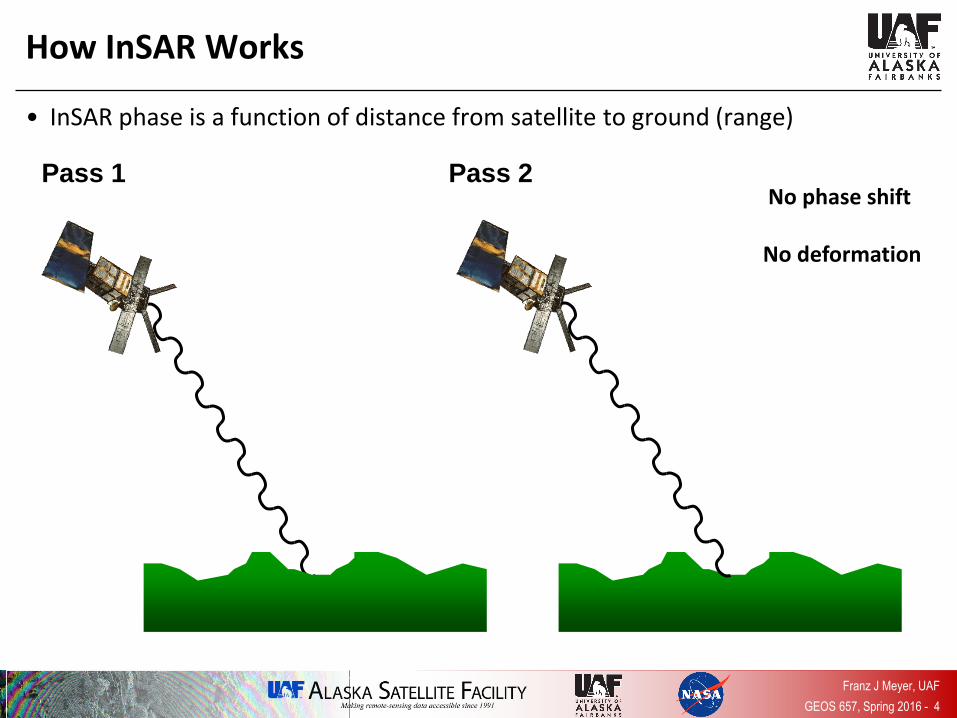
How InSAR Works
• InSAR phase is a function of distance from satellite to ground (range)
Pass 1 Pass 2No phase shift
No deformation

Franz J Meyer, UAF
GEOS 657, Spring 2016 - 5
How InSAR Works
• InSAR phase is a function of distance from satellite to ground (range)
Pass 1 Pass 2
phase shift:
120 degrees
Ground subsidence: 9 mm
Franz J Meyer, UAF
GEOS 657, Spring 2016 - 6
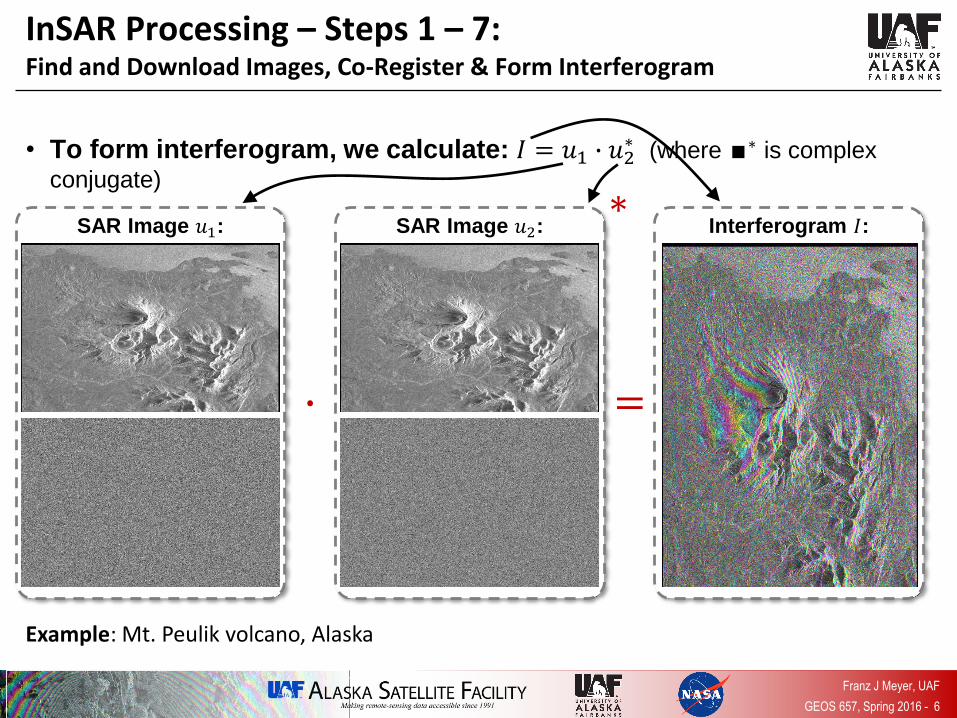
InSAR Processing – Steps 1 – 7:Find and Download Images, Co-Register & Form Interferogram
=∙
• To form interferogram, we calculate: 𝐼 = 𝑢1 ∙ 𝑢2∗ (where ∎∗ is complex
conjugate)
SAR Image 𝑢1: SAR Image 𝑢2:∗
Interferogram 𝐼:
Example: Mt. Peulik volcano, Alaska

Franz J Meyer, UAF
GEOS 657, Spring 2016 - 7
InSAR Processing – Step 8:Subtraction of Flat Earth Phase
• Example:
– ERS-2 Interferogram of Mt. Peulik volcano, Alaska
Before Flat Earth Phase Compensation After Flat Earth Phase Compensation
Flat Earth Phase

Franz J Meyer, UAF
GEOS 657, Spring 2016 - 8
InSAR Processing – Step 9 & 10:Phase Filtering & Topographic Phase Correction using DEM
Sim
ula
ted
To
po
grap
hy-
on
ly i
nte
rfe
rogr
am
0 360
DEM
in R
adar
Co
ord
inat
es
InSAR Imaging Geometry & Parameters
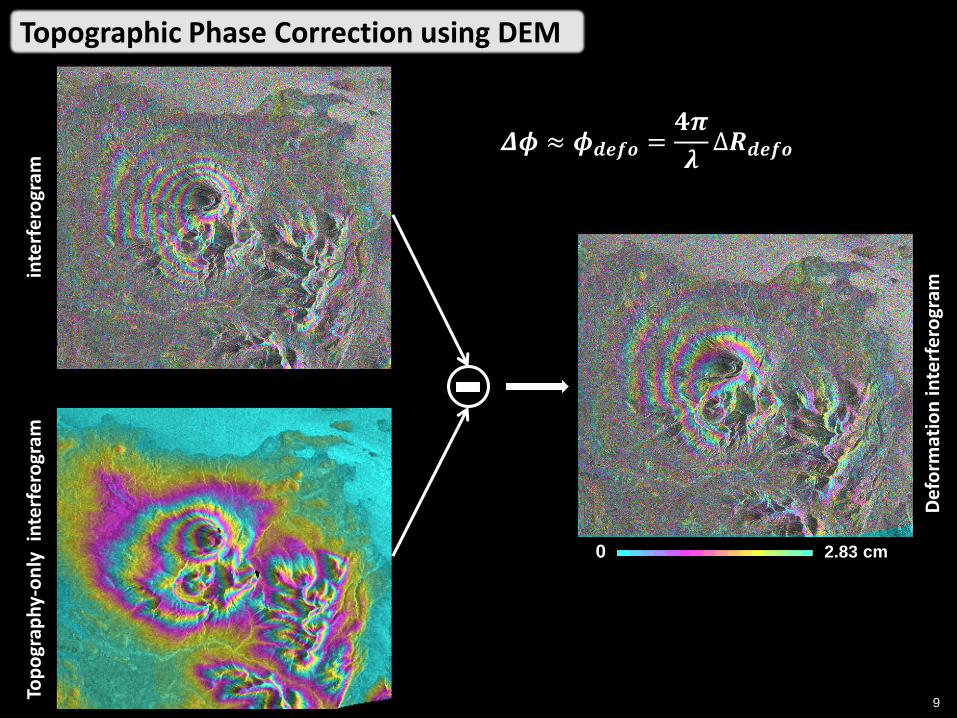
Topographic Phase Correction using DEMin
terf
ero
gram
Top
ogr
aph
y-o
nly
in
terf
ero
gram
Def
orm
atio
n in
terf
ero
gram
0 2.83 cm
𝜟𝝓 ≈ 𝝓𝒅𝒆𝒇𝒐 =𝟒𝝅
𝝀∆𝑹𝒅𝒆𝒇𝒐
9
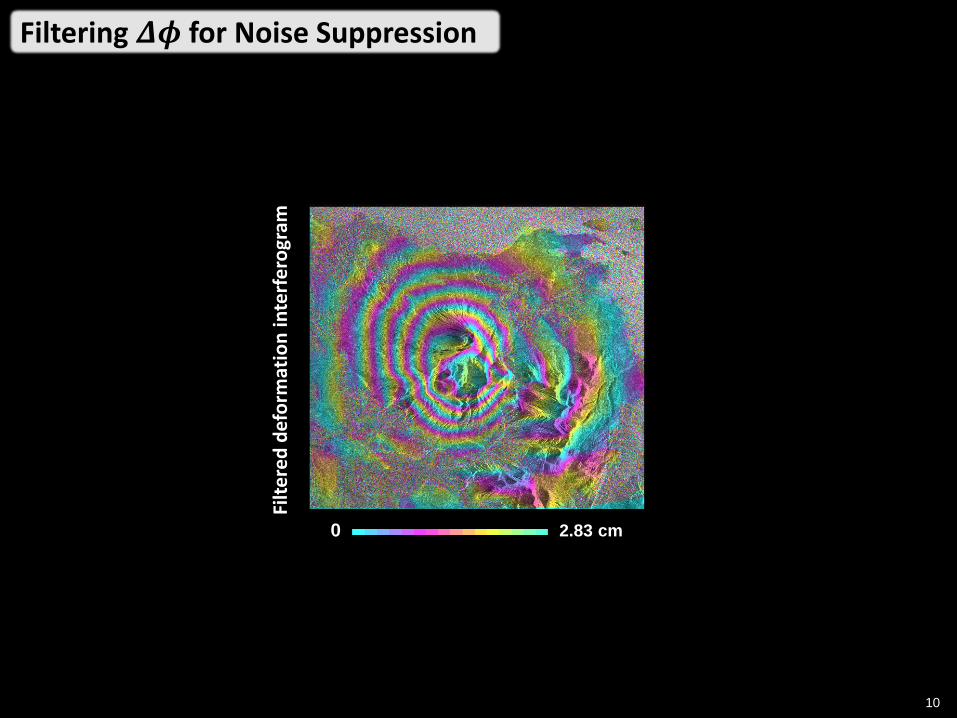
Filtering 𝜟𝝓 for Noise Suppression
Filt
ere
d d
efo
rmat
ion
inte
rfe
rogr
am
0 2.83 cm
10

InSAR Processing Step 9 - Deformation interferogram in map projection
(including phase unwrapping and geocoding)Interpretation of Geocoded Differential Phase 𝜟𝝓
11

InSAR Processing Step 9 - Deformation interferogram in map projection
(including phase unwrapping and geocoding)Representation of Interferometric Phase
28 mm0
28.3
84.9
Uplift mm
Courtesy of G. Bawden, USGS12
InSAR Processing Step 9 - Deformation interferogram in map projection
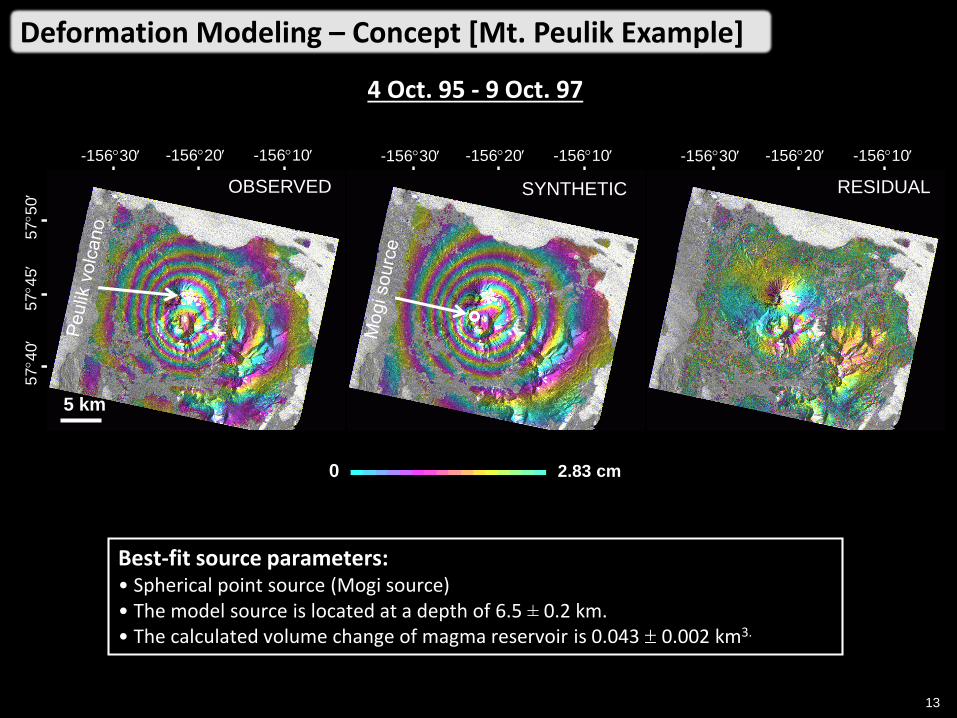
(including phase unwrapping and geocoding)Deformation Modeling – Concept [Mt. Peulik Example]
-15630 -15620 -15610
RESIDUAL
575
0
574
0
574
5
-15630 -15620 -15610
OBSERVED
4 Oct. 95 - 9 Oct. 97
5 km
-15630 -15620 -15610
SYNTHETIC
Best-fit source parameters:• Spherical point source (Mogi source)• The model source is located at a depth of 6.5 ± 0.2 km. • The calculated volume change of magma reservoir is 0.043 0.002 km3.
0 2.83 cm
13

Franz J Meyer, UAF
GEOS 657, Spring 2016 - 14
InSAR Coherence: A Phase Quality Descriptor
m5
m25
ERS resolution element
interferogram
InSAR
processor
receiver noise
temporal
changes of
surface
scattering
conditions
propagation
effects
processor errors
Coherence:• Quality measure describing
noise level of InSAR phase
Useful for:• How accurate is a
topography or deformation
estimate from InSAR
• Contributions to Phase Noise:

L-band (𝝀 = 𝟐𝟓𝒄𝒎): Higher coherenceC-band (𝝀 = 𝟓. 𝟔𝒄𝒎): Lower coherence
Wavelength Vs. Coherence
15

Franz J Meyer, UAF
GEOS 657, Spring 2016 - 16
AN EXAMPLE OF THE USE OF INSAR IN GEOPHYSICS
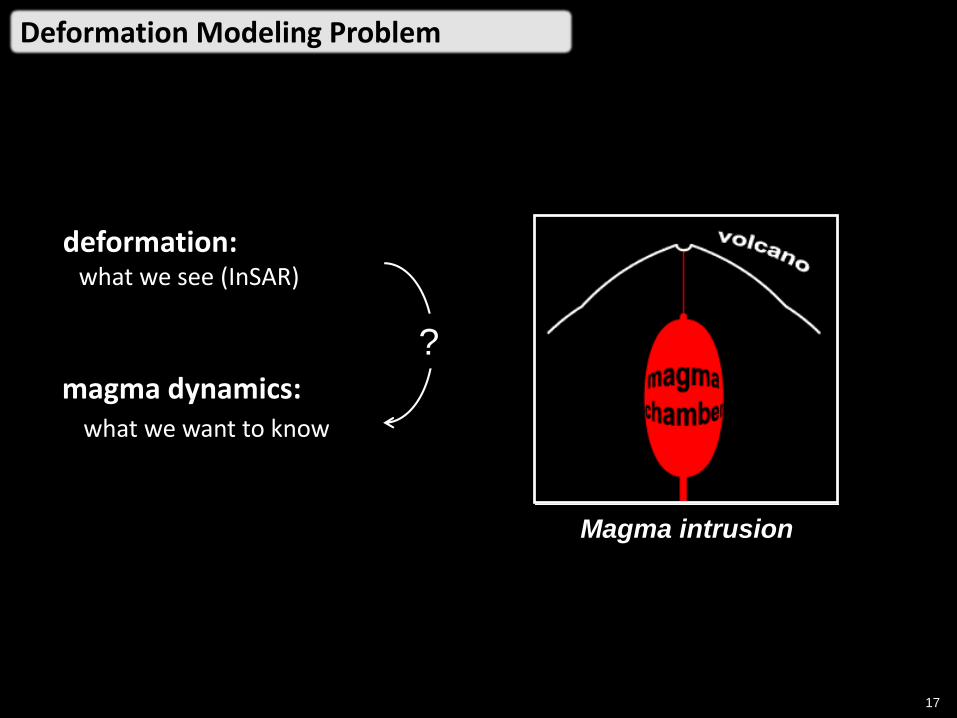
Deformation Modeling Problem
17
Magma intrusion
deformation: what we see (InSAR)
magma dynamics: what we want to know
?

Deformation Modeling Problem
18
Estimate source characteristics from InSAR deformation data
up
s
forward model
InSAR image
displacement
(vector)source
parameters
G s = d
design matrix
inverse
model
s = G dinv

Franz J Meyer, UAF
GEOS 657, Spring 2016 - 19
Solving for Model Parameters using Model Inversion
𝐺 ∙ 𝑥 = 𝑏
• If the covariance matrix for errors in the observation (𝑏) is Σ𝑏, then the weighted least-squares (maximum likelihood) solution for 𝑥 is
ො𝑥 = 𝐺𝑇 ∙ Σ𝑏−1 ∙ 𝐺
−1∙ 𝐺𝑇 ∙ Σ𝑏
−1 ∙ 𝑏
and the covariance matrix for the estimated vector components is
Σ𝑥 = 𝐺𝑇 ∙ Σ𝑏−1 ∙ 𝐺
−1
• In the case where we assume that observation errors are independent and have equal standard deviations, 𝜎, we get
Σ𝑥 = 𝜎2 𝐺𝑇 ∙ 𝐺 −1
– The square roots of the diagonal terms of Σ𝑥 are the standard errors of the estimated parameters

What is the Forward Model in Volcano Deformation?
20
Predicts deformation (u) caused by magma intrusion(relates magma intrusion to deformation)
z
magma
intrusion
displacement
x
2 ui + = – Fi
2uk
(1-2) xi yk
elasto-static behavior
u = ƒ(model parameters)

Franz J Meyer, UAF
GEOS 657, Spring 2016 - 21
What Is the Forward Model?Simple Model: Inflating Point Source Model
• A component of deformation vector (𝑢𝑖) and the displacement at the free surface (𝑥3 = 0) takes the form
𝑢𝑖 𝑥1 − 𝒙𝟏′ , 𝑥2 − 𝒙𝟐
′ , −𝒙𝟑′ = 𝑪
𝑥𝑖 − 𝒙𝒊′
𝑅3
– 𝒙𝒊′ is a source location, 𝑪 is a combination of material properties and source strength, and 𝑅 is
the distance from the source to the surface location
• 𝑪 is defined as follows:
𝑪 = ∆𝑃 1 − 𝜈𝑟𝑠3
𝐺= 𝜟𝑽
1 − 𝜈
𝜋
– ∆𝑃 - change in pressure of magma chamber
– 𝛥𝑉 - change in volume of magma chamber
– 𝜈 - Poisson’s ratio
– 𝑟𝑠 - radius of the sphere
– 𝐺 - shear modulus of country rock
Unknown (target) parameters marked in red

Franz J Meyer, UAF
GEOS 657, Spring 2016 - 22
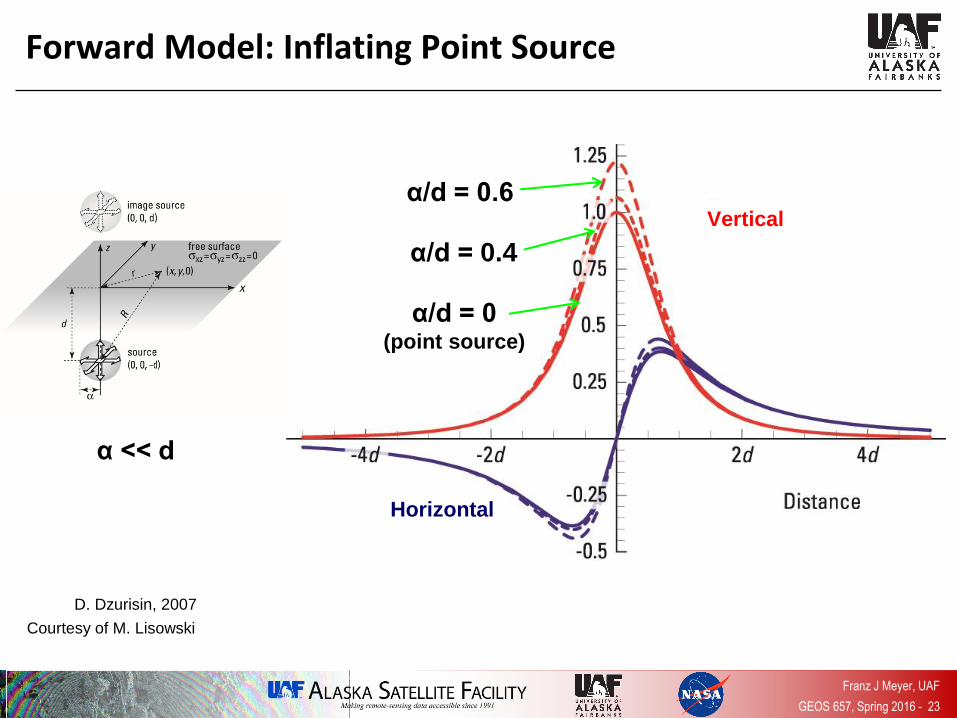
Forward Model: Inflating Point Source
Courtesy of M. Lisowski
α << d
D. Dzurisin, 2007
Franz J Meyer, UAF
GEOS 657, Spring 2016 - 23
Forward Model: Inflating Point Source
Courtesy of M. Lisowski
α << d
D. Dzurisin, 2007
Horizontal
Vertical
α/d = 0.4
α/d = 0.6
α/d = 0 (point source)
Franz J Meyer, UAF
GEOS 657, Spring 2016 - 24
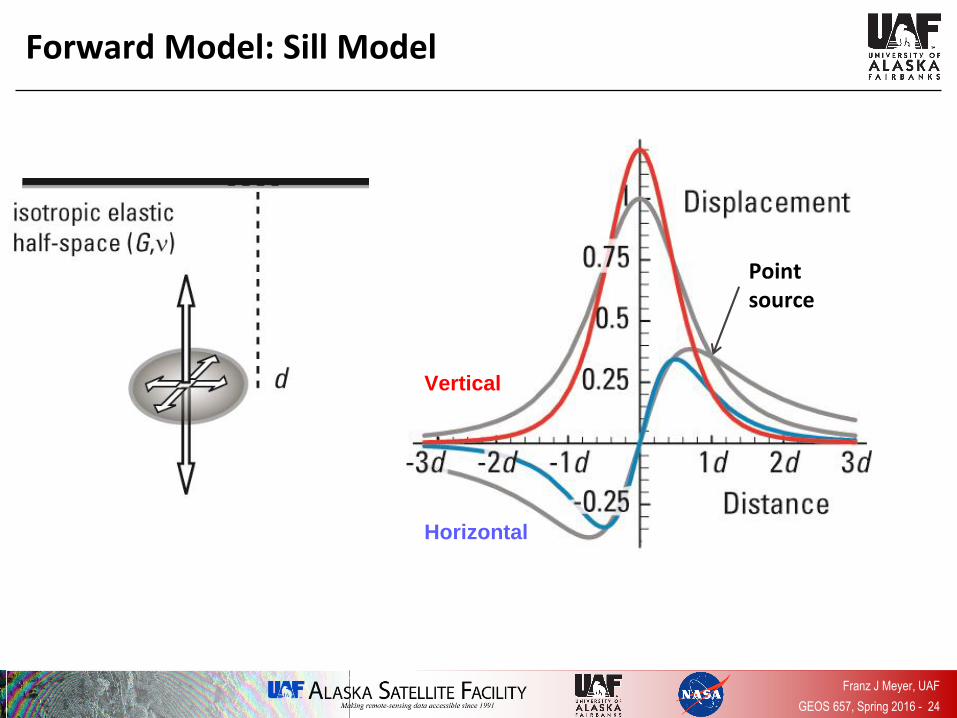
Forward Model: Sill Model
Horizontal
Vertical
Point source
Franz J Meyer, UAF
GEOS 657, Spring 2016 - 25
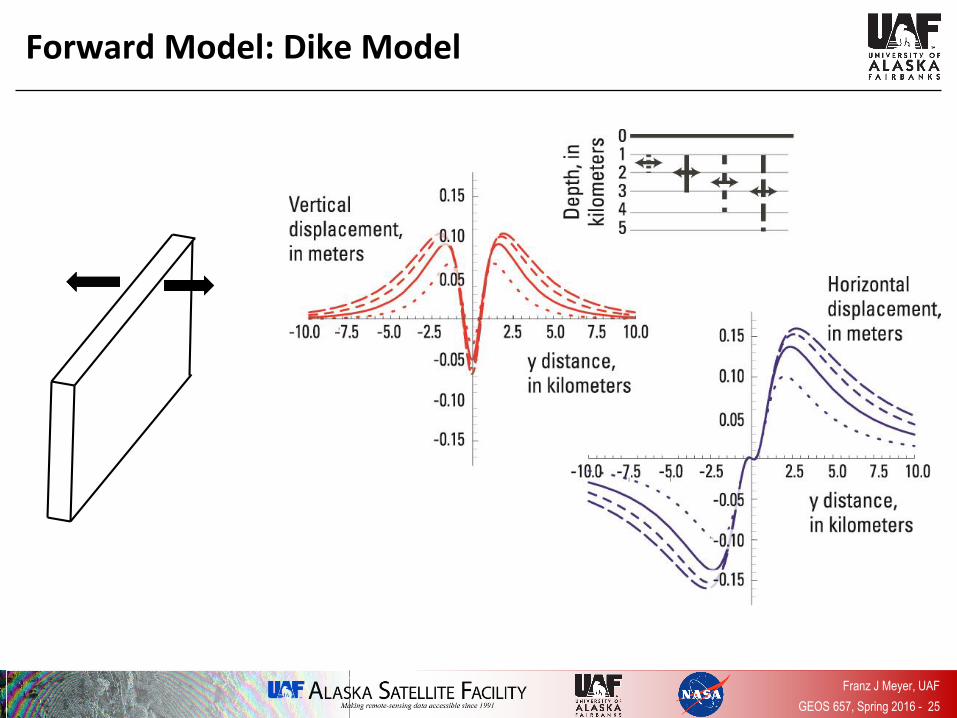
Forward Model: Dike Model
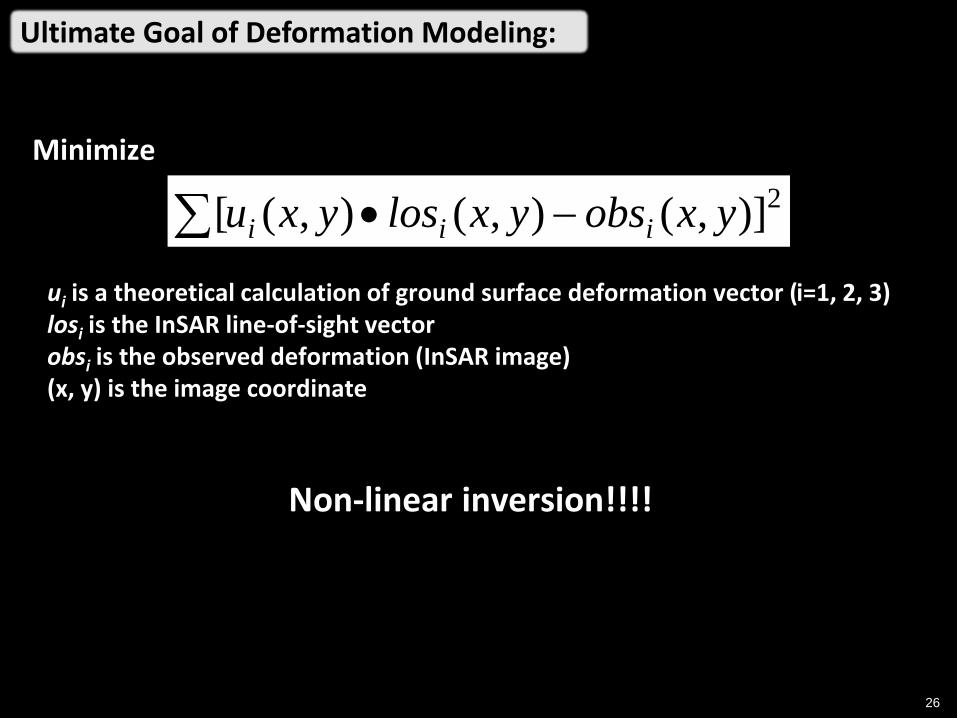
Ultimate Goal of Deformation Modeling:
26
Minimize
2)],(),(),([ yxobsyxlosyxu iii
ui is a theoretical calculation of ground surface deformation vector (i=1, 2, 3)losi is the InSAR line-of-sight vectorobsi is the observed deformation (InSAR image)(x, y) is the image coordinate
Non-linear inversion!!!!

Find the best-fitting Model ParametersA Simple Approach
27
1. Loop through model parameters
2. calculate the residual (observed – modeled) for each set of model parameters
3. Find the set of model parameters that renders the smallest residual
best-fitting model parameters

A Matlab Lab for Estimating Source Parameters
28
xy_gridsearch.m
• defines search space for source model location – Source Depth and volume change
is fixed for this experiment
• For each set of x and y coordinate parameters:
– Run forward model to produce predicted surface deformation result [mogi2InSAR.m]
– Calculate difference (residuals) between predicted and measured deformation
• Best fitting model parameters are those that minimize residuals
Z (depth)
v (volume change)

Mt. Peulik Example
29
Best-fit source parameters:
• The model source is located at a depth of 6.5 ± 0.2 km.
• The calculated volume change of magma reservoir is 0.043 0.002 km3.
-15630 -15620 -15610
RESIDUAL
575
0
574
0
574
5
-15630 -15620 -15610
OBSERVED
5 km
-15630 -15620 -15610
SYNTHETIC
0 2.83 cm
VR
xxvxxxxu ii
i
32211
)1()0,,(
where x1, x2 , and x3 are horizontal locations and depth of the center of the sphere, R is the distance
between the sphere and the location of observation (x1, x2 , and 0), and v is the Poisson’s ratio of host rock.
Spherical point source (Mogi source)
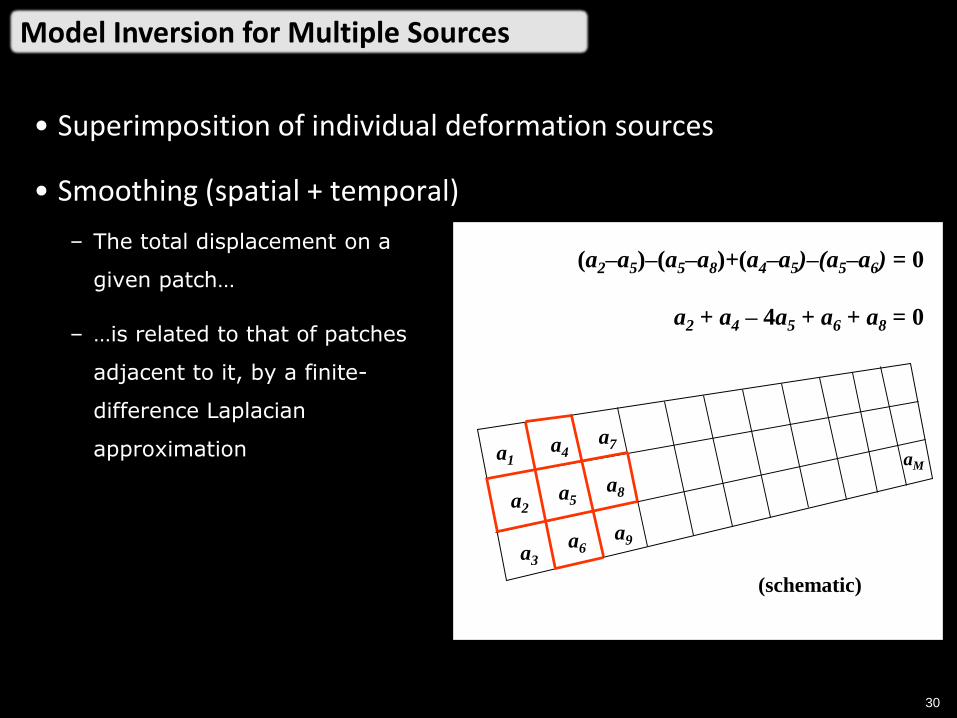
Model Inversion for Multiple Sources
30
• Superimposition of individual deformation sources
• Smoothing (spatial + temporal)
– The total displacement on a
given patch…
– …is related to that of patches
adjacent to it, by a finite-
difference Laplacian
approximation
(schematic)
a1
a2
a3
a4
a5
a6
a7
a8
a9
aM
(a2–a5)–(a5–a8)+(a4–a5)–(a5–a6) = 0
a2 + a4 – 4a5 + a6 + a8 = 0
31
Example: Earthquake Modeling

32
Afar –triple junction

33
Smith and Cann, JGR, 2000
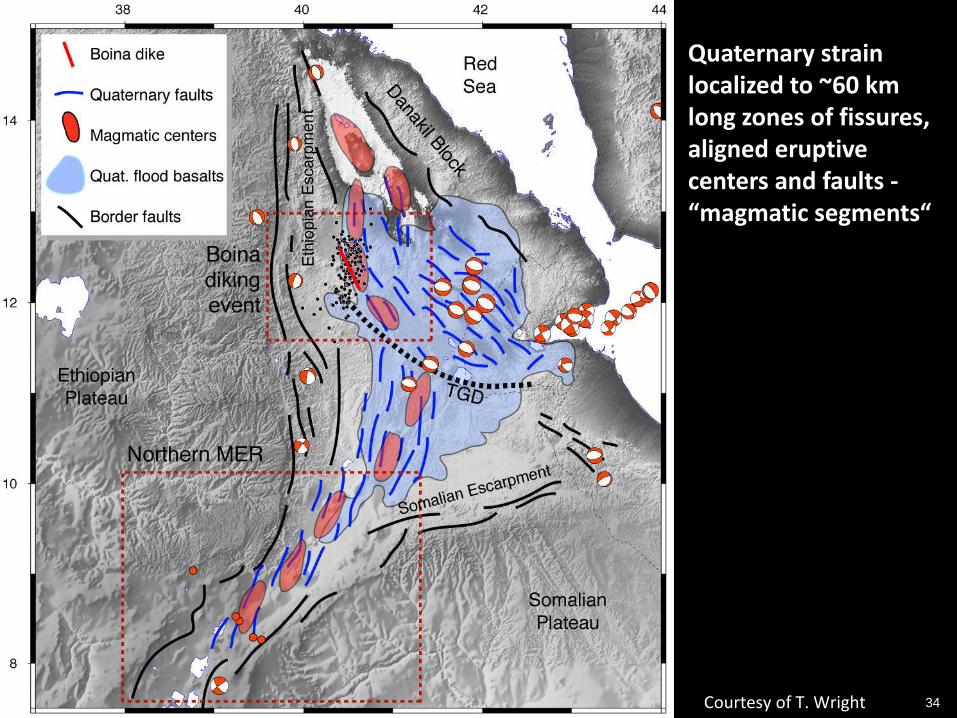
34
Quaternary strain localized to ~60 km long zones of fissures, aligned eruptive centers and faults -“magmatic segments“
Courtesy of T. Wright

35Courtesy of T. Wright
14/9/2005 to11/05/2005
163 earthquakes (mb<6) detected by NEIC.
Relocated by Anna Stork

Franz J Meyer, UAF
GEOS 657, Spring 2016 - 3636

3D displacements measured from radar data
37
Deflating
Magma
ChambersDeflating
Magma
Chambers
Collapsed
Zone
along Rift
Collapsed Zone
along Rift
Map view
Cross section

Deformation Modelling
38
• 2.2 km3 magma intruded along dyke (Mt St Helens 1980 1.2 km3)
• 0.5 km3 sourced from Dabbahu and Gabho volcanoes at North.
• Earthquakes can be responsible for < 10 % of moment release.
Wright et al., Nature, 2005

Franz J Meyer, UAF
GEOS 657, Spring 2016 - 39
What’s Next?
• This is what awaits next:
– Thursday : Lab on InSAR Processing Using the SNAP Toolbox
– Next week Tuesday: Project Concept Presentations
Top Related